
Challenges Using Droplet Digital PCR for Environmental Samples
by

Vasilis Kokkoris
1,2,3,*, 
Eric Vukicevich
1,
Andrew Richards
1, 
Corrina Thomsen
1 and
Miranda M. Hart
1 1
Department of Biology, Okanagan Campus, University of British Columbia, 3333 University Way, Kelowna, BC V1V 1V7, Canada
2
Department of Biology, University of Ottawa, Marie-Curie Private, Ottawa, ON K1N 9A7, Canada
3
Agriculture and Agri-Food Canada, Ottawa Research and Development Centre, Ottawa, ON K1A 0C6, Canada
*
Author to whom correspondence should be addressed.
Appl. Microbiol. 2021, 1(1), 74-88; https://0-doi-org.brum.beds.ac.uk/10.3390/applmicrobiol1010007
Submission received: 10 April 2021
/
Revised: 17 May 2021
/
Accepted: 18 May 2021
/
Published: 21 May 2021
Abstract
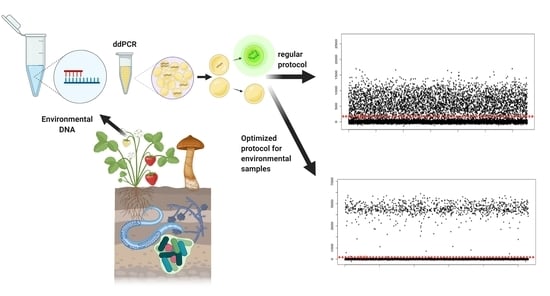
:Droplet digital polymerase chain reaction (ddPCR) is a method used to detect and quantify nucleic acids even when present in exceptionally low numbers. While it has proven to be valuable for clinical studies, it has failed to be widely adopted for environmental studies but despite some limitations, ddPCR may represent a better option than classical qPCR for environmental samples. Due to the complexity of the chemical and biological composition of environmental samples, protocols tailored to clinical studies are not appropriate, and results are difficult to interpret. We used environmental DNA samples originating from field studies to determine a protocol for environmental samples. Samples included field soils which had been inoculated with the soil fungus Rhizophagus irregularis (environmental positive control), field soils that had not been inoculated and the targeted fungus was not naturally present (environmental negative control), and root samples from both field categories. To control for the effect of soil inhibitors, we also included DNA samples of an organismal control extracted from pure fungal spores (organismal positive control). Finally, we included a no-template control consisting only of the PCR reaction reagents and nuclease free water instead of template DNA. Using original data, we examined which factors contribute to poor resolution in root and soil samples and propose best practices to ensure accuracy and repeatability. Furthermore, we evaluated manual and automatic threshold determination methods and we propose a novel protocol based on multiple controls that is more appropriate for environmental samples.
1. Introduction
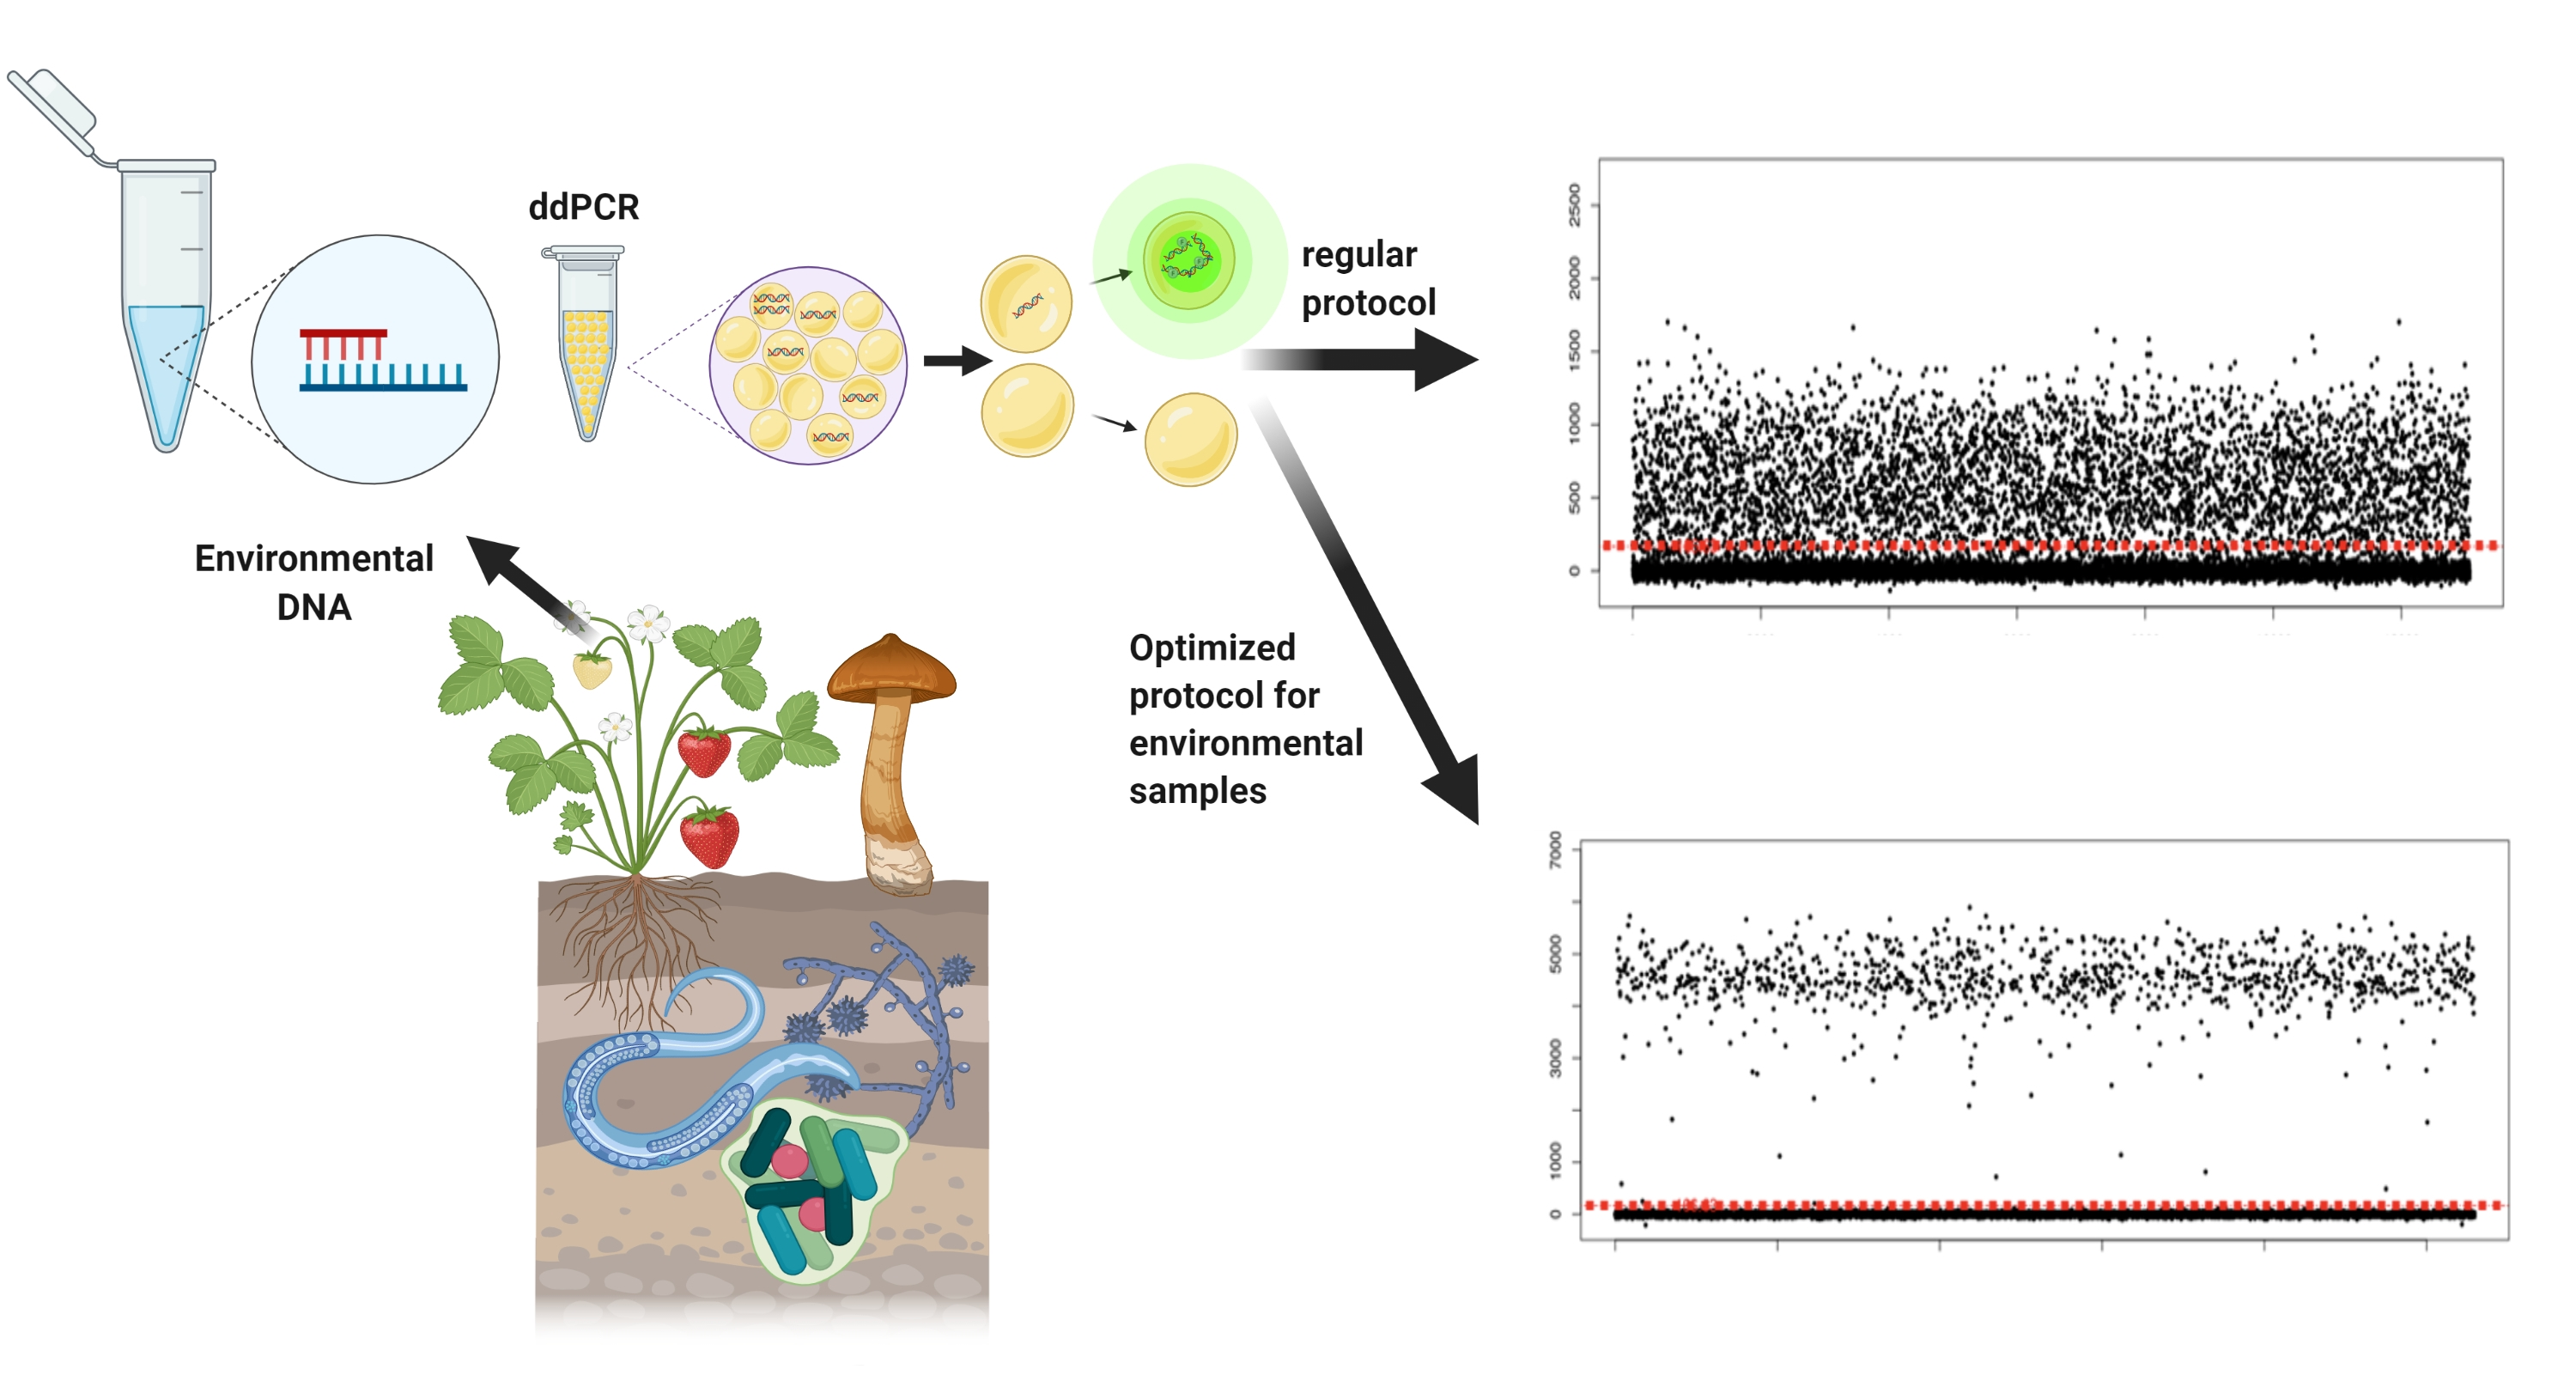
Droplet digital polymerase chain reaction (ddPCR) allows for the quantification of nucleic acid sequences by partitioning single samples into thousands of nanoliter droplets (~20,000), each containing either single copy or a few copies of the target, or no initial target sequences [1]. Partitioning of PCR samples creates a sensitive amplification protocol that is less likely to be affected by inhibitors and non-target DNA [2,3]. As a result, it is becoming the approach of choice for assays looking to detect low copy targets; for example, deleterious alleles in early-stage cancer patients [4,5], introduced genes in genetically modified organisms [6,7], and as a proxy for the abundance of pathogens in environmental samples [8,9]. An advantage of ddPCR is that amplified droplets that can contain as little as a single copy of the target sequence, increasing the possibility to quantify rare sequence variants [1] compared with approaches such as quantitative PCR (qPCR) (Figure 1).
The application of ddPCR to environmental studies has lagged behind its clinical use, both due to the cost compared to qPCR (up to three times more costly per sample [11]) but also, reports of poor resolution in environmental samples [2]. The chemical and biological complexity of environmental samples can make it difficult, even impossible, to discriminate among positive and negative reactions. In successful ddPCR assays, positive and negative droplets aggregate into respective “clouds” based on the intensity of the fluorescence when a fluorescent signal is emitted during the amplification of target DNA. In assays with mutually exclusive positive and negative clouds, the assignment of “positives” is straightforward. In reality, it can be difficult to achieve discrete clouds, particularly in environmental samples, which often exhibit droplets of intermediate fluorescence (for example [12,13]). These intermediate droplets are referred to as “rain” as they do not clearly affiliate with positive or negative clouds and it can represent a significant proportion of droplets in environmental samples.
There is no uniform cause, nor approach for dealing with “rain” as it may have different causes [14]. For example, droplet coagulation [13] or variation in droplet size could affect fluorescence [15]. Variation in target amplification efficiency may also arise through physical problems of template DNA [16] including fragmentation of DNA incurred during extraction or storage [17]. Degraded DNA from dead organisms may also contribute to midlevel amplification of droplets [18]. Intermediate fluorescence arising from assay conditions are more problematic for environmental assays because these reactions are likely to contain inhibitors (e.g., humic acids) [19], resulting in delayed or reduced amplification efficiency or “rain” [20]. While ddPCR is more robust than qPCR to these inhibitors because of sample partitioning and post-cycle data collection [21], inhibitors may still reduce amplification efficiency [22].
Here, we first outline the factors that contribute to ambiguous results that can occur in environmental samples along with practices that can reduce ambiguity, improving both accuracy and reproducibility. These are largely due to issues that prevent separation of droplets into groups containing target DNA or not (“clouds”) and result in intermediate levels of fluorescence (“rain”) that make defining thresholds difficult. Below, we use original work to illustrate how cycling conditions and threshold determination can significantly affect the quality of ddPCR assays for environmental samples. We then propose a novel protocol for applying ddPCR to terrestrial environmental samples.
2. Materials and Methods
To determine best practices for environmental samples, we conducted a series of experiments to test the effect of altering cycling conditions on the presence of “rain”. We used additional controls to help identify the conditions that best improve successful target amplification and reduce partial, non-target amplification. We also compared the available methods for determining thresholds, including manually determined threshold.
2.1. Hardware and Software
We used the QX100™ droplet digital PCR system (Bio-Rad Technologies, Inc, Mississauga, ON, Canada) for droplet production and analysis, following the manufacturer’s instructions. For PCR parameters optimization, we used the C1000 Touch Thermal Cycler (Bio-Rad Technologies, Inc, Mississauga, ON, Canada). Boxplots were produced using the package ggplot [23] in R studio (Version 1.0.136—© 2009–2016 RStudio, Boston, MA, USA). Optimization figures were produced using the QuantaSoft Analysis Pro (version 1.0.596, Bio-Rad Technologies, Inc, Mississauga, ON, Canada) software and further modified at Microsoft Word 2016 (Microsoft, Redmond, WA, USA) for label addition.
2.2. Origin of Environmental DNA Used to Optimize ddPCR
In order to optimize ddPCR for environmental samples, we used DNA samples associated with another field study (for details see [24]). In particular, we tested root and soils samples which were positive or negative for our target organism, the arbuscular mycorrhizal (AM) fungus Rhizoglomus irregularis Schenck and Smith (synonym Rhizophagus irregularis, Glomus intraradices) strain DAOM197198 [25]. Samples included field soils which had been inoculated (environmental positive control, n = 20), field soils that had not been inoculated, and field soil originated from natural ecosystems (Saskatchewan, Canada) where the targeted fungus was not naturally present (environmental negative control, n = 20), and root samples (from inoculated and non-inoculated Lens culinaris-common name lentils, belonging both to the environmental positive control and environmental negative control categories, n = 40) from both field categories. To control for the effect of soil inhibitors, we also included DNA samples of an organismal control extracted from pure spores of R. irregularis (organismal positive control, n = 3). The organismal positive control is used to demonstrate the optimal amplification of our target when not affected by inhibitors that are usually present in environmental samples and also serves as an indicator for the primers/probes functionality. Finally, we included a no-template control (n = 3) consisting only of the PCR reaction reagents and nuclease free water instead of template DNA.
2.3. DNA Extraction and Primers/Probe
In all cases DNA was extracted using the PowerSoil® DNA Isolation Kit (Qiagen, Germantown, MD, USA), following the manufacturer’s instructions. The primers and probes used are specific to R. irregulare strain DAOM197198 targeting the cox3-rnl intergenic mtDNA region and the sequences are:
- Forward: 5′- AGCAAATCTAAGTTCCTCAGAG -3′
- Reverse: 5′- ACTTCTATGGCTTTGTACAGG-3′
- Probe: FAM/CCCACCAGG/ZEN/GCAGATTAATCTTCCTT/3IABKFQ-3
- Standardized cycling conditions and ddPCR reaction mixture
The standardized cycling conditions based on the manufacturer’s recommendations are: 10 min at 95 °C for enzyme activation, followed by 40 cycles of 30 s at 94 °C and 1 min annealing/extension step at the appropriate temperature based on the primer/probe set (in our case at 59 °C). The final step is 10 min at 98 °C for enzyme deactivation followed by infinite hold at 4 °C. For each step, a ramp rate of 2 °C/sec is applied. Standard PCR mixture per sample based on the manufacturers recommendations are: 10 μL of 1× Supermix for Probes (Bio-Rad Technologies, Inc., Mississauga, ON, Canada), 1 μL of primers/probe mixture PrimeTime® Std qPCR Assay (Integrated DNA Technologies, Coralville, IA, USA) with a final concentration of 500 nM primers and 250 nM probe in the reaction, 7 μL of DNase free water, and 2 μL of sample DNA.
2.4. Parameters Tested
In a series of experiments using DNA from the field soils and plant roots, we manipulated thermocycler steps individually and combined, in order to examine the additive effect of altered cycling condition to the ddPCR optimization. We also examined the effect of primer/probe concertation and sample concentration in reaction optimization. For all reactions, along with organismal positive control and no-template controls, we examined the usability of an environmental positive and an environmental negative control on the reaction optimization and threshold determination.
Thermocycler conditions: It is unknown whether manipulating multiple cycling conditions simultaneously has an additive effect to the ddPCR optimization. For all reactions, the initial step consisted of 10 min at 95 °C for enzyme activation. Following enzyme activation, we manipulated annealing/extension temperature by applying a temperature gradient ranging from 57 °C to 67 °C (the temperature range depends on the primer/probe set and has to be adjusted accordingly). Furthermore, we examined the effect of number of PCR cycles with a minimum of 40 cycles (recommended by BioRad), up to a maximum of 45 cycles. We also examined the effect of time extension during denaturation (from 30 sec which is the recommended BioRad time to 1 min) and annealing/extension step (from 1 min which is the recommended BioRad time to 2 min). Finally, we manipulated the ramp rate and we examined differences between a ramp rate of 2 °C/sec (recommended by Bio-Rad Technologies, Inc, Mississauga, ON, Canada) and 1 °C/sec. The analysis was performed using all the available soil and root DNA samples.
2.4.1. Primer/Probe Concentration
We examined the effect of reduced primer/probe concentration, below the manufacturers recommended quantity, on the reaction’s efficiency. The PCR mixture for the ddPCR reaction per sample contained: 10 μL of 1X Supermix for Probes (Bio-Rad Technologies, Inc., Mississauga, ON, Canada), 1 μL primers/probe mixture (PrimeTime® Std qPCR Assay, Integrated DNA Technologies Coralville, IA, USA), 7 μL of DNase free water and 2 μL of DNA. We used three different primer/probe quantities: 20× (recommended concentration) that yields a final concentration of 500 nM primers and 250 nM probe, 10× (reduced concentration) that yields a final concentration of 250 nM primers and 125 nM probe, and finally, 1× (reduced concentration) that yields a final concentration of 50 nM primers and 25 nM probe. We used the organismal positive control to demonstrate the effect of primer concentration.
2.4.2. Sample DNA Concentration
We tested whether sample dilution (up to 100-time dilution) and spiking unknown environmental samples with known quantity of organismal DNA can facilitate the discrimination between true or false positive samples. For this purpose, we used unknown environmental samples that contained extreme amount of “rain” to the level that separation of negative and positive clouds was not possible. For this assay we used multiple field soil (n = 10) and root (n = 8) DNA sample with a heavy rain profile.
2.4.3. Automated Algorithm Comparison
First, to identify current threshold determination approaches for environmental studies using ddPCR, we searched Web of Science (Clarivate Analytics, Philadelphia, PA, USA). We identified 75 papers including applications in monitoring of invasive species [26,27], detection of microbes in soil, plant tissue and water [28,29,30,31] and testing food for contamination by microbes or non-declared species [32] (Table S1). The most common strategy for threshold assignment was the automatic threshold set by QuantaSoftTM the default software provided by BioRad Technologies, Inc. (2017) followed by manually set threshold, but for most of the studies without explained parameters, via the QuantaSoftTM software. Additional threshold determination approaches include the algorithms, Define The Rain, ddPCRquant, and Umbrella.
Define the Rain is a Java script that uses a k-nearest neighbor algorithm to define a distinct positive and negative cloud, separately, for a positive control sample and subsequently identify extreme values (droplets) that are outliers [33]. The two cut-off thresholds (positive and negative) are defined as three times the standard deviation of the mean droplet amplitude within each cluster. These thresholds are then applied to all samples and the outliers that fall between them are classified as “rain”. Final concentration is then calculated using a Poisson distribution of positive and negative droplets with intermediate “rain” removed. This algorithm has been shown to be a significant improvement in accuracy compared to the QuantaSoft® software, at least for copy number detection in clinical samples (Jones et al., 2014). Define The Rain base thresholds on a positive control derived from pure culture. Such controls may have tighter clustering and higher fluorescence of positive droplets, due to the absence of inhibitors that exist in environmental samples. This can increase the number of false positives, as significant quantities of true positive events were excluded when discarding “rain”, as per Define The Rain [33,34] or another algorithm [35]. An “environmental positive” or environmental sample spiked with target DNA may more accurately represent the distribution of positive and negative clouds in environmental samples and represent a better control.
ddPCRquant uses single thresholds defined by distribution of fluorescence amplitude of negative clouds in non-template controls (NTC) [13]. Originally proposed to define a global threshold of the mean fluorescence of three NTC plus six times their standard deviation, then improved upon this idea by incorporating extreme value theory to define positive droplets (the “extreme” events separate from a strong cloud of NTC droplets) [13]. Because ddPCRquant does not rely on positive controls and takes into consideration baseline fluorescence, ddPCRquant may be more robust for environmental samples. However, to date there are no published studies citing the use of ddPCRquant for analysis of environmental samples.
Umbrella is the newest alternative for threshold determination and does so by maximizing precision across an experiment [36]. Umbrella, an open-source R package, assumes that each sample follows a mixture model with two components representing a negative and positive cloud. It then uses Bayes’ theorem to determine the likelihood that each droplet belongs to one of two groups. This algorithm draws a threshold based on the distribution of all droplets in a given well with no assumptions about how an assay might affect droplet fluorescence. Samples without identifiable positive clouds will be returned with a high measure of uncertainty. Thus, this approach may be appropriate only for samples with clearly delineated clouds. There are no studies using ddPCR for environmental samples to date that cite the use of Umbrella.
We used information from six samples, one field soil environmental negative control, one organismal positive control, one field soil unknown environmental sample, and three non-template control samples (NTCs) (required for ddPCRquant analysis) to compare threshold determination of the following algorithms as opposed to a manually determined threshold.
Manual threshold: We used the QuantaSoft Analysis Pro (version 1.0.596) software in order to define the manual threshold. Briefly, manual threshold determination was calculated based on the NTCs, the organismal positive control and the environmental negative control.
QuantaSoft automatic threshold: We used the QuantaSoft Analysis Pro (version 1.0.596, Bio-Rad Technologies, Inc.) software in order to automatically determine the threshold using the automatic threshold determination for multiple well selection. ddPCRquant threshold: In order to determine the threshold using “ddPCRquant” we used the online available tool “http://statapps.ugent.be/dPCR/ddpcrquant/ (access date; 4 May 2020)” with the following parameters: Block size = 150, 10 repeats, 20 μL of volume MIX, 1 μL of template volume, threshold determination. “Umbrella” threshold: We were unable to use the “Umbrella” algorithm since we could not locate the open-source code for R which was not yet available. “Define The Rain” threshold: We used the online available tool http://definetherain.org.uk/ (access date; 4 May 2020) and the automatic threshold determination after uploading the sample information.
3. Results
The results are presented as QuantaSoft software output figures, since this is the only available software coupled to the ddPCR system and it is the first exposure to data produced by ddPCR. To facilitate interpretation of the figures we created an explanatory model figure (Figure S1). Also note that the figures presented in this study aim to illustrate the effectiveness of the optimization step on example environmental samples that contain a significant amount of rain and do not demonstrate conclusive tests.
3.1. Optimizing Cycling Conditions
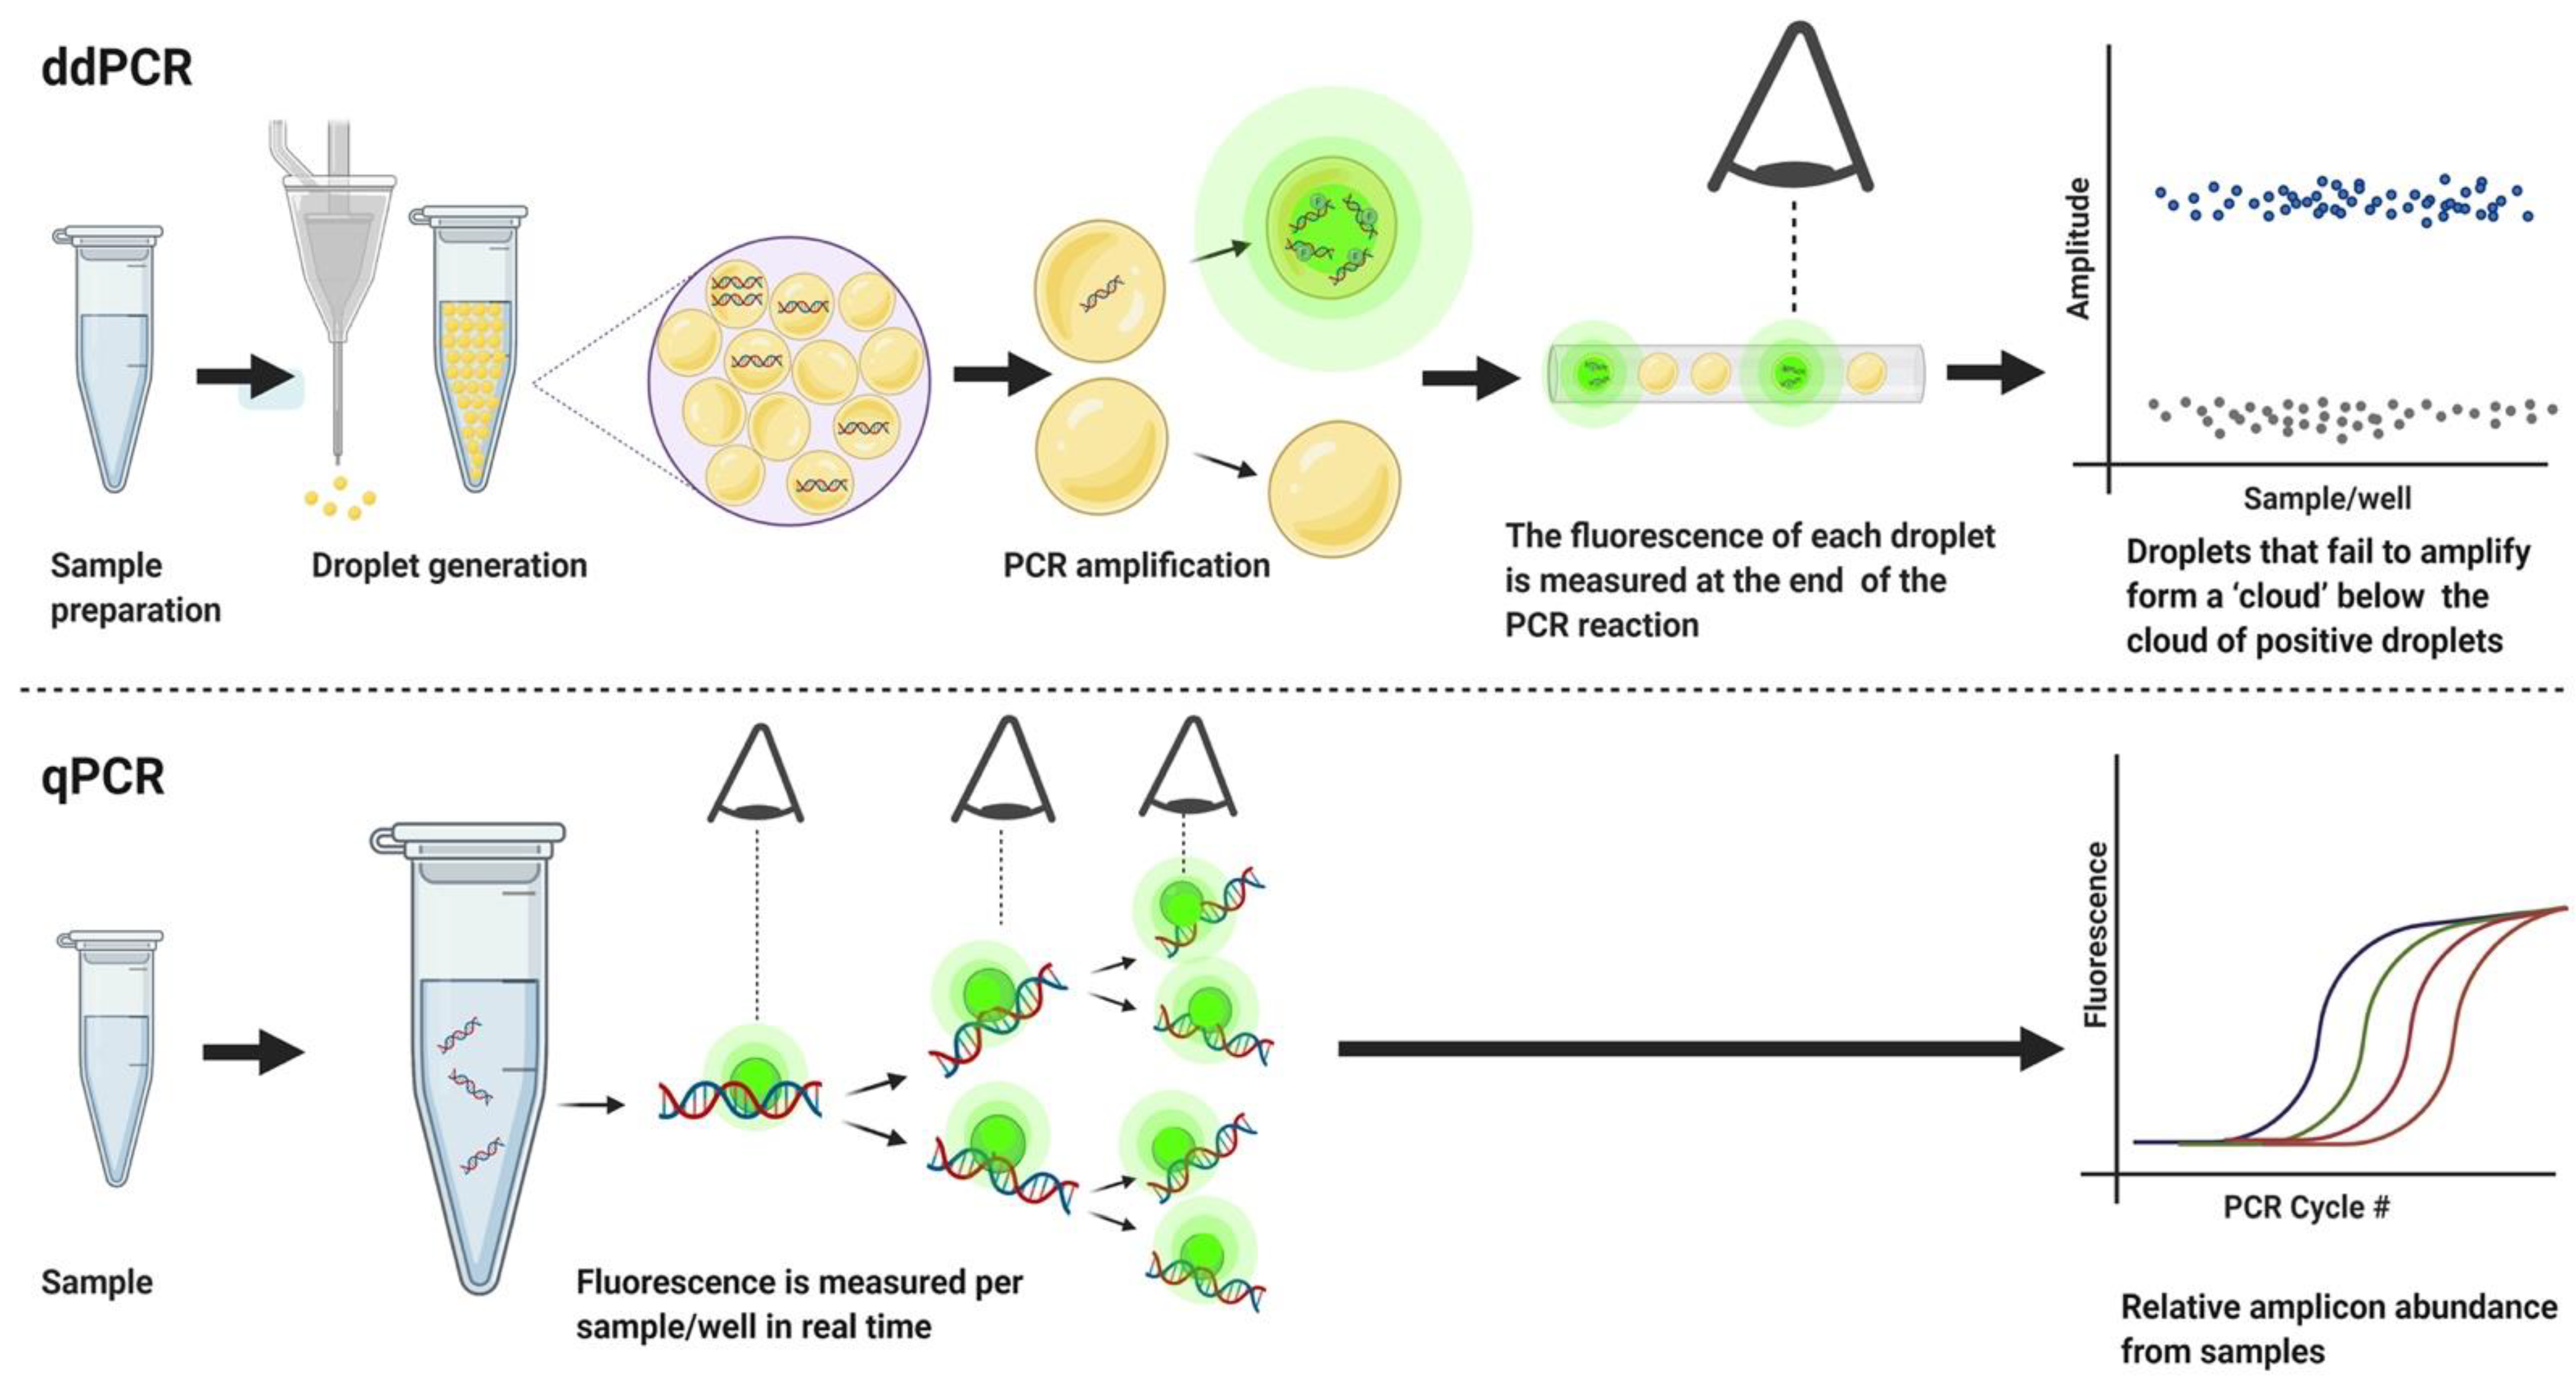
We summarize the parameters optimized for the following analyses in Table 1. The optimized protocol increased amplitude levels and cloud clustering efficiency (Figure 2). After full optimization, the resolution between the clouds is increased and clouds become more tightly clustered. Also, the “rain” decreased from 2394 droplets to 254 droplets in the optimized protocol.
3.2. Optimizing Annealing/Extension Temperature
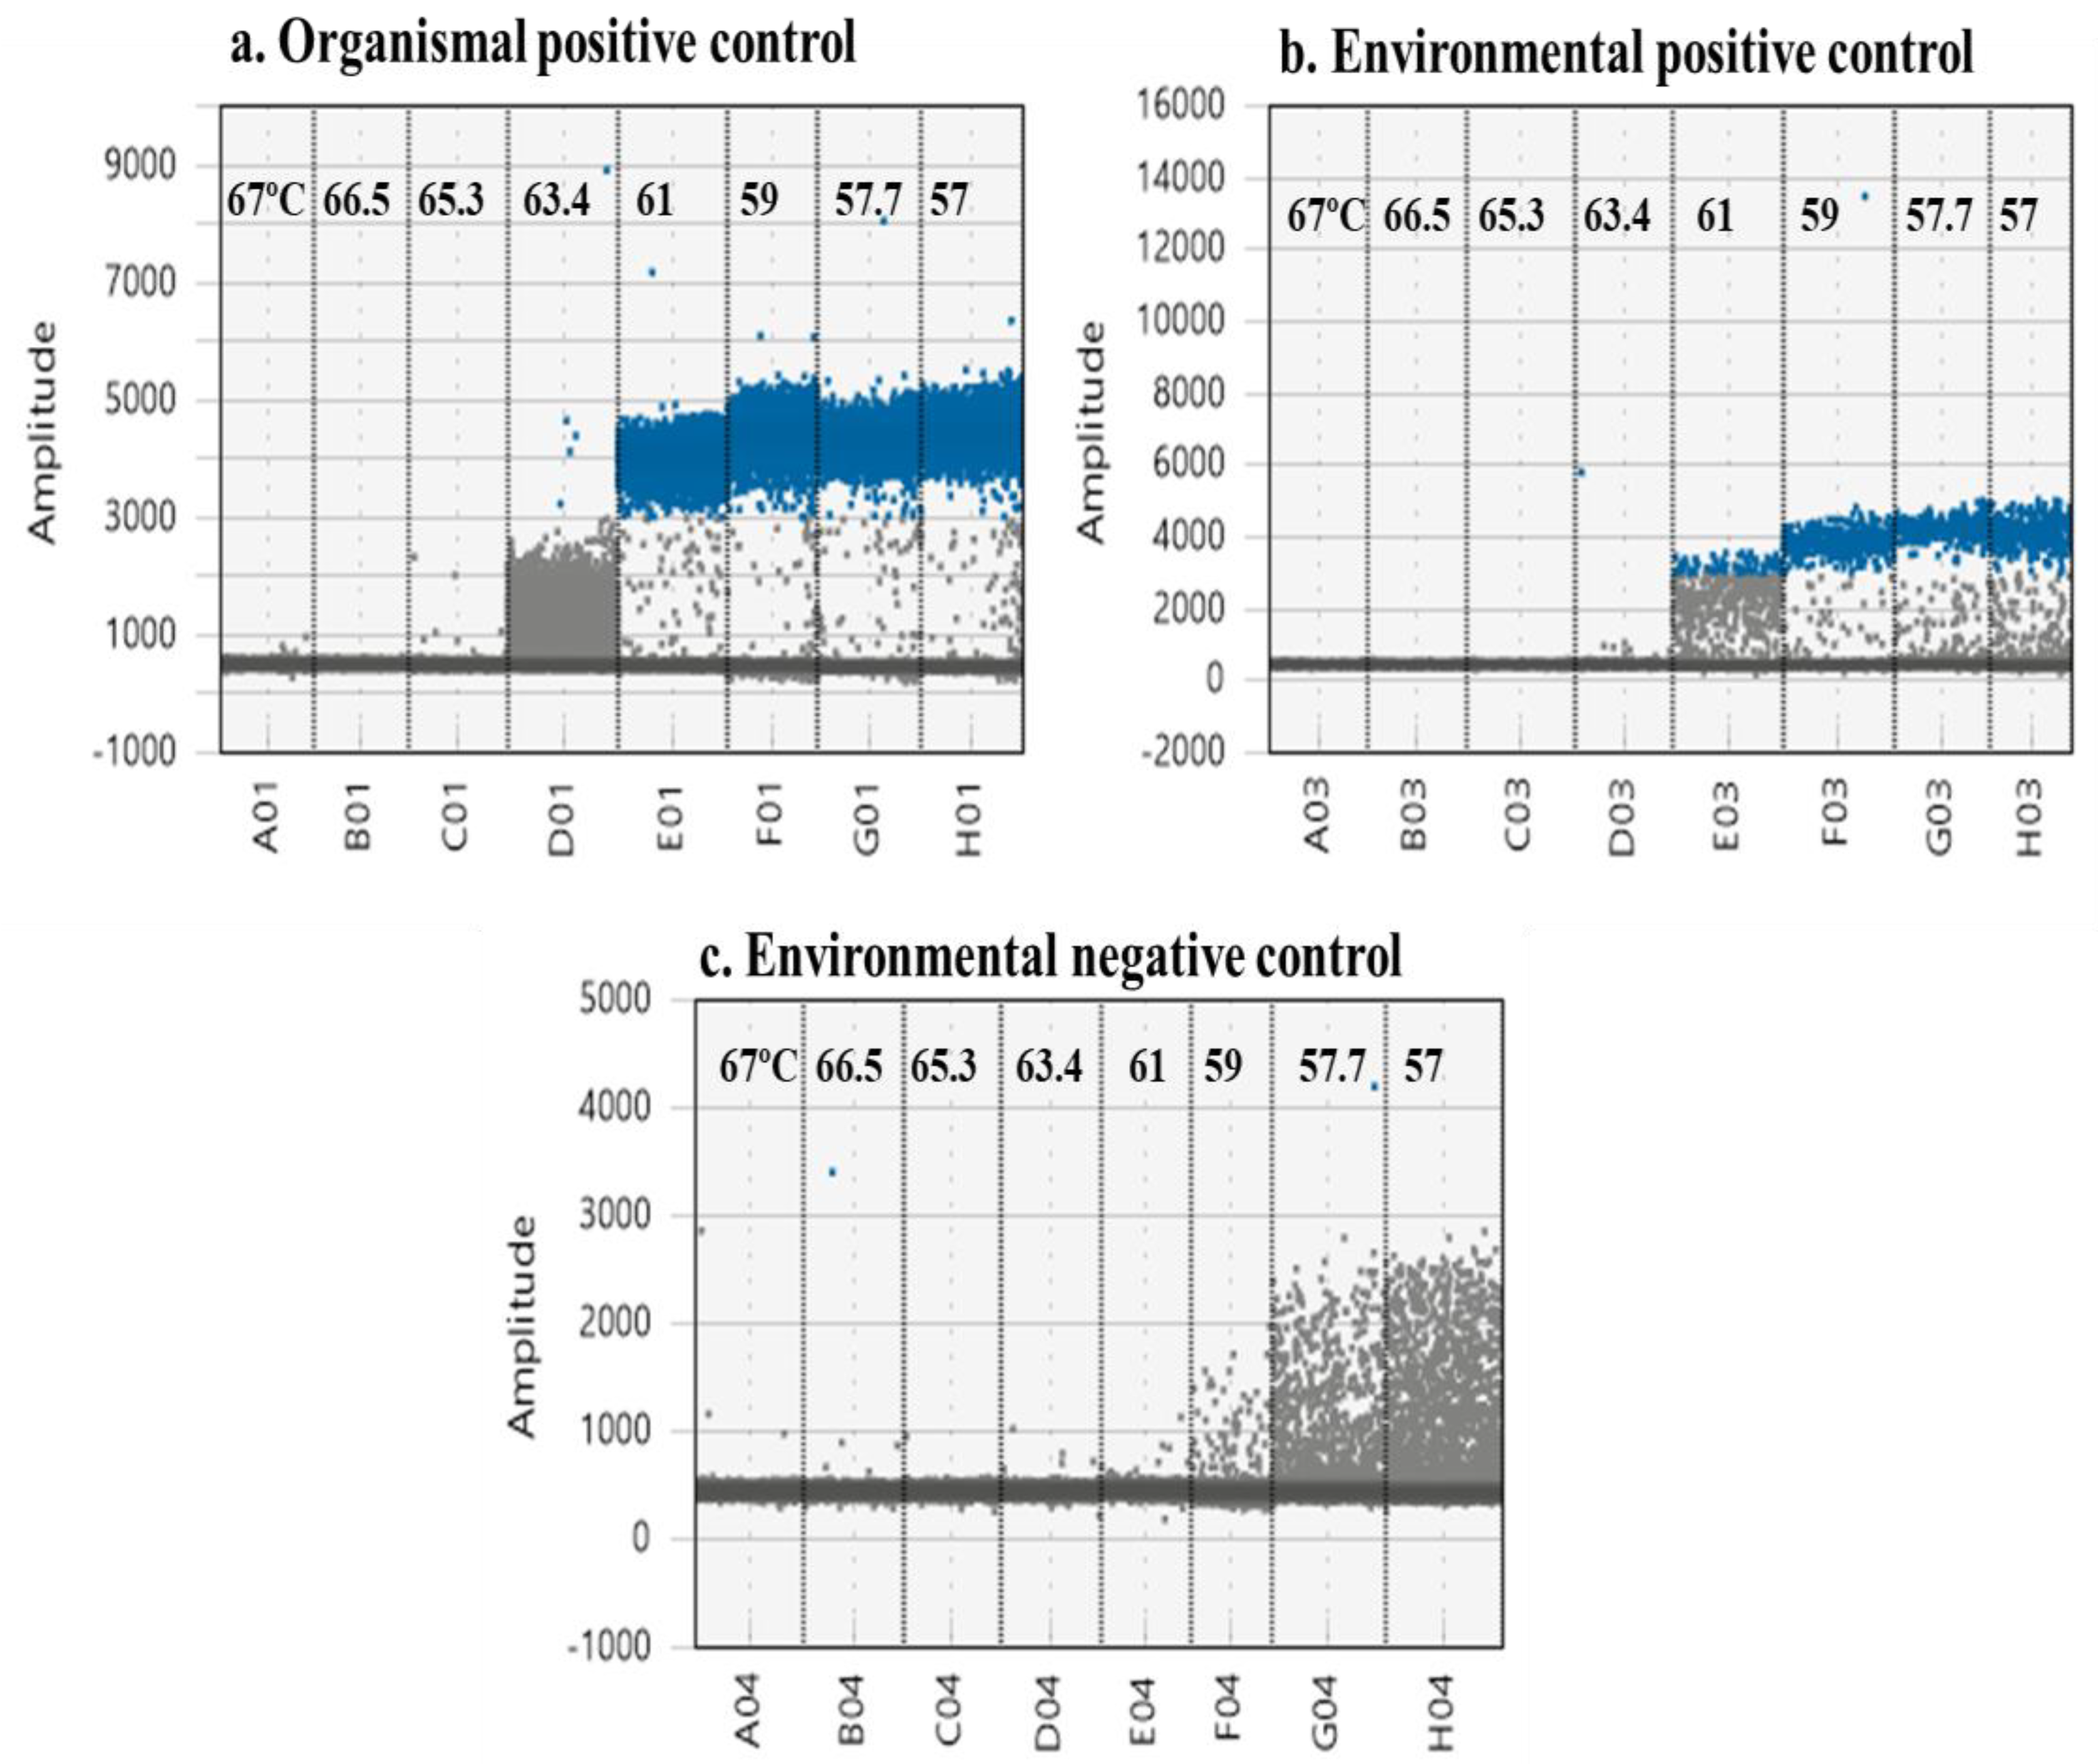
Multiple controls are required to determine optimum annealing and extension temperature (Figure 3). Using only organismal (a) and environmental (b) positive controls suggests an optimum annealing temperature between 57 and 59 °C to maximize separation of the clouds and minimize “rain” (Figure 3). However, this is not true for environmental negative controls (c). Here, 59 °C significantly decreased non-specific amplification, limiting the possibility for false positives. Although 61 °C almost eliminates rain, it is not optimal for the environmental positive control (Figure 3b).
3.3. Adjusting Primer/Probe Concentration
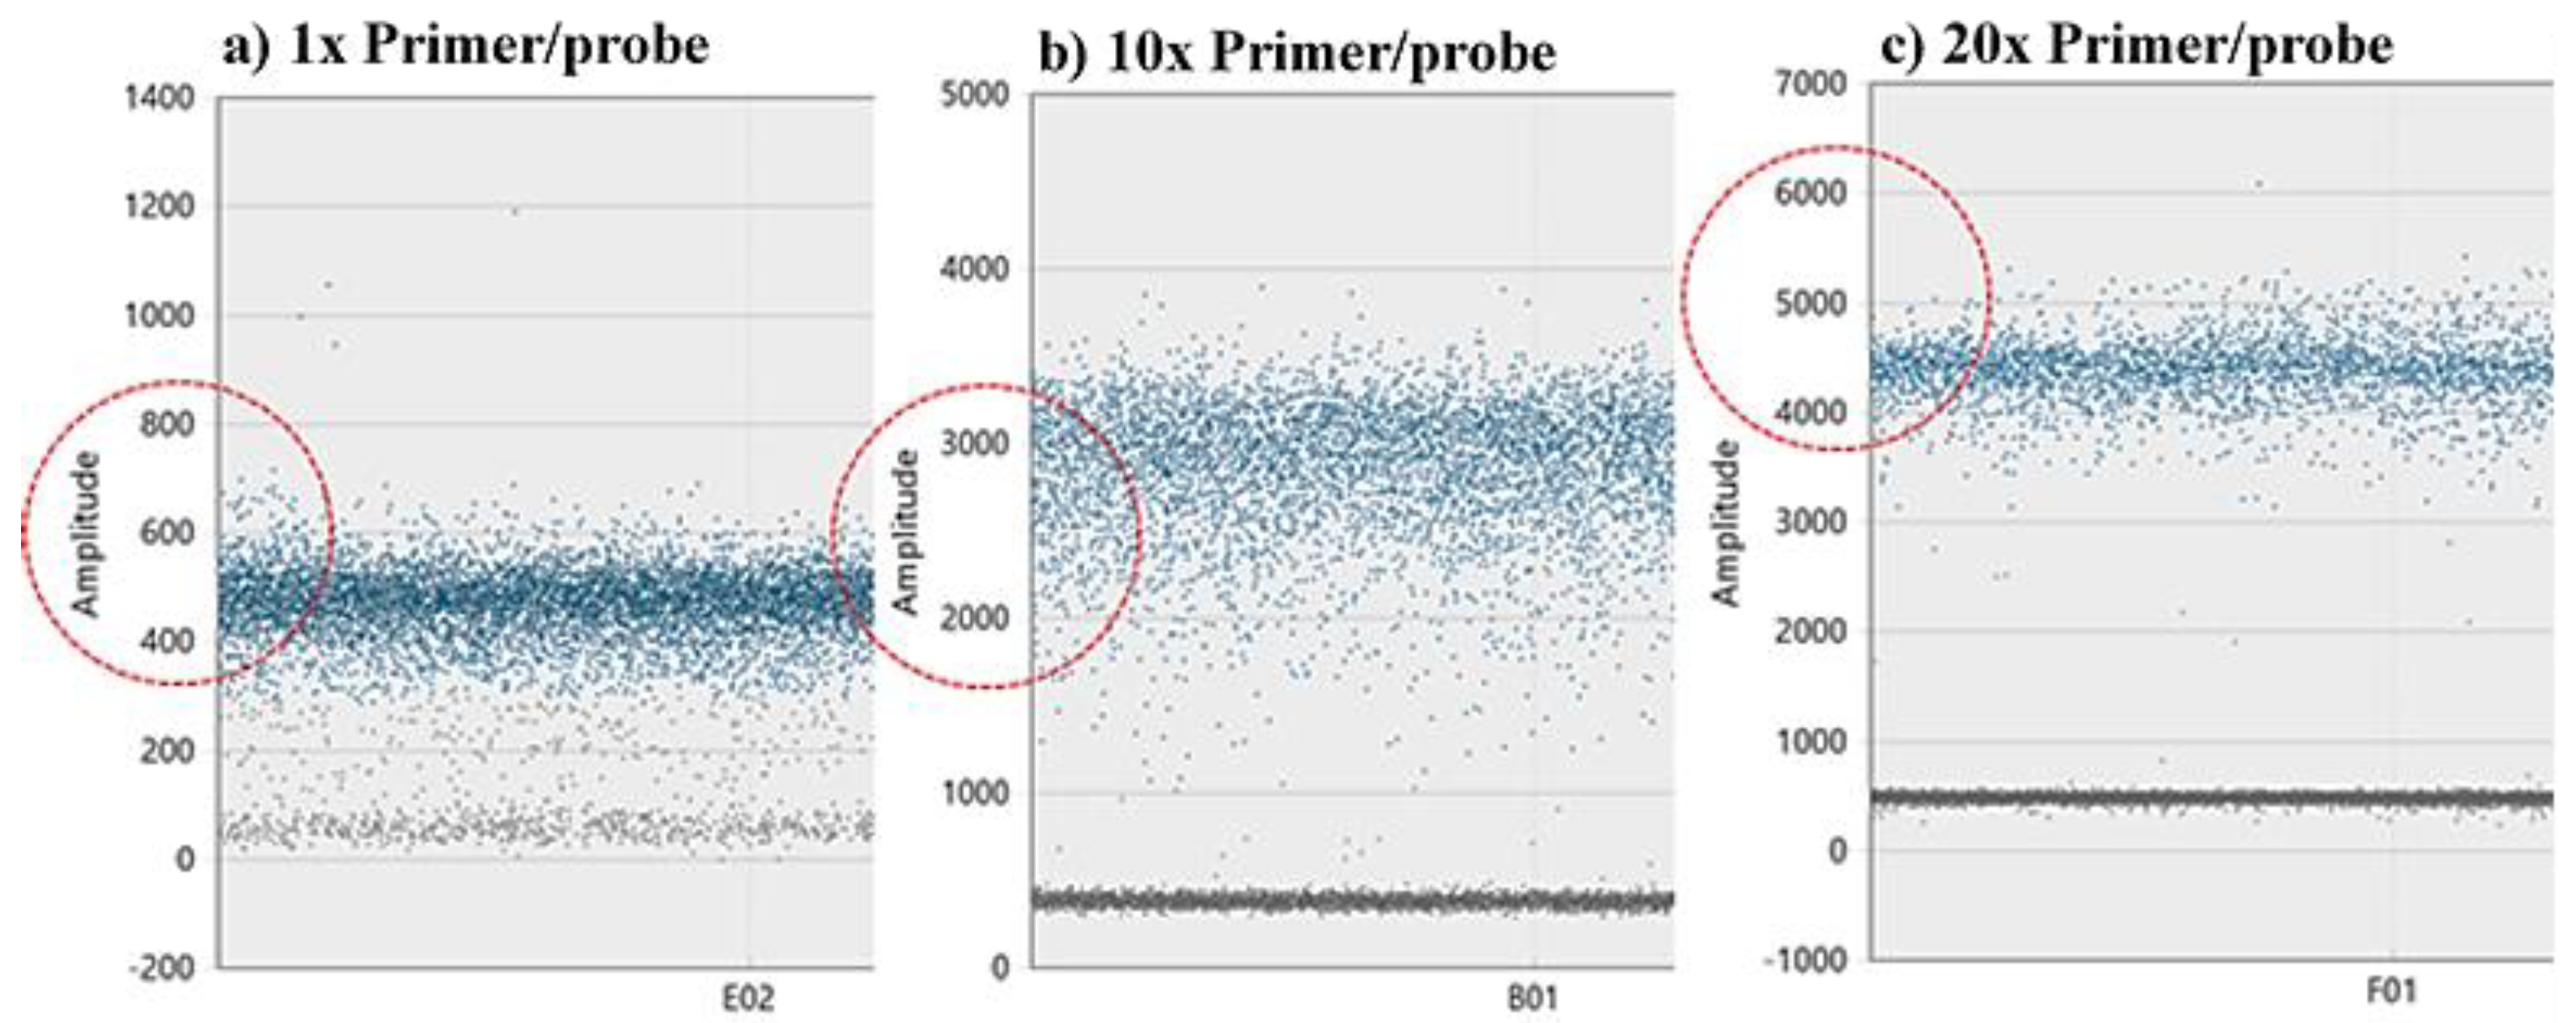
Higher primer concentration improves resolution and cloud clustering (Figure 4). The recommended 20× primer and probe concentration provides adequate cloud separation and proper amplitude levels. Reducing the primer concentration beyond the recommended by BioRad concentrations should be avoided.
3.4. Adjusting Sample Concentration
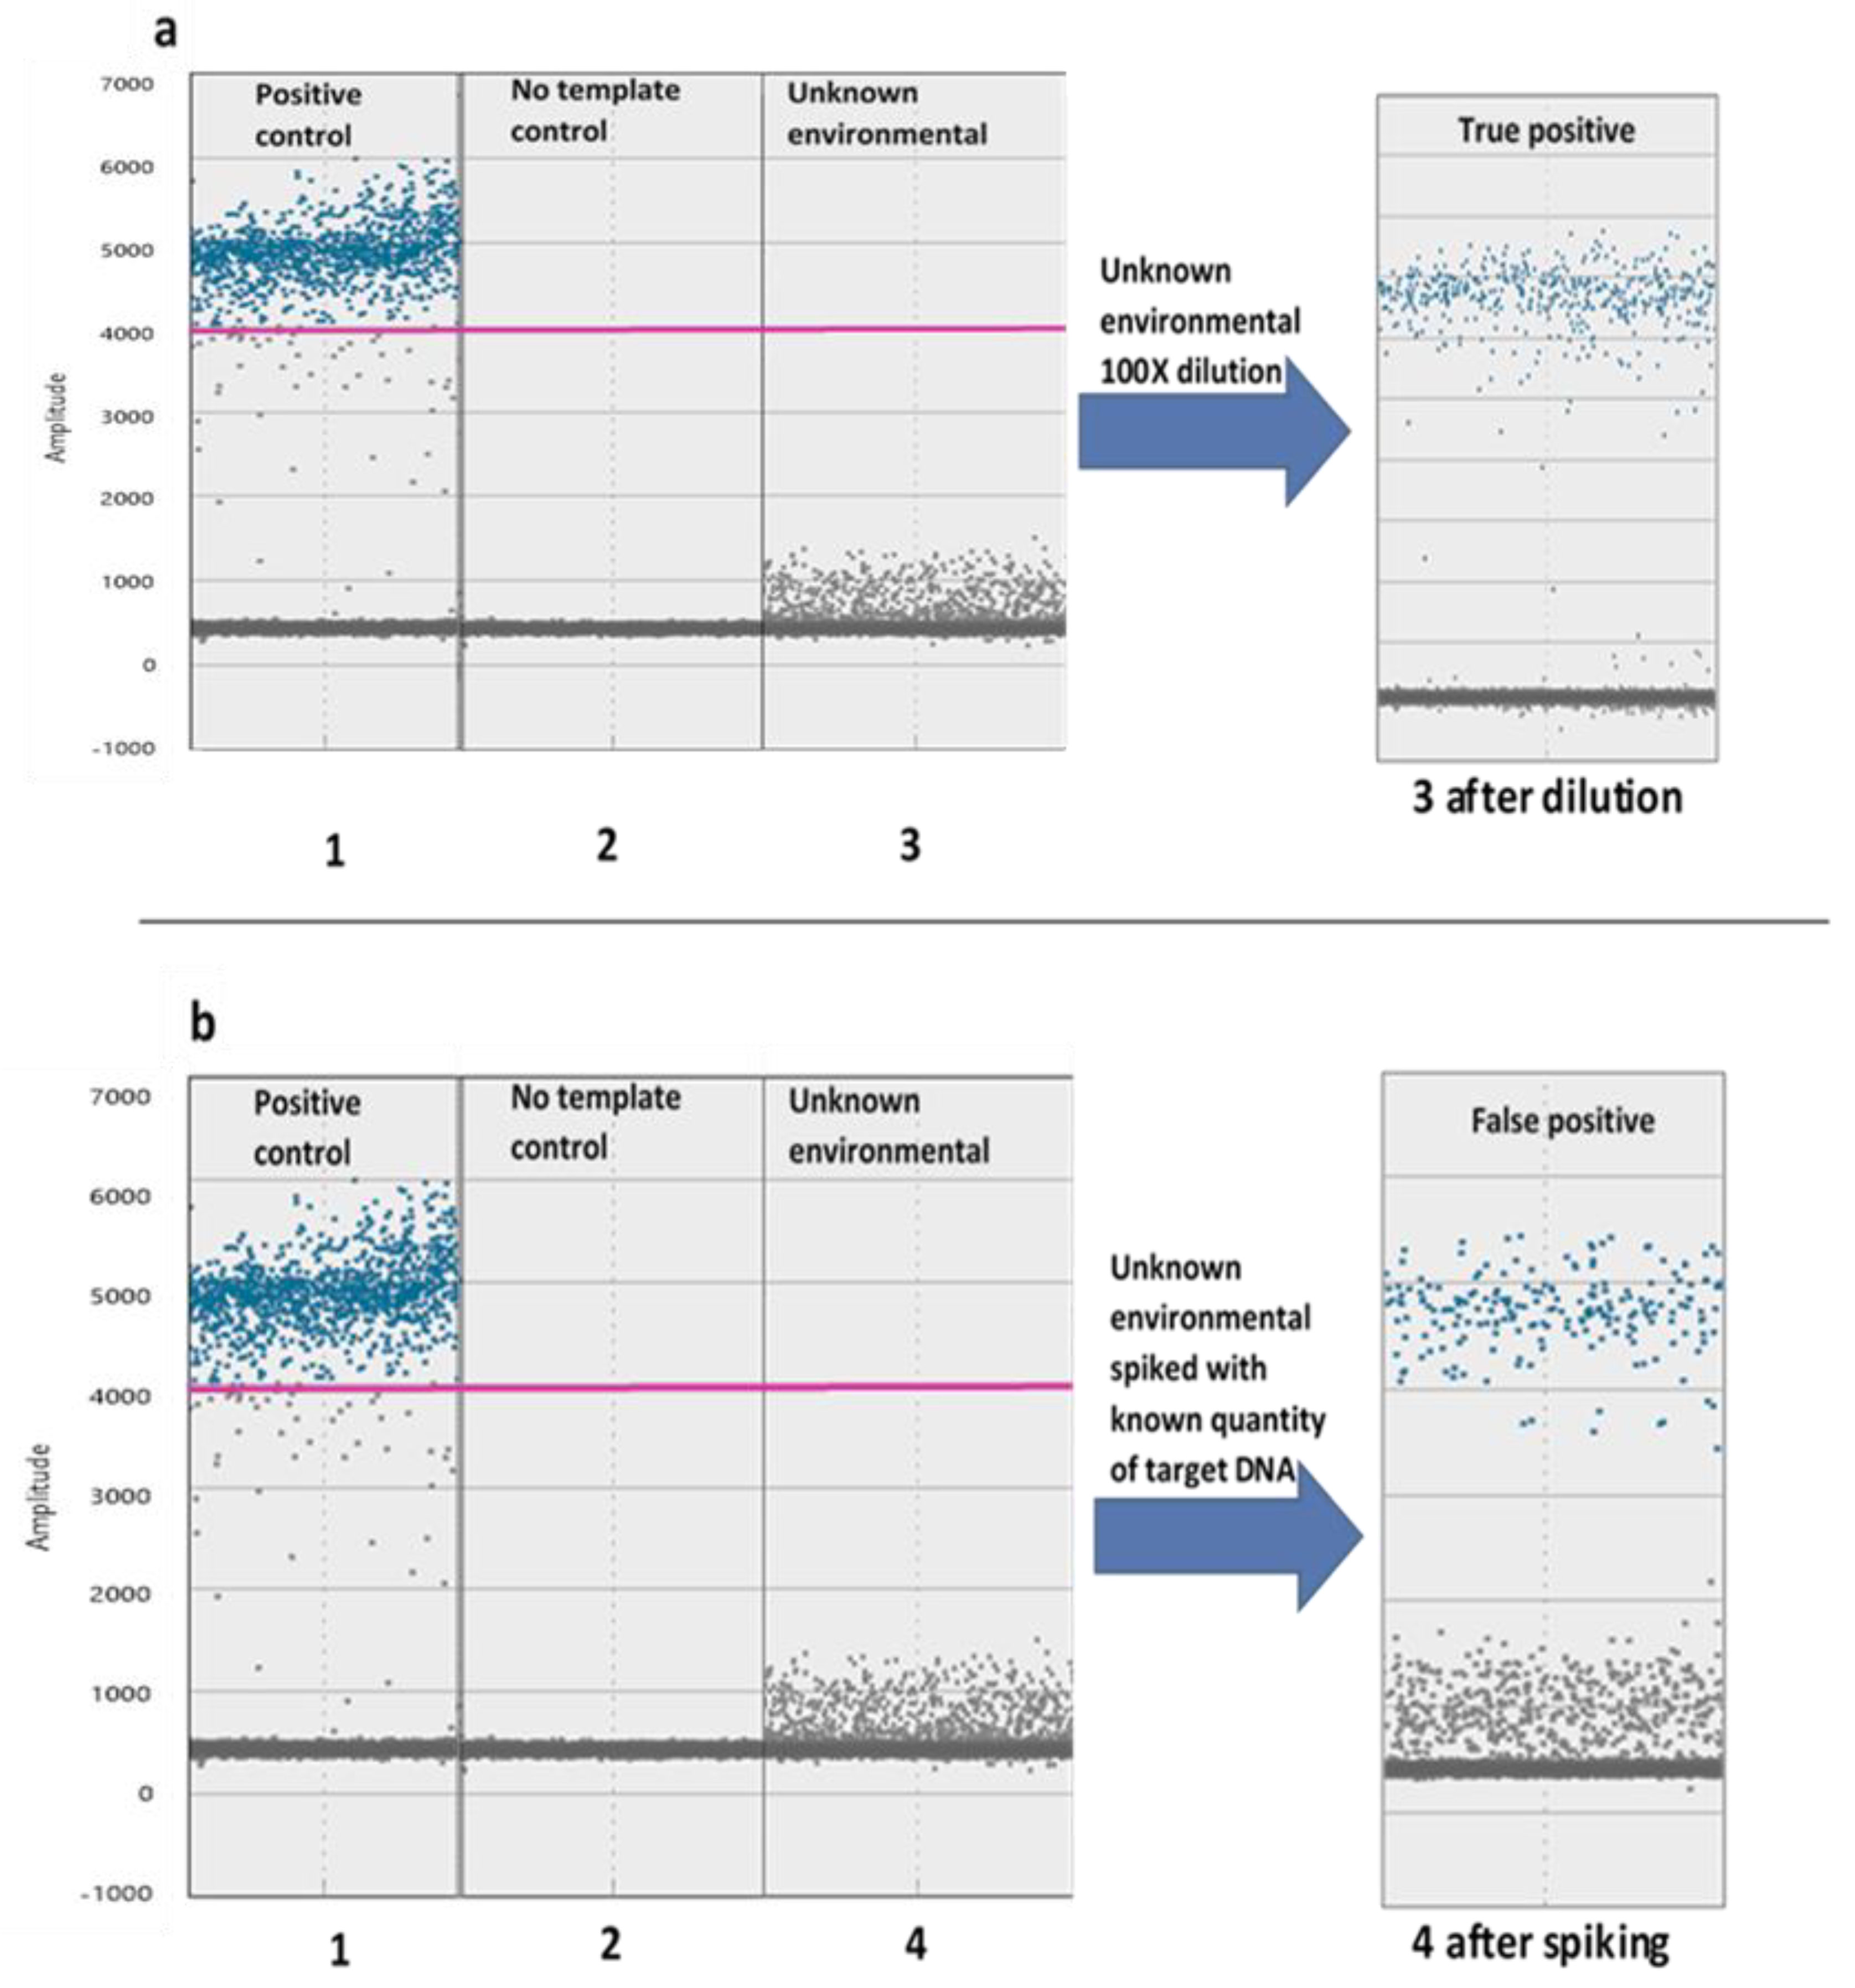
Dilution and spiking of unknown environmental samples helps distinguish between false and true positive samples (Figure 5). A highly concentrated sample prevents discrete cloud clustering and results in reduced amplitude levels (5a). By diluting the sample, it is easier to discriminate between false and positive droplets. When dilution does not result in cluster separation, we can distinguish between non-specific amplification or strong inhibition, by spiking the sample with a known quantity of our target (5b).
3.5. Threshold Determination
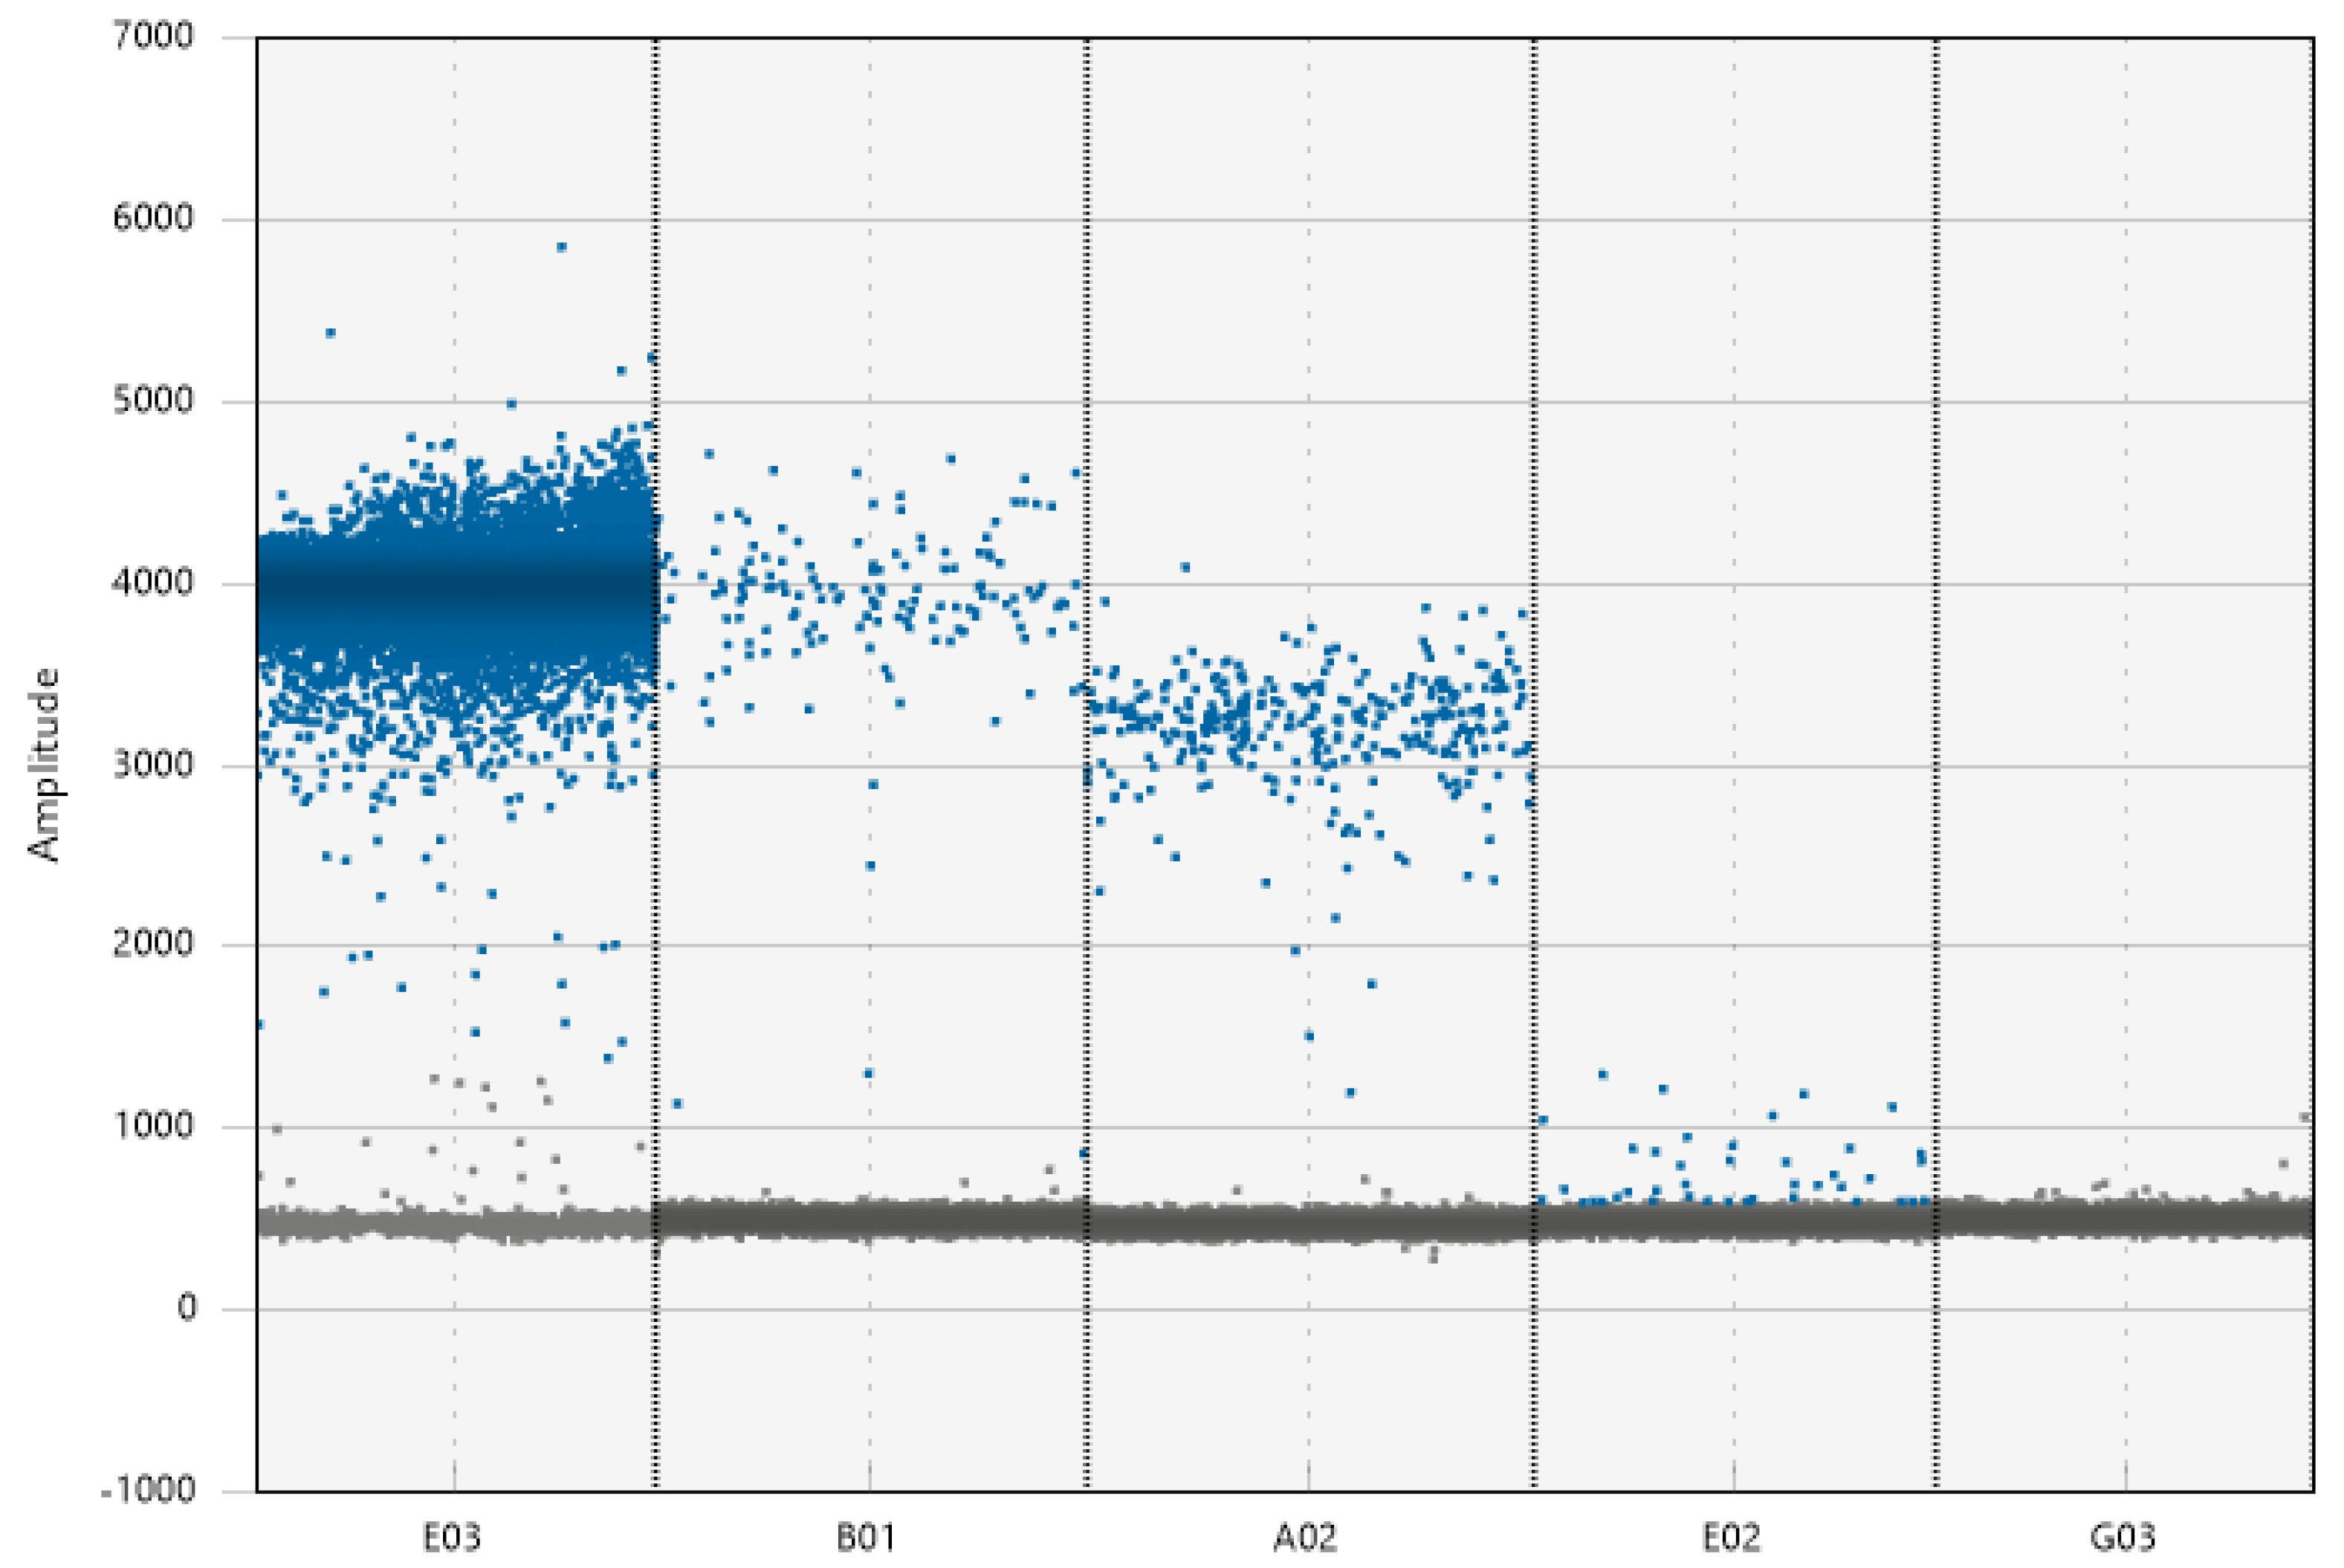
A high threshold based on a positive control may exclude positive droplets in positive environmental samples which may have reduced amplitude levels (Figure 6). A medium threshold defined by non-positive environmental samples could avoid non-specific amplification but also include positive samples with lower amplitude, due to inhibition or high target quantity. Setting a low threshold based on the NTC (common practice) can erroneously identify negative environmental samples as positives, due to low level of non-specific amplification.
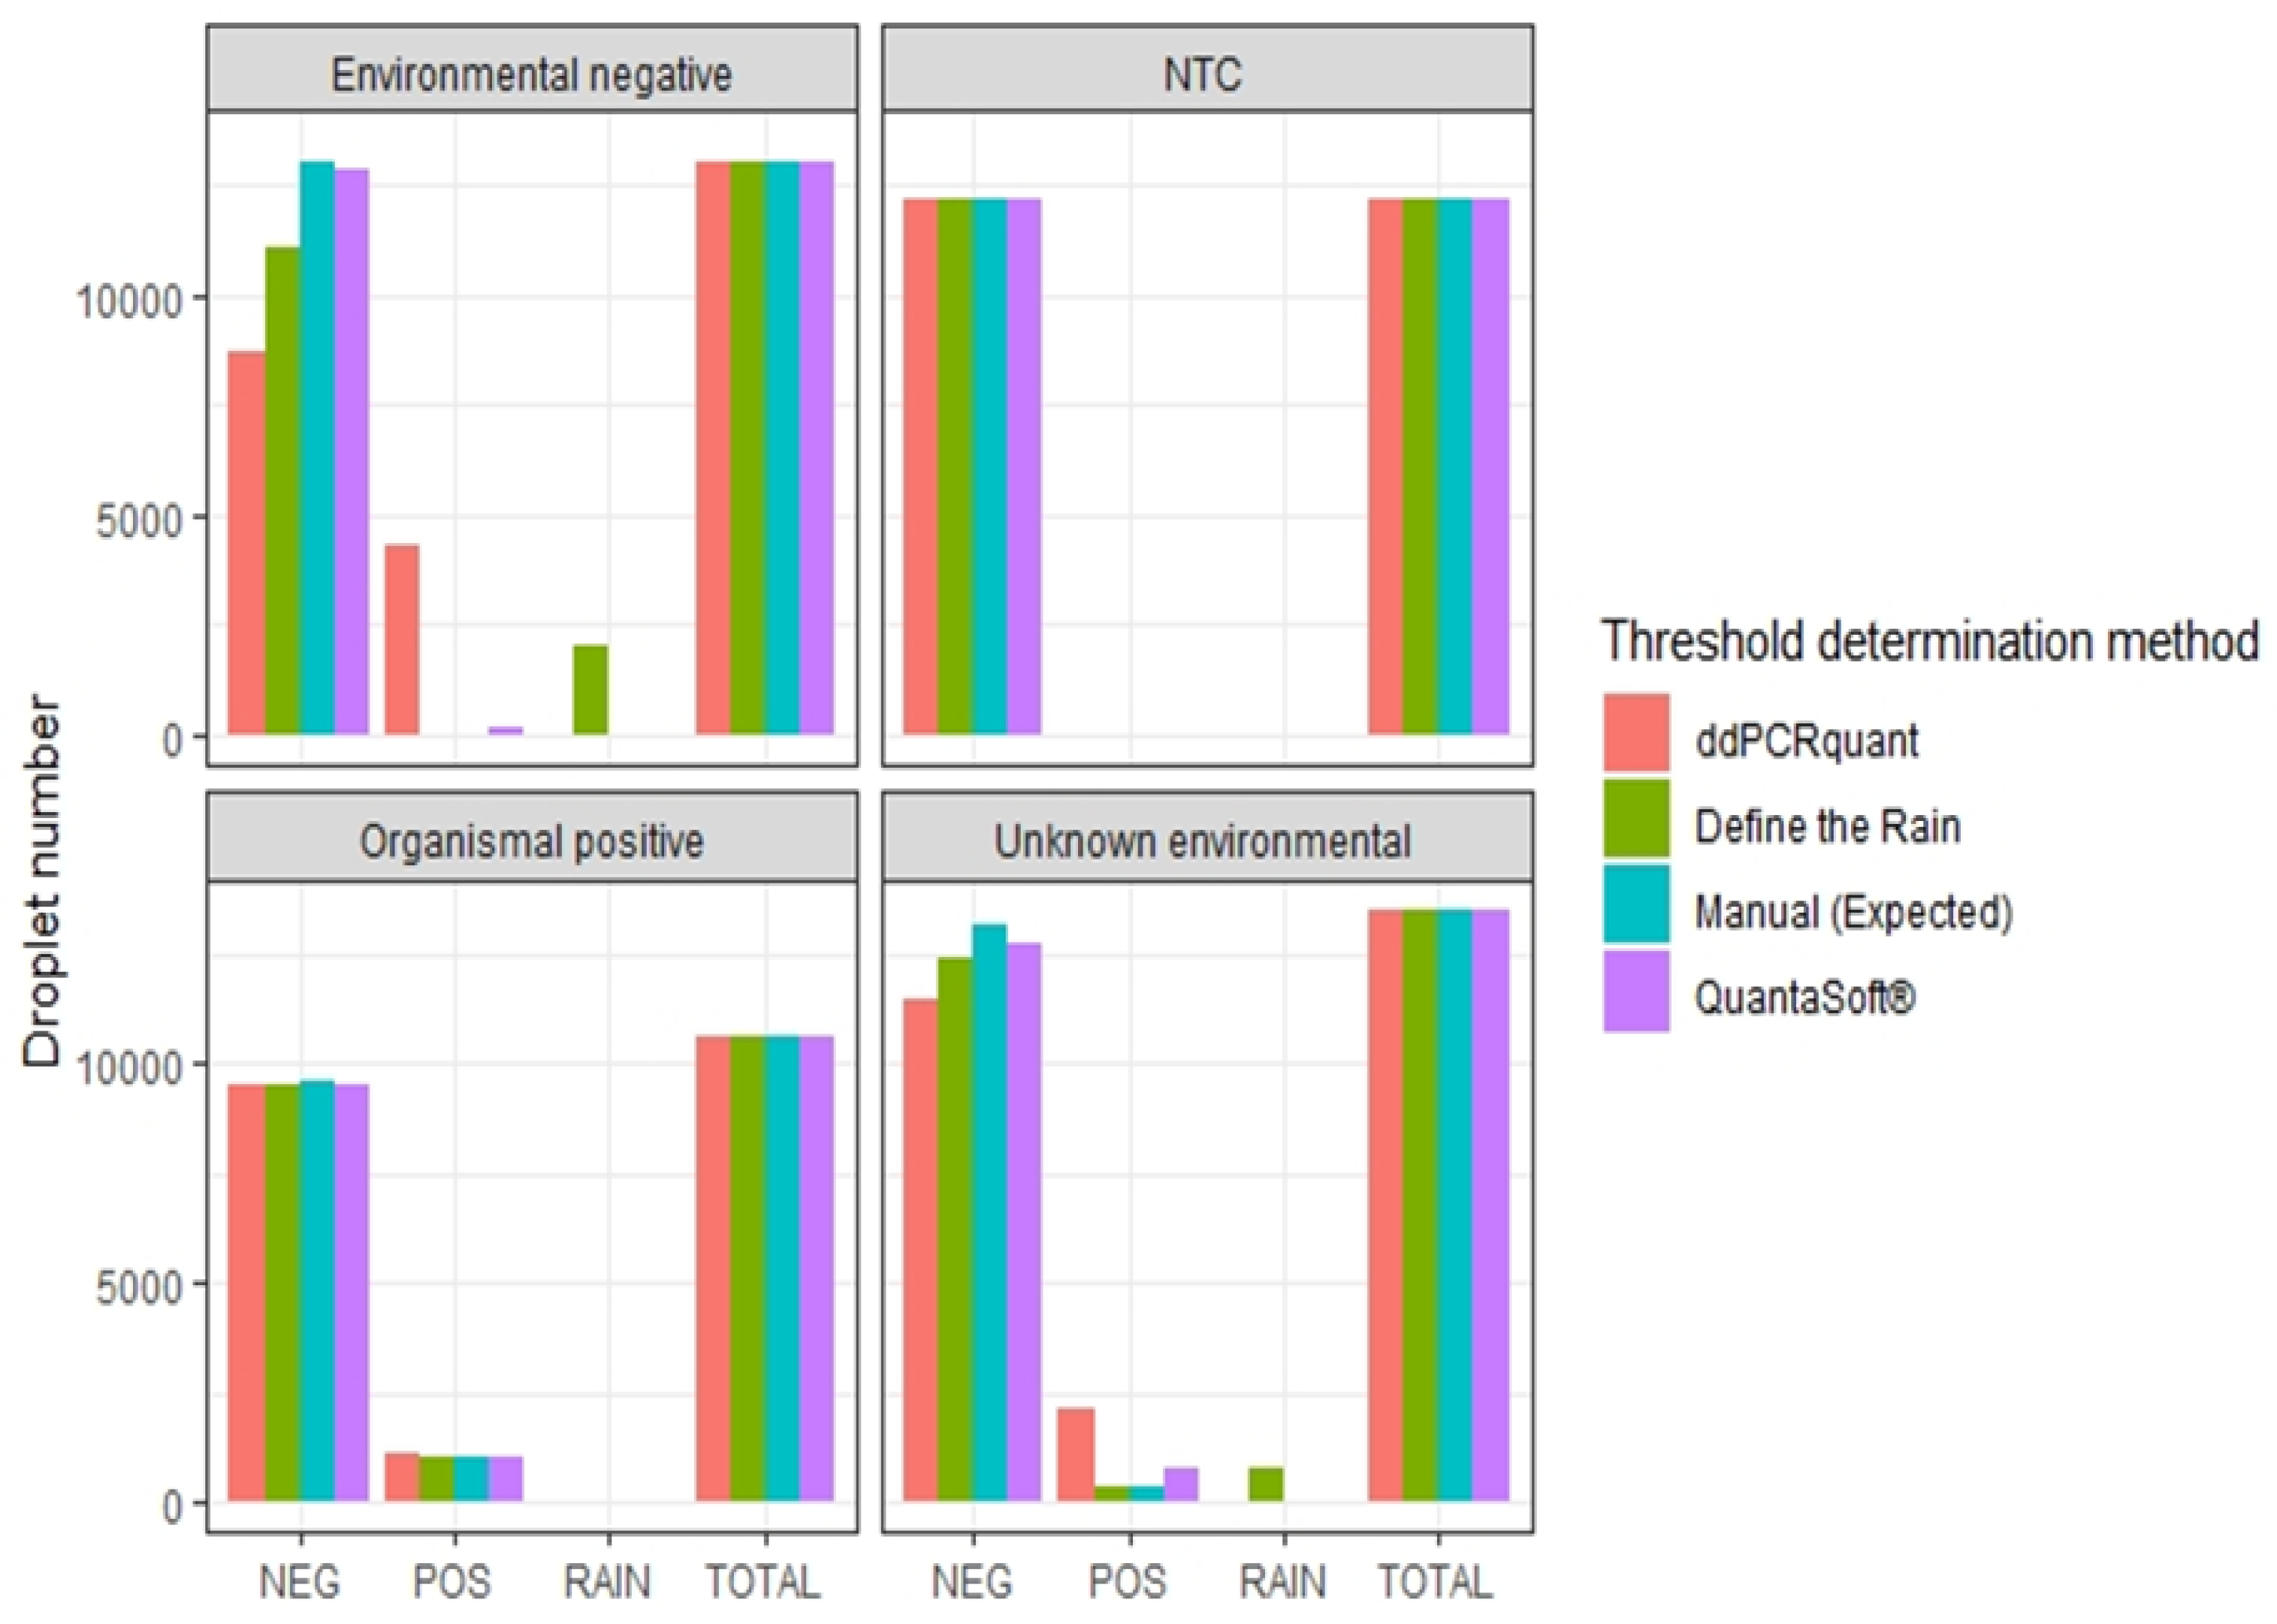
In addition to threshold amplitude, we used four sample categories “Environmental negative”, “No-template control” (NTC), “Organismal positive”, and “Unknown environmental” to examine how the manual threshold determination based on multiple controls (defined also as expected value) compares in output to the available threshold algorithms (Figure 7). Droplets were assigned to negative (NEG), positive (POS), and rain (RAIN). Only Define The Rain assigned droplets into the rain category. For the environmental negative control and the unknown environmental sample, none of the automatic threshold determination algorithms matched the expected value as defined by the manual threshold based on multiple controls.
4. Discussion
4.1. Cycling Conditions
Adjusting thermocycling conditions, such as altering the duration of denaturation and annealing/extension [37], increasing the number of cycles [38], and decreasing the ramp rate [39] can improve the efficiency of the reaction, which will result in improved droplet clustering and fluorescence levels (Table 1). While altering individual steps has been shown to optimize the ddPCR reaction, the additive effect of combined thermocycling condition alteration in a single protocol remained unknown. We demonstrate that the influence of each step is additive and while a fully optimized protocol can increase the duration of the PCR reaction (e.g., 4–5 h) it can greatly improve droplet resolution for environmental samples (Figure 2). In particular, optimization of annealing and extension temperature may have significant effects on cloud separation. While in standard PCR protocols, the annealing/extension temperature is optimized using target sequence positive and no-template controls, with environmental samples we recommend the use of two additional controls: an environmental positive and environmental negative control (Figure 3).
Unlike typical positive controls, which are represented by DNA from pure cultures or cloned template, environmental positive controls represent DNA samples where the target organism has been added to the matrix from which you hope to distinguish it. For example, if the target were a soil fungus, similar to our experiment, the environmental control would constitute soil which had been inoculated with the target fungus. Environmental positive controls will have less efficient amplification and lower fluorescence of positive droplets compared to organismal positive controls comprised of laboratory material, due to the presence of inhibitors in environmental samples. Thus, they allow better assessment of reasonable thresholds for positive droplets for environmental samples (Figure 3a,b). Environmental negative controls allow discrimination among positives and non-target sequences from the environmental matrix. These controls represent the substrate alone, without target DNA. They are particularly useful when using low annealing temperatures, which can favor non-specific amplification. An environmental negative control is useful for separating such false positives from the droplet cloud (Figure 3).
4.2. Primer/Probe Concentration
Increasing the quantity of primer and probe above recommended guidelines does not affect the amplitude levels or clustering efficiency [38]. However, while decreasing the quantity of primer/probe may reduce the cost of the reaction, its effect on assay efficiency has not been examined. We found that reduction of primer/probe quantity in the reaction may decrease clustering and should be avoided, as it increases the risk for an erroneously set threshold. We suggest working with the recommended quantity of primer and probe (20× which yields 500 nM primers and 250 nM probe). (Figure 4).
4.3. Sample Concentration
Diluting template DNA can result in tighter clustering because of increased reaction efficiency through decreased inhibitor concentration [34]. It is difficult to determine optimum DNA concentration for environmental samples a priori, since samples are comprised of DNA from organisms in addition to the target. It is therefore often necessary to optimize DNA concentration for samples individually. In our example, we show an environmental sample with low-level amplitude droplets that may be either non-target amplification, or incomplete amplification of target DNA due to inhibitors (Figure 5(a-3)). Diluting such samples may resolve ambiguous droplets (Figure 5(a-3) after dilution). If dilution does not resolve low-level amplification, we recommend that an environmental sample can be spiked with a low, known quantity of the target DNA. If the introduced target DNA does not amplify, then inhibition is likely the cause of the low-level droplets, and they are most likely true positives. If the introduced DNA amplifies above the environmental sample, then inhibition is not a problem, and the intermediate droplets are probably non-target DNA (Figure 5b).
4.4. Threshold Determination
For assays with high target abundance and little rain, threshold determination (manually or automatically) should not affect assay outcomes (BioRad Technologies, Inc. 2018). For environmental samples, however, discrimination of low abundance target from environmental controls is necessary to avoid false calls and spurious interpretation. For example, setting a low threshold based on NTCs can lead to false positives since it is not unusual to observe low-level, non-specific amplification in environmental samples (Figure 6). Similarly, setting a high threshold based on positive controls can underestimate target quantity (Figure 6) since positive droplets from environmental samples might exhibit lower fluorescence levels due to inhibition (e.g., Figure 6, well A02). We propose a manual threshold approach by setting a threshold that excludes droplets from negative environmental controls and includes the reduced fluorescence positive cloud produced by positive environmental controls (Figure 6).
Our analysis demonstrates that “Define The Rain” is the most accurate method for determining thresholds. “Define The Rain” produced results similar to the manually determined threshold based on multiple controls (Figure 7) (Figure S2). However, “Define The Rain” identifies droplets as “rain”, meaning the classification of the rain to positive or negative relies on the researcher’s judgment. In samples with a high proportion of “rain” droplets, a manual approach might be as effective.
QuantaSoft® software automatic threshold failed to determine between the environmental negative and true positive, and erroneously overestimated the targets quantity for the “unknown environmental sample” (Figure 7). While the threshold was determined after considering the group of samples, the threshold appeared random in each sample (Figure S3). While the QuantaSoft® software algorithm is the most common algorithm used (see Table S1), it should be avoided for environmental samples.
“ddPCRquant” algorithm poorly estimated target quantity and failed to identify the environmental negative as true negative (Figure 7). The “ddPCRquant” algorithm simply merged the three NTC’s and draw a line right above the dense droplet cloud created from the merged sample. Every droplet above that “low threshold” was considered as positive (Figure S4). Setting a low threshold, based on non-template controls, can misestimate the targets quantity, and identify false positives droplets as true positives (see section “Threshold determination”). “ddPCRquant” should only be used when the negative cloud amplitude is the same as the NTCs cloud. Because this is rarely the case for environmental samples, “ddPCRquant” algorithm should be avoided for environmental samples.
4.5. Limit of Detection Determination
Even after the threshold determination, the possibility of false positives exists, especially for rare environmental targets. When samples have a low number of droplets above the determined threshold, they may be considered positives via misinterpretation of fluorescence of foreign particles or artefacts produced by the instruments [11,40,41]. In order to define these droplets, knowledge on instrument limit of detection (LOD) is needed. The majority of strategies used to determine this threshold result in misestimation of targets presence in environmental samples [40]. In order to define the LOD a dilution series of a known quantity positive control is needed [26,40,42]. The purpose is to start the reaction with very low number of known target quantity (e.g., 1 to 10 copies per 20 mL PCR reaction) and examine the LOD of the instrument. Regardless the options, LOD threshold should be clearly defined in studies that use ddPCR. While using algorithms allows for rapid analysis of multiple samples, they cannot compensate for a poor assay. All assays, particularly those with significant rain (e.g., environmental samples), should attempt to reduce the rain through assay optimization before threshold determination.
5. Conclusions
Regardless of target, for both clinical and environmental samples, the single most important strategy to reduce “rain” is proper assay optimization. Even after meticulous assay optimization, however, most environmental samples will contain significant levels of intermediate droplets. It is important to determine whether these droplets represent non-target organisms (and are negatives) or reduced amplification efficiency (and are actually positives). Unfortunately, there is no easy way to discriminate among these possibilities. Threshold determination should result from a series of decisions spanning assay conditions to threshold analysis. Importantly, the threshold that is ultimately used should be a single value, not a range of values. A single, fixed manually determined threshold through the use of appropriate environmental controls prevents subjectivity and allows straightforward interpretation by the reader.
Supplementary Materials
The following are available online at https://0-www-mdpi-com.brum.beds.ac.uk/article/10.3390/applmicrobiol1010007/s1, Figure S1: A key to interpreting ddPCR output figures. Figure S2: Manual threshold determination, Figure S3: Automatically determined threshold using the QuantaSoft® software, Table S1: Web of Science (Clarivate Analytics 2018) search for environmental studies using ddPCR.
Author Contributions
V.K. and M.M.H. designed the research, V.K. performed the research, and E.V., A.R., C.T. and M.M.H. wrote the paper. All authors have read and agreed to the published version of the manuscript.
Funding
This work was supported by the National Sciences and Engineering Research Council of Canada discovery grant (2018).
Institutional Review Board Statement
Not applicable.
Informed Consent Statement
Not applicable.
Data Availability Statement
Not applicable.
Conflicts of Interest
The authors declare no conflict of interest.
References
- Hindson, B.J.; Ness, K.D.; Masquelier, D.A.; Belgrader, P.; Heredia, N.J.; Makarewicz, A.J.; Bright, I.J.; Lucero, M.Y.; Hiddessen, A.L.; Legler, T.C.; et al. High-Throughput Droplet Digital PCR System for Absolute Quantitation of DNA Copy Number. Anal. Chem. 2011, 83, 8604–8610. [Google Scholar] [CrossRef] [PubMed]
- Basu, A.S. Digital Assays Part I: Partitioning Statistics and Digital PCR. SLAS Technol. Transl. Life Sci. Innov. 2017, 22, 369–386. [Google Scholar] [CrossRef] [Green Version]
- Hindson, C.M.; Chevillet, J.R.; Briggs, H.A.; Gallichotte, E.N.; Ruf, I.K.; Hindson, B.J.; Vessella, R.L.; Tewari, M. Absolute quantification by droplet digital PCR versus analog real-time PCR. Nat. Methods 2013, 10, 1003–1005. [Google Scholar] [CrossRef] [PubMed]
- Beaver, J.A.; Jelovac, D.; Balukrishna, S.; Cochran, R.L.; Croessmann, S.; Zabransky, D.J.; Wong, H.Y.; Toro, P.V.; Cidado, J.; Blair, B.G.; et al. Detection of Cancer DNA in Plasma of Patients with Early-Stage Breast Cancer. Clin. Cancer Res. 2014, 20, 2643–2650. [Google Scholar] [CrossRef] [PubMed] [Green Version]
- Liu, R.; Zhao, X.; Guo, W.; Huang, M.; Qiu, L.; Zhang, W.; Zhang, Z.; Li, W.; Zhu, X.; Chen, Z. Dynamic monitoring of HER2 amplification in circulating DNA of patients with metastatic colorectal cancer treated with cetuximab. Clin. Transl. Oncol. 2019, 22, 928–934. [Google Scholar] [CrossRef]
- Fu, W.; Wang, C.; Zhu, P.; Xu, W.; Li, X.; Zhu, S. A universal analytical approach for screening and monitoring of authorized and unauthorized GMOs. LWT 2020, 125, 109176. [Google Scholar] [CrossRef]
- Milavec, M.; Dobnik, D.; Yang, L.; Zhang, D.; Gruden, K.; Žel, J. GMO quantification: Valuable experience and insights for the future. Anal. Bioanal. Chem. 2014, 406, 6485–6497. [Google Scholar] [CrossRef]
- Hamza, I.A.; Bibby, K. Critical issues in application of molecular methods to environmental virology. J. Virol. Methods 2019, 266, 11–24. [Google Scholar] [CrossRef] [PubMed]
- NejcRački, N.; Dreo, T.; Gutierrez-Aguirre, I.; Blejec, A.; Ravnikar, M. Reverse transcriptase droplet digital PCR shows high resilience to PCR inhibitors from plant, soil and water samples. Plant Methods 2014, 10, 1–10. [Google Scholar] [CrossRef]
- Bustin, S.A.; Benes, V.; Garson, J.A.; Hellemans, J.; Huggett, J.; Kubista, M.; Mueller, R.; Nolan, T.; Pfaffl, M.W.; Shipley, G.L.; et al. The MIQE Guidelines: Minimum Information for Publication of Quantitative Real-Time PCR Experiments. Clin. Chem. 2009, 55, 611–622. [Google Scholar] [CrossRef] [Green Version]
- Yang, R.; Paparini, A.; Monis, P.; Ryan, U. Comparison of next-generation droplet digital PCR (ddPCR) with quantitative PCR (qPCR) for enumeration of Cryptosporidium oocysts in faecal samples. Int. J. Parasitol. 2014, 44, 1105–1113. [Google Scholar] [CrossRef] [Green Version]
- Demeke, T.; Dobnik, D. Critical assessment of digital PCR for the detection and quantification of genetically modified organisms. Anal. Bioanal. Chem. 2018, 410, 4039–4050. [Google Scholar] [CrossRef] [Green Version]
- Trypsteen, W.; Vynck, M.; De Neve, J.; Bonczkowski, P.; Kiselinova, M.; Malatinkova, E.; Vervisch, K.; Thas, O.; Vandekerckhove, L.; De Spiegelaere, W. ddpcRquant: Threshold determination for single channel droplet digital PCR experiments. Anal. Bioanal. Chem. 2015, 407, 5827–5834. [Google Scholar] [CrossRef] [PubMed]
- Zink, F.A.; Tembrock, L.R.; Timm, A.E.; Farris, R.E.; Perera, O.P.; Gilligan, T.M. A droplet digital PCR (ddPCR) assay to detect Helicoverpa armigera (Lepidoptera: Noctuidae) in bulk trap samples. PLoS ONE 2017, 12, e0178704. [Google Scholar] [CrossRef] [Green Version]
- Dobnik, D.; Demšar, T.; Huber, I.; Gerdes, L.; Broeders, S.; Roosens, N.; Debode, F.; Berben, G.; Žel, J. Inter-laboratory analysis of selected genetically modified plant reference materials with digital PCR. Anal. Bioanal. Chem. 2017, 410, 211–221. [Google Scholar] [CrossRef] [Green Version]
- Pipan, B.; Zupančič, M.; Blatnik, E.; Dolničar, P.; Meglič, V. Comparison of six genomic DNA extraction methods for molecular downstream applications of apple tree (Malus X domestica). Cogent Food Agric. 2018, 4. [Google Scholar] [CrossRef]
- Meijerink, J.; Mandigers, C.; Van De Locht, L.; Tönnissen, E.; Goodsaid, F.; Raemaekers, J. A Novel Method to Compensate for Different Amplification Efficiencies between Patient DNA Samples in Quantitative Real-Time PCR. J. Mol. Diagn. 2001, 3, 55–61. [Google Scholar] [CrossRef] [Green Version]
- Emerson, J.B.; Adams, R.I.; Román, C.M.B.; Brooks, B.; Coil, D.A.; Dahlhausen, K.; Ganz, H.H.; Hartmann, E.M.; Hsu, T.; Justice, N.B.; et al. Schrödinger’s microbes: Tools for distinguishing the living from the dead in microbial ecosystems. Microbiome 2017, 5, 1–23. [Google Scholar] [CrossRef]
- Kreader, C.A. Relief of amplification inhibition in PCR with bovine serum albumin or T4 gene 32 protein. Appl. Environ. Microbiol. 1996, 62, 1102–1106. [Google Scholar] [CrossRef] [Green Version]
- Dingle, T.; Sedlak, R.H.; Cook, L.; Jerome, K.R. Tolerance of Droplet-Digital PCR vs. Real-Time Quantitative PCR to Inhibitory Substances. Clin. Chem. 2013, 59, 1670–1672. [Google Scholar] [CrossRef] [Green Version]
- Taylor, S.C.; Laperriere, G.; Germain, H. Droplet Digital PCR versus qPCR for gene expression analysis with low abundant targets: From variable nonsense to publication quality data. Sci. Rep. 2017, 7, 1–8. [Google Scholar] [CrossRef] [Green Version]
- Cavé, L.; Brothier, E.; Abrouk, D.; Bouda, P.S.; Hien, E.; Nazaret, S. Efficiency and sensitivity of the digital droplet PCR for the quantification of antibiotic resistance genes in soils and organic residues. Appl. Microbiol. Biotechnol. 2016, 100, 10597–10608. [Google Scholar] [CrossRef] [PubMed] [Green Version]
- Wickham, H. ggplot2: Elegant Graphics for Data Analysis; Springer: New York, NY, USA, 2016; ISBN 978-3-319-24277-4. [Google Scholar]
- Kokkoris, V.; Li, Y.; Hamel, C.; Hanson, K.; Hart, M. Site specificity in establishment of a commercial arbuscular mycorrhizal fungal inoculant. Sci. Total. Environ. 2019, 660, 1135–1143. [Google Scholar] [CrossRef]
- Sieverding, E.; Da Silva, G.A.; Berndt, R.; Oehl, F. Rhizoglomus, a new genus of the Glomeraceae. Mycotaxon 2015, 129, 373–386. [Google Scholar] [CrossRef]
- Doi, H.; Uchii, K.; Takahara, T.; Matsuhashi, S.; Yamanaka, H.; Minamoto, T. Use of Droplet Digital PCR for Estimation of Fish Abundance and Biomass in Environmental DNA Surveys. PLoS ONE 2015, 10, e0122763. [Google Scholar] [CrossRef] [PubMed] [Green Version]
- Simmons, M.; Tucker, A.; Chadderton, W.L.; Jerde, C.L.; Mahon, A.R. Active and passive environmental DNA surveillance of aquatic invasive species. Can. J. Fish. Aquat. Sci. 2016, 73, 76–83. [Google Scholar] [CrossRef]
- Cooley, M.B.; Carychao, D.; Gorski, L. Optimized Co-extraction and Quantification of DNA from Enteric Pathogens in Surface Water Samples Near Produce Fields in California. Front. Microbiol. 2018, 9, 448. [Google Scholar] [CrossRef]
- del Pilar Martínez-Diz, M.; Andrés-Sodupe, M.; Berbegal, M.; Bujanda, M.R.; Díaz-Losada, E.; Gramaje, D. Droplet Digital PCR Technology for Detection ofIlyonectria liriodendrifrom Grapevine Environmental Samples. Plant Dis. 2020, 104, 1144–1150. [Google Scholar] [CrossRef]
- Rosa, D.; Pogiatzis, A.; Bowen, P.; Kokkoris, V.; Richards, A.; Holland, T.; Hart, M. Performance and Establishment of a Commercial Mycorrhizal Inoculant in Viticulture. Agriculture 2020, 10, 539. [Google Scholar] [CrossRef]
- Kokkoris, V.; Chagnon, P.-L.; Yildirir, G.; Clarke, K.; Goh, D.; MacLean, A.M.; Dettman, J.; Stefani, F.; Corradi, N. Host identity influences nuclear dynamics in arbuscular mycorrhizal fungi. Curr. Biol. 2021, 31, 1531–1538.e6. [Google Scholar] [CrossRef]
- McMahon, T.C.; Blais, B.W.; Wong, A.; Carrillo, C.D. Multiplexed Single Intact Cell Droplet Digital PCR (MuSIC ddPCR) Method for Specific Detection of Enterohemorrhagic E. coli (EHEC) in Food Enrichment Cultures. Front. Microbiol. 2017, 8, 332. [Google Scholar] [CrossRef] [PubMed] [Green Version]
- Jones, M.; Williams, J.; Gärtner, K.; Phillips, R.; Hurst, J.; Frater, J. Low copy target detection by Droplet Digital PCR through application of a novel open access bioinformatic pipeline, ‘definetherain’. J. Virol. Methods 2014, 202, 46–53. [Google Scholar] [CrossRef] [PubMed] [Green Version]
- Dreo, T.; Pirc, M.; Živa, R.; Pavšič, J.; Milavec, M.; Žel, J.; Gruden, K. Optimising droplet digital PCR analysis approaches for detection and quantification of bacteria: A case study of fire blight and potato brown rot. Anal. Bioanal. Chem. 2014, 406, 6513–6528. [Google Scholar] [CrossRef]
- Strain, M.C.; Lada, S.M.; Luong, T.; Rought, S.E.; Gianella, S.; Terry, V.H.; Spina, C.A.; Woelk, C.H.; Richman, D.D. Highly Precise Measurement of HIV DNA by Droplet Digital PCR. PLoS ONE 2013, 8, e55943. [Google Scholar] [CrossRef]
- Jacobs, B.K.M.; Goetghebeur, E.; Vandesompele, J.; De Ganck, A.; Nijs, N.; Beckers, A.; Papazova, N.; Roosens, N.H.; Clement, L. Model-Based Classification for Digital PCR: Your Umbrella for Rain. Anal. Chem. 2017, 89, 4461–4467. [Google Scholar] [CrossRef] [PubMed]
- Witte, A.K.; Mester, P.; Fister, S.; Witte, M.; Schoder, D.; Rossmanith, P. A Systematic Investigation of Parameters Influencing Droplet Rain in the Listeria monocytogenes prfA Assay—Reduction of Ambiguous Results in ddPCR. PLoS ONE 2016, 11, e0168179. [Google Scholar] [CrossRef] [PubMed]
- Köppel, R.; Bucher, T. Rapid establishment of droplet digital PCR for quantitative GMO analysis. Eur. Food Res. Technol. 2015, 241, 427–439. [Google Scholar] [CrossRef]
- Witte, A.K.; Fister, S.; Mester, P.; Schoder, D.; Rossmanith, P. Evaluation of the performance of quantitative detection of the Listeria monocytogenes prfA locus with droplet digital PCR. Anal. Bioanal. Chem. 2016, 408, 7583–7593. [Google Scholar] [CrossRef] [Green Version]
- Hunter, M.E.; Dorazio, R.M.; Butterfield, J.S.S.; Meigs-Friend, G.; Nico, L.G.; Ferrante, J.A. Detection limits of quantitative and digital PCR assays and their influence in presence-absence surveys of environmental DNA. Mol. Ecol. Resour. 2017, 17, 221–229. [Google Scholar] [CrossRef]
- Kiselinova, M.; Pasternak, A.O.; De Spiegelaere, W.; Vogelaers, D.; Berkhout, B.; Vandekerckhove, L. Comparison of Droplet Digital PCR and Seminested Real-Time PCR for Quantification of Cell-Associated HIV-1 RNA. PLoS ONE 2014, 9, e85999. [Google Scholar] [CrossRef] [Green Version]
- Baker, C.S.; Steel, D.; Nieukirk, S.; Klinck, H. Environmental DNA (eDNA) From the Wake of the Whales: Droplet Digital PCR for Detection and Species Identification. Front. Mar. Sci. 2018, 5. [Google Scholar] [CrossRef] [Green Version]
Figure 1.
Droplet digital PCR (ddPCR) versus quantitative PCR (qPCR). In ddPCR, samples are partitioned into thousands of droplets, each of which undergo amplification. After PCR cycling, the fluorescence of each droplet is measured at the end of the PCR reaction. As an output, droplets are grouped as positive or negative based on their fluorescence amplitude levels (y axis). In contrast, qPCR, fluorescence gives one measure per sample in real time, at the end of each PCR cycle. Due to such fundamental differences in the approach, guidelines for standardizing qPCR assays such as the Minimum Information for publication of Quantitative real-time PCR Experiments (MIQE) [10] are not appropriate for ddPCR, and users are left to develop their own quality control protocols. Overall, ddPCR does not require sample replication, does not require to generate a standard curve for absolute quantification, and has increased sensitivity in target detection. As such, ddPCR represents a great option for analyzing environmental samples. The figure was created with BioRender (BioRender.com; 9 April 2021).

Figure 2.
The effect of protocol optimization based on the suggestions presented in Table 1 on the output from a ddPCR assay examining environmental samples at two different template concentrations. Blue dots indicate putative positive droplets whereas the grey represent negatives. The first two wells represent two environmental samples with different template concentrations (A02 field soil DNA sample and B02 root DNA sample), and the last two wells represent a non-template and an organismal positive control, respectively. The pink line is a manually set high threshold based on the organismal positive control of the optimized protocol and it is used to demonstrate the increase in amplitude levels after the optimization. The width of each well is related to the number of final droplets analyzed (accepted samples need to have more than 10,000 droplets).

Figure 3.
Multiple controls are required to determine optimum annealing and extension temperature. Organismal (a), environmental (b) positive controls and (c) environmental negative controls (c). Multiple positive controls improve discrimination between true positives and “rain” or false positives.
Figure 3.
Multiple controls are required to determine optimum annealing and extension temperature. Organismal (a), environmental (b) positive controls and (c) environmental negative controls (c). Multiple positive controls improve discrimination between true positives and “rain” or false positives.

Figure 4.
Higher primer concentration improves resolution and cloud clustering. We used an organismal positive control to demonstrate the primer concertation effect. (a) using 1× primer and probe concentration (which yields 25 nM primers and 12.5 nM probe), results in positive cloud amplitude around 500. (b) Primer and probe concentration of 10× shifts the amplitude of the positive cloud closer to 3000. (c) The recommended by the manufacturer 20× primer and probe concentration, shifts the positive cloud to 4500 (c). Red circles emphasize the amplitude levels of each primer/probe concentration used and indicate the effect of changing the primer/probe concentration on the amplitude level.

Figure 5.
Dilution (a) and spiking (b) of unknown environmental samples help distinguish between false and true positive samples. (a) The low cloud in sample a3 clearly separates into a true positive cloud and a negative cloud after dilution. (b) The unknown environmental sample (sample b4) is indeed negative because the added known quantity of our target appears to the amplitude levels of the positive while unknown cloud remains. The low cloud produced in sample 4 may be due to nonspecific or partial amplification or the reflective property of proteins existing in the environmental sample. Samples a1 and b1 correspond to an organismal positive control while samples a2 and b2 represent a no-template control. The pink line is a high threshold determined based on the positive cloud of the organismal positive control.

Figure 6.
A high threshold based on the organismal positive control (E03) may work for certain environmental positives with low inhibition levels (B01) but may exclude positive droplets in positive environmental samples which may have reduced amplitude levels (A02). A medium threshold, based on the non-positive environmental samples, could avoid non-specific amplification but also include positive samples with lower amplitude, due to inhibition or high target quantity. Setting a low threshold based on the NTC (G03) (common practice) can erroneously identify negative environmental samples as positives (E02), due to low level of non-specific amplification. The positive environmental is root DNA sample (B01), while the positive environmental 2 is a field soil DNA sample (A02).

Figure 7.
Comparing automatic threshold determination for algorithms and manual threshold determination. We used four sample categories “Environmental negative”, “No-template control” (NTC), “Organismal positive”, and “Unknown environmental” to examine how the manual threshold determination based on multiple controls (defined also as expected value) compares in output to the available threshold algorithms. Droplets are assigned to negative (NEG), positive (POS), and rain (RAIN).


Table 1.
Optimizing ddPCR assays for environmental samples. For the purpose of this study, we examined the additive effect of optimized cycling conditions suggested by the literature and the effect of the primer/probe and sample concentration on the efficiency of the reaction. We also recommend the use of multiple controls that can further optimize the annealing/extension temperature and facilitate threshold determination.
| Variable | Recommendations | Effect | |
|---|---|---|---|
| Optimizing cycling conditions | Denaturation | Increase to 1 min | Results are additive and can improve cluster separation as well as reduce rain between the clusters |
| Annealing/extension | Increase to 2 min | ||
| Ramp rate | Decrease to 1 °C/sec | ||
| Number of cycles | Increase to 41–45 | ||
| Optimizing annealing/extension temperature | Annealing/extension temperature | Using organismal positive control | Ensure the effectiveness of the assay |
| Use a high abundance positive environmental sample | Reveals the optimum temperature for increased fluorescence and less rain between clouds | ||
| Use a low in abundance positive environmental sample | Ensures the optimum temperature in which low abundance target is clearly separated from rain or non-specific amplification | ||
| Use a negative environmental sample | Reveals the temperature in which non-specific amplification is limited/absent reducing false positive recognition | ||
| Use a non-template control (NTC) | Reject the possibility of contamination | ||
| Adjusting primer/probe concentration | Primer/probe concentration | Use recommended concentration | Decreasing primer/probe quantity can reduce cluster separation by decreasing fluorescence levels. Increasing the concentration beyond recommended does not alter the fluorescence levels |
| Adjusting sample concentration | Sample concentration | Dilute very concentrated samples as needed when there is no clear cluster separation or a lot of rain between clusters | Identify false positives and avoid false negatives |
| Threshold determination | Manually set threshold (should be determined taking under consideration multiple controls) | Using a high abundance positive environmental sample | When the target is abundant fluorescence levels can be reduced. In case a high threshold has been chosen then it should not exceed the lower limits of that samples positive cloud |
| Using a negative environmental sample | Can help eliminate non-specific amplification by setting the threshold above the non-specific amplified cluster | ||
| Minimum accepted positive droplet threshold | Use three–five NTC samples. Use both a positive control dilution series and a spiked environmental sample with same dilution series | Determining the limit of detection can eliminate false positives due to instrument artefacts or fluorescence of foreign particles |
Publisher’s Note: MDPI stays neutral with regard to jurisdictional claims in published maps and institutional affiliations. |
© 2021 by the authors. Licensee MDPI, Basel, Switzerland. This article is an open access article distributed under the terms and conditions of the Creative Commons Attribution (CC BY) license (https://creativecommons.org/licenses/by/4.0/).
Share and Cite
MDPI and ACS Style
Kokkoris, V.; Vukicevich, E.; Richards, A.; Thomsen, C.; Hart, M.M. Challenges Using Droplet Digital PCR for Environmental Samples. Appl. Microbiol. 2021, 1, 74-88. https://0-doi-org.brum.beds.ac.uk/10.3390/applmicrobiol1010007
AMA Style
Kokkoris V, Vukicevich E, Richards A, Thomsen C, Hart MM. Challenges Using Droplet Digital PCR for Environmental Samples. Applied Microbiology. 2021; 1(1):74-88. https://0-doi-org.brum.beds.ac.uk/10.3390/applmicrobiol1010007
Chicago/Turabian StyleKokkoris, Vasilis, Eric Vukicevich, Andrew Richards, Corrina Thomsen, and Miranda M. Hart. 2021. "Challenges Using Droplet Digital PCR for Environmental Samples" Applied Microbiology 1, no. 1: 74-88. https://0-doi-org.brum.beds.ac.uk/10.3390/applmicrobiol1010007