1. Introduction
The knowledge concerning job satisfaction is a factor that has interested researchers for many years, and it is also the reason for many investigations being conducted. As an antecedent, we have Maslow’s theory in 1943, with his pyramid of needs satisfaction hierarchies. In addition, we have Herzberg’s theory in 1959, which considered that the satisfaction and discontent of workers manifest in two factors, one of hygiene or maintenance and the other of satisfaction or motivation. There are many factors that reflect teachers’ non-satisfaction at work, such as monotony, weariness, impatience, absences, and other, more serious psychological factors that affect health, such as anxiety and lack of motivation [
1]. Certain researchers consider teaching to be a high-risk profession, since society expects the teacher to educate, train, and orient students, with increasingly complex demands from families, the government, and educational reforms. Pressure also comes from employers themselves with their conditions of salary, and there is also the pressure of relationships with colleagues, authorities, infrastructure, and the environment [
2]. In this research, we seek to establish the relationship between the job satisfaction of teachers and the variables of professional satisfaction, distributed leadership, and perception of insecurity. Unfortunately, there is an economic, political, and social crisis that is currently driving the increase in crime and violence in many regions of Mexico, and it is now also invading schools and affecting teachers. An investigation carried out in a university center in Mexico City on internal and external physical security revealed an increase in recent years in crimes perpetrated inside and on the periphery of the university campus; these crimes include theft, attempted robbery, robbery with violence, armed robbery, and sexual abuse. Moreover, the study also mentioned that around 40% of students and staff have been victims of some type of crime [
3]. Data from the National Federation of Family Parents (FENAPAF) indicate that in 2022, insecurity within schools in Mexico grew by 45%.
Distributed leadership is a phenomenon that seeks to overcome the vision of the solitary, heroic leader with infinite and inexhaustible capacities to a leadership that is exercised in the space of social relations [
4]. We endeavor to understand distributed leadership as a form of collective action among many people who seek to make changes that improve their institutions, without this including the delegation of tasks from a director to others.
There are many researchers who have developed concepts and constructs through which to obtain a measurement of distributed leadership, perception of insecurity, job satisfaction, and professional satisfaction, either in isolation or combined with other variables (some of which are presented in this research).
1.1. Literature Review and Hypotheses
1.1.1. Job Satisfaction of University Academics
In the literature, there are many authors who seek to define the term worker satisfaction. Among them is Muñoz [
5], who defines it as a person finding themselves in an environment that makes them feel comfortable and in which their work is pleasant or positive; this is in addition to having psychological, social, and economic compensation according to their expectations. For Álvarez [
6], worker satisfaction is a consequence of performing a task, job, or function. According to Díaz [
7], it is a state or emotional feeling that is related to the work that workers are presented with when faced with the action or execution of a work activity. For certain researchers, job satisfaction is a psychosocial phenomenon that is linked to a set of attitudes that affects people’s behavioral decisions [
8].
In the education sector, several factors that influence teacher satisfaction have been studied. Locke [
9] advises that the activities of the university professor are diversified and increased as society and knowledge become more complex and specialized. There are three components that influence this satisfaction. The first is the cognitive aspect, i.e., the beliefs and ideologies that the person has toward their work. This is then followed by the affective aspect, which includes the emotions experienced when carrying out work and feeling that one is a part of it. Finally, there is the behavioral aspect, which refers to the very behavior that the individual carries out in the performance of their job [
10]. If, in addition to these components, other factors are considered, such as relationships with co-workers, superiors, and students, a more complex system is thus formed. A teacher resorts to various aspects of work—operational, social, and affective—to obtain a positive and optimistic attitude in the face of job pressures [
11]. According to Robbins [
12], job satisfaction is a positive emotional state that results from the subjective perception of the teacher’s experiences toward their work environment.
To measure job satisfaction, it is considered a multifaceted construct. In their measurement, Howard and Frink [
13] include employee perceptions about work elements, such as relationships with the boss, satisfaction with the job itself, relationships with colleagues, and economic perceptions. On the other hand, in another investigation, it is considered that the teacher satisfaction measurement scale measures two factors: intrinsic satisfaction, which includes the sub factors of independence, variety, academic freedom, career line, and recognition and distinctions; and extrinsic satisfaction, which includes the sub factors of economic compensation, working conditions, job security, status, the quality of interpersonal relationships, and training and teacher improvement [
7].
For García [
14], job satisfaction refers to the level of achievement achieved at work. The author also considers job satisfaction to be a multidimensional construct due to its nature. Ingresoll [
15] establishes that a teacher can be satisfied with his or her profession but dissatisfied with the working conditions in which they find themselves, and that the teacher will surely change his or her workplace as soon as possible if this is the case. In measuring this construct, the latent variables developed by García [
14] included: “I would like to change schools if this were possible”, “I like working in this school”, “I would recommend this institution as a good place to work”, and “in general I am satisfied with my work”.
1.1.2. Professional Satisfaction
In most investigations, professional satisfaction is considered as a synonym or part of job satisfaction; however, in this investigation, it was decided that a distinction be drawn between the two concepts, as there are cases in which a teacher may be dissatisfied with the teaching profession regardless of the workplace [
14]. For Díaz [
16], the professional satisfaction of teachers can be understood as a result of comparing the teaching profession with the situation in reality and the way it should be according to their expectations. For Spanish researchers, professional satisfaction is defined as the well-being of teachers. It is linked to the exercise of their profession and considers attitudes and feelings based on teachers’ beliefs, values, interests, characteristics, and competencies [
17]. In this sense, it can be considered that satisfactory experiences lead to personal professional development, and unsatisfactory ones lead to frustration and a lack of interest in the needs of students. It can be seen that there is no universal definition of professional satisfaction. It often depends on the interest of the researcher, and it can be perceived as an attitude, emotion, or feeling; it can also be related to the organizational climate, mental health, and balance of each person. In measuring this construct, the latent variables developed by García [
14] included: “the advantages of being a teacher clearly outweigh the disadvantages”, “if I could make up my mind again, I would continue to choose to work as a teacher”, “I regret having decided to be a teacher”, and “I wonder if it would have been better to choose another profession”.
1.1.3. Distributed Leadership
Leadership has been investigated for many years, and there are several theories that analyze it. McGregor [
18] conducted a comparison of styles in the way in which an institution is managed or lead. Chiavenato [
19] also considers that a leader must have good relationships with their collaborators, and that teamwork is promoted in order to achieve the objectives of an organization. Bolívar [
20] defines leadership as the ability to influence a group of people to carry out actions that improve institutions, and Chiclla and Marín [
21] consider leadership as the art of guiding the collaborators of an institution in a single vision through persuasion, thought, suggestions, will, and the ability to achieve objectives.
Through research on leadership and teacher job satisfaction, researchers have concluded that leadership strongly influences teacher job satisfaction [
22]. However, in this research, distributed or shared leadership was considered, which can be defined as an analytical tool that is based more on relationships than on individual actions [
23]. According to Spillane [
24], distributed leadership is the result of the interaction between the leaders, their followers, and the school context. Furthermore, this involves many people in a formal and non-formal context. For Gronn [
25], leadership does not necessarily focus on a person or category of people; it goes beyond formal writings, and it sometimes arises spontaneously through formed collaboration throughout the social and contextual situation of the school.
Distributed leadership is a trend in today’s knowledge-based organizations, and it is present in more demanding environments and those with flatter hierarchical structures. It is also an attribute of organizations that is necessarily shared and includes guiding, creating, or maintaining motivation and piloting changes. It is implemented with a style of delegation that operates without confusing the transfer of leadership with that of work, and it is contingent on moral authority and influence to convince and resolve conflicts [
26].
In addition to this, García [
27] considers distributed leadership to be a model that focuses on the interaction between employees instead of their actions, and there should be a recognition of the contribution of the employees even if they are not formally designated as leaders. Harris [
28] also considers distributed leadership to be a new type of leadership based on morality, which is centered on values, the promotion of socialization, and the distribution of values within the group. García [
29] suggests that a kind of conduct is required that focuses on the development of people individually and collectively, a visionary direction that assumes risks and is directly involved in pedagogical decisions. This approach should be well formed in the processes of change and would be obtained through the commitment of directors and the synergy of all in decisions as to how to achieve better quality and equitable schools. Distributed leadership allows us to understand leadership as a dynamic process, instead of a static role, in which several people can take part in leadership activities to achieve shared goals. Organizational culture, mainly leadership, has a particularly strong and positive impact on worker job satisfaction [
30].
In Mexico, the construction of a labor demands–resources scale was developed to measure work stress [
31]; in it, a group of factors called labor resources is represented, including the “Autonomy” factor, which—due to its content in the items—is the equivalent of the distributed leadership variable. The latent variables for this construct were as follows: “I participate in decision-making at work”, “I feel responsible and make decisions at work”, “I feel important because I participate in the decisions that are made at work”, “I have freedom to make decisions”, and “I have the confidence to be able to make decisions in my work”.
Within these constructs, the concept of labor relations was also included. Labor relations is a term that can broadly connote the different activities of a professional school, including collegiate actions, learning communities, teams, collaboration in professional networks, etc. [
32]. In this study, collaboration refers to the specific actions considered in the “Work relationships” subscale and includes three items: the head of the department supports me in the case of a conflict between myself and a student, relations between fellow academics are generally good, and I worry about the incompetence of other academics in front of students. These items were based on the Nursing Occupational Stressors Scale [
33].
1.1.4. Perception of Insecurity
Unfortunately, according to the latest statement from the National Institute of Statistics and Geography (INEGI) in October 2022, insecurity in Mexico has increased in recent years. A total of 64.4% of the population aged 18 years and over consider living in Mexico to be unsafe. In their respective cities, this sample reported that 70.5% are women, and 57.2% are men [
34]. For teachers and school communities, insecurity has brought incredibly serious consequences; furthermore, it poses unprecedented challenges for teachers and their personal lives, and these include feelings of risk and fear [
35]. The fear of being a victim of a crime or knowing that other people have been violated is related to the perception of insecurity [
36]. The perception of insecurity can be considered as the exposure of teachers to robberies, assaults, and attacks in the vicinity of the educational center or even within it [
37]. In Spain, the Centro Empresarial de Málaga (CEM) classifies these acts as type 1 violence, which implies violent acts by people who are not related to the work itself and are considered a psychosocial risk [
38]. This research seeks to identify the relationship that exists between the perception of insecurity and the job satisfaction of teachers. For the measurement of the construct of the perception of insecurity, five items were used: “I am afraid of insecurity within my institution”, “There are frequent assaults and robberies”, “I am worried about being assaulted at work”, and “The security measures are inadequate and there is excessive noise in the buildings where I teach”. These items were obtained from the scale proposed by Unda [
37] on the perception of insecurity, because it is particularly consistent with the situation of insecurity in the region in which this research was carried out.
1.1.5. Proposed Theoretical Model
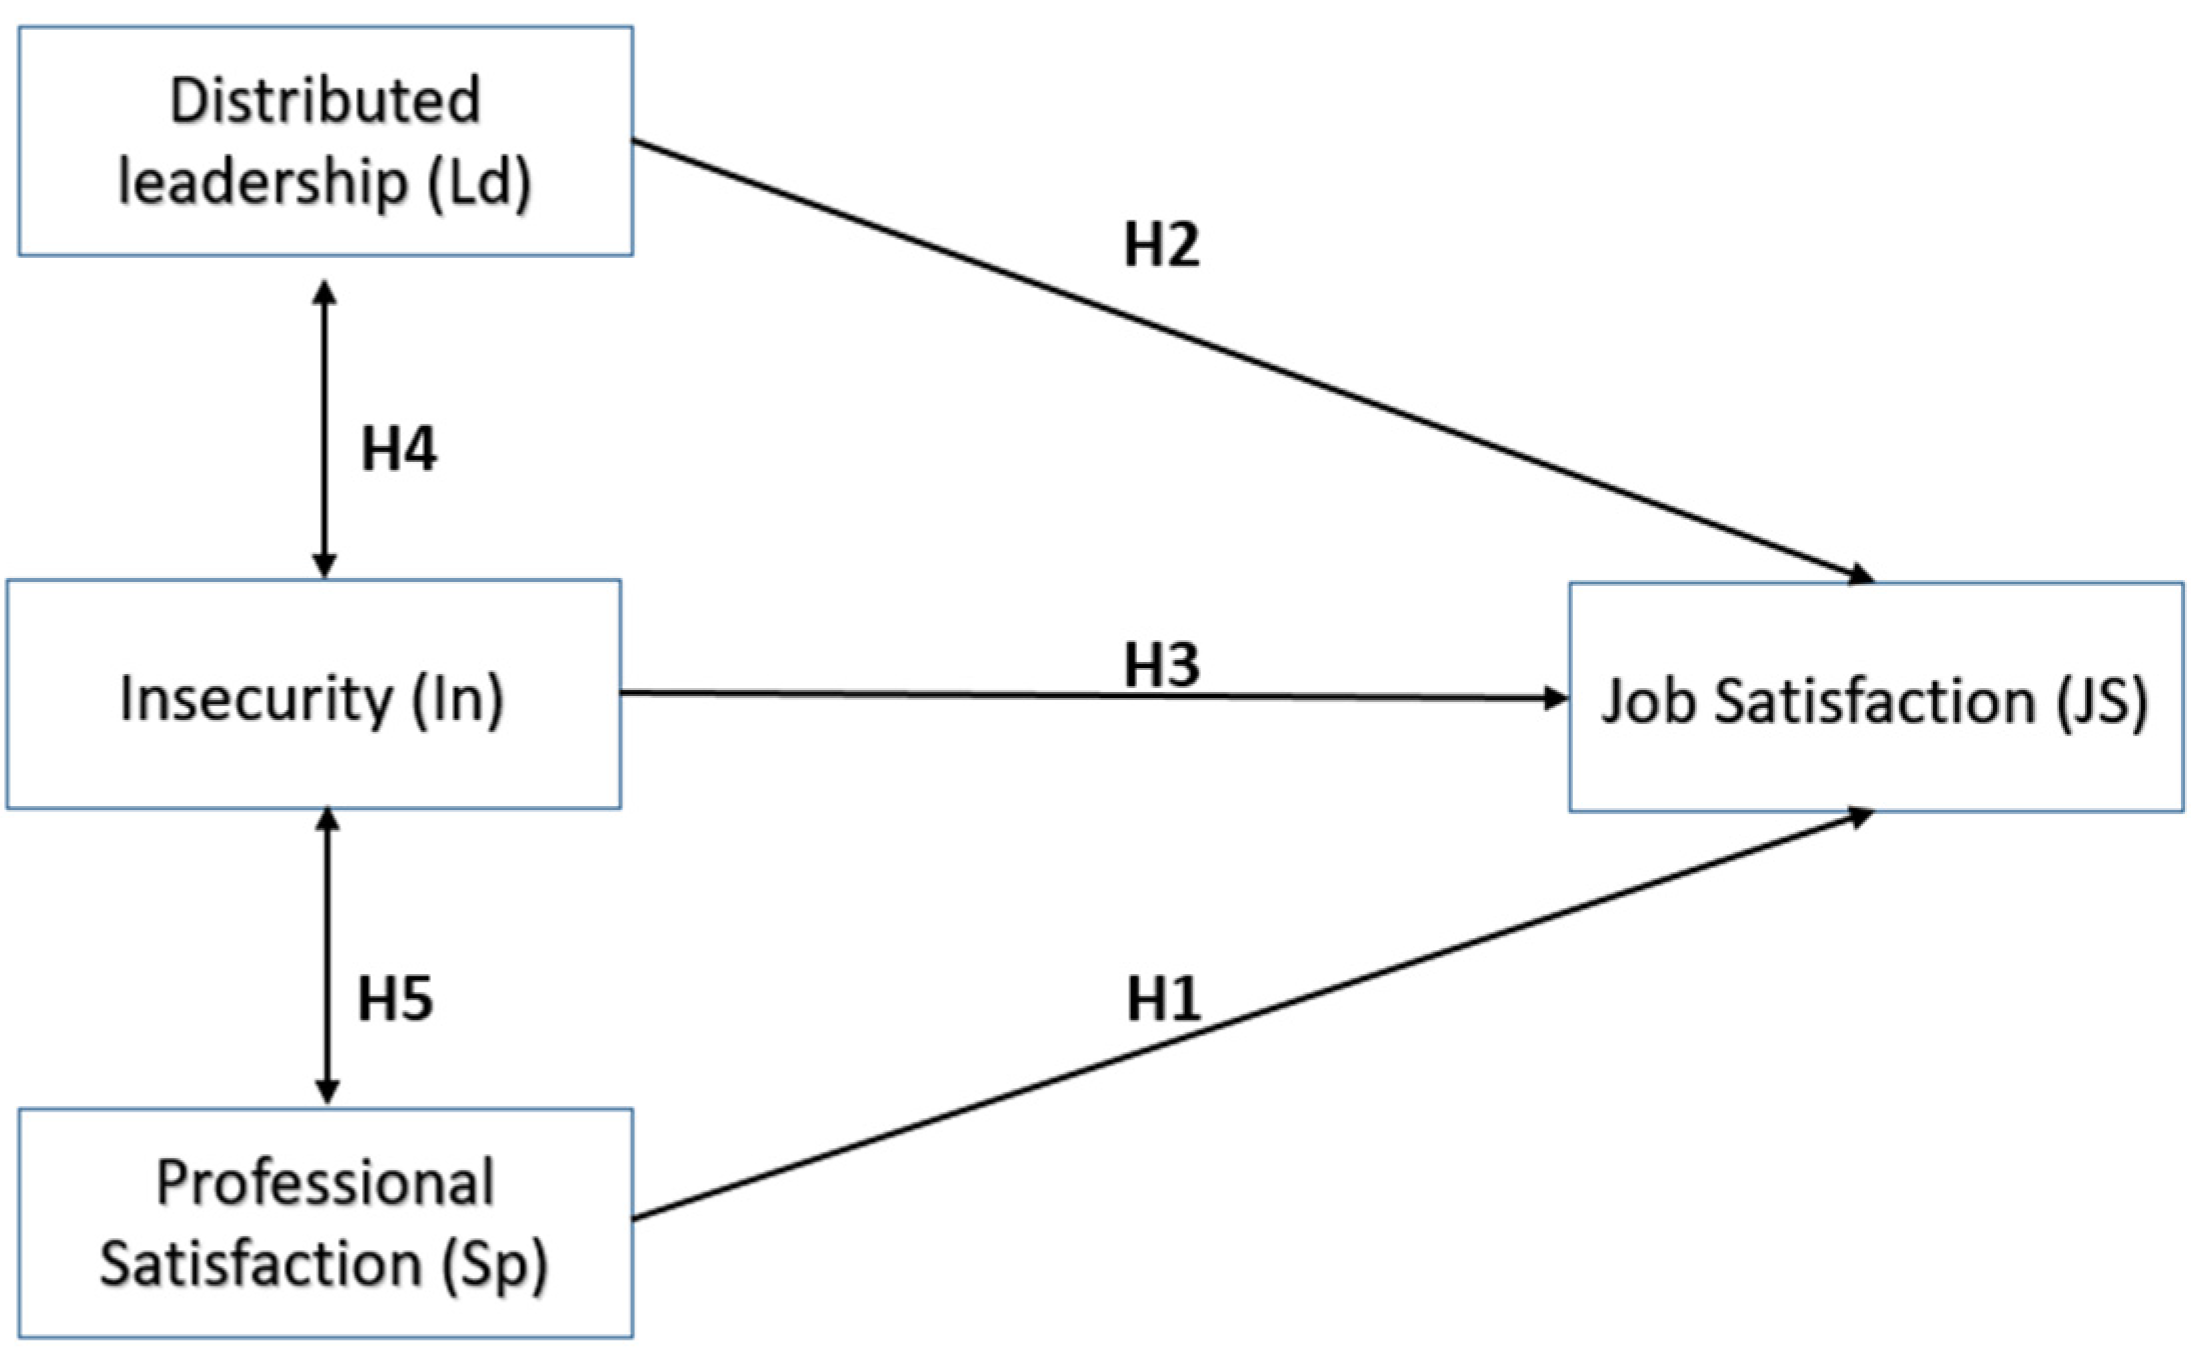
The hypothetical relationships are presented in
Figure 1, which shows the relationships between the variable of job satisfaction and the variables of distributed leadership and professional satisfaction, as well as the relationships between the perception of insecurity with distributed leadership and professional satisfaction.
The proposed hypotheses are:
H1. Job satisfaction has a significant positive relationship with professional satisfaction.
H2. Distributed leadership has a significant positive relationship with job satisfaction.
H3. The perception of unsafety has a significant negative relationship with job satisfaction.
H4. The variables of perception of unsafety and distributed leadership have a significant positive relationship.
H5. The variables of perception of unsafety and job satisfaction have a significant positive relationship.
2. Materials and Methods
2.1. Data
This research was of a non-experimental type, since the variables were not manipulated, i.e., the independent variable was not intentionally modified to determine its effect on the dependent variable. Due to its temporality, the research was cross-sectional, because it was developed at a specific moment; it is descriptive, and it seeks to show the main characteristics of the population under study. Finally, it is correlational, because it analyzes the degree of association between the study variables and the incidences of each. An exploratory factorial analysis study was carried out to explore the factorial structure of the initial proposed model; then, a confirmatory factorial analysis was carried out for the latent variables of the model and to verify whether the data support the proposed factorial structure and structural equation model. The study was conducted in the months of July and August of the year 2022.
2.2. Sample
The selected sample was non-probabilistic for convenience. It included 5 higher-level institutions from the central region of Mexico; specifically, it included the cities of Celaya, Salamanca, Santa Cruz de Juventino Rosas, Cortazar, and Villagran in the state of Guanajuato (Mexico). The study was conducted with a total participation of 300 academics, on a completely voluntary and anonymous basis, so as to protect the personal data of those who responded.
2.3. Application
The academics answered questions from an instrument made up of the following dimensions: “Distributed leadership” based on the labor demands–resources scale carried out by Patlán [
31] and labor relations based on the scale of occupational stress factors for nurses [
33]; “Job satisfaction” and “professional satisfaction” based on the research of García [
14]; and “Perception of insecurity” based on the scale proposed by Unda [
37]. The questionnaire had a Likert-scale format with a choice of 5 answers: level 1 was for the lowest level of satisfaction, and 5 was for the highest. For the application of the final instrument, it was created on a digital Google platform and shared in the emails of university academics, including an invitation letter to answer the surveys that included the research objectives. The information was processed in Jamovi software.
2.4. Analytical Method
An exploratory factor analysis (EFA) was carried out, which is a technique used in the development, validation, and adaptation of instruments. Later, a confirmatory factor analysis was conducted through the technique of structural equation models (SEM), whose objective is to contrast hypotheses in the form of relationships between constructs [
39].
2.5. Control Variables
Based on previous research, the variables of gender, age, marital status, maximum level of studies, type of university, type of contract, and experience were considered important. In this investigation, 158 women participated, i.e., 52.7%, and the rest were men; 63.3% had a marital status of married, and 36.7% were single; 95% worked in a public institution, and 5% in a private one; and 6% were over 66, 20% between 56 and 65, 30% between 46 and 55, 27% between 36 and 45, 16% between 25 and 35, and the rest were under 25 years. Regarding the maximum level of studies, 20% mentioned having a bachelor’s degree, 48% a master’s degree, 28% a doctorate, and 4% a post-doctorate. In the type of contract variable, 53% were full-time academics, 3% worked ¾ of the time, 2% were part-time, 10% were by subject, and 31% worked for fees. Finally, 3% had less than one year of experience, 30% had from 1 to 9 years, 30% had from 10 to 19 years, 21% from 20 to 29 years, and 17% had over 30 years.
2.6. Independent Variables
The independent variables in this study are the distribution of leadership, the perception of insecurity, and professional satisfaction. In this research, the distributed leadership variable includes the measurement of participation in decision making and work relationships, as presented in the research by [
14]. For the first variable, the items considered were as follows: “I participate in decision-making at work”, “I feel responsible and make decisions at work”, “I feel important because I participate in the decisions that are made at work”, “I have the freedom to make decisions”, “I am confident that I can make decisions in my work”, “the head of the department supports me in case of a conflict between me and a student”, “relationships between fellow academics are generally good”, and “I worry about the incompetence of other academics in front of the students.” For the variable of perception of insecurity, the items considered were as follows: “I am afraid of insecurity within my institution”, “There are frequent assaults and robberies”, “I am worried about being assaulted at work”, and “The security measures are inadequate and there is excessive noise in the buildings where I teach”. Professional satisfaction included the following items: “The advantages of being a teacher clearly outweigh the disadvantages”, “If I could decide again, I would continue choosing to work as a teacher”, “I regret having decided to be a teacher”, and “I wonder if it would have been better to choose another profession”.
2.7. Dependent Variables
The dependent variable is the job satisfaction of the academics, and it is based on the research in [
14]; furthermore, it was formed as a construct composed of the following 4 items: “I would like to change to another school if that were possible”, “I like working in this school”, “I would recommend my institution as a good place to work”, and in general, “I am satisfied with my job”.
4. Discussion
The objective of this research was to identify the relationship between job satisfaction, professional satisfaction, distributed leadership, and the perception of insecurity for academics at five universities located in the state of Guanajuato.
Below are the answers to the hypotheses raised previously.
Hypothesis 1. Relationship between job satisfaction and professional satisfaction.
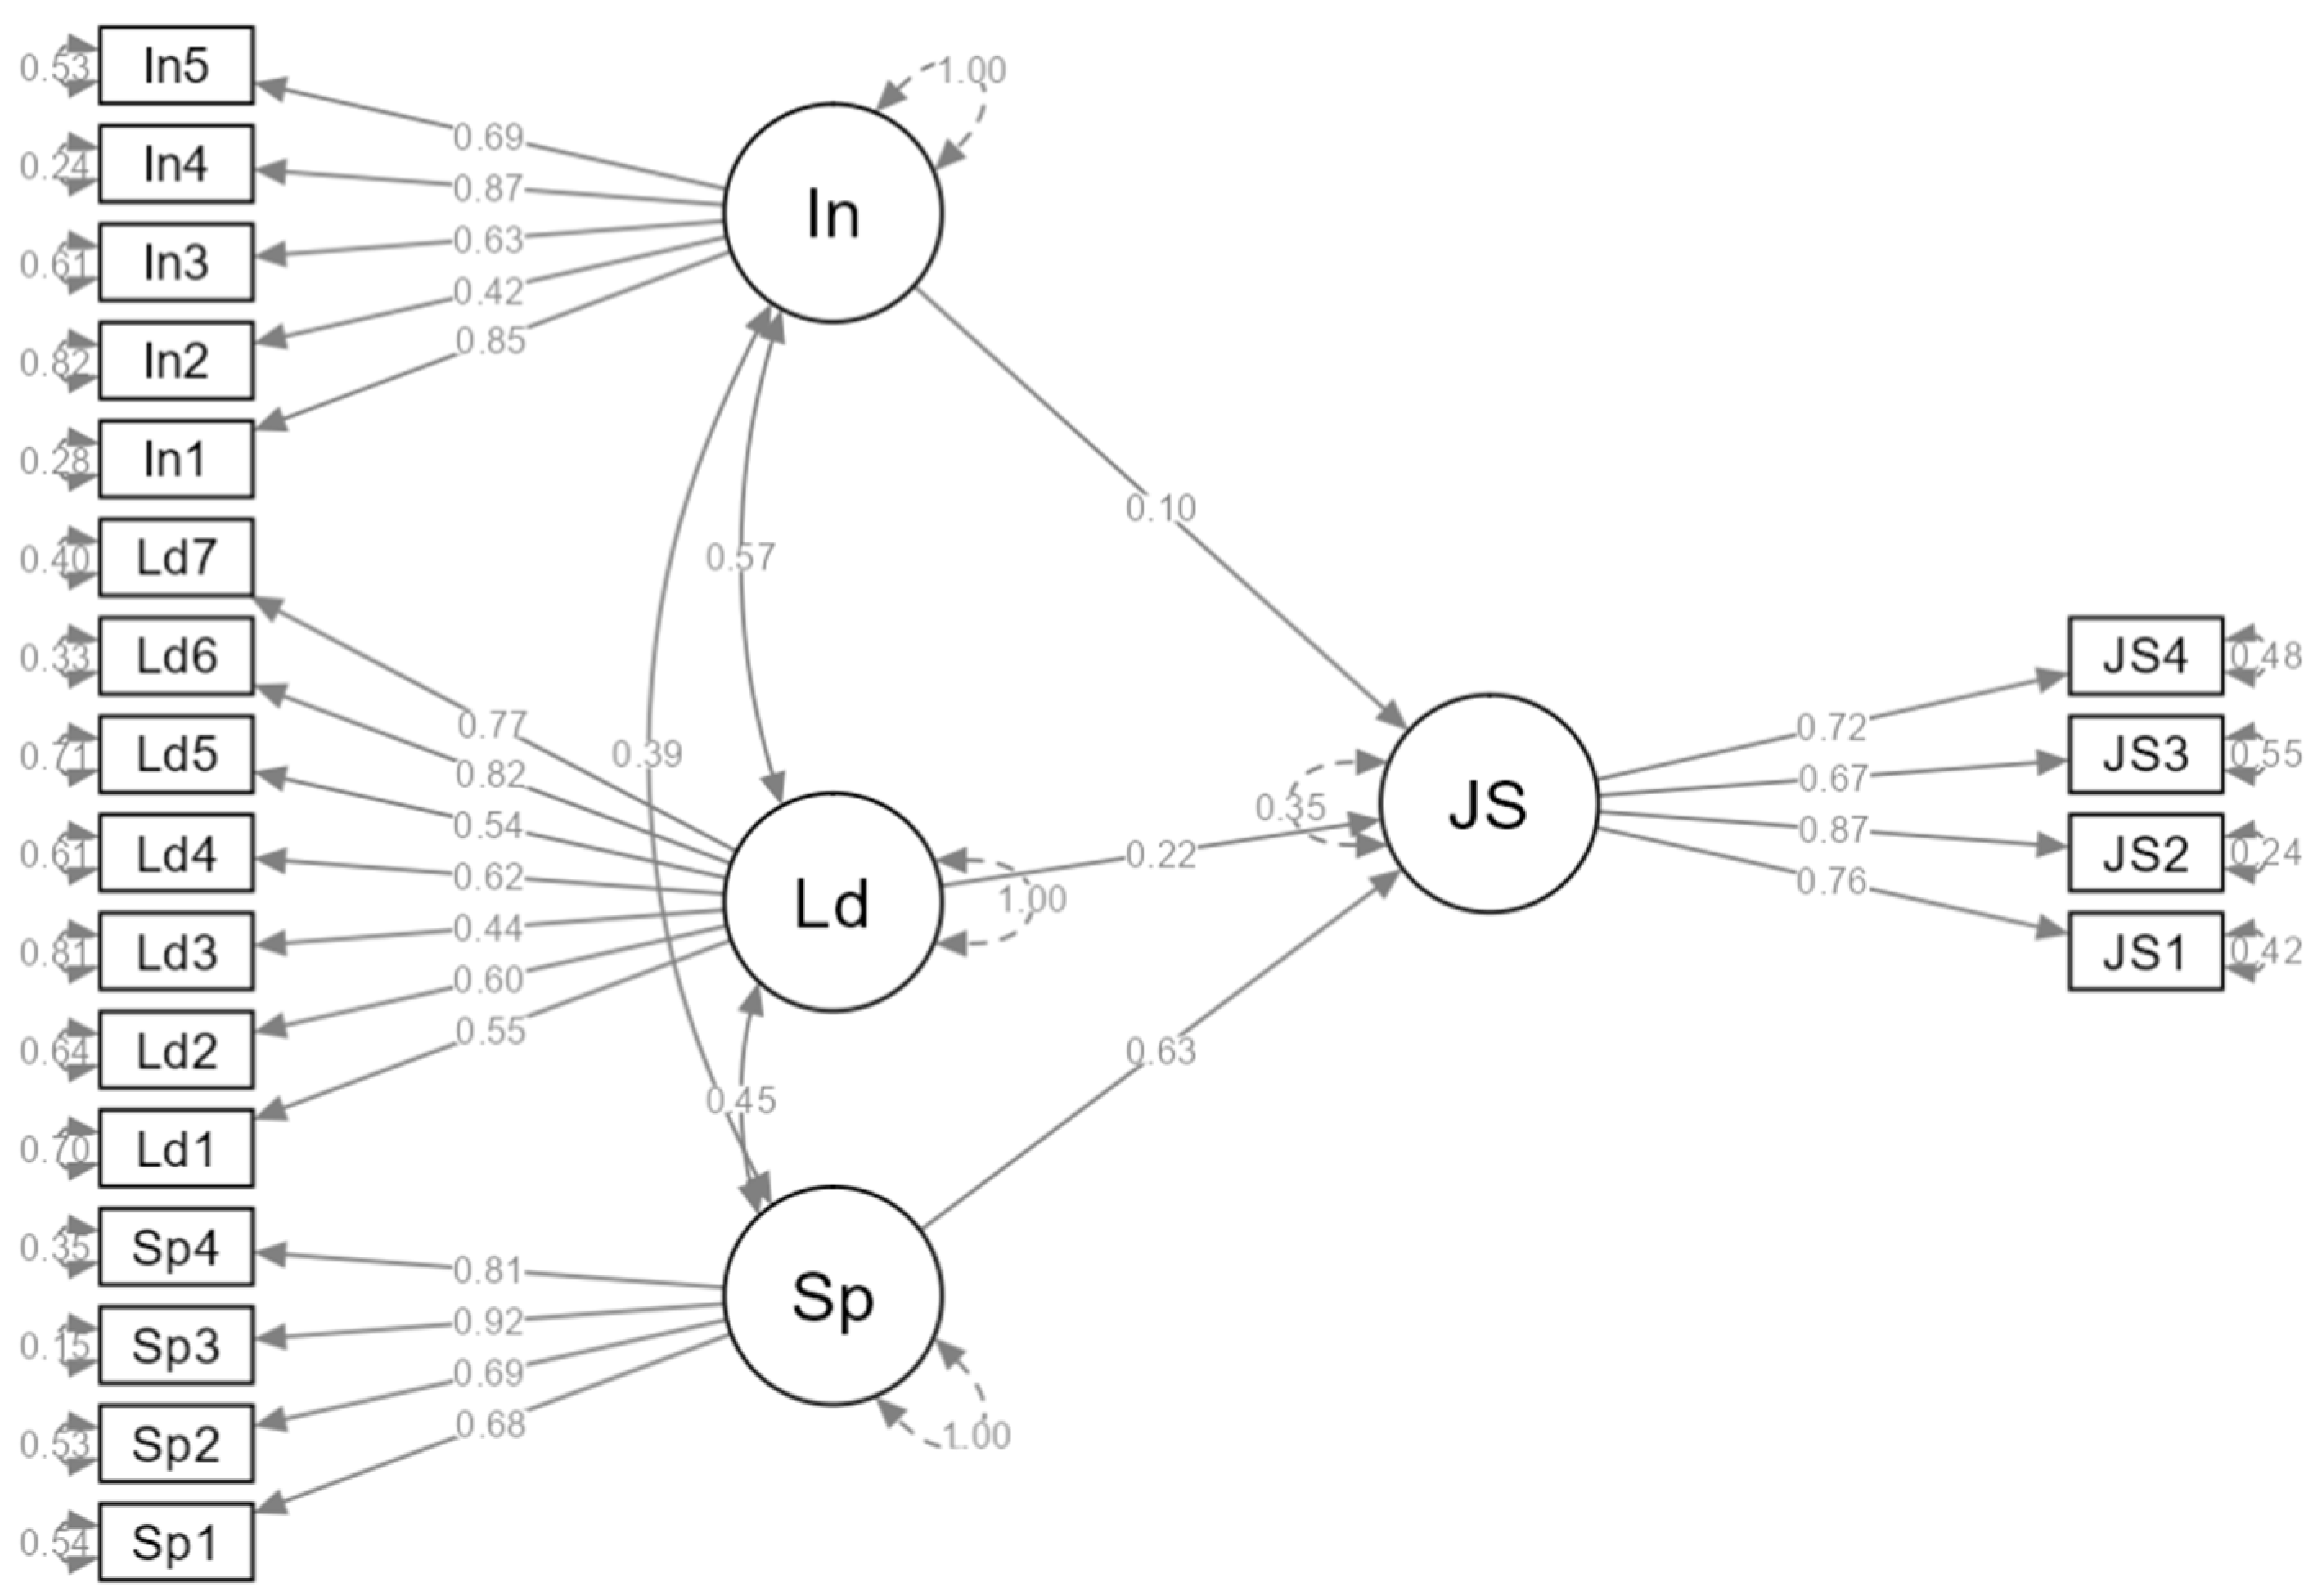
In the final model, a positive association is presented, with a β value of 0.625. Any loads that are greater than 0.3 in absolute value are considered optimal [
47], as they indicate that there is a significant direct relationship between two latent variables. In other words, academics consider that the satisfaction they obtain for having decided to dedicate themselves to teaching is related to the satisfaction of working in their current workplace. The results coincide with those obtained by García [
14]. In this way, the proposed hypothesis is confirmed.
Hypothesis 2. Relationship between job satisfaction and distributed leadership.
In this research, by taking into account that distributed leadership is considered to be the result of social interaction or collaboration, and that it involves many people in a formal and non-formal context, the relationship between job satisfaction and distributed leadership was found to be positive but not significant, with a β value of 0.22. Therefore, the academics considered that having job satisfaction is not significantly related to distributed leadership, which is contrary to the results obtained in [
22], whereby it was found that there is a particularly strong relationship between the two variables. This is similar to the results of García [
14], who in his research found a particularly strong significant association in both variables, especially in the personal perception of job satisfaction that academics may have. In the same way, in the study of [
30], it was concluded that there is an incredibly strong relationship between these two variables. The results of this research are surprising and do not confirm the proposed hypothesis; thus, it is to be the subject of another study for identifying teacher reasons for not considering this relationship to be significant.
Hypothesis 3. Relationship between job satisfaction and perception of insecurity.
Several investigations established that there is an especially strong relation between the perception of insecurity and the development of job activity [
48]. In the research carried out by García [
14], it was considered that violence and crime significantly influence the job satisfaction of academics, and that academics who are working in schools with higher levels of insecurity tend to have lower job satisfaction. In this research, the relationship was found to be particularly small, with a beta β value of 0.10; thus, it can be considered non-significant. The proposed hypothesis contemplates a negative relationship between the variables; however, although it is not significant, it was not negative, perhaps due to the fact that the academics have become accustomed to carrying out their teaching tasks in the context of the insecurity that the country is experiencing and do not consider insecurity to be a factor that affects job satisfaction.
Hypothesis 4. Relationship between the perception of insecurity and distribution of leadership.
The issue of insecurity in a country such as Mexico—even more so in the state of Guanajuato, which has the highest rates of crime—is such that the perception of insecurity had a positive influence, with a β value of 0.57, and this is related to the interaction or social collaboration between academics, their authorities, and colleagues in formal and non-formal contexts. This means that the authorities and academics have established strategies to feel safer in their work areas. In an investigation carried out in Italy on positive psychology, it was concluded that academics are increasingly exposed to violence from students, parents, and the environment outside the institution. As a result, they generated an increased capacity to deal with violence, developed a more resilient mentality, and built positive environments thanks to good relationships with co-workers and distributed leadership [
49]. The hypothesis raised in the investigation is thus confirmed.
Hypothesis 5. Insecurity and job satisfaction.
Academics are workers who are at risk of violence, and this can come from students, parents, and colleagues; they need training that allows them to increase their ability to manage and deal with violent behavior [
50]. In this research, the relationship between insecurity and job satisfaction is particularly small, with a beta β value of 0.20; thus, it can be considered insignificant. Academics do not consider insecurity to be a factor that influences professional satisfaction. It is likely that academics have increased their ability to handle violent behavior. With the results obtained, it is not possible to accept the proposed hypothesis.
5. Conclusions
There are several investigations that have related the job satisfaction of university academics with other variables; for example, Alvarez [
6] used the variable of work pressure with that of job satisfaction and found that there is an inverse relationship between the two. Rodas and Pérez [
22] used the variable of leadership influence and concluded that there is a positive and especially high relationship between the two. The research by [
1] showed that there is a particularly strong and positive relationship between the job satisfaction variable and the variables of academic level, supervision, participation, physical environment, benefits, and age. Another example is that of certain Chinese researchers [
51] who, in their research, provide evidence that self-efficacy has a mediating effect between stress and job satisfaction. An important investigation is presented in [
14], which reveals that university academics perceive the distribution of leadership in a positive and significant manner with job satisfaction.
In this research, the relationships between the constructs of distributed leadership, insecurity, and personal satisfaction with the variable of job satisfaction were identified. The results show that there is a positive association between job satisfaction and professional satisfaction, i.e., academics consider that the satisfaction they obtain for having decided to dedicate themselves to teaching is related to the satisfaction of working in their current workplace. Regarding the relation between the job satisfaction and distributed leadership constructs, the relationship was found to be positive but not significant, indicating that the teacher perception of distributed leadership is not related to job satisfaction. Lastly, the job satisfaction and perception of insecurity constructs showed a non-significant relationship; to explain this, it was considered that academics have become accustomed to carrying out their teaching tasks in the scenario of insecurity in which the country unfortunately lives, and that they do not consider insecurity to be a factor that influences job satisfaction. The perception of the variables of insecurity and distributed leadership presented particularly high relationship results; in fact, this was the highest relationship of all the latent variables. It is possible that academics have devised strategies between themselves and the authorities to avoid or get rid of the insecurity that is unfortunately present in the region. The last relationship studied in this research was that between the latent variables of insecurity and professional satisfaction; however, they did not present a significant relationship.
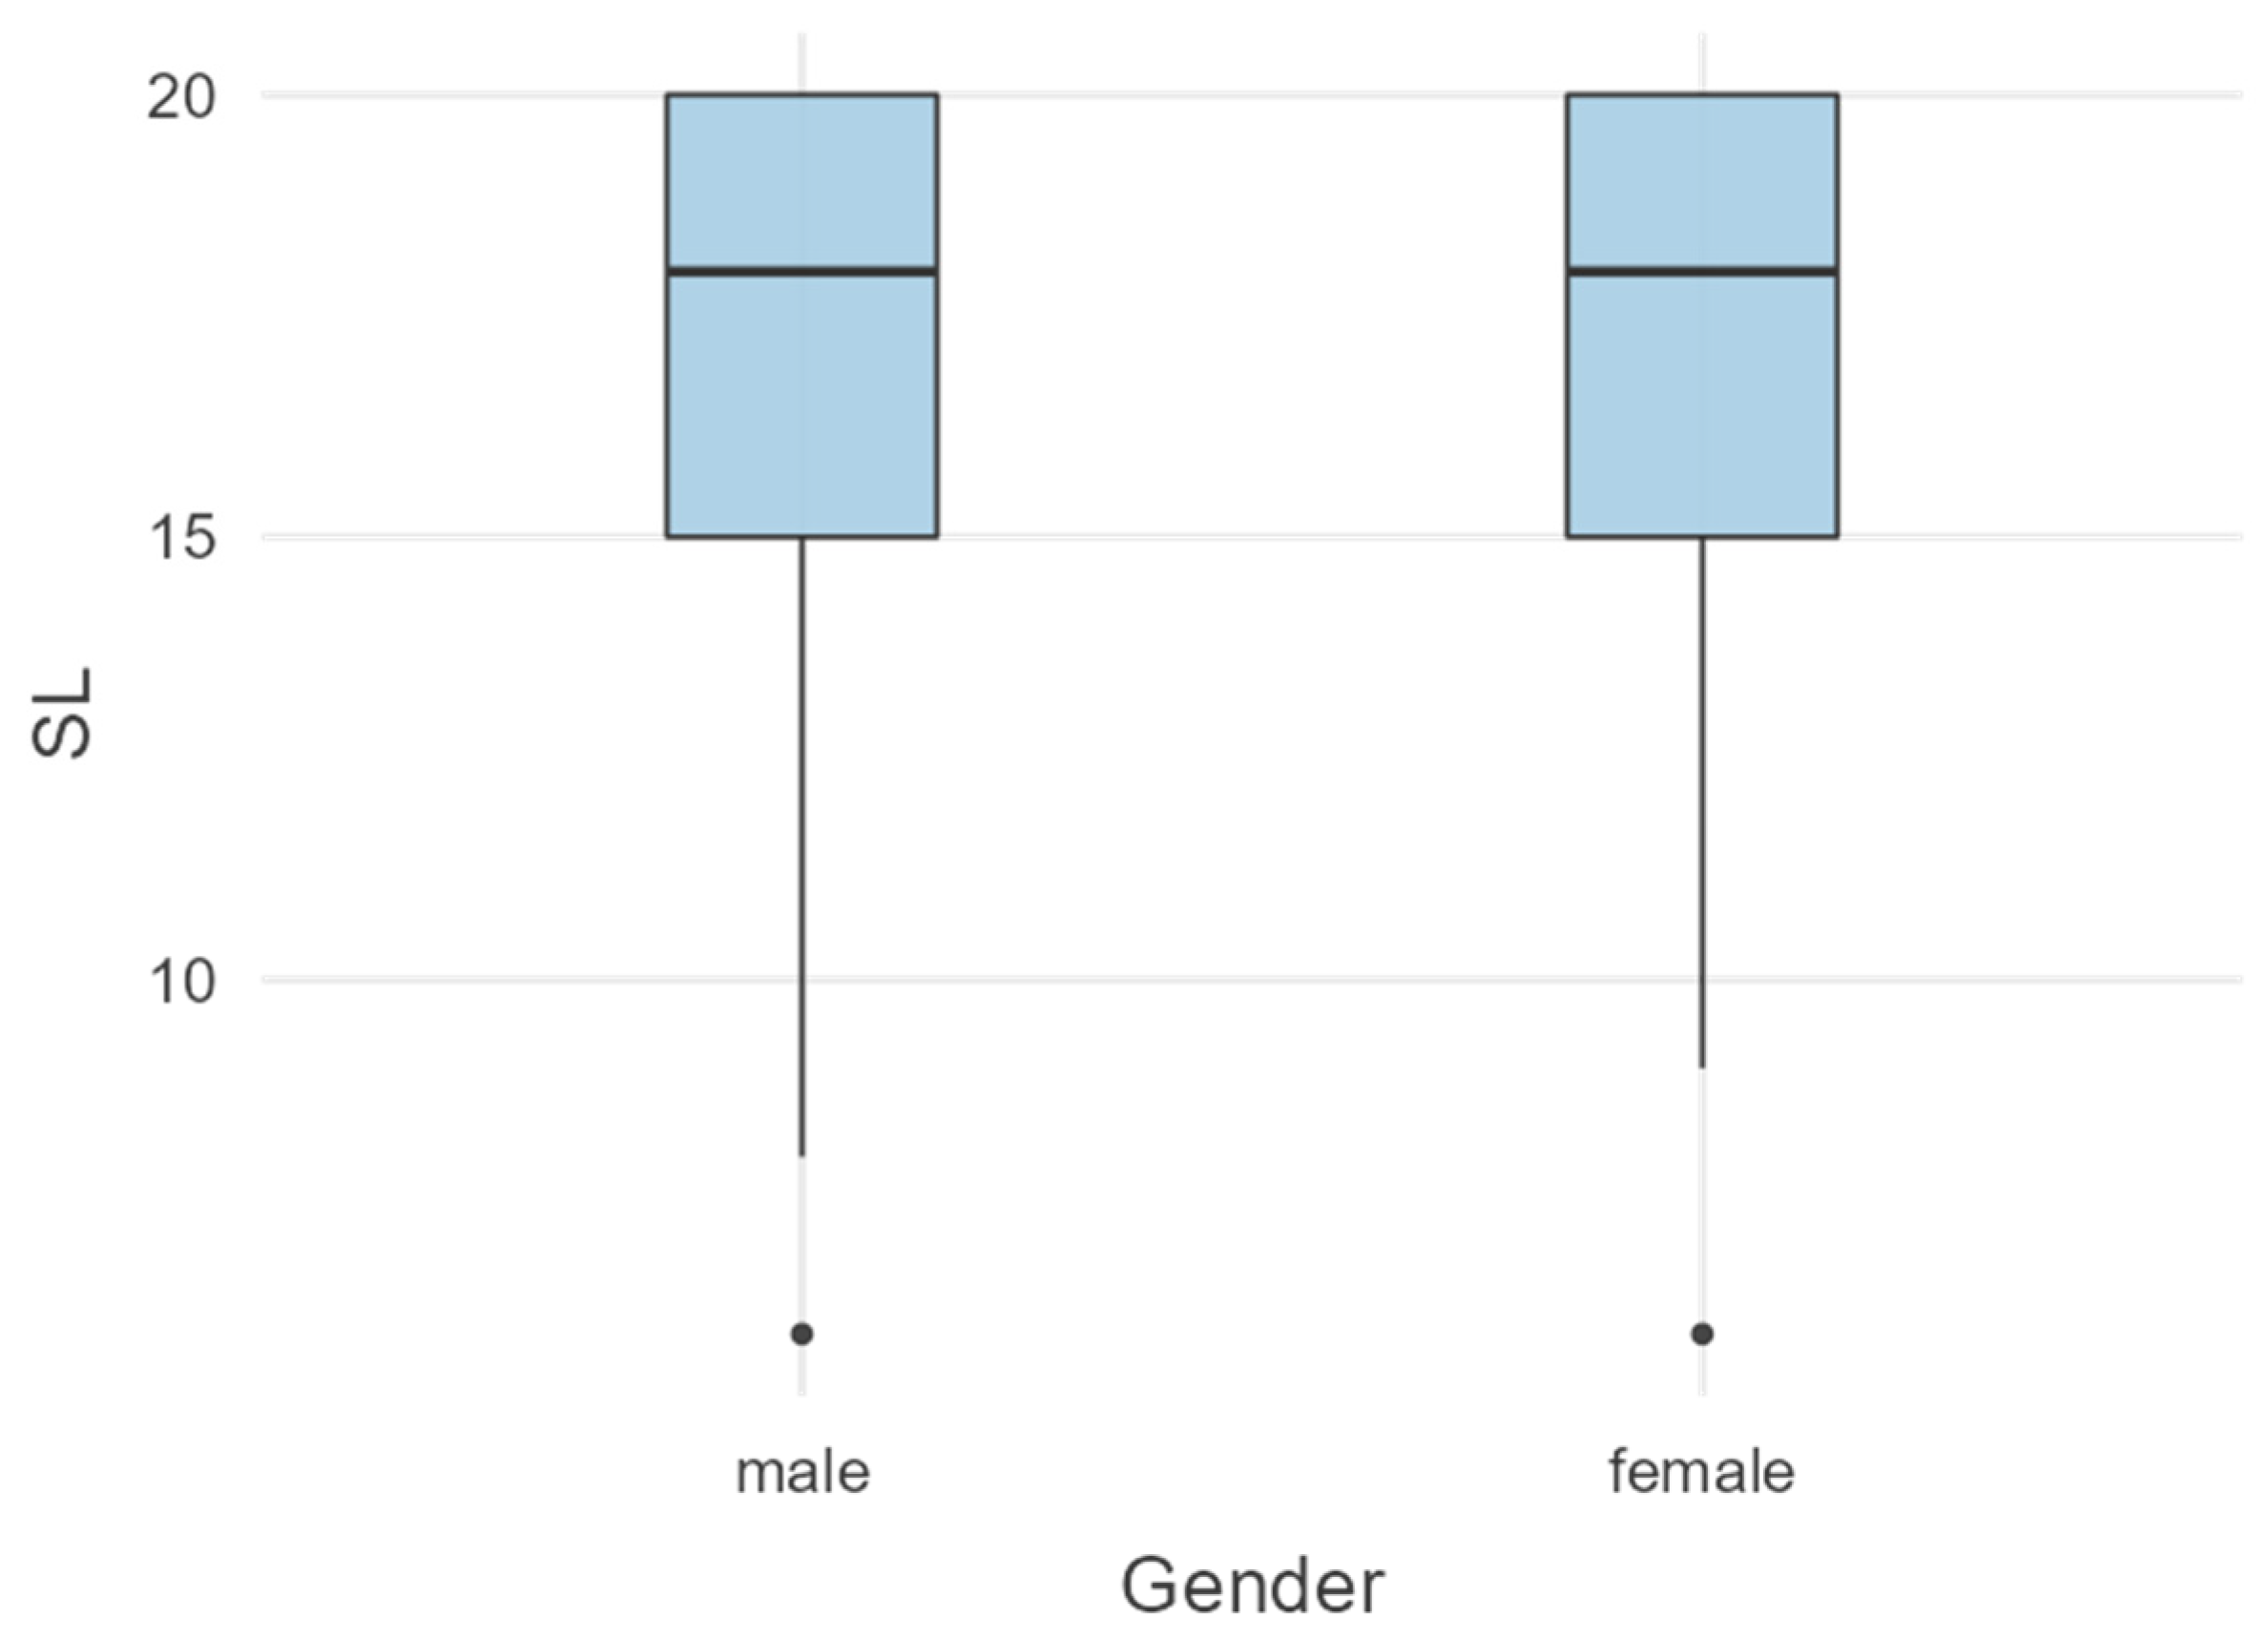
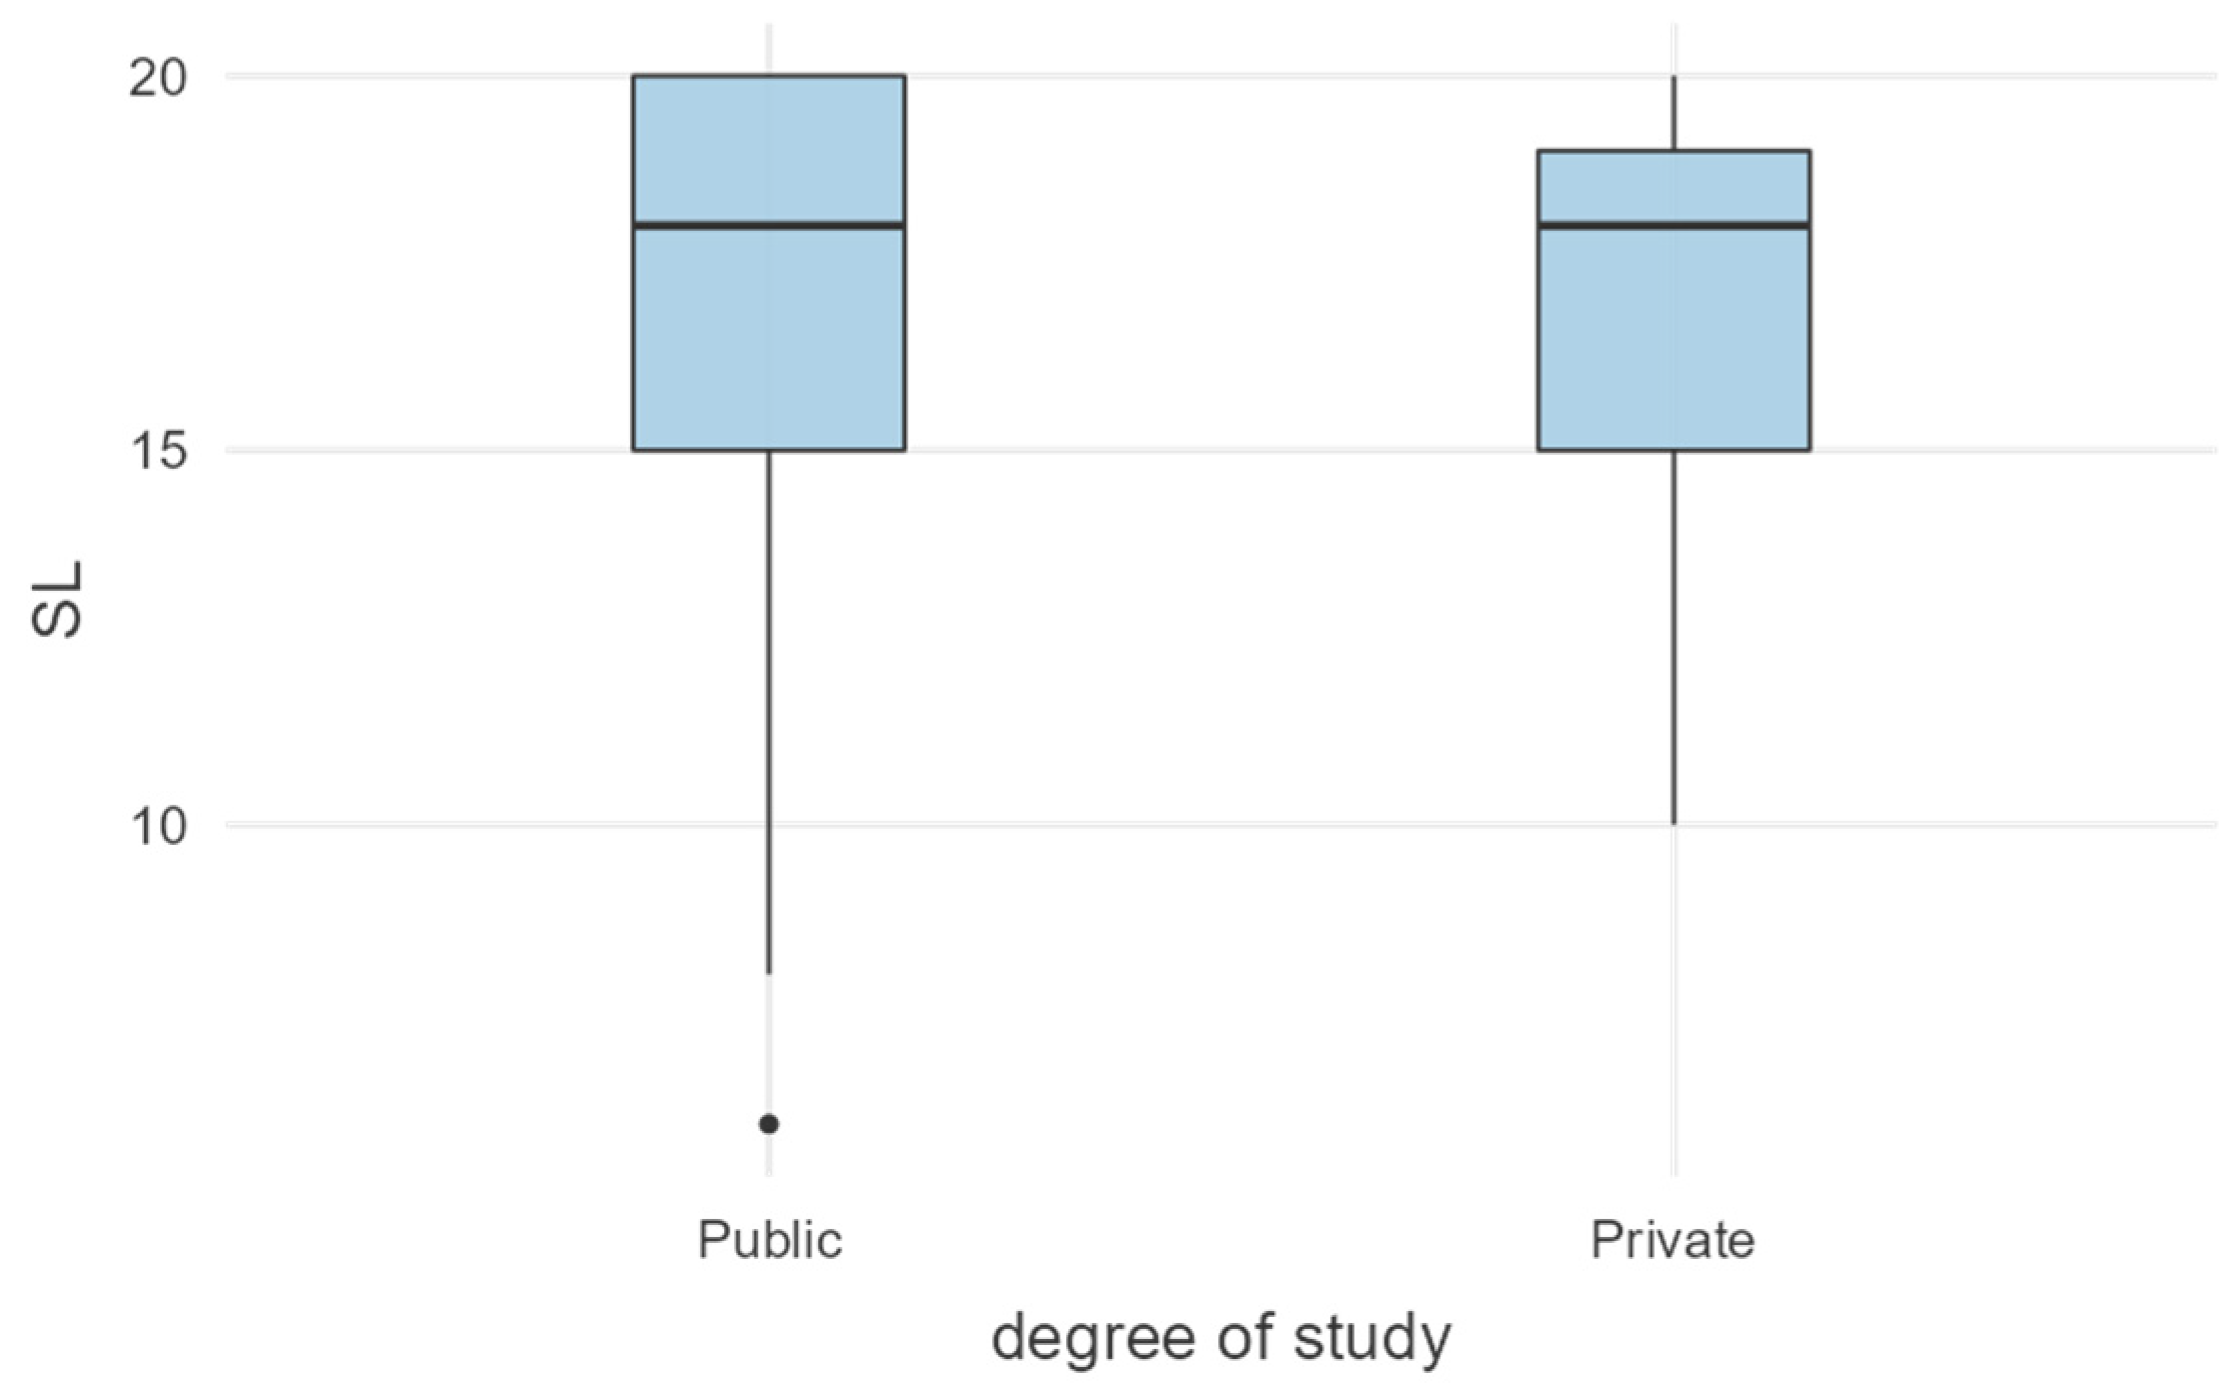
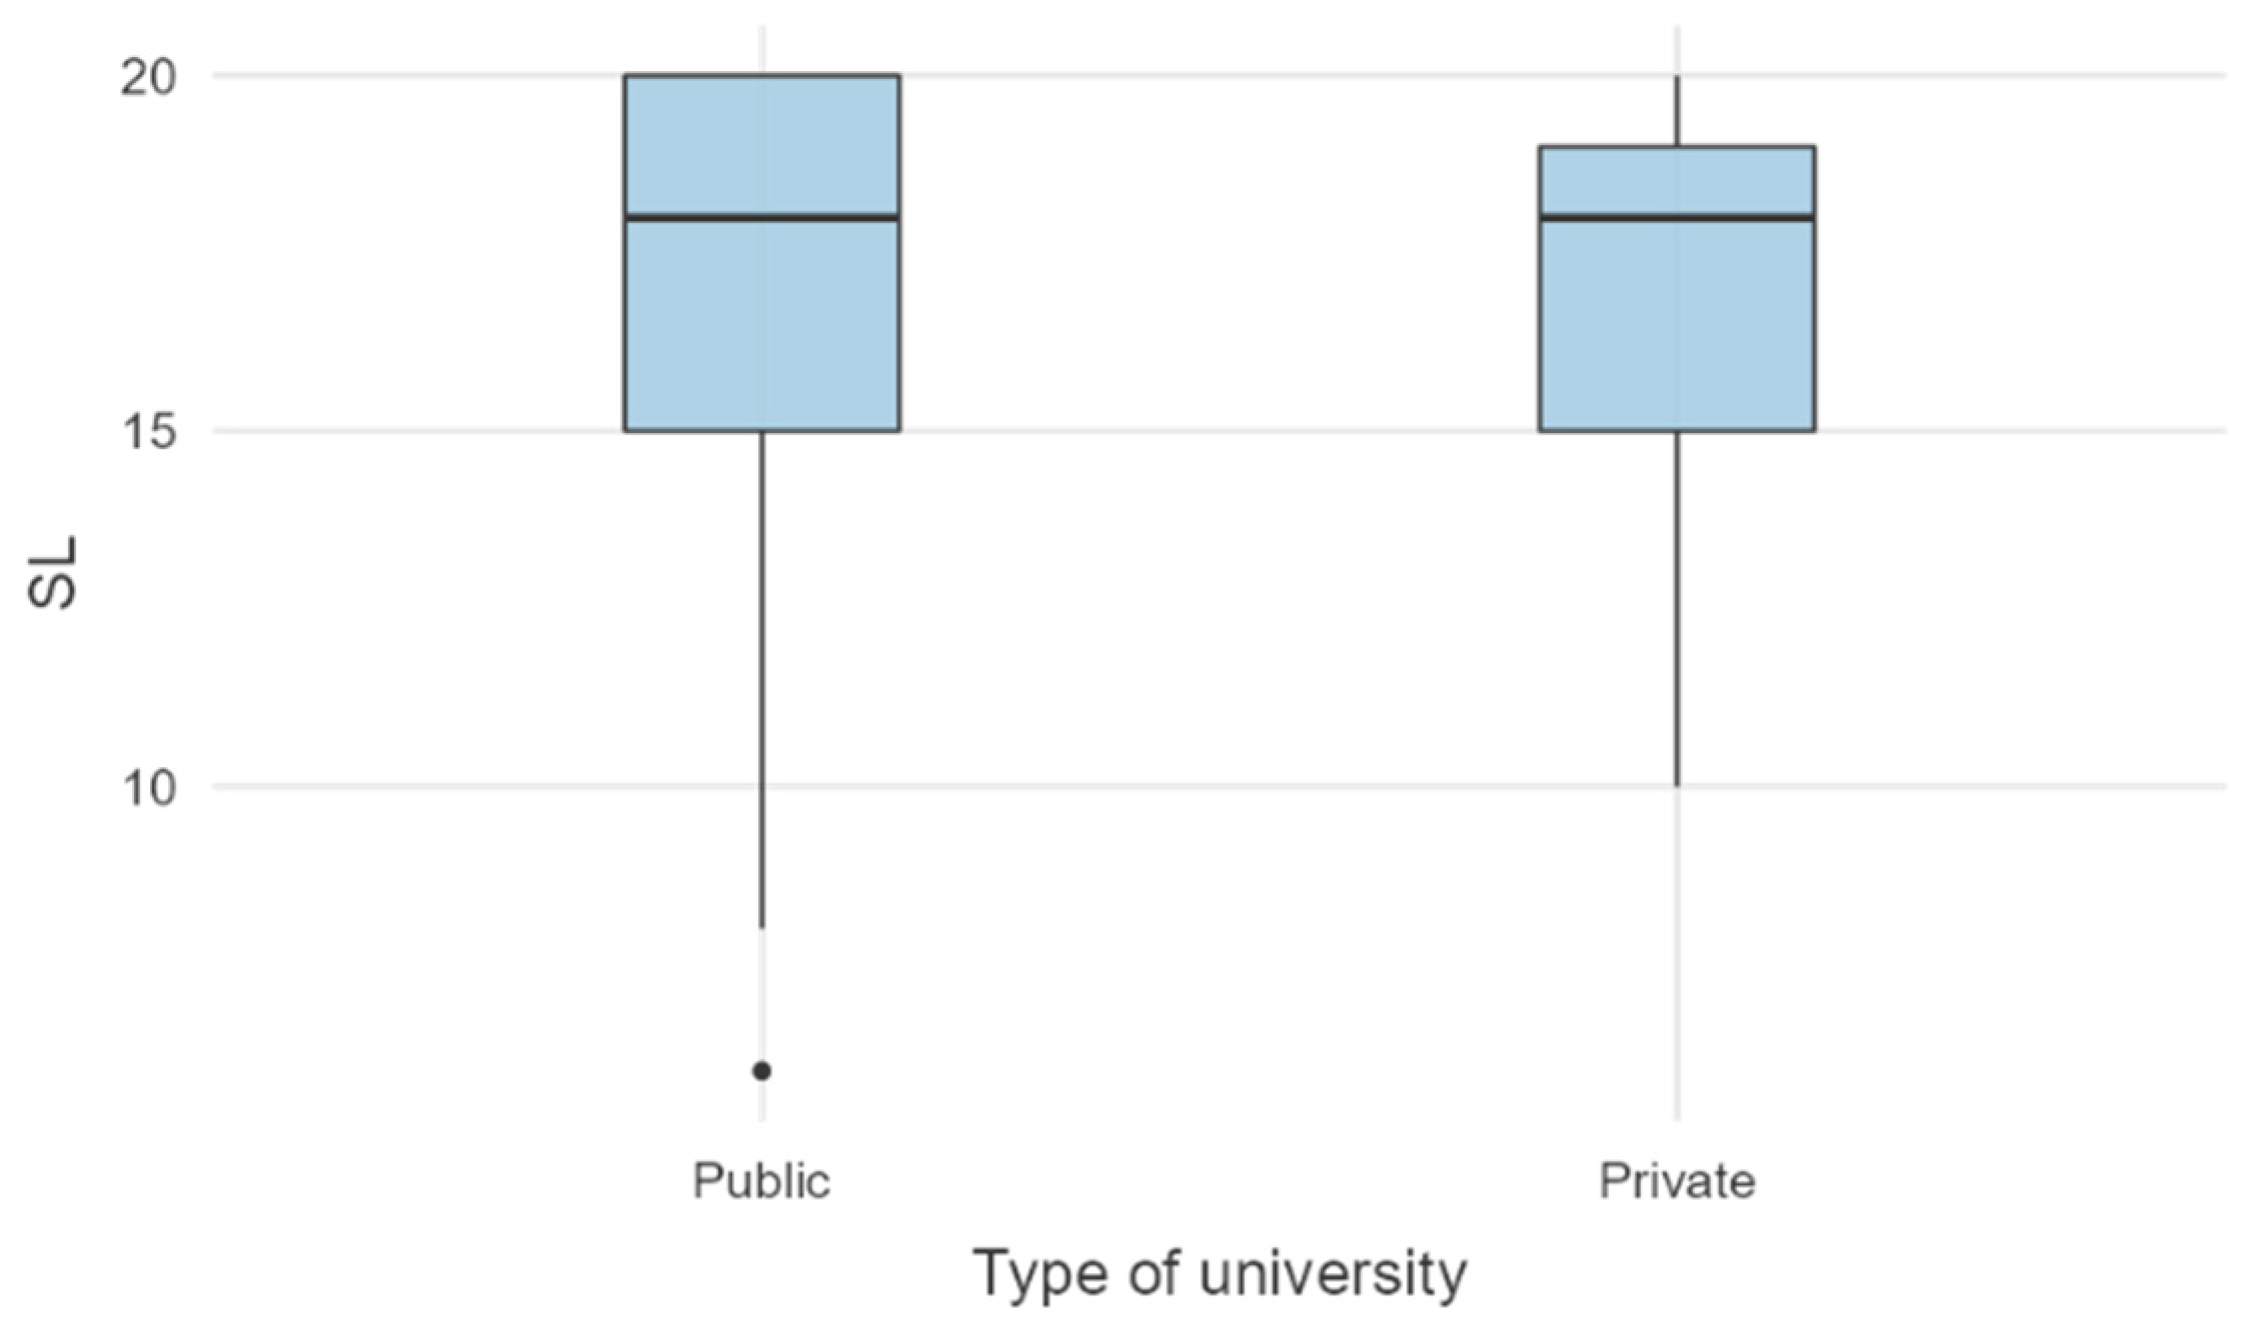
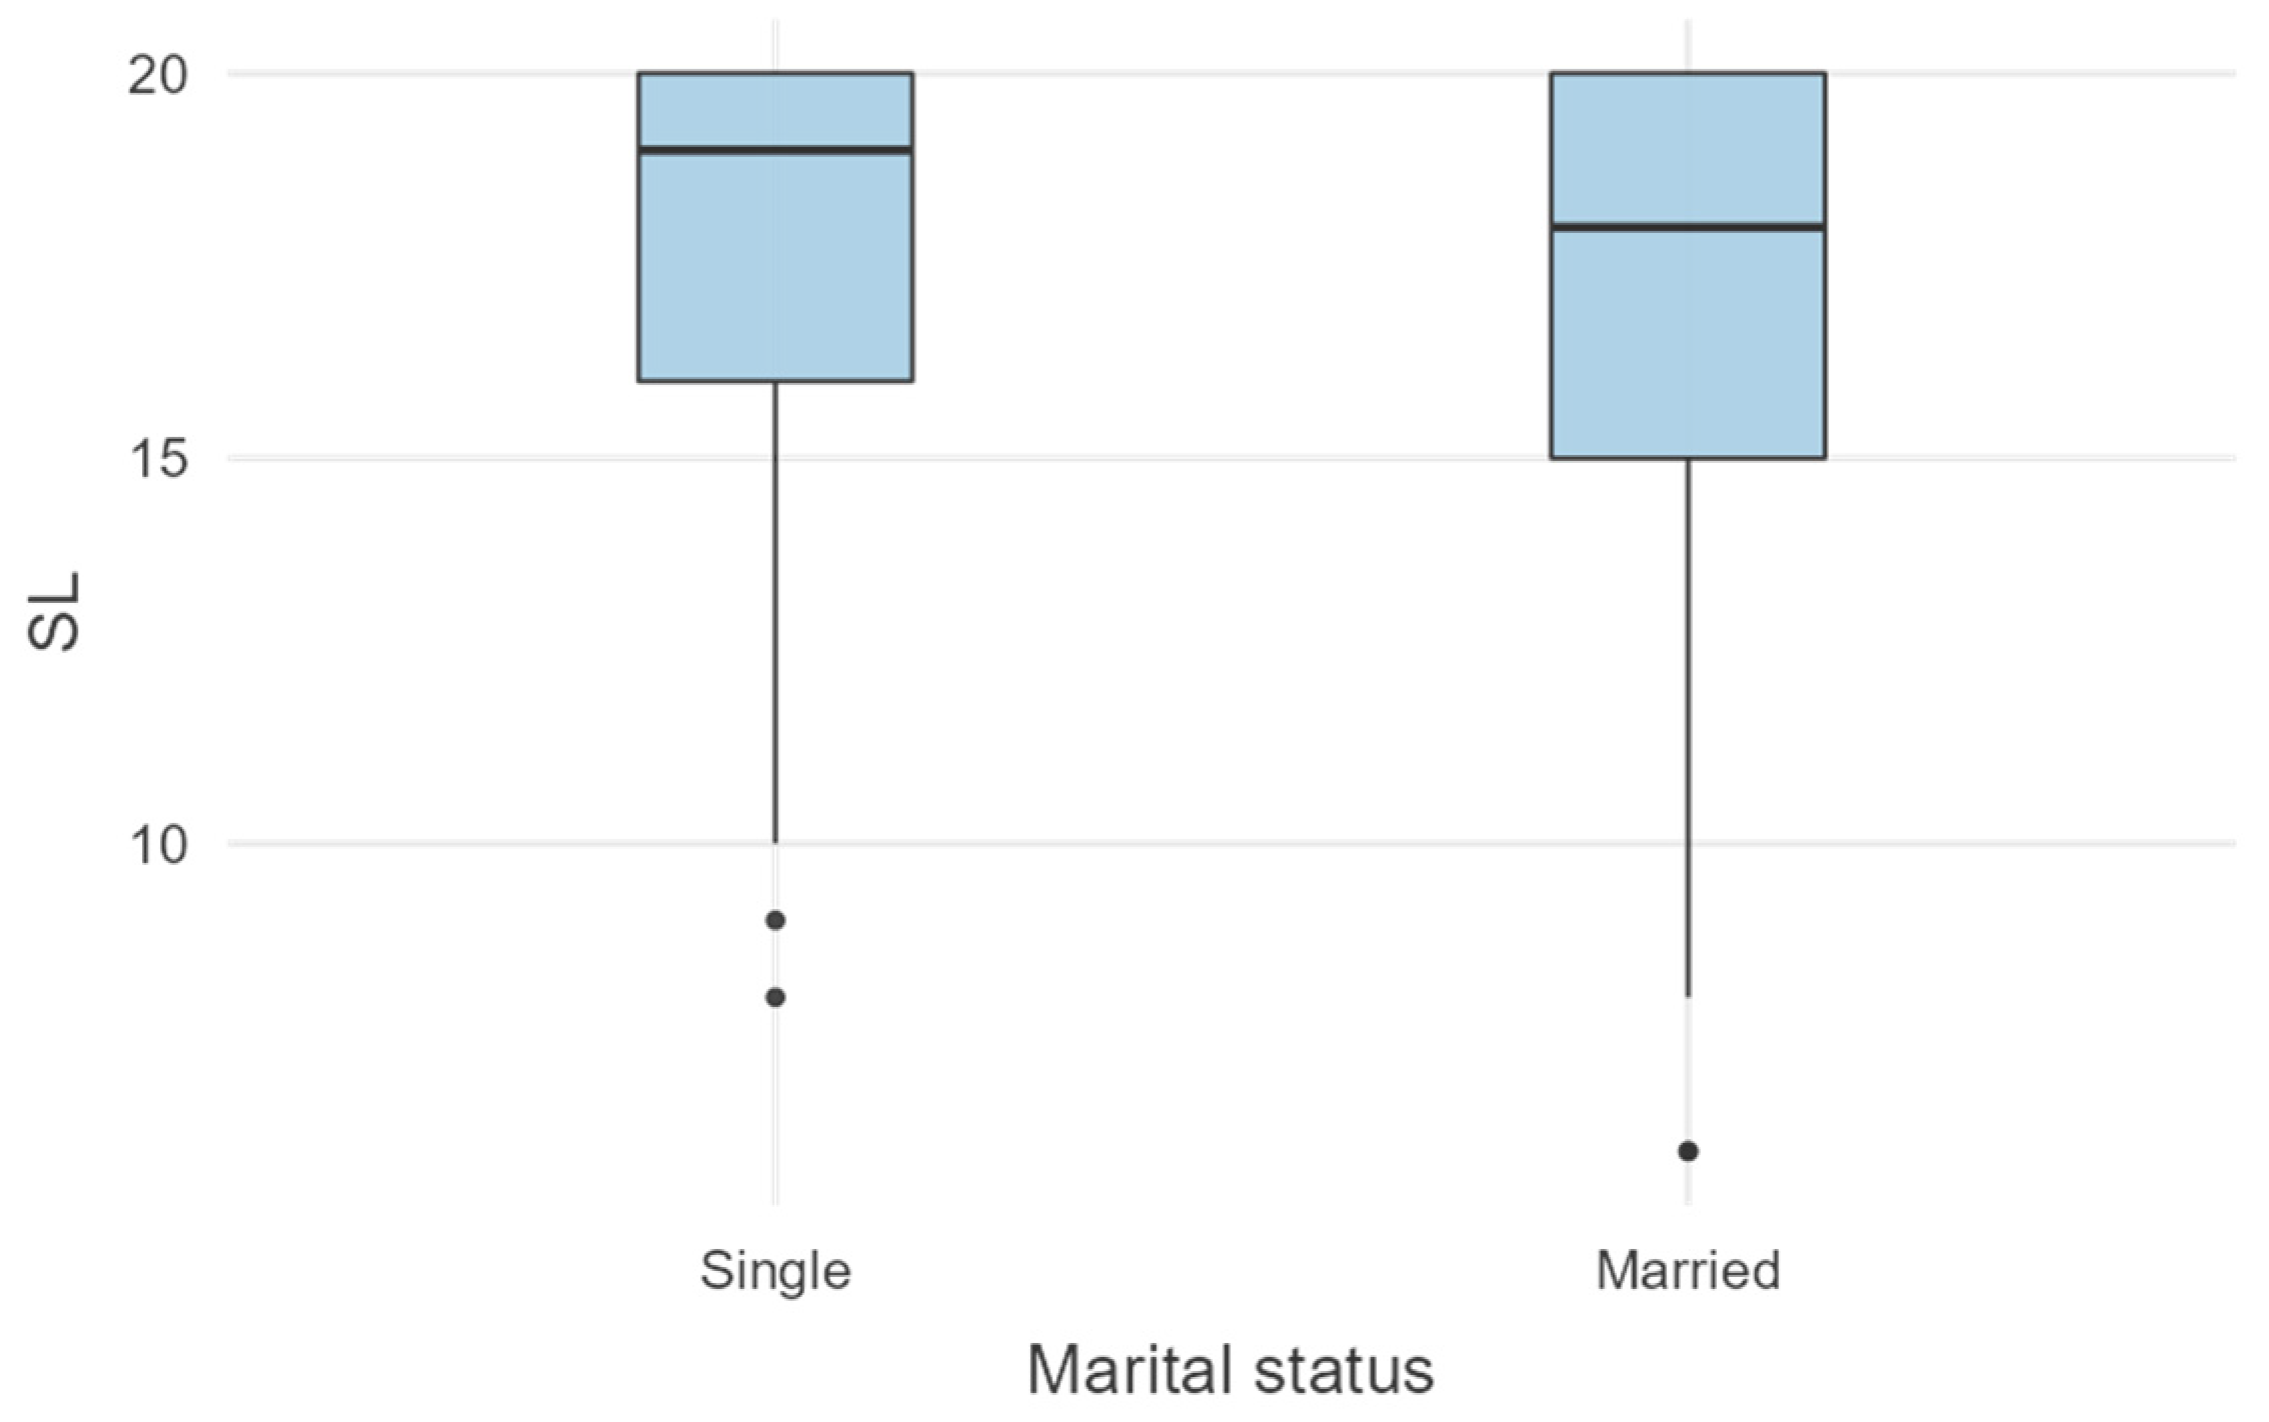
In the analysis of the control variables of sex, marital status, type of university, and the academics’ level of studies with the dependent variables of job satisfaction, statistical tests were carried out to verify the existence of the significant differences between the groups. In relation to the variables of sex, marital status, and type of university, the Mann–Whitney U test was used, because it can be conducted with non-parametric variables. The results showed that there is no difference between men and women, single and married academics, or public or private universities. In the analysis of the maximum level of studies, the Kruskal–Wallis test was used, and the results showed that there are significant differences, especially with respect to those who have a bachelor’s degree and a doctorate and those academics who have a master’s degree and doctorate.
The perceptions of teaching staff on the leadership style may vary according to working conditions, specific organizational culture, or demographic parameters [
52,
53]. The results of the present work revealed no significant gender differences among academics, regardless of marital status or institution type (public or private university). However, the participants’ level of qualifications had a significant influence on their responses. These findings highlight how participants’ perspectives and opinions differ depending on their level of qualification and, consequently, on their academic rank. Perceptions of what constitutes an effective leadership style for a given educational institute must consider the situation’s specific goals and challenges [
54]. A distributed leadership style, for example, may be more appropriate if the goal is to empower employees and promote innovation, whereas a transformational leadership style may be more appropriate if the goal is to make a significant change or overcome a challenge [
53,
54,
55]. The results of the present work revealed that academics have positive perceptions of distributed leadership styles. This could be explained by the academics’ high level of qualification and the demanding academic working environment, with the anticipated benefits of empowering employees and promoting innovation.


 ,
, 


