
Intersection of Gender and Disability on Returns to Education: A Case from Metro Manila, Philippines

1
Institute of Human Sciences, University of Tsukuba, Tsukuba 305-8577, Japan
2
Independent Researcher, Tokyo 101-0031, Japan
*
Author to whom correspondence should be addressed.
Merits 2023, 3(4), 682-699; https://0-doi-org.brum.beds.ac.uk/10.3390/merits3040041
Submission received: 29 August 2023
/
Revised: 18 November 2023
/
Accepted: 24 November 2023
/
Published: 30 November 2023
(This article belongs to the Special Issue Young People and the Labor Market: Challenges and Opportunities)
Abstract
:Utilizing a dataset from Metro Manila in the Philippines, we estimate the impact of gender on the return of education for individuals with disabilities, specifically focusing on visual, hearing, and walking difficulties. Controlling sample selection to address endogenous labor participation and accounting for the endogeneity of schooling decisions, our estimations reveal a significant rate of return to education, ranging from 25.7% to 38.1%. Importantly, examining the potential for nonlinear-schooling return, we observe a more pronounced effect of disability for females compared to their male counterparts, suggesting the presence of dual discrimination and signaling effects for females. Our research emphasizes the urgency for the Philippine government to not only improve educational opportunities but also to enhance employment prospects, particularly for females with disabilities. Some of the policy recommendations would include the implementation of equal-opportunity measures, including antidiscrimination policies; an expanded quota system to boost employment opportunities; efforts to address accessibility issues; and subsidies for private-sector employment are also necessary for the economic empowerment of females with disabilities.
1. Introduction
Studies in both developed and developing countries has shown that education is an effective strategy to escape from poverty, as better-educated individuals earn higher wages, experience less unemployment, and work in better occupations than their less-educated counterparts [1,2,3]. Though studies on the economic value of education for people with disabilities, particularly in developing countries, are rare, some studies have found education to be crucial not only in increasing the employability of this group but also in improving their occupational options, for example, by providing the opportunity to obtain white-collar or full-time jobs [4]. However, the value of education for people with disabilities is not widely recognized, especially in many developing countries. The prevailing belief is still that even if people with disabilities are educated they will be less likely to make use of their education, or will not be useful in the workforce [5].
One of the major obstacles to challenging this notion is the limited number of empirical studies on disability and the nexus between education and labor-market participation, resulting mainly from a lack of credible data. This is particularly the case for low- and middle-income countries (LMICs). These countries have, indeed, significantly limited information on the socioeconomic status of people with disabilities [6,7]. On the other hand, return to investment in education has been quantified for nondisabled people since the late 1950s [8,9,10]. There have also been numerous studies showing the link between education and employment for females. Several studies observed that, compared to their male counterparts, female participation in the labor market appears to depend much on the social environment in the developing countries [11,12,13]. This implies that for disadvantaged or marginalized groups, such as people with disabilities, ethnic minorities, females, or even migrants, labor-force participation is not only determined by levels of education, but is also influenced by discrimination and the support they receive in their direct environment.
Furthermore, there are some studies on the labor-market participation of people with disabilities in LMICs. For example, Filmer [14] stated that young people with disabilities are less likely to start school, and, in some countries, have lower transition rates resulting in lower attainment. This study went on to observe that disability status has a stronger effect on school enrolment and participation than do gender and other socio-economic statuses. Likewise, Mitra and Sambamoorthi [15] compared wage disparities between males with and without disabilities in Tamil Nadu in India. Their study suggested that differences in education across disability statuses or labor-market discrimination were among the factors accounting for the employment gap between males with and without disabilities. They also examined the magnitude and determinants of wage differentials by disability status in the context of an agrarian labor market in India [16]. As a cross-country analysis, Mizunoya and Mitra [17] examined differences in employment rates between persons with and without disabilities in 15 developing countries and showed that people with disabilities have lower employment rates than persons without disabilities in nine countries.
There have been some studies examining the return to investment in education for people with disabilities. Hollenbeck and Kimmel [18] performed studies in the US; Lamichhane and Sawada [19] for Nepal; Albert et al. [20] for the Philippines; Pinilla-Roncancio et al. [21] for Latin American countries; and Tiwari [22] for Sub-Saharan Africa. Stern [23] examined the problems of measurement and endogeneity when creating a definition of disability for census-taking purposes, while DeLeire [24,25] and Hotchkiss [26] investigated employer discrimination in the labor market.
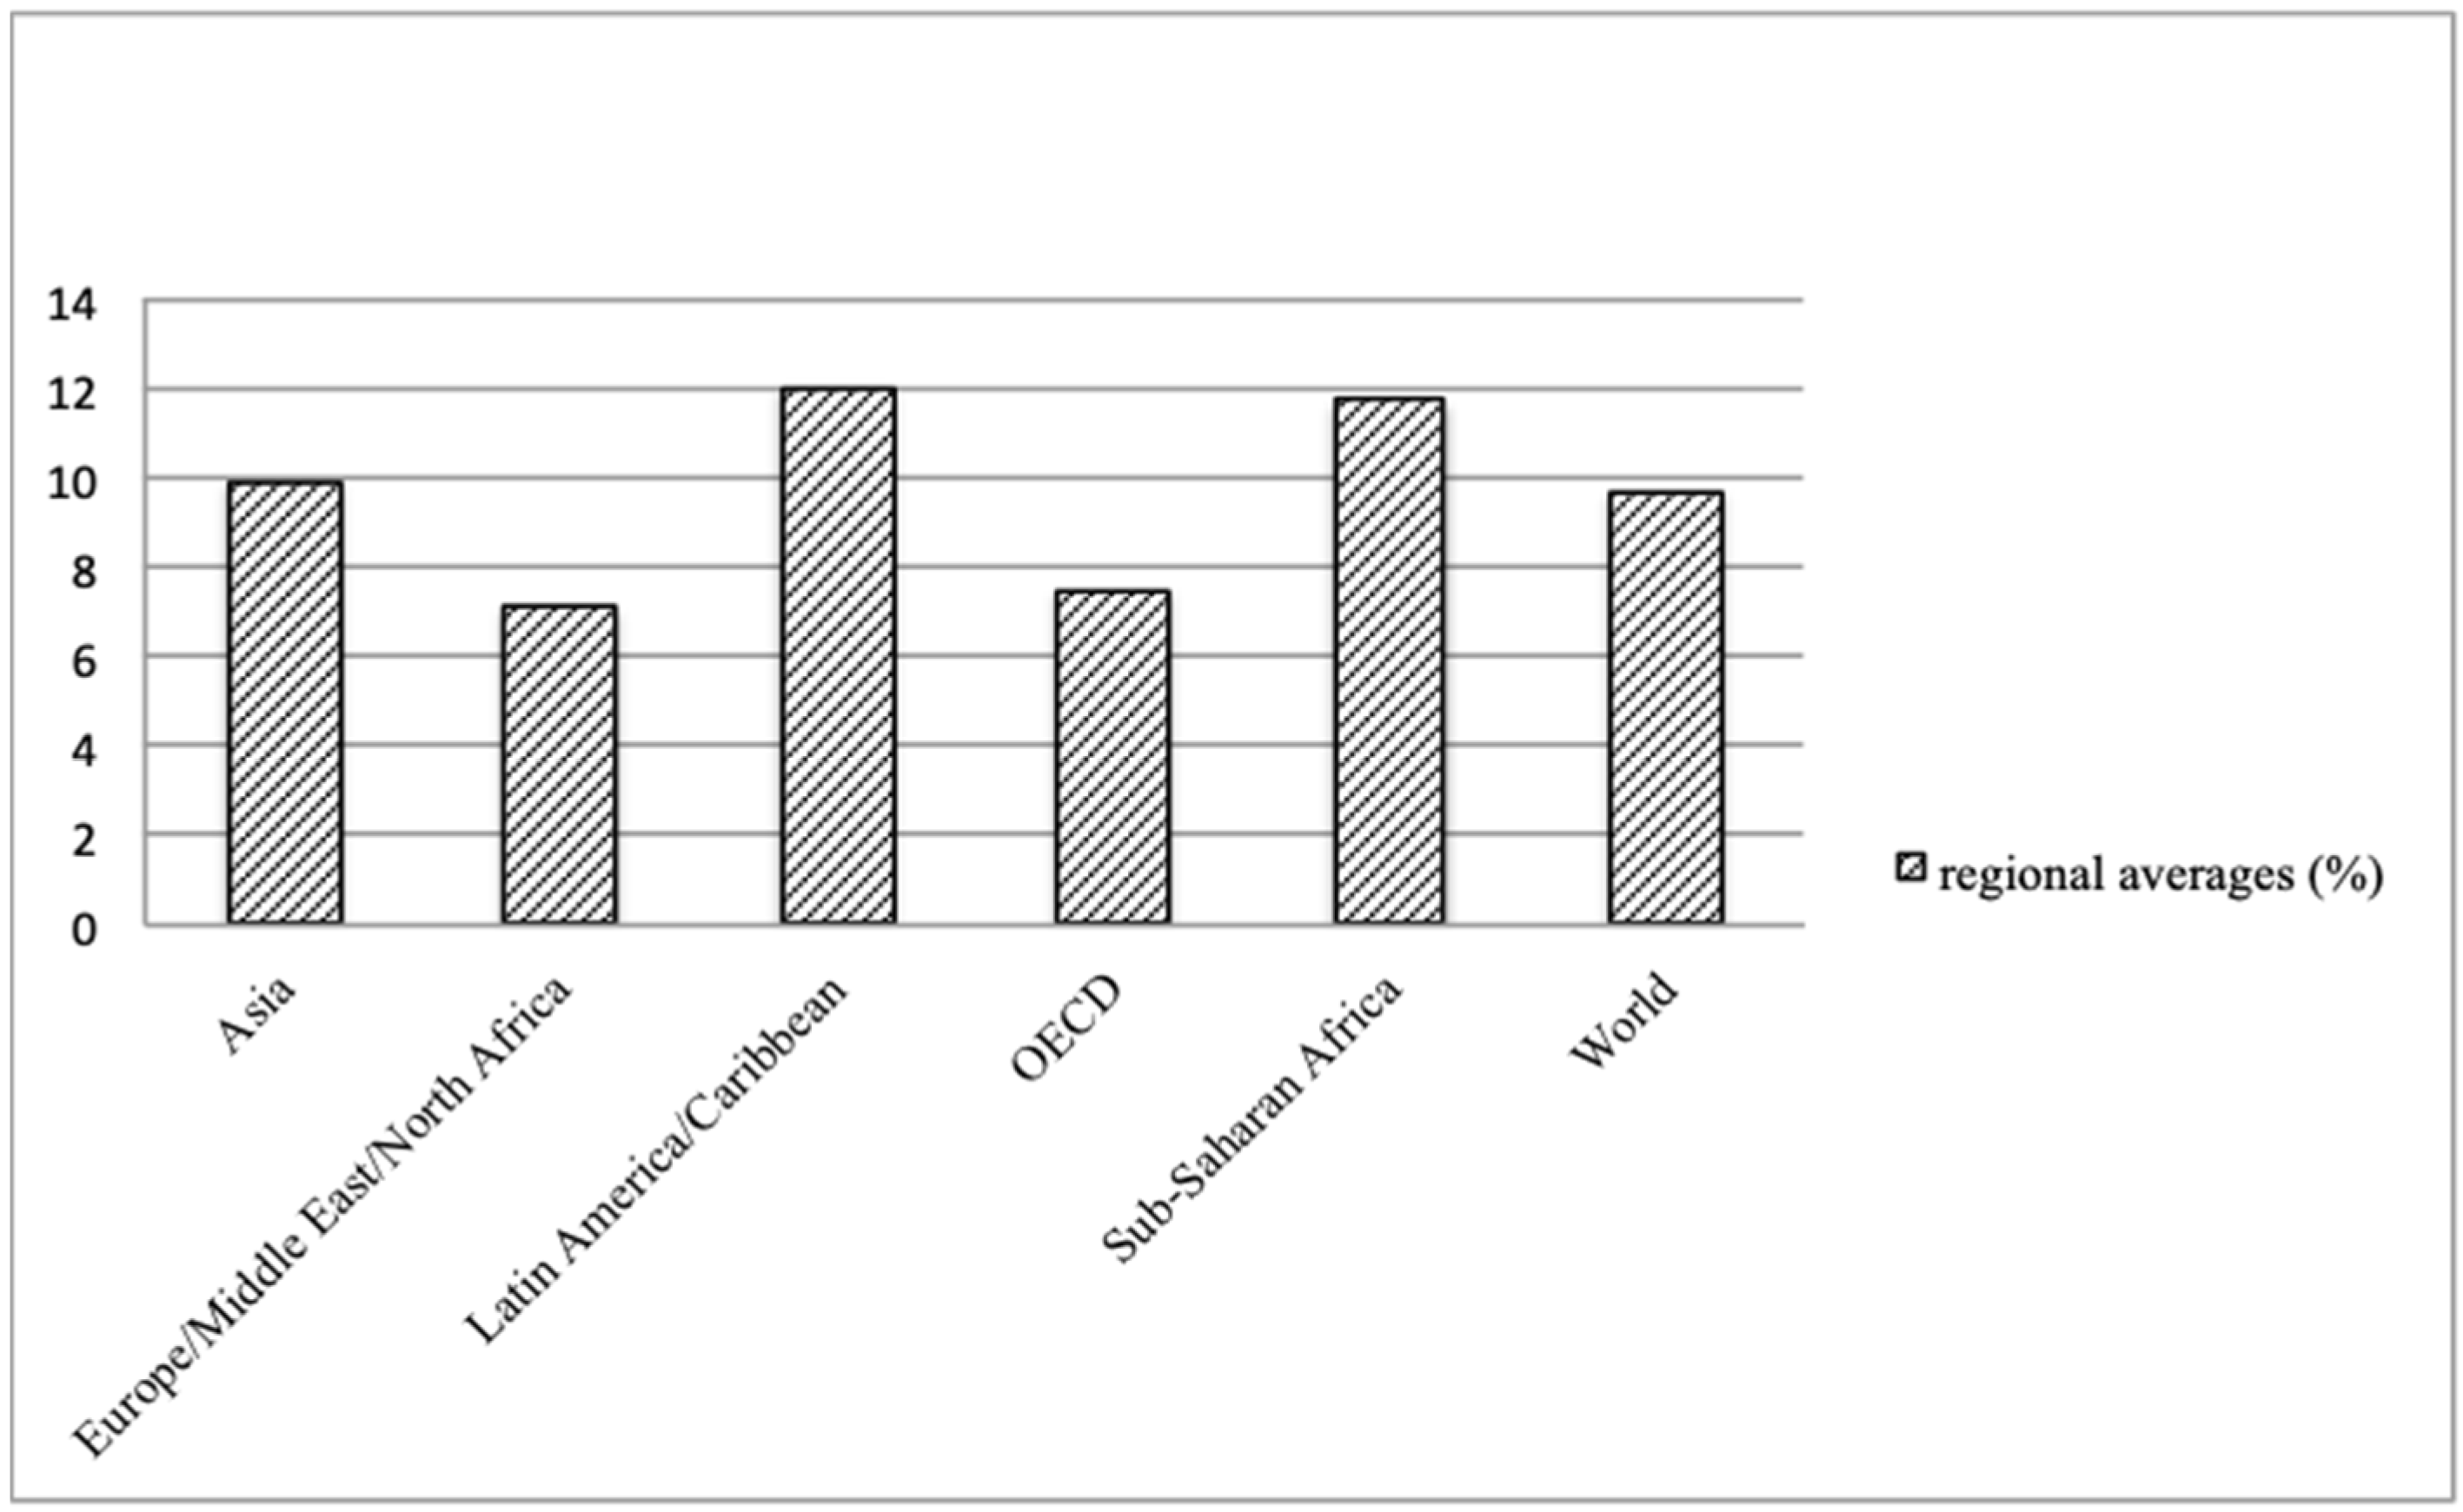
The above study in Nepal [19] provides evidence on the return of education for persons with disabilities by over 19.3 percent. Their estimated return is significantly higher than that of their non-disabled counterparts (See Figure 1 for the return to investment in education in different regions) [27], but none of the studies have considered gender and disability in estimating the return of education. Although the literature has shed light on many aspects of disability, education, and employment in the developing world, studies examining the labor-force-participation gap between males and females with disabilities are rare. Labor-market participation of females with disabilities is challenging due to the possible double disadvantage they face, first as females and then as females with disabilities.
Therefore, this paper aims to at least partially fill this gap in existing knowledge by comparing the estimates for the wage return of education for males and females with disabilities in the Philippines. The central research question posed in this paper, thus, is empirical: does gender have any effect on the return to investment in education for persons with disabilities? We believe that the empirical work in this paper will help governments and other concerned authorities design policies to mitigate poverty among females with disabilities who are regarded as one of the most underserved groups.
There are some important features of this study. To begin with, we use the data from persons with hearing, physical, or visual difficulties living in Metro Manila in the Philippines. The dataset was jointly collected by the Institute of Developing Economies (IDE) and the Philippine Institute for Development Studies (PIDS), using carefully structured questionnaires.
The Philippines was ranked 116th in human development in 2021 [28], and is behind in many of the human-development indices, but, surprisingly, the situation of females in general is favorable, even compared to other developed countries. According to The Global Gender Gap Report by The World Economic Forum 2022 [29], the Philippines is among the top five countries in the world for female rate of participation in economic activities, female educational attainment, political empowerment, and access to other opportunities. The Philippines has kept a higher rate of participation by females in the labor market than that of other countries in Asia. Due to this unique situation for females in this country, we are interested to see if the situation of labor-market participation is same for females with disabilities compared to their male counterparts.
Furthermore, to carefully check the dual effects of gender and disability on the returns to investment in education, various methods of estimation are utilized. First, estimations are completed with (i) standard ordinary lest squares (OLS) and (ii) Type-1 Tobit, where education is defined as a continuous variable, and an interaction variable with sex and each disability is also included. Second, redefining education as a discrete variable, we examine the role of the signaling effect in the returns to education. Similarly, we employ quantile regression for each conditional quantile wage group rather than the mean regression analysis, which enables us to address the more detailed relationship between schooling and wage, and in particular to check whether schooling would have an impact within levels of wage inequality or not.
Beyond these methodological aspects, the topic of this study itself can be regarded as important. As stated above, to the best of our knowledge, there are no studies examining whether gender has any effect amongst persons with disabilities participating in the labor market on obtaining wage return to investment in education. While it is generally accepted that females with disabilities face a double disadvantage, first as females and then as persons with disabilities, the higher rate of females’ participation in the Philippines’s labor market indicates that there is no negative effect of gender for the general population. In this context, it is, therefore, important to examine whether disability has any negative effect on females’ labor-market outcome. We hypothesize that the higher rate of labor-market participation by Filipino females is not mirrored by females with disabilities. It is plausible that due to the impairment parents put less faith in their children with disabilities and thus give them a lower priority for education compared to their children without disabilities. Consequently, females with disabilities suffer from having fewer years of schooling, which may result in the lower wage return of education compared to their male counterparts with disabilities. Studies such as Lamichhane and Takeda [30] have shown that parents’ positive understanding of their children’s disability is correlated to further years of education.
When we are in the middle of implementing Sustainable Development Goals (SDGs), building human capital for females with disabilities should be given equal footing as other central development goals. From this perspective, this study is relevant in providing important new insights regarding the role of education in the labor-market participation of females with disabilities. The structure of this paper is as follows: Section 2 presents the dataset from the Philippines; Section 3 describes the empirical strategy; the results and findings are discussed in Section 4; and finally, in Section 5 the concluding remarks are presented.
2. Dataset from Metro Manila in the Philippines
We use a dataset on disability collected jointly by IDE in Japan and PIDS. The field survey was conducted in Metro Manila in the Philippines in August 2008. Metro Manila is the capital of the Philippines which is composed of units of seventeen cities called Local Government Units (LGUs). Among the seventeen LGUs, Makati, Pasay, Quezon, and Valenzuela were selected for this survey; they represent a spectrum of Metro Manila. The basic data for the sample was randomly selected. In Metro Manila, each city has many villages/towns, which are called barangays in the Philippines. A barangay is the minimum political unit for the Philippine government system. The population of each barangay varies, respectively. Importantly, each of the cities had enough people with disabilities (PWDs), and that includes those with hearing, physical, and visual impairments.
So, after making a special unit for this survey with the same population size as these barangays, the survey team performed the random selection of the units. The IDE and PIDS collected the data on disability, acknowledging that the Philippines do not have complete registers of PWDs [31]. Considering some possible flaws in the potential sampling frames, the survey-management team of IDE utilized the verified National Statistics Office (NSO) list, supplemented by the LGU lists. The initial list of PWDs prepared by NSO based on the 2000 CPH results were verified by the LGU partners with the help of the research staff from the PIDS. Lists of PWDs from LGUs are basically administrative registers that have recently been developed by the local social-welfare units, which take the lead in the provision of services to PWDs within the locality. A total of 360 PWDs were targeted to be sampled through the assistance of the NSO; 120 PWDs represented each of the three types of impairment. In this survey, physical impairment refers to loss of one leg/foot or both, and quadriplegic is loss of one arm/hand or both. Visual impairment refers to total or partial blindness or low vision. Hearing impairment, refers to total or partial deafness or hard of hearing.
For the sampling operations, neighboring barangays (i.e., villages) in each of the four cities were formed into groups of barangays in such a way that each group of barangays would have at least 300 of the targeted PWDs residing in those areas. This then comprised the primary sampling units (PSUs). At least five PSUs were designed to be selected within each city, with probability proportional to the total number of PWDs. Ten to fifteen PWDs were to be selected within each selected PSU. Taking into account the expected non-response and migration of PWDs as well as the proposed sampling design, the NSO was tasked to assist in drawing a list of 900 total possible respondents, and the targeted 300 PWDs for each type of impairment were distributed across the four cities.
Based on the structured questionnaires, the survey team interviewed a total of 403 respondents: 125 in Makati City, 122 in Quezon City, 84 in Pasay City, and 72 in Valenzuela City. The survey covers a wide variety of questions including demographic, education and labor-market-related information together with information on disability. Questions were also included to capture the information of other members of the household of the respondents.
Prior to the implementation of the final survey, the questionnaire underwent scrutiny from the Statistical Survey Review Clearance System (SSRCS), which is undertaken by the Technical Committee on Survey Design of the National Statistical Coordination Board (NSCB). SSRCS is a mechanism through which all surveys and censuses are to be conducted by or for all government units in the Philippines.
Out of 403 participants, we used information on 365 respondents with hearing, physical, and visual impairments to clearly investigate the gender effect in disability in the labor market of the Philippines. We have excluded some participants from our analysis on the basis that information was missing. Some are excluded as the participants had multiple impairments.
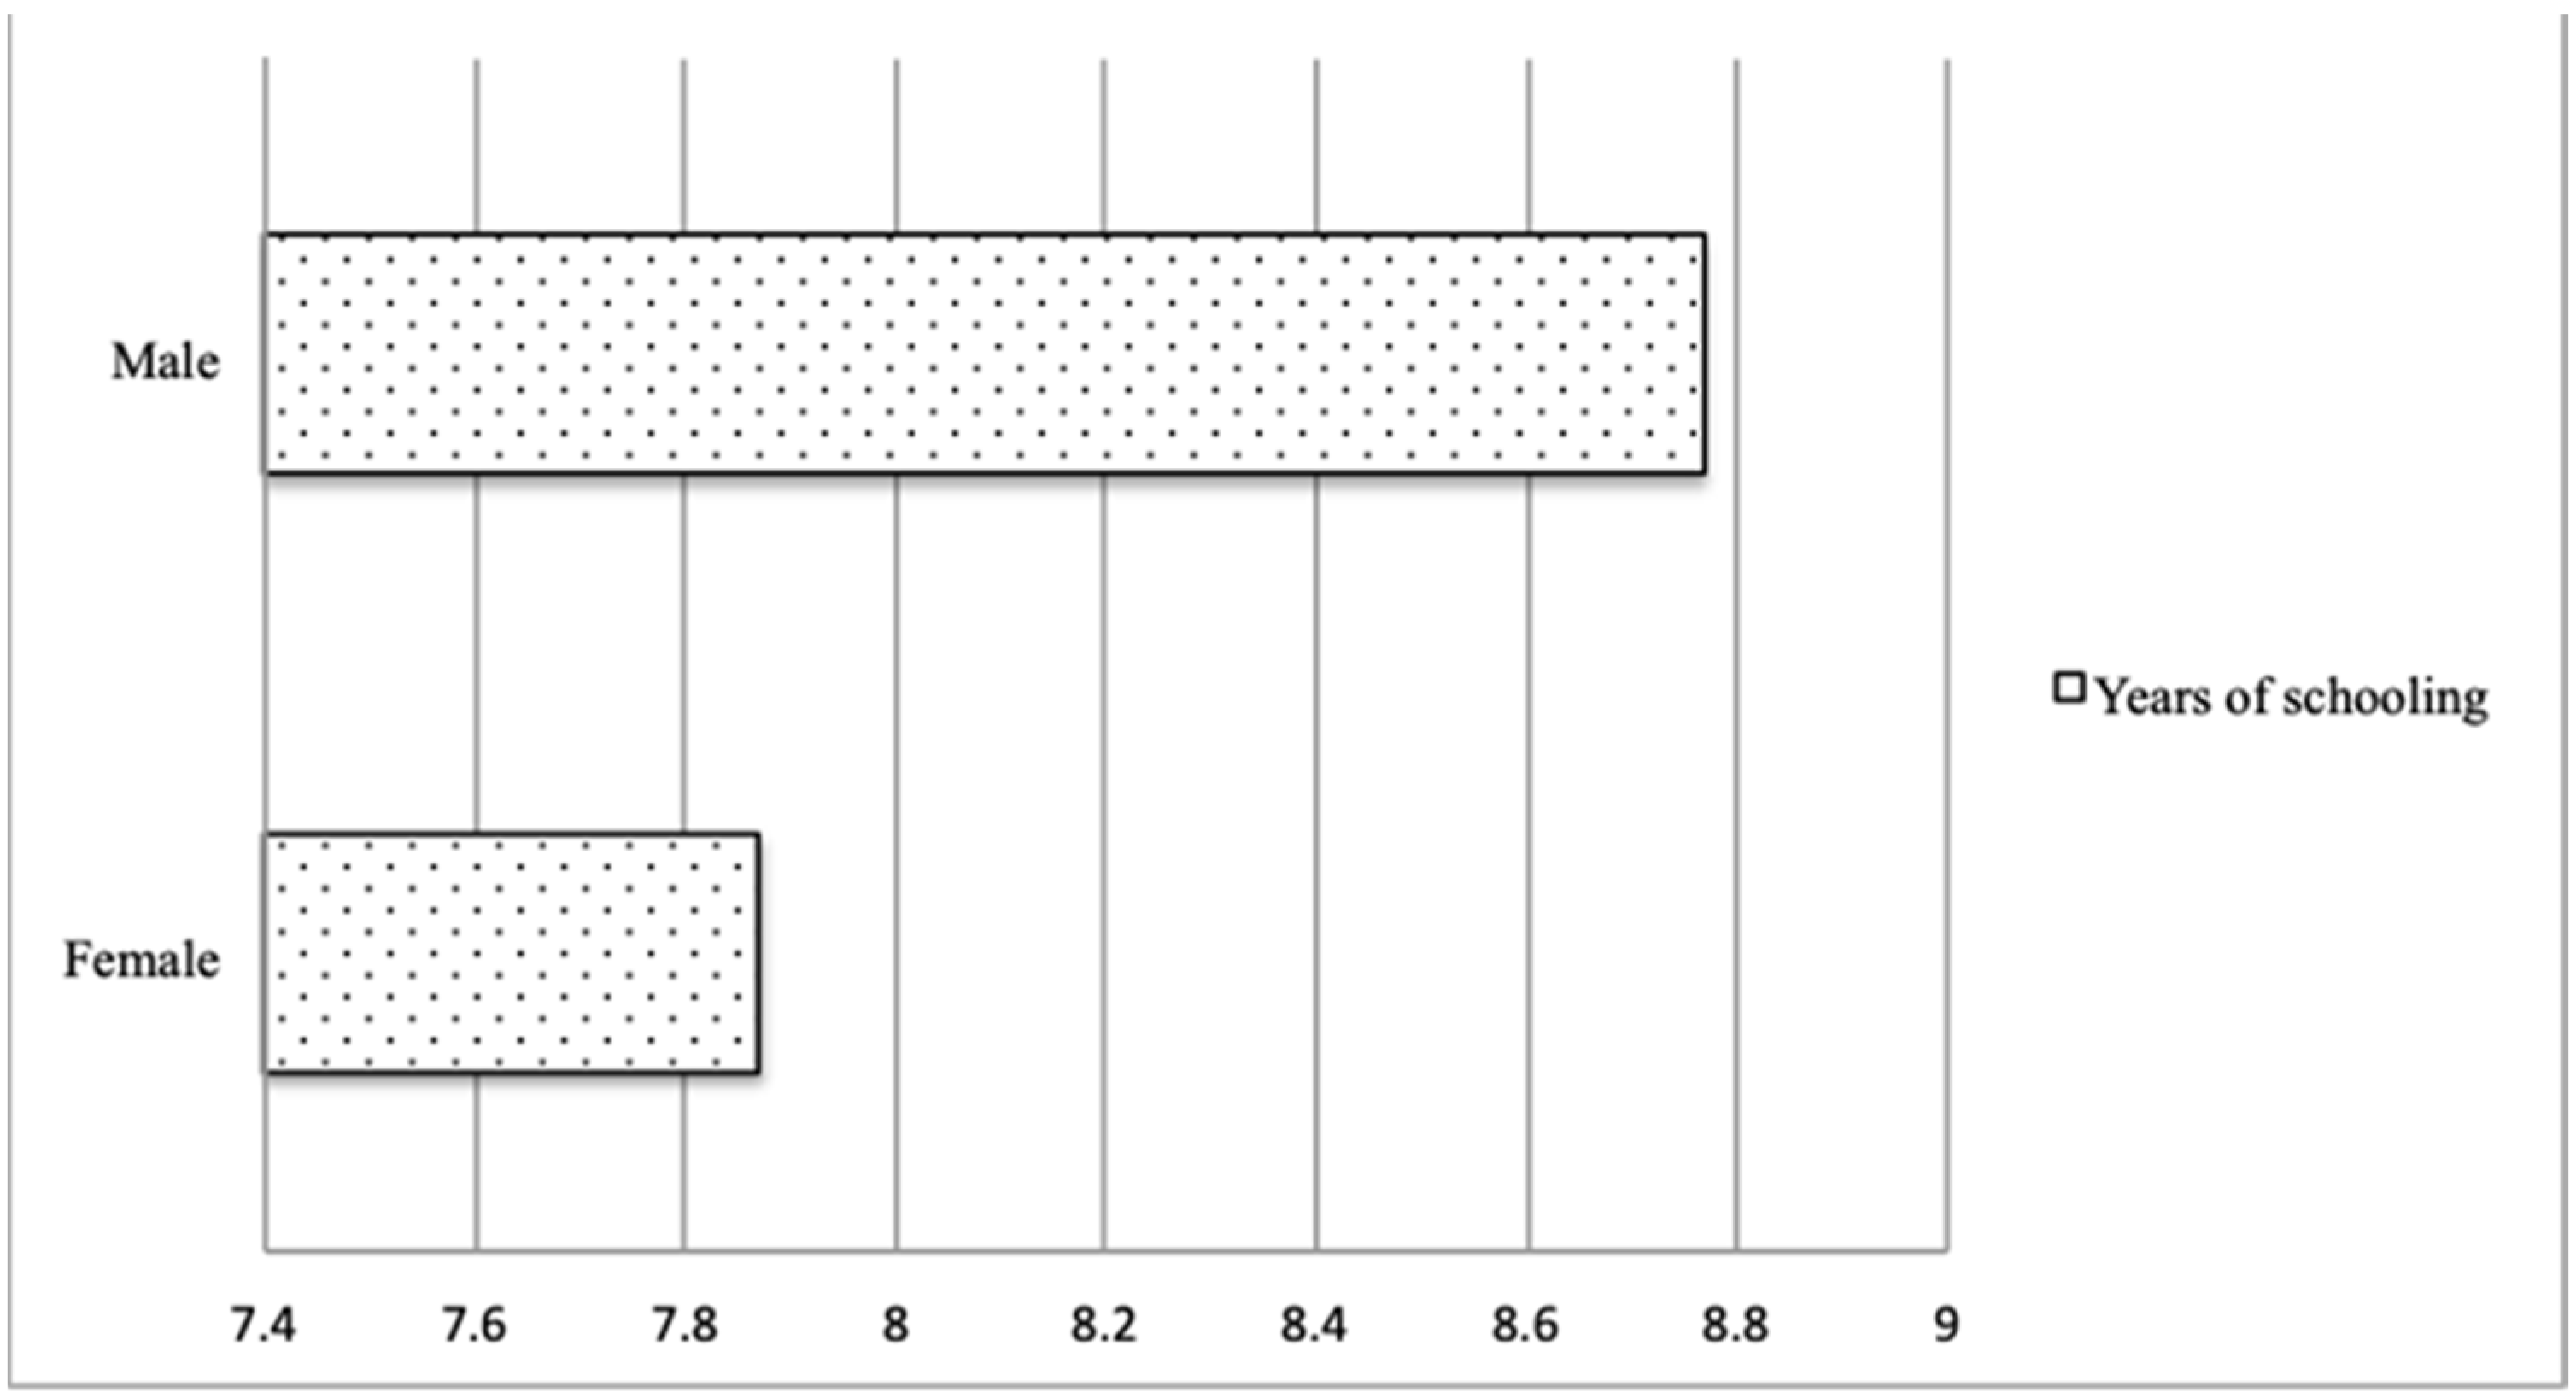
Table 1 shows the descriptive statistics. Of the total of 365 participants, they ranged in age from 15 years to 67 years, with the average age of 37.8 years. The majority of the respondents (62 percent) were male, and the remaining 38 percent were female. The disabilities of the participants were classified into three categories: hearing, physical, and visual impairments. Among the respondents, 29, 38, and 33 percent had hearing, physical, and visual impairments, respectively. Participants completed the average of 8.43 years of schooling, and males with disabilities on average completed more schooling than females: 8.77 and 7.87 years, respectively. Irrespective of the type of impairments, only a small percentage of participants (9 percent) completed their college level of education. Our results highlight the difference between females with and females without disabilities: females with disabilities are less likely to achieve more education than those without disabilities who are shown to have equal levels of education to their male counterparts in the Philippines [32]. Moreover, we also observe wage difference between them: the average wage for females is PHP 50,216, while it is PHP 67,167 for males. Additionally, Figure 2 presents them in a bar chart that shows the magnitude of the gender gap.
The data also include information on the age of onset for the three types of impairment, revealing that the average age of onset of physical and visual impairments is 23.1 and 26.2 years, respectively. Hearing impairments were categorized according to the linguistic approach, i.e., born deaf (57%), before 3 years old (23%), or after 3 years old (14%). The survey also reveals that 33, 30, 19, and 18 percent of the respondents were from Makati, Quezon, Valenzuela, and Pasay, respectively.
3. Empirical Strategies
3.1. Mincerian Wage Equation with Continuous Education
To establish the empirical settings, the return of education is estimated, and we define education, firstly, as a continuous variable (grades of schooling completed) using the following equation to regress log earnings on years of schooling.
The Equation (1) is a standard Mincerian wage equation used by the existing studies [3,8,9] with an underlining assumption that the return on schooling is the same for different attainment levels. Starting with the OLS model of earning functions for male and female respondents, a linear relationship is specified in Equation (1), where logWi is the log of individuals’ earning, and α is the intercept. This equation is added to Si, years of schooling. ρ represents the returns to education, i.e., how much the wage rate increases in response to an additional year of schooling. Xi is a set of covariates for each person; β is its coefficient to be estimated and ε is an error term. Using these specifications, we obtain baseline estimations. However, one of the potential econometric problems is that the cross-sectional correlation between education and earnings may differ from the causal effect of education, owing to the correlation between the years of education and the error term that involves unobserved factors such as abilities. In order to mitigate endogenous concerns in this context with gender and disability, we employ the following steps.
First, three main disability-specific dummy variables for each gender—visual, hearing, and physical impairments—are included to carefully identify disparities between males and females with disabilities. Yik (k = 1…5) is a set of dummy variables with males with visual impairments as the baseline, and Yi1 and Yi2 representing hearing and physical impairments in males, respectively. Yi3, Yi4, and Yi5 represent visual, hearing, and physical impairments for females, respectively. Second, as establishing schooling effect is difficult and the existing studies have shown the possibility of inconsistent parameter estimation due to schooling years, which may be endogenous, the use of instrumental variables is preferable for credibility [8,33,34].
In examining return of education, there are several candidate instruments. For example, using family-background variables is one of the credible instruments, and Trostel et al. and Söderbom et al. used parents’ educational levels [35,36]. For disability and return of education, the age at which the individual became impaired can be utilized as an instrumental variable. Lamichhane and Sawada controlled for endogenous bias arising from years of schooling and decisions by employing this novel instrument [19]. We use parents’ years of education as the family background in our IV estimation. In our IV strategy, we did not use the age at which the individual became impaired, because in this dataset the onset year for those with hearing impairments is classified as birth, before 3 years old, and after 3 years old, and thus the age at which a person became impaired is not obtained. However, this classification is not suitable for our analysis. Another econometric consideration is that of sample-selection bias. Since many people with disabilities are unemployed in the Philippines, we cannot ignore the endogeneity problem arising from labor-market participation decisions. In order to control for the sample-selection bias, we employed Amemiya’s Type 1 Tobit model with endogenous regressors [37]. However, we acknowledge that we do not have a control for general health conditions (e.g., nutritional status, height, chronic disease), which may affect females more than males.
3.2. Discontinuous Wage Earnings and the Signaling Effect
The return of education does not necessarily increase in a continuous, linear fashion; there is a possibility of discontinuous increases or decreases in wages. We also define another equation that is different from the Mincerian earning function described in Section 3.1, and as the model relaxes as does the assumption of the linear return of additional years of education. In this analysis, we also check the signaling effect in the return of education, and determine whether the possibility of obtaining a diploma serves as a signal of productivity or not. The signaling model [38,39,40] suggests that being certified as having completed an educational course is likely to reveal more to an employer about a worker’s ability and productivity than a record of how many years the person has attended classes. The studies mentioned in Section 3, above, have clarified the signaling effect. A smaller body of literature compares the signaling effect for persons under double disadvantage. Some of them have focused on the socially disadvantaged people mentioned in Section 3.2.
However, to the best of the authors’ knowledge, none of the papers have examined the signaling effect focusing on double disadvantage arising from gender and disability, especially in developing countries. The analysis in this section provides another insight, which is different from Section 3.1. If the general model of signaling is reasonably linked with the difference in finding jobs and earning wages or promotions, it is expected that the return for females with disabilities becomes higher if they obtain diplomas rather than drop out, while males with disabilities, who are still considered to be favorable by the labor market, may enjoy a constant level of return even if they drop out. Thus, we also check whether obtaining diplomas has a different effect on wages for males and females with disabilities.
Hungerford and Solon [41] proposed two earning factions to be formulated in order to capture any possible signaling effects. First choice is the spline function, which assumes that log earnings for any given amount of schooling grow linearly, while the inclination of the earning rates depends on the level of education completed, i.e., elementary school, high school, or university. The other choice is the use of the step function that treats log earnings as a function of years of education, with a separate step for each year without specifying particular function forms. For more flexibility, setting a step function for our analysis, we first classify each educational level to check the possibility of nonlinear-schooling return for respondents. Then we classify 10 groups according to the educational attainment for each gender to address the extent to which the return changes discontinuously based on the categories below: 1. individuals with no education; 2. individuals who do not complete either elementary or high school (this indicator represents a lower educational certificate dummy); 3. individuals who graduate from elementary or high school and obtain either diploma; 4. individuals who do not complete higher education, such as college, university, or graduate school; and 5. individuals who graduate from college, university, or graduate schools.
Using the above classification, we add this new specification Dis (s = 1…9) designating females with no education as the baseline and using educational-level dummy variables to measure the effect of both higher and lower levels of education in Equation (2) below:
where the dependent variable is the natural logarithm of annual earnings, and the data on highest qualifications enable the dummy variables to be defined for both males and females. Of particular interest for us is whether there exists any difference between the effects of lower/higher certificate dummies and not-completed dummies.
Unlike most studies, the signaling effect in our analysis is not estimated indirectly from nonlinear wage return to years of schooling that correspond to the usual time taken to complete a qualification, as such methods are likely to be biased by measurement errors [42]. The carefully structured questionnaires used by this papers directly ask respondents whether or not they completed school, and if so the level from which they graduated, which enables us to directly search for the signaling effect. φs coefficients estimate the marginal effect of each level of education, as based on the excluded group that has no school qualifications. The effects of disabilities are classified as follows: γk (k = 1…3), γ1 is for visual impairments, γ2 for hearing impairments, and γ3 for physical impairments. If empirical findings result in showing the signaling effect, we may conclude that there possibly exists imperfect information between employers and employees with disabilities.
3.3. Quantile Regression
Finally, the last part of our analysis deals with wage inequity separately among males and females with disabilities. While estimating how school resources on average affect educational outcomes yields straightforward interpretations, this study investigates wage dispersion by employing the quantile regression approach. Since the quantile regression approach analyzes the relationship between the conditional distribution of the response variable and the set of covariates, it offers more detailed insights into the effects of these countermeasures than the mean regression model; it could be the case that these dispersions vary across educational levels, which results in an impact of schooling upon the wage distribution through its inner channel. Following Martins and Pereira [43], the quantile regression model is written as Equation (3):
where Xi is the vector of exogenous variables, and βθ is the vector of parameters. Quantθ(logWi|X) denotes the θth conditional quantile of logWi given Xi. The θth regression quantile, 0 < θ < 1, is defined as a solution to the problem that follows:
where ρθ(ε) is the check function defined as ρθ(ε) = θε if ε ≧ 0 or ρθ(ε) = (1 − θε) if ε ≦ 0. This can be solved using linear programming, and standard errors are calculated using bootstrap methods [44]. We obtain the estimates for different quantiles by setting the first quantiles as 0.25, second as 0.5, and third as 0.75.
The empirical results are obtained by replacing the coefficient Equations (1) and (2) as the coefficient defined in Equation (3), above, e.g., the standard Mincerian wage equation is replaced by the following:
where θ = 0.25, 0.5, 0.75 are the quantile for our analysis. Unlike OLS, the quantile regression model allows for a full characterization of the conditional distribution of the dependent variable.
4. Results and Findings
4.1. The Results for the Mincerian Wage Equation on Continuous Education
Table 2 summarizes our estimated results of wage earning equations modeled by Section 3.1, with the first specification based on OLS estimates. Column 1 and 6 of Table 2 (specification (1) and (6)) shows a 24.9 percent rate of return of education, which is relatively higher than those for persons without disabilities, as was explained in previous studies such as Psacharopoulos and Patrinos [27]. However, these returns are consistent with the returns for persons with disabilities, as shown in developing countries [19] and developed countries [18].
While controlling for the endogenous sample-selection bias using the Tobit model (specification (2) and (7)), the estimated returns of education become slightly higher. In addition, the range for IV OLS and IV Tobit become slightly high (specification (3), (4) (7) and (8)). In the test of endogeneity, a Durbin–Wu–Hausman test shows the possibility of schooling years being endogenous. The Sargan test has been used for over-identification, and we do not thus reject the over-identifying restrictions; although, the partial R squared is around 0.08, and this casts concern over the strength of the instruments. An F statistic over 10 suggests the instruments are strong. Next, to estimate the effect of double disadvantages (i.e., gender and disability), we categorize each impairment type for males and females and classify the gender dummy variable (gender level effect) and the interaction dummy variable for both male and female respondents with visual, hearing, or physical impairments.
We provide the point estimate of these dummy coefficients in Table 2, as visual impairment and males’ visual impairment are used as base outcomes. A comparison of the coefficients of different dummy variables among the different estimations in OLS imply that females have more negative coefficient, and females with physical impairments are most seriously and negatively affected in the labor markets.
The second most severely affected are females with hearing impairments, while coefficients of both males and females with visual impairments are not statistically significant. This is consistent with the casual observation that there exists a lot of barriers in the labor market in developing world. Lamichhane [45] showed that students with disabilities face problems such as inadequately available materials in sign language or Braille, or, in the case of those with physical impairments, inaccessible buildings. Lamichhane and Okubo [4] further discussed the labor-market participation of people with disabilities in Nepal and the role of education, and found that people with physical impairments have lower levels of labor-market participation than their visually impaired counterparts, and argued that disabling barriers were the most serious constraints for these people.
Our findings in the Philippines suggest that the situation is likely the same. As long as disabling barriers are not removed, through the provision of facilities for communication including sign language and other supports based on the reasonable accommodations outlined in the Convention on the Rights of Persons with Disabilities, education alone may not be sufficient, particularly for those who have severe impairments.
On the other hand, our findings observe the decreased likelihood of persons with visual impairments getting a job regardless of gender status. This finding is different from those reported by Lamichhane and Okubo [4] and Lamichhane [46] in Nepal, where teaching has been promoted by the government’s affirmative action plans as a main job for educated individuals with visual impairments. This study indicates that some kinds of jobs that are promoted by the government’s affirmative policies may not be available for this group in the Philippines. From the questionnaires for this survey on the particular job distribution for each respondent with impairments, we find that a large portion of participants with visual impairments work in the massage and acupuncture sectors. The findings are that around 65 percent of persons with visual impairment work as masseurs, while persons with hearing and physical impairments were unable to find any particular jobs. A similar situation is reported in the Country Report of Philippines, which identifies massage as a dominant source of employment for people with visual impairments [47].
4.2. The Results for Discontinuous Wage Earnings and the Signaling Effect
The findings of discontinuous wage earnings in the return of education are shown in Table 3. As defined in Section 3.2, we relax the assumption of linear educational returns and categorize each educational level in order to check the possibility of nonlinear-schooling return for whole respondents. Subsequently, we use the lower and higher educational-diploma dummy variables, when they graduated and obtained diplomas, and not-completed dummy variables, e.g., when a person leaves school during the lower or higher educational stage before obtaining a diploma for both male and female.
Table 3 compares different characteristics of the level of educational specifications and several points, emphasizing the results. In each educational-level setting, we observe the clear difference of educational returns (specification (1) and (2)). Next, we check the differences using an educational-diploma dummy and not-completed dummy variables (specification (3)). Based on females with no education, the coefficients of levels of education for females are only positive and statistically significant at least when their educational attainment is either of a lower or higher diploma (2.39 and 3.56 for lower and higher, respectively). If they do not complete these educational levels, the same result cannot be obtained. Second, the coefficients on levels of education for males are always positive and statistically significant even if they drop out before obtaining a diploma (2.08, 1.87, 2.95, and 4.55 for lower not completing, lower diploma, higher dropout, and higher diploma, respectively). Third, the increasing of educational returns indicates a convex relationship between education and wages. Moreover, coefficients at all education levels are still significantly higher for males than females except at the lower diploma level. When the Tobit model is employed (specification (4)), the equivalent results are obtained alike. Considering all of these findings, it can be argued that the disadvantage might be profound for females with disabilities as it is observed that obtaining a diploma may reduce asymmetric information, while not completing school does reduce earnings for only females, which may be a barrier that excludes females with disabilities from participating in the labor market.
Furthermore, the result for males with disabilities in our analysis (i.e., finding increasing convexity in the earning function) is consistent with the existing literature, as Schady [48] found the convexity and the signaling effect in earning function for Filipino males (male without disabilities). These findings lead to further questions about the possibilities for Filipino females (females without disabilities); this is important to address, because the Philippines represents a unique case in which females receive more schooling than males.
4.3. The Results for Quantile Regression
We present the results of the quantile regression on Section 3.1 and Section 3.2 for the models of continuous educational returns and the other model of educational attainment levels, which relax the assumption of a linear increase in wages. In Table 4, we show the regression results of the specified quantiles, i.e., 0.25, 0.50, and 0.75. The findings of our analysis provide several characteristics of returns to education and the effect of gender in disabilities on conditional wage distribution, which appear in the quantile regression.
We first show the estimations of quantile regression with gender and each disability dummy variables to check the possibility of inequality within levels. The estimation of schooling years varies from 42 percent at 25 decile to 10.06 percent at 75 decile in specification (1). Then, we present the results of the coefficients of quantile regression estimates corresponding to Equation (1) in Section 3.1. As reported above in Section 3.1, the average estimated educational return is 20.4 percent, whereas the return at 0.25 decile reaches 29.7 percent and 10.4 percent at 0.75 decile in specification (2). We observe that returns to educations are higher at lower points of the conditional wage distribution. This suggests that there is heterogeneity in the return of education which is larger for individuals at the lower quantile of the conditional wage distribution. This result is not yet well explained by the existing literature, most of which reports that schooling returns are higher for the more educated and more skilled individuals [42].
From another angle, we would say that lower-wage workers achieve more educational returns. Another important finding regards the disparity of the coefficients on disabilities’ dummies for males and females. Using the OLS as baseline, we see the huge difference between each quantile at different points of the wage distribution. At the lower end of the distribution, the most severe case is found for females with physical impairments, for whom the coefficient is statistically significant and which is below the estimate of average estimated returns in Section 4.1, while the least severity is observed at the top of the conditional distribution. The similarity of findings is also consistent for the other impairment groups regardless of gender. Likewise, our analysis shows the coefficients of quantile regression estimates corresponding to Equation (2) in Section 3.2 as discontinuous wage earnings.
A remarkable finding is the coefficient of each educational level at the 0.25 quantile. The coefficients for males in each education level are relatively larger and significant for the bottom tail of the distribution than the estimates from 3.2; the coefficients for females are only larger and statistically significant when obtaining lower or higher diplomas. An implication of our results is that the signaling effect may appear for the lower part of the conditional distribution, which implies that the effects of asymmetric information tends to increase in the lower conditional distribution.
5. Concluding Remarks
In this paper, we estimate the gender effect on return to investment in education among individuals with hearing, physical, and visual difficulties in the Philippines. After adjusting for sample selection to address endogenous labor participation and accounting for the endogeneity of schooling decisions, our estimations indicate a remarkably high rate of returns of education, ranging from 24.9 to 38.4 percent. However, upon classifying disability dummy variables for each gender, we observe a compounded effect of double disadvantage (gender and disability) in the labor-market participation of females with disabilities.
Furthermore, our examination of the potential nonlinear-schooling returns suggests that the impact of disability is more pronounced for females compared to their male counterparts. These findings point to the existence of a double disadvantage and signaling effect for females with disabilities. Moreover, the wage disadvantage associated with disability and gender is disproportionately distributed within the population. While return of education is higher at lower points, the coefficients on disability dummies for females are more severe at the lower end of the distribution. The sizable gender gap in the labor-force participation for females with disabilities after education indicates that education alone cannot translate into labor-market returns in the same way as they do for male counterparts.
Our research, therefore, underscores the importance of not only enhancing educational opportunities, but also significantly improving employment prospects, particularly for females with disabilities. This necessitates the implementation of equal opportunity provisions, such as antidiscrimination measures, an expansion of the quota system to enhance employment prospects, addressing accessibility issues, and subsidizing private sector employment. Additionally, our study highlights the importance of adopting an intersectionality framework. As posited by Brown and Moloney [49], females with disabilities face greater workplace disadvantages compared to males with disabilities and those without disabilities, irrespective of gender.
In recent years, there has been an increased awareness of intersectionality, emphasizing the urgent need to understand and address the multiple forms of inequality and discrimination arising from both disabilities and gender. It is crucial not to overlook these aspects in the formulation and implementation of policies aimed at increasing labor-market participation for females with disabilities [50].
Finally, our study is limited to the urban area of the Philippines, with a dataset comprising only persons with disabilities. Therefore, we suggest further research in this area utilizing a nationally representative dataset, considering the Washington Group on Disability Statistics instruments, including the recently developed Washington Group/ILO Disability Module. As Lamichhane et al. [51] emphasized, efforts should be made to design surveys allowing data disaggregation by disability status and a range of context-relevant demographic characteristics and equity dimensions (such as employment among youth with disabilities disaggregated by age, sex, gender identity, ethnicity, race, disability type, socio-economic status, and sexual orientation) to gain a deeper understanding of labor-market gaps by disability and gender.
Author Contributions
Conceptualization, K.L.; methodology, T.W.; software, T.W.; validation, K.L. and T.W.; formal analysis, T.W.; investigation, K.L. and T.W.; data curation, K.L. and T.W.; writing—original draft preparation, K.L.; writing—review and editing, K.L. and T.W.; visualization, T.W.; supervision, K.L.; and project administration, K.L. All authors have read and agreed to the published version of the manuscript.
Funding
This research received no external funding.
Institutional Review Board Statement
This survey was approved by the National Statistical Coordination Board (NSCB) of the Philippines under “NSCB Approval No. PIDS-0815-01”. It is important to note that NSCB has later merged into the Philippine Statistics Authority, establishing the legitimacy of the survey as recognized by the Philippine statistical authority. Further details on this organizational change can be found here: https://openstat.psa.gov.ph/Metadata/PSA-Structure-and-Organization (accessed on 20 August 2023). Furthermore, the survey adheres to ethical principles to safeguard the privacy and rights of the participants. Participants were informed that their involvement in the survey is entirely voluntary, and they may choose to participate or withdraw without facing any negative consequences. Furthermore, it is essential to emphasize that any information provided by the respondents will be treated with the utmost confidentiality. The collected data will be used exclusively for research purposes only, and respondents’ identities will not be disclosed in any document resulting from this survey.
Informed Consent Statement
Informed consent was obtained from all subjects involved in the study.
Data Availability Statement
The data presented in this study are available on request from the corresponding author.
Acknowledgments
We thank the Institute of Developing Economies (IDE) in Japan for allowing us to use the data on disability collected by them together with the Philippines Institute of Development Studies. In addition, we also wish to thank Tatsufumi Yamagata of Ritsumeikan Asia Pacific University and Anirudh Tagat of Monk Prayogshala for the helpful comments while drafting the paper.
Conflicts of Interest
The authors declare no conflict of interest.
References
- Gunderson, M.; Oreopolous, P. Returns to education in developed countries. In The Economics of Education; Elsevier: Amsterdam, The Netherlands, 2020; pp. 39–51. ISBN 978-0-12-815391-8. [Google Scholar]
- Patrinos, H.A.; Psacharopoulos, G. Returns to education in developing countries. In The Economics of Education; Elsevier: Amsterdam, The Netherlands, 2020; pp. 53–64. ISBN 978-0-12-815391-8. [Google Scholar]
- Card, D. The Causal Effect of Education on Earnings. In Handbook of Labor Economics; Elsevier: Amsterdam, The Netherlands, 1999; Volume 3, pp. 1801–1863. ISBN 978-0-444-50187-5. [Google Scholar]
- Lamichhane, K.; Okubo, T. The Nexus between Disability, Education, and Employment: Evidence from Nepal. Oxf. Dev. Stud. 2014, 42, 439–453. [Google Scholar] [CrossRef]
- Lamichhane, K. Individuals with visual impairments teaching in Nepal’s mainstream schools: A model for inclusion. Int. J. Incl. Educ. 2016, 20, 16–31. [Google Scholar] [CrossRef]
- Braithwaite, J.; Mont, D. Disability and poverty: A survey of World Bank Poverty Assessments and implications. Alter 2009, 3, 219–232. [Google Scholar] [CrossRef]
- Mitra, S.; Yap, J. The 2022 Disability Data Report. 2022. Available online: https://disabilitydata.ace.fordham.edu/twentyreport/disability-data-initiative-2022-report/ (accessed on 20 August 2023).
- Card, D. Estimating the Return to Schooling: Progress on Some Persistent Econometric Problems. Econometrica 2001, 69, 1127–1160. [Google Scholar] [CrossRef]
- Heckman, J.J.; Lochner, L.J.; Todd, P.E. Chapter 7 Earnings Functions, Rates of Return and Treatment Effects: The Mincer Equation and Beyond. In Handbook of the Economics of Education; Elsevier: Amsterdam, The Netherlands, 2006; Volume 1, pp. 307–458. ISBN 978-0-444-51399-1. [Google Scholar]
- Deming, D.J. Four Facts about Human Capital. J. Econ. Perspect. 2022, 36, 75–102. [Google Scholar] [CrossRef]
- Klasen, S. What Explains Uneven Female Labor Force Participation Levels and Trends in Developing Countries? World Bank Res. Obs. 2019, 34, 161–197. [Google Scholar] [CrossRef]
- Jayachandran, S. Social Norms as a Barrier to Women’s Employment in Developing Countries. IMF Econ. Rev. 2021, 69, 576–595. [Google Scholar] [CrossRef]
- Li, N. Women’s work in India: Evidence from changes in time use between 1998 and 2019. World Dev. 2023, 161, 106107. [Google Scholar] [CrossRef]
- Filmer, D. Disability, Poverty, and Schooling in Developing Countries: Results from 14 Household Surveys. World Bank Econ. Rev. 2008, 22, 141–163. [Google Scholar] [CrossRef]
- Mitra, S.; Sambamoorthi, U. Disability and the Rural Labor Market in India: Evidence for Males in Tamil Nadu. World Dev. 2008, 36, 934–952. [Google Scholar] [CrossRef]
- Mitra, S.; Sambamoorthi, U. Wage differential by disability status in an agrarian labour market in India. Appl. Econ. Lett. 2009, 16, 1393–1398. [Google Scholar] [CrossRef]
- Mizunoya, S.; Mitra, S. Is There a Disability Gap in Employment Rates in Developing Countries? World Dev. 2013, 42, 28–43. [Google Scholar] [CrossRef]
- Hollenbeck, K.; Kimmel, J. Differences in the Returns to Education for Males by Disability Status and Age of Disability Onset. South. Econ. J. 2008, 74, 707–724. [Google Scholar] [CrossRef]
- Lamichhane, K.; Sawada, Y. Disability and returns to education in a developing country. Econ. Educ. Rev. 2013, 37, 85–94. [Google Scholar] [CrossRef]
- Albert, J.R.; Mori, S.; Reyes, C.; Tabuga, A.D.; Yamagata, T. Income Disparity among Persons with Disabilities, Assessed by Education and Sex: Accentuated Gender Difference Found in Metro Manila, the Philippines: Income Disparity Among Persons with Disabilities in Metro Manila. Dev. Econ. 2015, 53, 289–302. [Google Scholar] [CrossRef]
- Pinilla-Roncancio, M.; Gallardo, M. Inequality in labour market opportunities for people with disabilities: Evidence for six Latin American countries. Glob. Soc. Policy 2023, 23, 67–91. [Google Scholar] [CrossRef]
- Tiwari, S.; Savastano, S.; Winters, P.; Improta, M. Rural economic activities of persons with disabilities in Sub-Saharan Africa. Oxf. Dev. Stud. 2022, 50, 321–335. [Google Scholar] [CrossRef]
- Stern, S. Measuring the Effect of Disability on Labor Force Participation. J. Hum. Resour. 1989, 24, 361. [Google Scholar] [CrossRef]
- DeLeire, T. The Wage and Employment Effects of the Americans with Disabilities Act. J. Hum. Resour. 2000, 35, 693. [Google Scholar] [CrossRef]
- DeLeire, T. Changes in Wage Discrimination against People with Disabilities: 1984–93. J. Hum. Resour. 2001, 36, 144. [Google Scholar] [CrossRef]
- Hotchkiss, J.L. The Labor Market Experience of Workers with Disabilities: The ADA and Beyond; W.E. Upjohn Institute: Kalamazoo, MI, USA, 2003; ISBN 978-0-585-44978-4. [Google Scholar]
- Psacharopoulos, G.; Patrinos, H.A. Returns to investment in education: A further update. Educ. Econ. 2004, 12, 111–134. [Google Scholar] [CrossRef]
- UNDP. Human Development Report 2021: Uncertain Times, Unsettled Lives: Shaping Our Future in a Transforming World; Human Development Report; United Nations Development Programme: New York, NY, USA, 2022; ISBN 978-92-1-126451-7. [Google Scholar]
- World Economic Forum. Global Gender Gap Report 2022. Available online: https://www.weforum.org/publications/global-gender-gap-report-2022/ (accessed on 20 August 2023).
- Lamichhane, K.; Takeda, T. Disability and Intrahousehold Investment Decisions in Education: Empirical Evidence from Bangladesh. Asian Dev. Rev. 2022, 39, 201–238. [Google Scholar] [CrossRef]
- Reyes, C.M.; Tabuga, A.D.; Mina, C.D. Features of life of PWDs. In Poverty Reduction of the Disabled; Routledge: Abingdon, UK, 2014; pp. 25–70. [Google Scholar]
- Yamauchi, F.; Tiongco, M. Why women are progressive in education? Gender disparities in human capital, labor markets, and family arrangement in the Philippines. Econ. Educ. Rev. 2013, 32, 196–206. [Google Scholar] [CrossRef]
- Angrist, J.D.; Krueger, A.B. Does Compulsory School Attendance Affect Schooling and Earnings? Q. J. Econ. 1991, 106, 979–1014. [Google Scholar] [CrossRef]
- Angrist, J.D.; Imbens, G.W.; Rubin, D.B. Identification of Causal Effects Using Instrumental Variables. J. Am. Stat. Assoc. 1996, 91, 444–455. [Google Scholar] [CrossRef]
- Trostel, P.; Walker, I.; Woolley, P. Estimates of the economic return to schooling for 28 countries. Labour Econ. 2002, 9, 1–16. [Google Scholar] [CrossRef]
- Soderbom, M.; Teal, F.; Wambugu, A.; Kahyarara, G. The Dynamics of Returns to Education in Kenyan and Tanzanian Manufacturing. Oxf. Bull Econ Stats 2006, 68, 261–288. [Google Scholar] [CrossRef]
- Amemiya, T. Advanced Econometrics; Harvard University Press: Cambridge, MA, USA, 1985; ISBN 978-0-674-00560-0. [Google Scholar]
- Spence, M. Job Market Signaling. Q. J. Econ. 1973, 87, 355. [Google Scholar] [CrossRef]
- Arrow, K.J. Higher education as a filter. J. Public Econ. 1973, 2, 193–216. [Google Scholar] [CrossRef]
- Stiglitz, J.E. The Theory of Screening, Education, and the Distribution of Income. Am. Econ. Rev. 1975, 65, 283–300. [Google Scholar] [CrossRef]
- Hungerford, T.; Solon, G. Sheepskin Effects in the Returns to Education. Rev. Econ. Stat. 1987, 69, 175. [Google Scholar] [CrossRef]
- Jaeger, D.A.; Page, M.E. Degrees Matter: New Evidence on Sheepskin Effects in the Returns to Education. Rev. Econ. Stat. 1996, 78, 733. [Google Scholar] [CrossRef]
- Martins, P.S.; Pereira, P.T. Does education reduce wage inequality? Quantile regression evidence from 16 countries. Labour Econ. 2004, 11, 355–371. [Google Scholar] [CrossRef]
- Wooldridge, J.M. Econometric Analysis of Cross Section and Panel Data, 2nd ed.; MIT Press: Cambridge, MA, USA, 2010; ISBN 978-0-262-23258-6. [Google Scholar]
- Lamichhane, K. Disability and barriers to education: Evidence from Nepal. Scand. J. Disabil. Res. 2013, 15, 311–324. [Google Scholar] [CrossRef]
- Lamichhane, K. Employment situation and life changes for people with disabilities: Evidence from Nepal. Disabil. Soc. 2012, 27, 471–485. [Google Scholar] [CrossRef]
- Asian Development Bank (Ed.) Gender Equality in the Labor Market in the Philippines; ILO Regional Office for Asia and the Pacific: Bangkok, Thailand, 2013; ISBN 978-92-9254-403-4. [Google Scholar]
- Schady, N.R. Convexity and Sheepskin Effects in the Human Capital Earnings Function: Recent Evidence for Filipino Men. Oxf. Bull Econ Stats 2003, 65, 171–196. [Google Scholar] [CrossRef]
- Brown, R.L.; Moloney, M.E. Intersectionality, Work, and Well-Being: The Effects of Gender and Disability. Gend. Soc. 2019, 33, 94–122. [Google Scholar] [CrossRef]
- Hutchinson, D.L.; Underwood, L.J. (Eds.) The Intersectionality of Women’s Lives and Resistance; Lexington Books: Lanham, MD, USA, 2020; ISBN 978-1-79361-370-7. [Google Scholar]
- Lamichhane, K.; Venetis, E.; Mulcahy-Dunn, A.; Batchelder, K. Approaches to Increasing Employment and Quality of Employment Among Youth with Disabilities; USAID Evidence and Good Practices Paper; United States Agency for International Development: Washington, DC, USA, 2022. [Google Scholar]
Figure 1.
Regional averages (%) Source: Psacharopoulos and Patrinos 2004.

Figure 2.
Years of schooling.


Table 1.
Descriptive statistics.
| (1) | (2) | (3) | (4) | (5) | |
|---|---|---|---|---|---|
| Variable Names | N (If Dummy = 1) | Mean | Sd | Min | Max |
| Dummy = 1 if female | 365 (140) | 0.384 | 0.487 | 0 | 1 |
| Years of schooling | 365 | 8.425 | 4.192 | 0 | 16 |
| Years of schooling (female) | 140 | 7.871 | 4.448 | 0 | 16 |
| Years of schooling (male) | 225 | 8.769 | 3.997 | 0 | 16 |
| Income (PHP) | 365 | 60,665 | 87,424 | 1 | 660,000 |
| Income (PHP, female) | 140 | 50,216 | 85,939 | 1 | 660,000 |
| Income (PHP, male) | 225 | 67,167 | 87,898 | 1 | 600,000 |
| Age | 365 | 37.77 | 12.57 | 15 | 67 |
| Age (female) | 140 | 38.23 | 13.22 | 15 | 67 |
| Age (male) | 225 | 37.48 | 12.17 | 15 | 61 |
| Dummy = 1 if physically impaired | 365 (120) | 0.329 | 0.470 | 0 | 1 |
| Dummy = 1 if visually impaired | 365 (140) | 0.384 | 0.487 | 0 | 1 |
| Dummy = 1 if hearing impaired | 365 (105) | 0.288 | 0.453 | 0 | 1 |
| Dummy = 1 if physically impaired * female | 365 (38) | 0.104 | 0.306 | 0 | 1 |
| Dummy = 1 if visually impaired * female | 365 (52) | 0.142 | 0.350 | 0 | 1 |
| Dummy = 1 if hearing impaired * female | 365 (50) | 0.137 | 0.344 | 0 | 1 |
| Dummy = 1 if physically impaired * male | 365 (82) | 0.225 | 0.418 | 0 | 1 |
| Dummy = 1 if visually impaired * male | 365 (88) | 0.241 | 0.428 | 0 | 1 |
| Dummy = 1 if hearing impaired * male | 365 (55) | 0.151 | 0.358 | 0 | 1 |
| Average onset age for physically impaired | 114 | 23.06 | 16.22 | 0 | 53 |
| Average onset age for visually impaired | 136 | 26.21 | 14.16 | 0 | 57 |
| Dummy = 1 if hearing impaired since born | 105 (60) | 0.571 | 0.497 | 0 | 1 |
| Dummy = 1 if hearing impaired before 3 years old | 105 (24) | 0.229 | 0.422 | 0 | 1 |
| Dummy = 1 if hearing impaired after 3 years old | 105 (15) | 0.143 | 0.352 | 0 | 1 |
| Dummy = 1 if Makati area resident | 365 (121) | 0.332 | 0.471 | 0 | 1 |
| Dummy = 1 if Quezon area resident | 365 (108) | 0.296 | 0.457 | 0 | 1 |
| Dummy = 1 if Valenzuela area resident | 365 (67) | 0.189 | 0.392 | 0 | 1 |
| Dummy = 1 if Pasay area | 365 (69) | 0.184 | 0.388 | 0 | 1 |
Note: Onset information on disability is not answered by some persons. Thus, the numbers for these categories are below the total number. * in the variable names represents interactions.
Table 2.
Estimation results of earnings regression with continuous educational years.
| Dependent Variable: Log Income (Years of Schooling (5) and (10)) | ||||||||||
|---|---|---|---|---|---|---|---|---|---|---|
| (1) | (2) | (3) | (4) | (5) | (6) | (7) | (8) | (9) | (10) | |
| Variable names | OLS | Tobit | IV-OLS | IV-Tobit | First-Stage | OLS | Tobit | IV-OLS | IV-Tobit | First-Stage |
| Years of schooling | 0.259 *** | 0.312 *** | 0.348 ** | 0.395 * | 0.257 *** | 0.309 *** | 0.336 * | 0.381 * | ||
| (0.0498) | (0.0628) | (0.172) | (0.203) | (0.0498) | (0.0625) | (0.177) | (0.208) | |||
| Age | 0.283 ** | 0.341 ** | 0.221 * | 0.269 * | 0.345 *** | 0.290 ** | 0.351 ** | 0.222 * | 0.272 * | 0.363 *** |
| (0.114) | (0.142) | (0.129) | (0.157) | (0.119) | (0.115) | (0.142) | (0.131) | (0.159) | (0.119) | |
| Age squared | −0.00325 ** | −0.00391 ** | −0.00249 | −0.00304 | −0.00395 ** | −0.00335 ** | −0.00404 ** | −0.00249 | −0.00308 | −0.00418 *** |
| (0.00146) | (0.00180) | (0.00168) | (0.00203) | (0.00157) | (0.00147) | (0.00181) | (0.00169) | (0.00205) | (0.00157) | |
| Dummy = 1 if female | −0.899 ** | −1.095 ** | −0.923 * | −1.106 * | −0.978 ** | |||||
| (0.435) | (0.527) | (0.493) | (0.588) | (0.444) | ||||||
| Dummy = 1 if physically impaired | −1.923 *** | −2.244 *** | −1.757 *** | −2.001 *** | 0.202 | |||||
| (0.518) | (0.622) | (0.517) | (0.610) | (0.519) | ||||||
| Dummy = 1 if hearing impaired | −1.201 ** | −1.333 ** | −1.474 *** | −1.647 ** | −0.972 * | |||||
| (0.521 | (0.622) | (0.551) | (0.649) | (0.577) | ||||||
| Dummy = 1 if physically impaired * female | −2.806 *** | −3.385 *** | −2.253 ** | −2.609 ** | −0.830 | |||||
| (0.897) | (1.118) | (0.879) | (1.062) | (0.834) | ||||||
| Dummy = 1 if hearing impaired * female | −2.110 *** | −2.408 *** | −2.759 *** | −3.182 *** | −1.912 ** | |||||
| (0.658) | (0.806) | (0.778) | (0.952) | (0.785) | ||||||
| Dummy = 1 if visually impaired * female | −0.446 | −0.482 | −1.120 | −1.240 | −0.0343 | |||||
| (0.653) | (0.755) | (0.712) | (0.822) | (0.796) | ||||||
| Dummy = 1 if physically impaired * male | −1.694 *** | −1.913 *** | −2.040 *** | −2.276 *** | 0.702 | |||||
| (0.580) | (0.679) | (0.566) | (0.663) | (0.607) | ||||||
| Dummy = 1 if hearing impaired * male | −0.860 | −0.906 | −1.307 ** | −1.388 * | −0.335 | |||||
| (0.667) | (0.792) | (0.650) | (0.764) | (0.720) | ||||||
| Dummy = 1 if Makati area | −2.206 *** | −2.574 *** | −2.481 *** | −2.807 *** | 0.709 | −2.211 *** | −2.580 *** | −2.453 *** | −2.779 *** | 0.690 |
| (0.575) | (0.686) | (0.616) | (0.726) | (0.630) | (0.576) | (0.686) | (0.611) | (0.720) | (0.625) | |
| Dummy = 1 if Quezon area | −1.381 ** | −1.535 ** | −1.873 *** | −2.086 *** | −0.854 | −1.415 ** | −1.585 ** | −1.835 *** | −2.046 *** | −0.912 |
| (0.548) | (0.638) | (0.551) | (0.640) | (0.653) | (0.552) | (0.641) | (0.561) | (0.652) | (0.660) | |
| Dummy = 1 if Valenzuela area | −1.957 *** | −2.250 *** | −2.200 *** | −2.476 *** | −0.523 | −1.948 *** | −2.226 *** | −2.267 *** | −2.555 *** | −0.511 |
| (0.656) | (0.786) | (0.683) | (0.809) | (0.741) | (0.667) | (0.797) | (0.683) | (0.811) | (0.739) | |
| Years of schooling (Mother) | 0.0809 | 0.0818 | ||||||||
| (0.0695) | (0.0694) | |||||||||
| Years of schooling (Father) | 0.239 *** | 0.236 *** | ||||||||
| (0.0685) | (0.0675) | |||||||||
| Constant | 2.377 | 0.710 | 2.673 | 1.244 | −0.577 | 3.485 | 1.862 | 4.694 ** | 3.431 | −0.330 |
| (2.129) | (2.696) | (2.300) | (2.874) | (2.249) | (2.216) | (2.777) | (2.328) | (2.886) | (2.371) | |
| Observations | 365 | 365 | 300 | 300 | 300 | 365 | 365 | 300 | 300 | 300 |
| First-stage F statistic for excluded instruments (p-value) | 15.026 | 14.887 | ||||||||
| (0.000) | (0.000) | |||||||||
| Sargan statistic test | 0.040 | 0.067 | ||||||||
| (0.842) | ||||||||||
| R-squared | 0.187 | 0.195 | 0.189 | 0.201 | ||||||
Note: The figures in parentheses are robust standard error. The coefficients with ***, **, and * are statistically significant at, respectively, the 0.01, 0.05, and 0.10 levels of probability (*** p < 0.01, ** p < 0.05, * p < 0.1). Specifications (4) and (9) are based on the first-stage regression (5) and (10). The default category: Dummy = 1 if visually impaired in (1)–(5), Dummy = 1 if visually impaired*male in (6)–(10), and Dummy = 1 if in the Pasay area in specification (1)–(10). * in the variable names represents interactions.
Table 3.
Estimation results of earning regression with discontinuous educational years.
| Dependent Variable: Log Income | ||||
|---|---|---|---|---|
| (1) | (2) | (3) | (4) | |
| Variable Names | OLS | Tobit | OLS | Tobit |
| Age | 0.251 ** | 0.292 ** | 0.315 *** | 0.378 *** |
| (0.118) | (0.142) | (0.116) | (0.142) | |
| Age squared | −0.00287 * | −0.00332 * | −0.00369 ** | −0.00442 ** |
| (0.00152) | (0.00183) | (0.00147) | (0.00180) | |
| Dummy = 1 if female | −0.974 ** | −1.183 ** | ||
| (0.442) | (0.528) | |||
| Kindergarten/preparatory school | −4.718 *** | −30.78 | ||
| (1.117) | (0) | |||
| Elementary grade I to V | −0.419 | −0.455 | ||
| (1.041) | (1.318) | |||
| Elementary graduate | 1.992 * | 2.482 * | ||
| (1.108) | (1.342) | |||
| 1st to 3rd year high school | 2.321 ** | 2.915 ** | ||
| (1.004) | (1.240) | |||
| High school graduate | 1.651 * | 2.057 * | ||
| (0.992) | (1.225) | |||
| Vocational school | 2.298 ** | 2.787 ** | ||
| (1.111) | (1.355) | |||
| Post-secondary | 5.880 *** | 6.993 *** | ||
| (1.023) | (1.315) | |||
| College level | 2.029 ** | 2.480 ** | ||
| (0.978) | (1.209) | |||
| College or university graduate | 4.002 *** | 4.735 *** | ||
| (0.889) | (1.122) | |||
| Master or higher | 3.077 *** | 3.609 *** | ||
| (1.039) | (1.250) | |||
| Not completed lower education (female) | −0.260 | −0.0347 | ||
| (1.345) | (1.789) | |||
| Completed lower education (female) | 2.393 * | 3.173 * | ||
| (1.304) | (1.699) | |||
| Not completed higher education (female) | 1.763 | 2.407 | ||
| (1.394) | (1.802) | |||
| Completed higher education (female) | 3.559 *** | 4.542 *** | ||
| (1.231) | (1.615) | |||
| No grade completed (male) | 0.651 | 1.200 | ||
| (1.639) | (2.088) | |||
| Not completed lower education (male) | 2.082 * | 2.835 * | ||
| (1.238) | (1.637) | |||
| Completed lower education (male) | 1.872 | 2.543 | ||
| (1.257) | (1.648) | |||
| Not completed higher education (male) | 2.945 ** | 3.772 ** | ||
| (1.210) | (1.600) | |||
| Completed higher education (male) | 4.546 *** | 5.532 *** | ||
| (1.160) | (1.559) | |||
| Dummy = 1 if physically impaired | −1.930 *** | −2.262 *** | −1.807 *** | −2.102 *** |
| (0.525) | (0.624) | (0.525) | (0.623) | |
| Dummy = 1 if hearing impaired | −1.000 * | −1.103 * | −1.139 ** | −1.273 * |
| (0.554) | (0.653) | (0.559) | (0.663) | |
| Dummy = 1 if Makati area | −2.113 *** | −2.437 *** | −2.040 *** | −2.361 *** |
| (0.593) | (0.697) | (0.572) | (0.676) | |
| Dummy = 1 if Quezon area | −1.131 ** | −1.215 * | −1.331 ** | −1.463 ** |
| (0.571) | (0.657) | (0.547) | (0.634) | |
| Dummy = 1 if Valenzuela area | −1.707 *** | −1.938 ** | −2.029 *** | −2.359 *** |
| (0.654) | (0.770) | (0.663) | (0.789) | |
| Constant | 4.701 ** | 3.527 | 0.894 | 1.087 |
| (2.378) | (2.902) | (3.137) | (3.108) | |
| Observations | 365 | 365 | 365 | 365 |
| R-squared | 0.217 | 0.190 | ||
Note: The figures in parentheses are robust standard error. The coefficients with ***, **, and * are statistically significant at, respectively, the 0.01, 0.05, and 0.10 levels of probability (*** p < 0.01, ** p < 0.05, * p < 0.1). The default category: Dummy = 1 if no grade completed; Dummy = 1 if visually impaired; Dummy = 1 if Pasay area in (1) and (2); Dummy = 1 if no grade completed for female; Dummy = 1 if visually impaired; and Dummy = 1 if Pasay area in specification (3) and (4).
Table 4.
Estimation results of quantile regressions.
| Dependent Variable: Log Income | |||||||||
|---|---|---|---|---|---|---|---|---|---|
| Variable names | (1) | (2) | (3) | ||||||
| q25 | q50 | q75 | q25 | q50 | q75 | q25 | q50 | q75 | |
| Years of schooling | 0.424 *** | 0.131 *** | 0.106 *** | 0.297 *** | 0.144 *** | 0.104 *** | |||
| (0.114) | (0.0296) | (0.0149) | (0.107) | (0.0299) | (0.0157) | ||||
| Age | 0.415 ** | 0.142 | 0.134 ** | 0.495 ** | 0.186 ** | 0.103 ** | 0.222 | 0.196 ** | 0.135 *** |
| (0.189) | (0.129) | (0.0564) | (0.248) | (0.0815) | (0.0439) | (0.206) | (0.0857) | (0.0451) | |
| Age squared | −0.00474 ** | −0.00152 | −0.00159 ** | −0.00579 * | −0.00209 ** | −0.00112 ** | −0.00277 | −0.00228 ** | −0.00161 *** |
| (0.00225) | (0.00156) | (0.000701) | (0.00306) | (0.00103) | (0.000512) | (0.00258) | (0.00102) | (0.000558) | |
| Dummy = 1 if female | 0.415 ** | 0.142 | 0.134 ** | ||||||
| (0.189) | (0.129) | (0.0564) | |||||||
| Not completed lower education (female) | −0.274 | −0.705 | −0.940 | ||||||
| (2.813) | (3.759) | (0.583) | |||||||
| Completed lower education (female) | 7.313 ** | 0.879 | 0.357 | ||||||
| (2.846) | (3.494) | (0.374) | |||||||
| Not completed higher education (female) | 5.405 | 0.650 | 0.573 | ||||||
| (3.435) | (3.658) | (0.500) | |||||||
| Completed higher education (female) | 7.609 *** | 0.752 | 0.901 | ||||||
| (2.753) | (3.525) | (0.696) | |||||||
| No grade completed (male) | 6.189 | −0.776 | −0.599 | ||||||
| (3.984) | (3.391) | (0.581) | |||||||
| Not completed lower education (male) | 6.850 ** | 0.340 | 0.171 | ||||||
| (2.808) | (3.463) | (0.410) | |||||||
| Completed lower education (male) | 5.955 * | 0.433 | 0.572 | ||||||
| (3.286) | (3.420) | (0.393) | |||||||
| Not completed higher education (male) | 7.675 ** | 0.713 | 0.643 | ||||||
| (3.184) | (3.426) | (0.418) | |||||||
| Completed higher education (male) | 8.774 *** | 1.582 | 1.407 *** | ||||||
| (2.694) | (3.499) | (0.465) | |||||||
| Dummy = 1 if physically impaired | −2.206 | −0.485 | −0.517 ** | −2.137 *** | −0.885 *** | −0.606 *** | |||
| (1.913) | (0.323) | (0.233) | (0.691) | (0.309) | (0.184) | ||||
| Dummy = 1 if hearing impaired | −0.964 | −0.862 ** | −0.646 *** | −1.558 ** | −0.960 ** | −0.573 ** | |||
| (0.981) | (0.359) | (0.176) | (0.712) | (0.425) | (0.254) | ||||
| Dummy = 1 if physically impaired * female | −8.019 *** | −0.573 | −0.632 *** | ||||||
| (2.739) | (2.199) | (0.218) | |||||||
| Dummy = 1 if hearing impaired * female | −3.470 | −1.832 *** | −1.396 *** | ||||||
| (2.217) | (0.381) | (0.324) | |||||||
| Dummy = 1 if visually impaired * female | −1.070 | −0.153 | −0.0308 | ||||||
| (0.859) | (0.468) | (0.232) | |||||||
| Dummy = 1 if physically impaired * male | −1.810 * | −0.792 ** | −0.583 ** | ||||||
| (0.946) | (0.326) | (0.238) | |||||||
| Dummy = 1 if hearing impaired * male | −1.411 | −0.240 | −0.499 ** | ||||||
| (0.949) | (0.374) | (0.193) | |||||||
| Dummy = 1 if Makati area | −2.293 ** | −0.981 *** | −1.010 *** | −2.133 | −1.288 *** | −0.984 *** | −2.160 ** | −1.065 *** | −0.668 *** |
| (0.917) | (0.275) | (0.184) | (1.471) | (0.350) | (0.160) | (1.028) | (0.322) | (0.183) | |
| Dummy = 1 if Quezon area | −1.134 * | −0.585 ** | −0.718 *** | −1.242 ** | −0.721 ** | −0.778 *** | −1.495 ** | −0.995 *** | −0.597 ** |
| (0.619) | (0.249) | (0.210) | (0.586) | (0.355) | (0.187) | (0.579) | (0.321) | (0.234) | |
| Dummy = 1 if Valenzuela area | −1.190 | −0.692 ** | −1.123 *** | −1.170 | −0.984 *** | −1.043 *** | −1.581 | −1.043 ** | −0.911 *** |
| (1.434) | (0.314) | (0.210) | (1.909) | (0.337) | (0.248) | (1.492) | (0.408) | (0.253) | |
| Constant | −1.551 | 7.415 *** | 8.868 *** | −1.411 | 6.618 *** | 9.238 *** | 0.182 | 7.493 ** | 9.122 *** |
| (3.683) | (2.574) | (0.963) | (4.849) | (1.408) | (0.896) | (4.109) | (3.708) | (0.786) | |
| Observations | 365 | 365 | 365 | 365 | 365 | 365 | 365 | 365 | 365 |
Note: The figures in parentheses are robust standard error. The coefficients with ***, **, and * are statistically significant at, respectively, the 0.01, 0.05, and 0.10 levels of probability (*** p < 0.01, ** p < 0.05, * p < 0.1) The default category: Dummy = 1 if visually impaired and Dummy = 1 if Pasay area in specification (1); Dummy = 1 if visually impaired and male, and Dummy = 1 if Pasay area in specification (2); and Dummy = 1 if No grade completed for female, Dummy = 1 if visually impaired and Dummy = 1 if Pasay area in specification (3). * in the variable names represents interactions.
Disclaimer/Publisher’s Note: The statements, opinions and data contained in all publications are solely those of the individual author(s) and contributor(s) and not of MDPI and/or the editor(s). MDPI and/or the editor(s) disclaim responsibility for any injury to people or property resulting from any ideas, methods, instructions or products referred to in the content. |
© 2023 by the authors. Licensee MDPI, Basel, Switzerland. This article is an open access article distributed under the terms and conditions of the Creative Commons Attribution (CC BY) license (https://creativecommons.org/licenses/by/4.0/).
Share and Cite
MDPI and ACS Style
Lamichhane, K.; Watanabe, T. Intersection of Gender and Disability on Returns to Education: A Case from Metro Manila, Philippines. Merits 2023, 3, 682-699. https://0-doi-org.brum.beds.ac.uk/10.3390/merits3040041
AMA Style
Lamichhane K, Watanabe T. Intersection of Gender and Disability on Returns to Education: A Case from Metro Manila, Philippines. Merits. 2023; 3(4):682-699. https://0-doi-org.brum.beds.ac.uk/10.3390/merits3040041
Chicago/Turabian StyleLamichhane, Kamal, and Takayuki Watanabe. 2023. "Intersection of Gender and Disability on Returns to Education: A Case from Metro Manila, Philippines" Merits 3, no. 4: 682-699. https://0-doi-org.brum.beds.ac.uk/10.3390/merits3040041