
Temporal Analysis of SARS-CoV-2 Variants during the COVID-19 Pandemic in Nepal


Department of Biotechnology, Kathmandu University, Dhulikhel P.O. Box 6250, Nepal
*
Author to whom correspondence should be addressed.
COVID 2021, 1(2), 423-434; https://0-doi-org.brum.beds.ac.uk/10.3390/covid1020036
Submission received: 16 September 2021
/
Revised: 22 September 2021
/
Accepted: 22 September 2021
/
Published: 26 September 2021
(This article belongs to the Topic Burden of COVID-19 in Different Countries)
Abstract
:Nepal has suffered two waves of SARS-CoV-2 infections, one in the year 2020 and another in the year 2021. Although the government of Nepal keeps a detailed record of daily coronavirus infections and deaths throughout the country, and publishes the result every day, genomic surveillance of mutants in the country has lagged behind. Sequencing of COVID-19 samples has been conducted sporadically during the pandemic. From the GISAID database, 127 high-quality sequences deposited by different health authorities in Nepal were collected and analyzed. From the analysis, it can be concluded that at least two variants of concern, alpha and delta, and one variant of interest, kappa, were detected in Nepal in 2021. As in other countries, the delta variant outcompeted the kappa and alpha variants and by July 2021 had established itself as the dominant variant. It can be hypothesized that the second wave in Nepal was primarily caused by the delta variant. Further, phylogenetic tree analysis suggests cases of local transmission and global transmission of coronavirus. This analysis reveals the global nature of the disease, where variants arising in one part of the world can quickly spread to other parts of the world and can also spread through individual communities. This paper highlights a need to structure public policy of Nepal to target the delta variant since it has become the predominant variant in Nepal. A further policy suggestion is to appropriately sample and sequence genomes of SARS-CoV-2 at regular intervals to understand the dynamics of variants in the population.
1. Introduction
Since the first identification of the SARS-CoV-2 virus in Wuhan [1], China, SARS-CoV-2 has spread throughout the world and caused a pandemic. Cases of COVID-19 have been reported in Nepal since its first case of COVID-19, a student returning from Wuhan [2]. Nepal, along with India, has suffered two waves of coronavirus infections, one in 2020 and another in 2021. As of September 2021, the government of Nepal has reported over 700,000 cases and over 10,000 deaths attributed to COVID-19 [3].
Like any virus found in nature, SARS-CoV-2 has undergone various rounds of mutations since infecting humans in 2019. The mutation rate of SARS-CoV-2 has been estimated to be about (1.19–1.31) × 10−3/site/year [4]. The SARS-CoV-2 genome encodes for at least 29 proteins. Sixteen are non-structural proteins, first translated as one protein, ORF1ab. Later, this protein is proteolytically cleaved into the 16 non-structural proteins. From other open reading frames, four structural proteins—S, N, E, and M—are transcribed and translated. There are other accessory proteins—NS3a, NS3b, NS6, NS7a, NS7b, NS8, NS9a, NS9b, and NS10—encoded by the genome of the virus [5]. Although mutations can happen in the genomic region encoding for any of these proteins, mutations in the S (Spike) protein, which encodes for a viral receptor that binds to angiotensin-converting enzyme (ACE2) are particularly important. Mutations in the S protein are known to contribute to higher transmissibility and infectivity of the virus [6,7].
One of the first mutations seen in the virus was the D614G mutation in the S protein, which has been hypothesized to lead to higher transmissibility and infectivity of the virus [8]. Globally this substitution mutation has become dominant among SARS-CoV-2 sequences. Since the pandemic began, next-generation sequencing techniques have been refined to better sequence SARS-CoV-2 strains [9]. Sequence information is mostly deposited in the GISAID database and analyzed using various software products developed in the last two years [4,10]. By September 2021, over 3 million different SARS-CoV-2 sequences had been deposited in the GISAID (https://www.gisaid.org/) (accessed on 2 September 2021) database. Among these sequences, over 180 belong to samples from Nepal.
Analysis of sequences has informed us about the evolution and spread of variants of SARS-CoV-2. Different variants of SARS-CoV-2 are named according to different nomenclature systems; PANGO, GISAID, and Nextstrain systems are the prominent nomenclature systems [4,11]. In this paper we have primarily used the NextStrain nomenclature, which names strains according to the year they most spread. The strain names thus start with numbers 19, 20, and 21. The WHO has classified variants based on how fast they transmit and how much illness they cause. Variants are classified as variants of concern (VOCs) and variants of interest (VOIs). So far there are four VOCs: alpha, beta, gamma, and delta [12].
The alpha variant was first discovered in Kent, England in September 2020. It is also called B.1.1.7 according to the PANGO nomenclature and 29I according to the NextStrain nomenclature. Its prominent mutations in the spike proteins are 69−70 deletion, N501Y, and P681H. This variant is believed to be 29% more transmissible than the original Wuhan strain [13]. It was the first variant to be designated the title of variant of concern. After the alpha variant, variants beta and gamma were discovered. The beta variant was first sequenced in May 2020 in South Africa, and the gamma variant was first discovered in Brazil in November 2020. The beta and gamma variants are thought to be 25% and 38% more transmissible than the original Wuhan strain, respectively [14]. The beta strain has K417T, E484K, and N501Y mutations in the spike protein. The gamma strain has K417T, E484K, and N501Y mutations in the spike protein. The delta strain, which was first discovered in October 2020 in India, has so far demonstrated the highest transmissibility rate. While the alpha, beta, and gamma strains share common spike protein mutations, delta has its own spike protein mutation signature. It has L452R, T478K, and P681R substitutions in the S protein. It is believed to be 97% more transmissible than the Wuhan strain [13]. As of September 2021, it is the predominant variant globally.
There are several other variants of interest identified throughout the world. The one that arose in India, and has also spread to Nepal to some extent, is called the kappa variant. Both kappa and delta variants arose from a common ancestor of SARS-CoV-2. Both carry L452R and P581R mutations in the spike protein. However, kappa carries an E484Q mutation and not the T478K mutation found in the delta strain. By most measures, the delta strain has outcompeted the kappa strain.
Since 2020, COVID-19 has been one of the biggest stories in Nepal. Much of the country has been under lockdown for major parts of 2020 and 2021. Business, tourism, and education have been some of the hardest-hit sectors. Most of the decisions on lockdown have been based on the numbers of cases and deaths throughout the country. Since the beginning of the pandemic, a need for genomic surveillance of the SARS-CoV-2 strains raging through Nepal was felt. At the beginning, the country was very ill-equipped to sequence the strains. The first case of COVID-19 was sequenced abroad. There were no amino acid substitution mutations in the original patient [2]. Later on, the Nepal Health Research Council (NHRC) felt a need to sequence the genome of the virus and sent samples abroad. The agency collected 15 COVID-19 samples and sequenced them after August 2020. The results of this report were published on the NHRC website (http://nhrc.gov.np/) (accessed on 4 September 2021). Since then, the NHRC, Dhulikhel Hospital, and a number of other agencies have been sequencing genomes of the coronavirus from time to time. Although strict time interval sequencing has not been performed, the pooling of the sequencing results from various groups gives a picture of the variants that gave rise to the first and second waves of coronavirus infections in Nepal.
In this paper, we attempt to describe the different variants that have infected the population of Nepal during the pandemic of 2020 and 2021. We describe the different variants that have spread throughout the population over this time duration. Furthermore, using phylogenetic trees we attempt to trace back the spread of the variants within the country and from outside the country. We hope this paper gives a history of variants of SARS-CoV-2 in 2020 and 2021. Furthermore, we hope that this paper helps policymakers in Nepal plan a robust response to the pandemic.
2. Materials and Methods
The SARS-CoV-2 sequences for the analysis were obtained from GISAID. Further processing of metadata was done using LibreOffice Spreadsheet and Python 3. All the graphs were plotted using Python 3.
2.1. Retrieval of Daily New Cases and Deaths Due to COVID-19
An extensive Excel sheet containing daily new cases and deaths due to COVID-19 was downloaded for countries throughout the world from https://ourworldindata.org/coronavirus-source-data (accessed on 2 September 2021). From this table, the data for Nepal were isolated and the data for one month were averaged to subtract any noise. Further, the ratio of new deaths to new cases from the monthly averaged data was calculated and presented in a graph. Finally, the monthly average cases and deaths were plotted against the months of the year. The data were downloaded on 2 September 2021.
The COVID-19 death rates in the representative countries were obtained from https://www.worldometers.info/coronavirus/#countries- (accessed on 21 September 2021). The death rate was presented as the number of deaths per million of the total population. The data were plotted with the death rate in Nepal as a reference.
2.2. Retrieval of SARS-CoV-2 Sequences
The sequences used in this study were downloaded from the GISAID portal (https://www.gisaid.org/) (accessed on 2 September 2021) with the location set as Asia/Nepal. Out of the total 184 sequences, 127 were obtained after setting the filter to “Whole genome” and excluding the sequences with low coverage. A FASTA file containing the sequences of 127 samples, the acknowledgment file (Supplementary Material File S1), and the file for the Augur pipeline were downloaded. The date of the search was 3 September 2021.
2.3. Phylogenetic Analysis
The phylogenetic tree was constructed from the sequences downloaded from GISAID using Nextclade (https://clades.nextstrain.org) (accessed on 3 September 2021) and Nextstrain Auspice (https://auspice.us) (accessed on 3 September 2021) web software. SARS-CoV-2 Wuhan-Hu-1/2019 was taken as a reference sequence. Nextclade carries out different processes such as translation, sequence alignment, clade assignment, and phylogenetic placement of the sequences regarding the given sequences, which can then be visualized and/or downloaded. For the pairwise sequence alignment, it uses a variation of the Smith–Waterman algorithm [10,15]. The obtained phylogenetic tree was visualized using Nextstrain Auspice. Each subtree can be visualized to find evidence for local and global transmissions. In the metadata downloaded from Nextstrain Auspice, the latitude and longitude data of the sampling sites were added to prepare an interactive map showing the distributions of different variants throughout the country.
3. Results
In this paper, we analyze the whole genome sequence data for the SARS-CoV-2 pandemic in Nepal. Before delving into details of the sequences, it would be pertinent to analyze the average new cases and deaths over the course of the two examined years. Nepal suffered from two waves of coronavirus infections, one peaking in October 2020 and another peaking in May 2021 (Figure 1). In Figure 1b, the average monthly new cases and average monthly deaths are plotted against time. Discernible COVID-19 cases started in May 2020 in Nepal. In the months of June and July of 2020, there were over 200 daily cases on average, but very few deaths. In the month of August 2020, cases and deaths increased in number. In the first wave, the average number of daily cases rose to 3000, and deaths peaked at less than 20 a day. Cases peaked in October 2020, whereas deaths peaked in November 2020. Although cases reached a baseline level in February and March of 2021, deaths from earlier infection possibly led to a rise in the death rate. The second wave began in April 2021 as cases picked up and peaked in May, when the average number of cases per day reached 8000. Deaths in May 2021 peaked at around 140 a day. After May 2021, deaths and new cases plummeted but remained significant until September 2021. The ratio of deaths to cases is plotted in Figure 1a. The death rate (Figure 1a) substantially rose after the introduction of the delta variant, indicating a higher death rate for the delta variant.
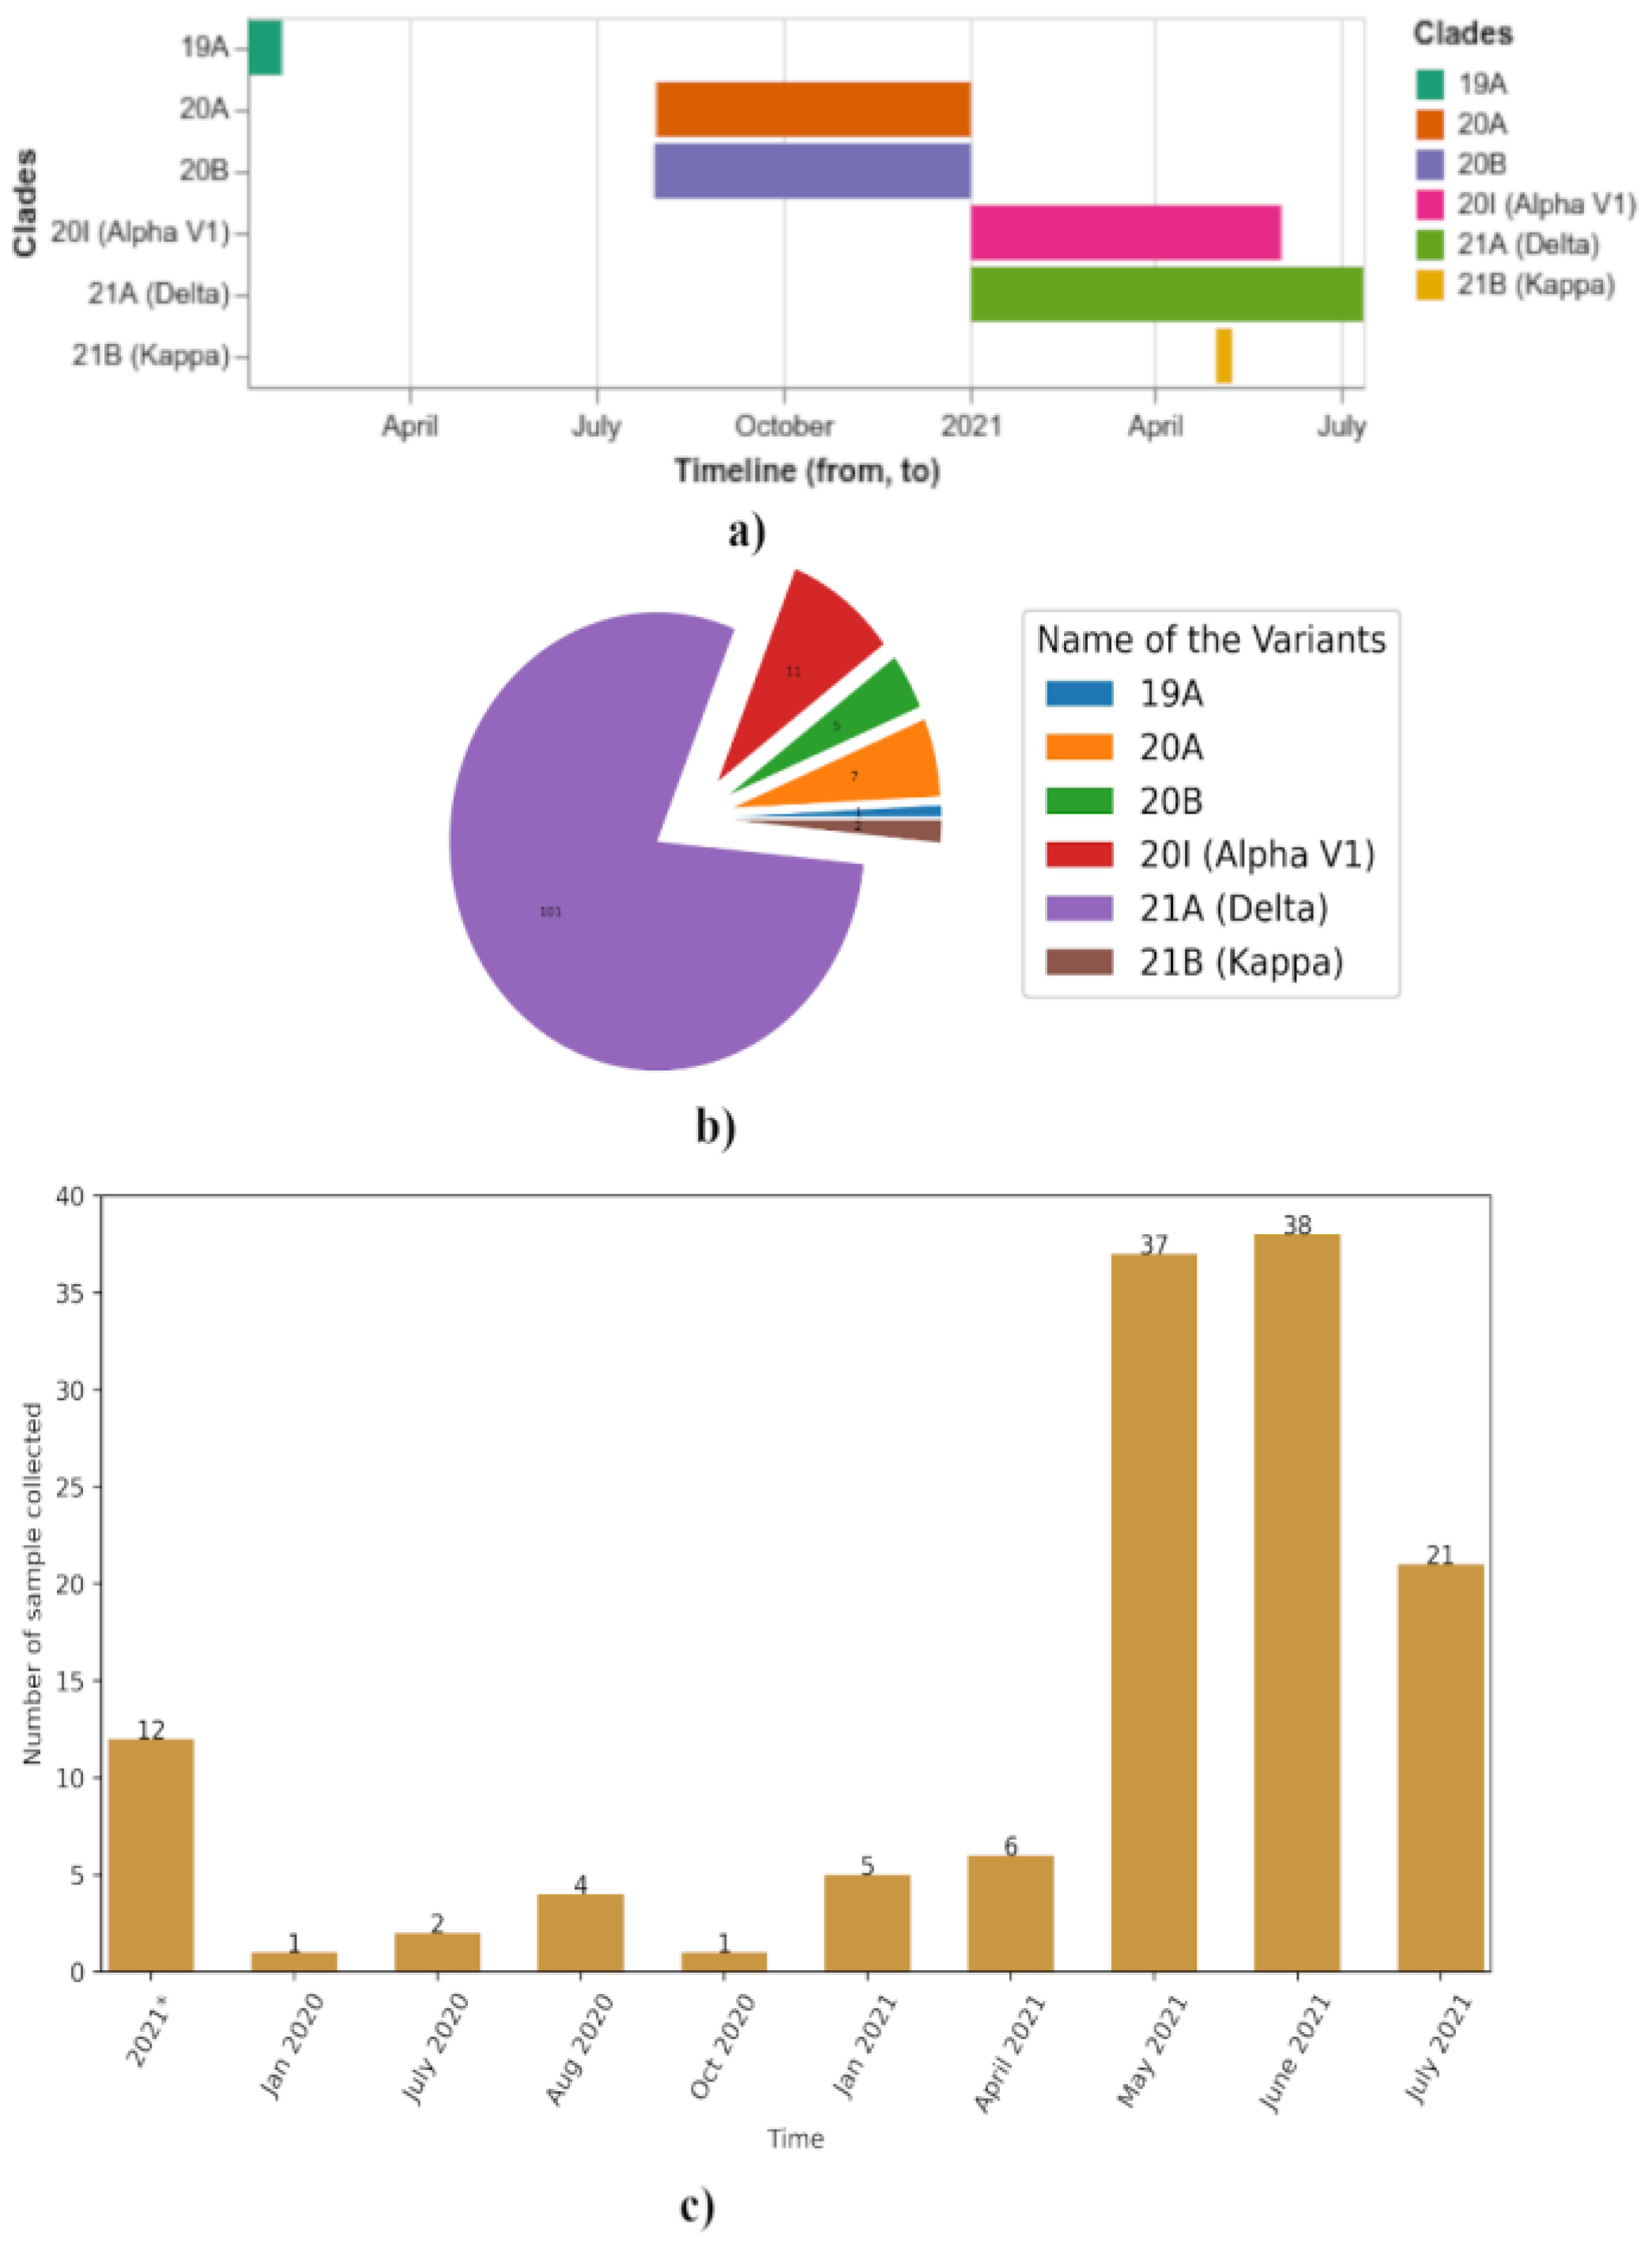
The next important question regards what variants of SARS-CoV-2 drove the first and second waves of coronavirus infection. We could get a very good answer to this question if there were a fixed number of whole genome sequences obtained throughout the country over a regular time interval of one month or so. Unfortunately, such data are not available for Nepal. Although genome sequencing was a top priority from the beginning of the pandemic, lack of infrastructure inside the country led to a paucity of sequencing data. Most of the sequencing information was obtained from facilities abroad at the initiative of the Nepal Health Research Council. From whatever information was provided in the GISAID database, we constructed a temporal map of the variants in Nepal. Only one sample was sequenced in January 2020. It belonged to a COVID-19 patient who traveled from Wuhan, China (Figure 2a). The patient had the 19A strain with no amino acid substitution mutation. Samples collected from August 2020 to January 2021 had 20A and 20B variants. Thereafter, samples collected in 2021 were not from the 19A, 20A, or 20B clades (Figure 2a). They had been replaced by alpha, kappa, and delta variants. Kappa variants appeared until May 2021. Alpha variants appeared until June 2021. Both these variants were outcompeted by the delta variant, which was the only one that appeared in July of 2021 (Figure 2a). From this information, it can be hypothesized that all other variants have been outcompeted by the delta variant. Additionally, it can also be gleaned that the first wave was characterized by the 20A and 20B variants, whereas the second wave was characterized by the alpha, kappa, and delta variants.
In the next figure of the paper, we show the numbers of alpha, kappa, delta, 20A, 20B, and 19A variants sampled through sequencing (Figure 2b). A majority (over 75 percent) of the samples contained the delta variant. The next most abundant variant was the alpha variant. We also present a figure (Figure 2c) showing the numbers of samples sequenced over time. It is important to note that most of the samples were sequenced in 2021 when various variants of concern started arising globally.
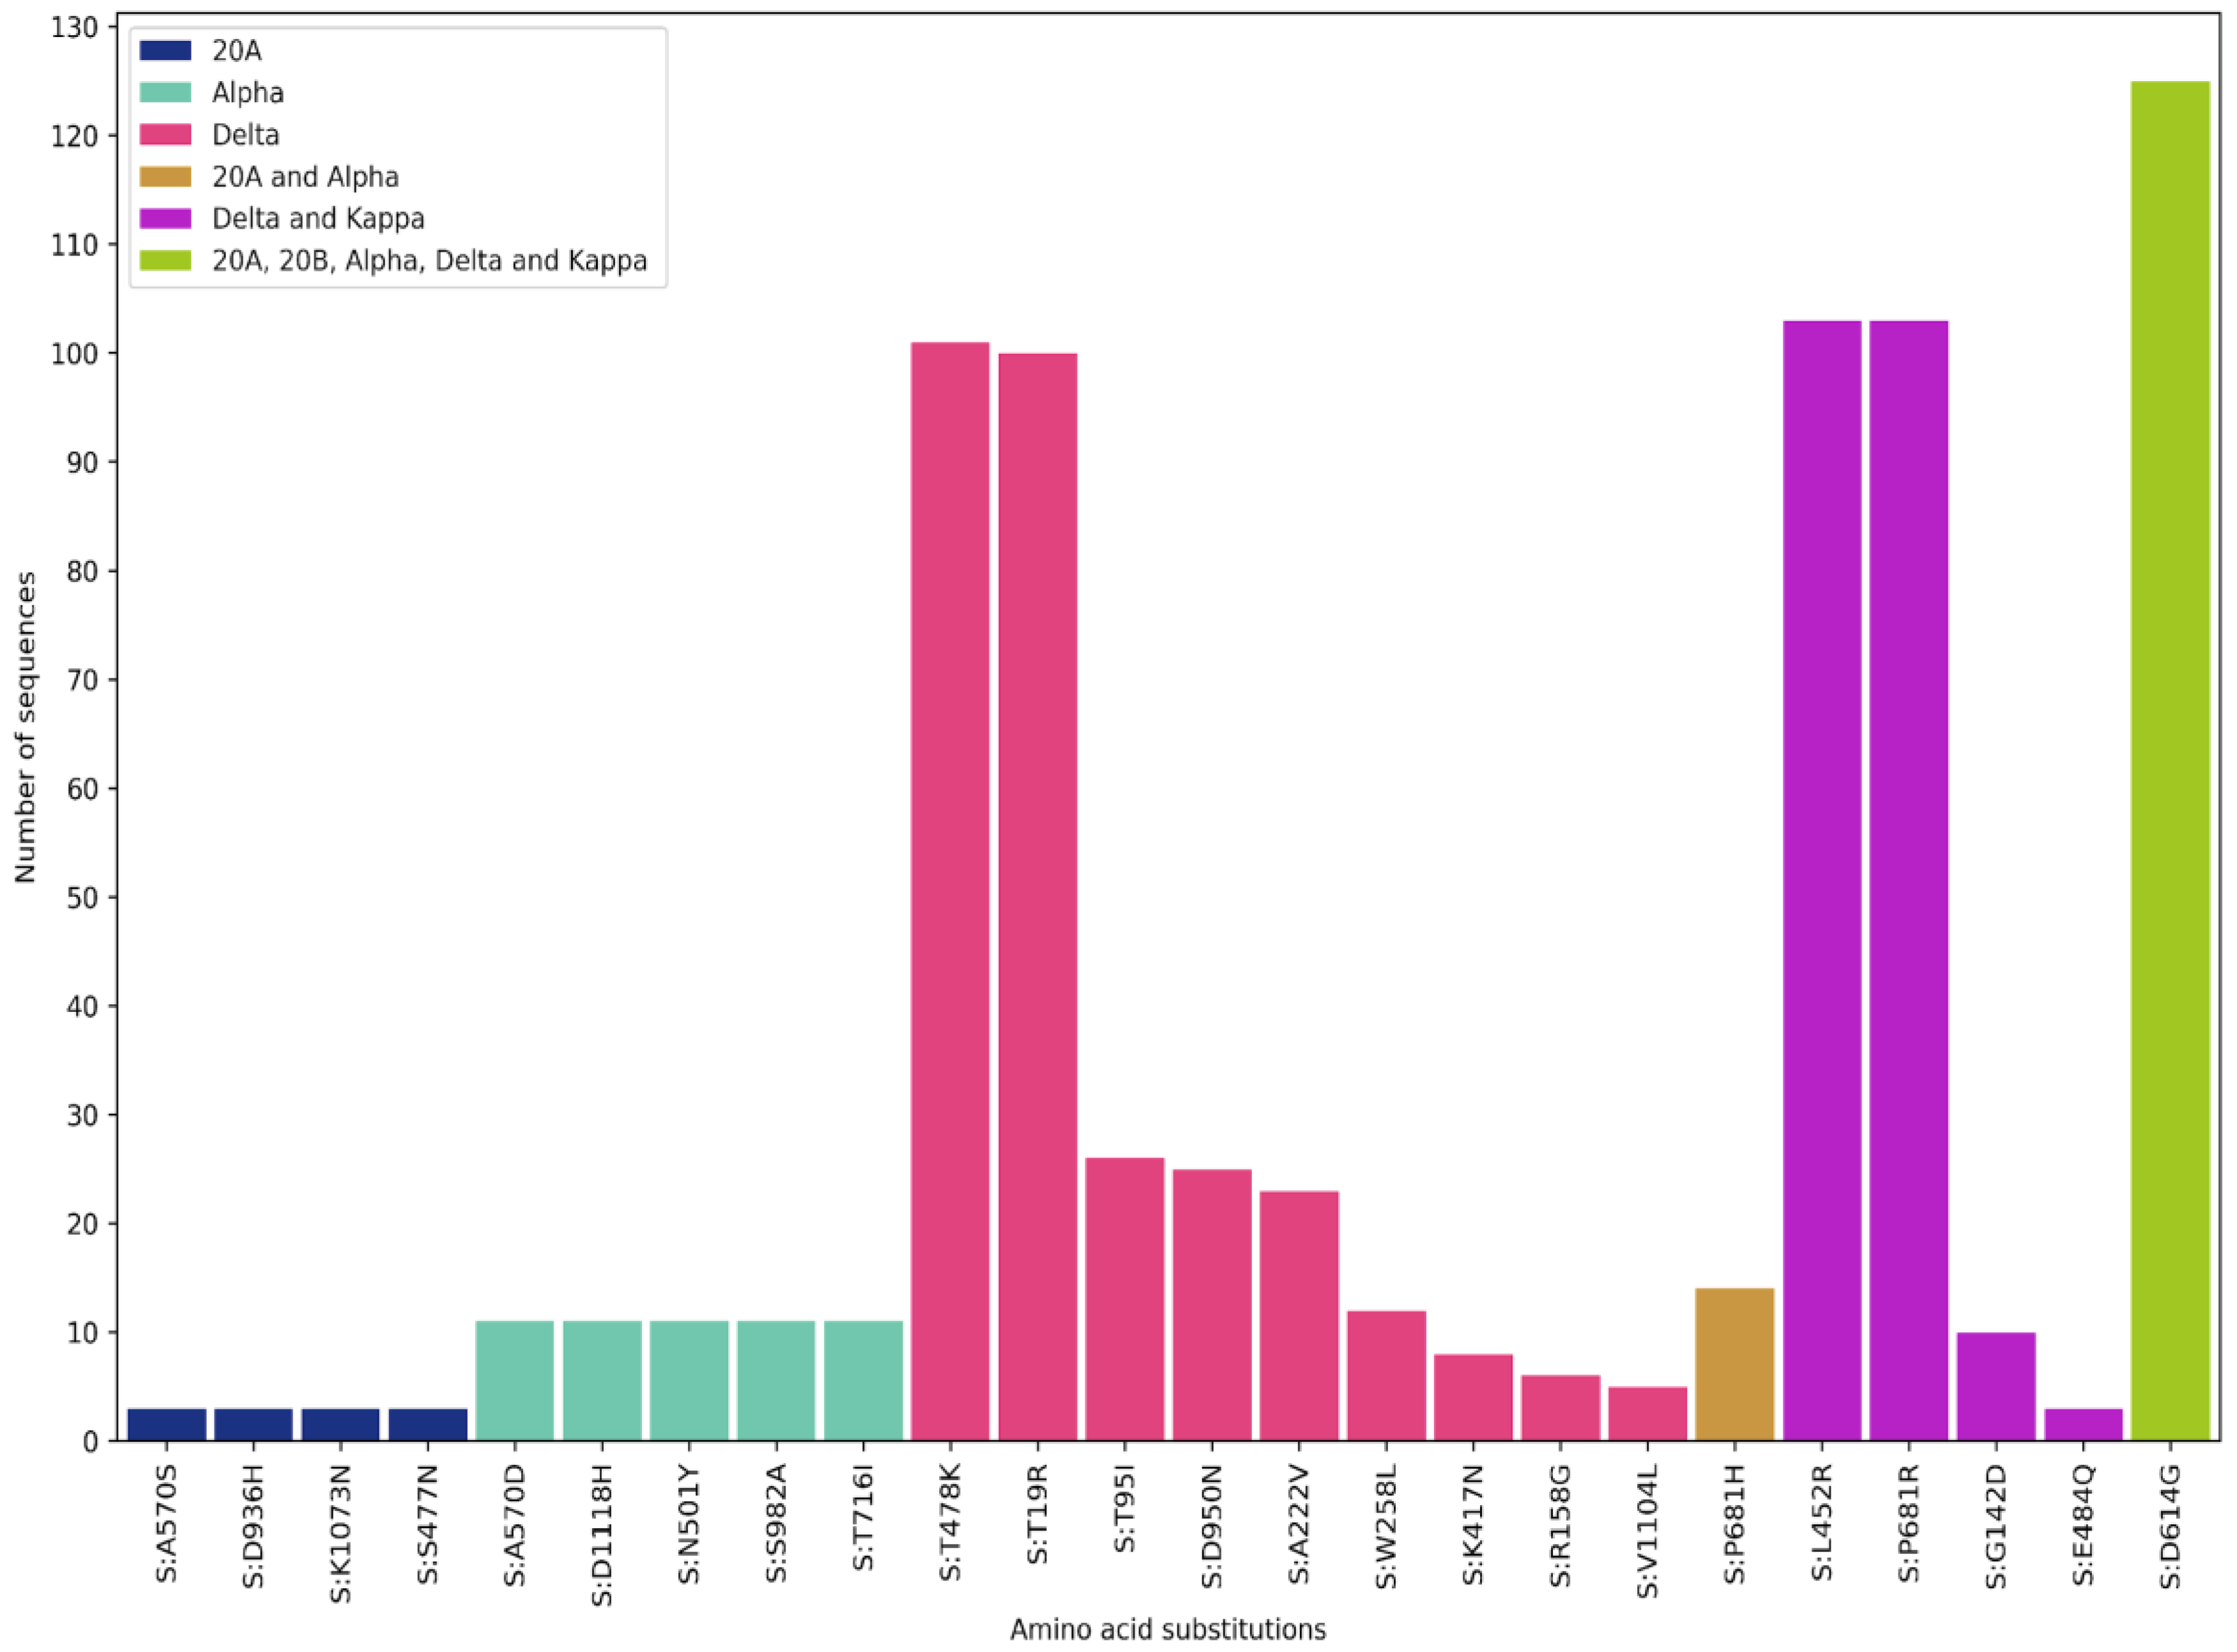
Next, the S protein mutations occurring in the variants within Nepal were analyzed (Figure 3). As expected, D614G mutation was found in all the samples except the first sample. The 20A strain found in Nepal had A570S, D936H, K1073N, and S477N mutations in the S protein. These mutations are not known to increase the transmissibility or infectivity of the SARS-CoV-2 virus. The alpha strain found in Nepal had A570D, D1118H, N501Y, S982A, T716I, and P681H mutations. All these mutations are found in the generic alpha variant originating from Kent, England. Additional mutations of interest were not found in Nepali strains in numbers greater than three. N501Y mutation was found in the receptor binding motif of the S protein and is thought to increase infectivity and transmissibility.
All delta and kappa variants had L452R and P681R mutations. Besides these mutations, the delta variant had T748K and T19R mutations. These two mutations helped increase the infectivity and transmissibility of the virus. L452R and T478K mutations lie in the receptor-binding motif and can be considered very significant mutations [16]. The highly infective AY4 strain of the delta variant has not been found in Nepal. Other mutations in the S protein found in only a fraction of the delta variants in Nepal are T95I, D950N, A222V, W258L, K417N, R158G, and V1104L mutations. The K417N mutation occurs also in the beta variant, and this mutation on top of the delta variant first found in Nepal has been dubbed the delta plus variant. There is no indication whatsoever that this strain is more infectious or transmissible than the original delta strain. The kappa strain found in Nepal demonstrated G142D and E484Q mutations in the S protein. The significance of all these minor mutations in the S protein is unknown.
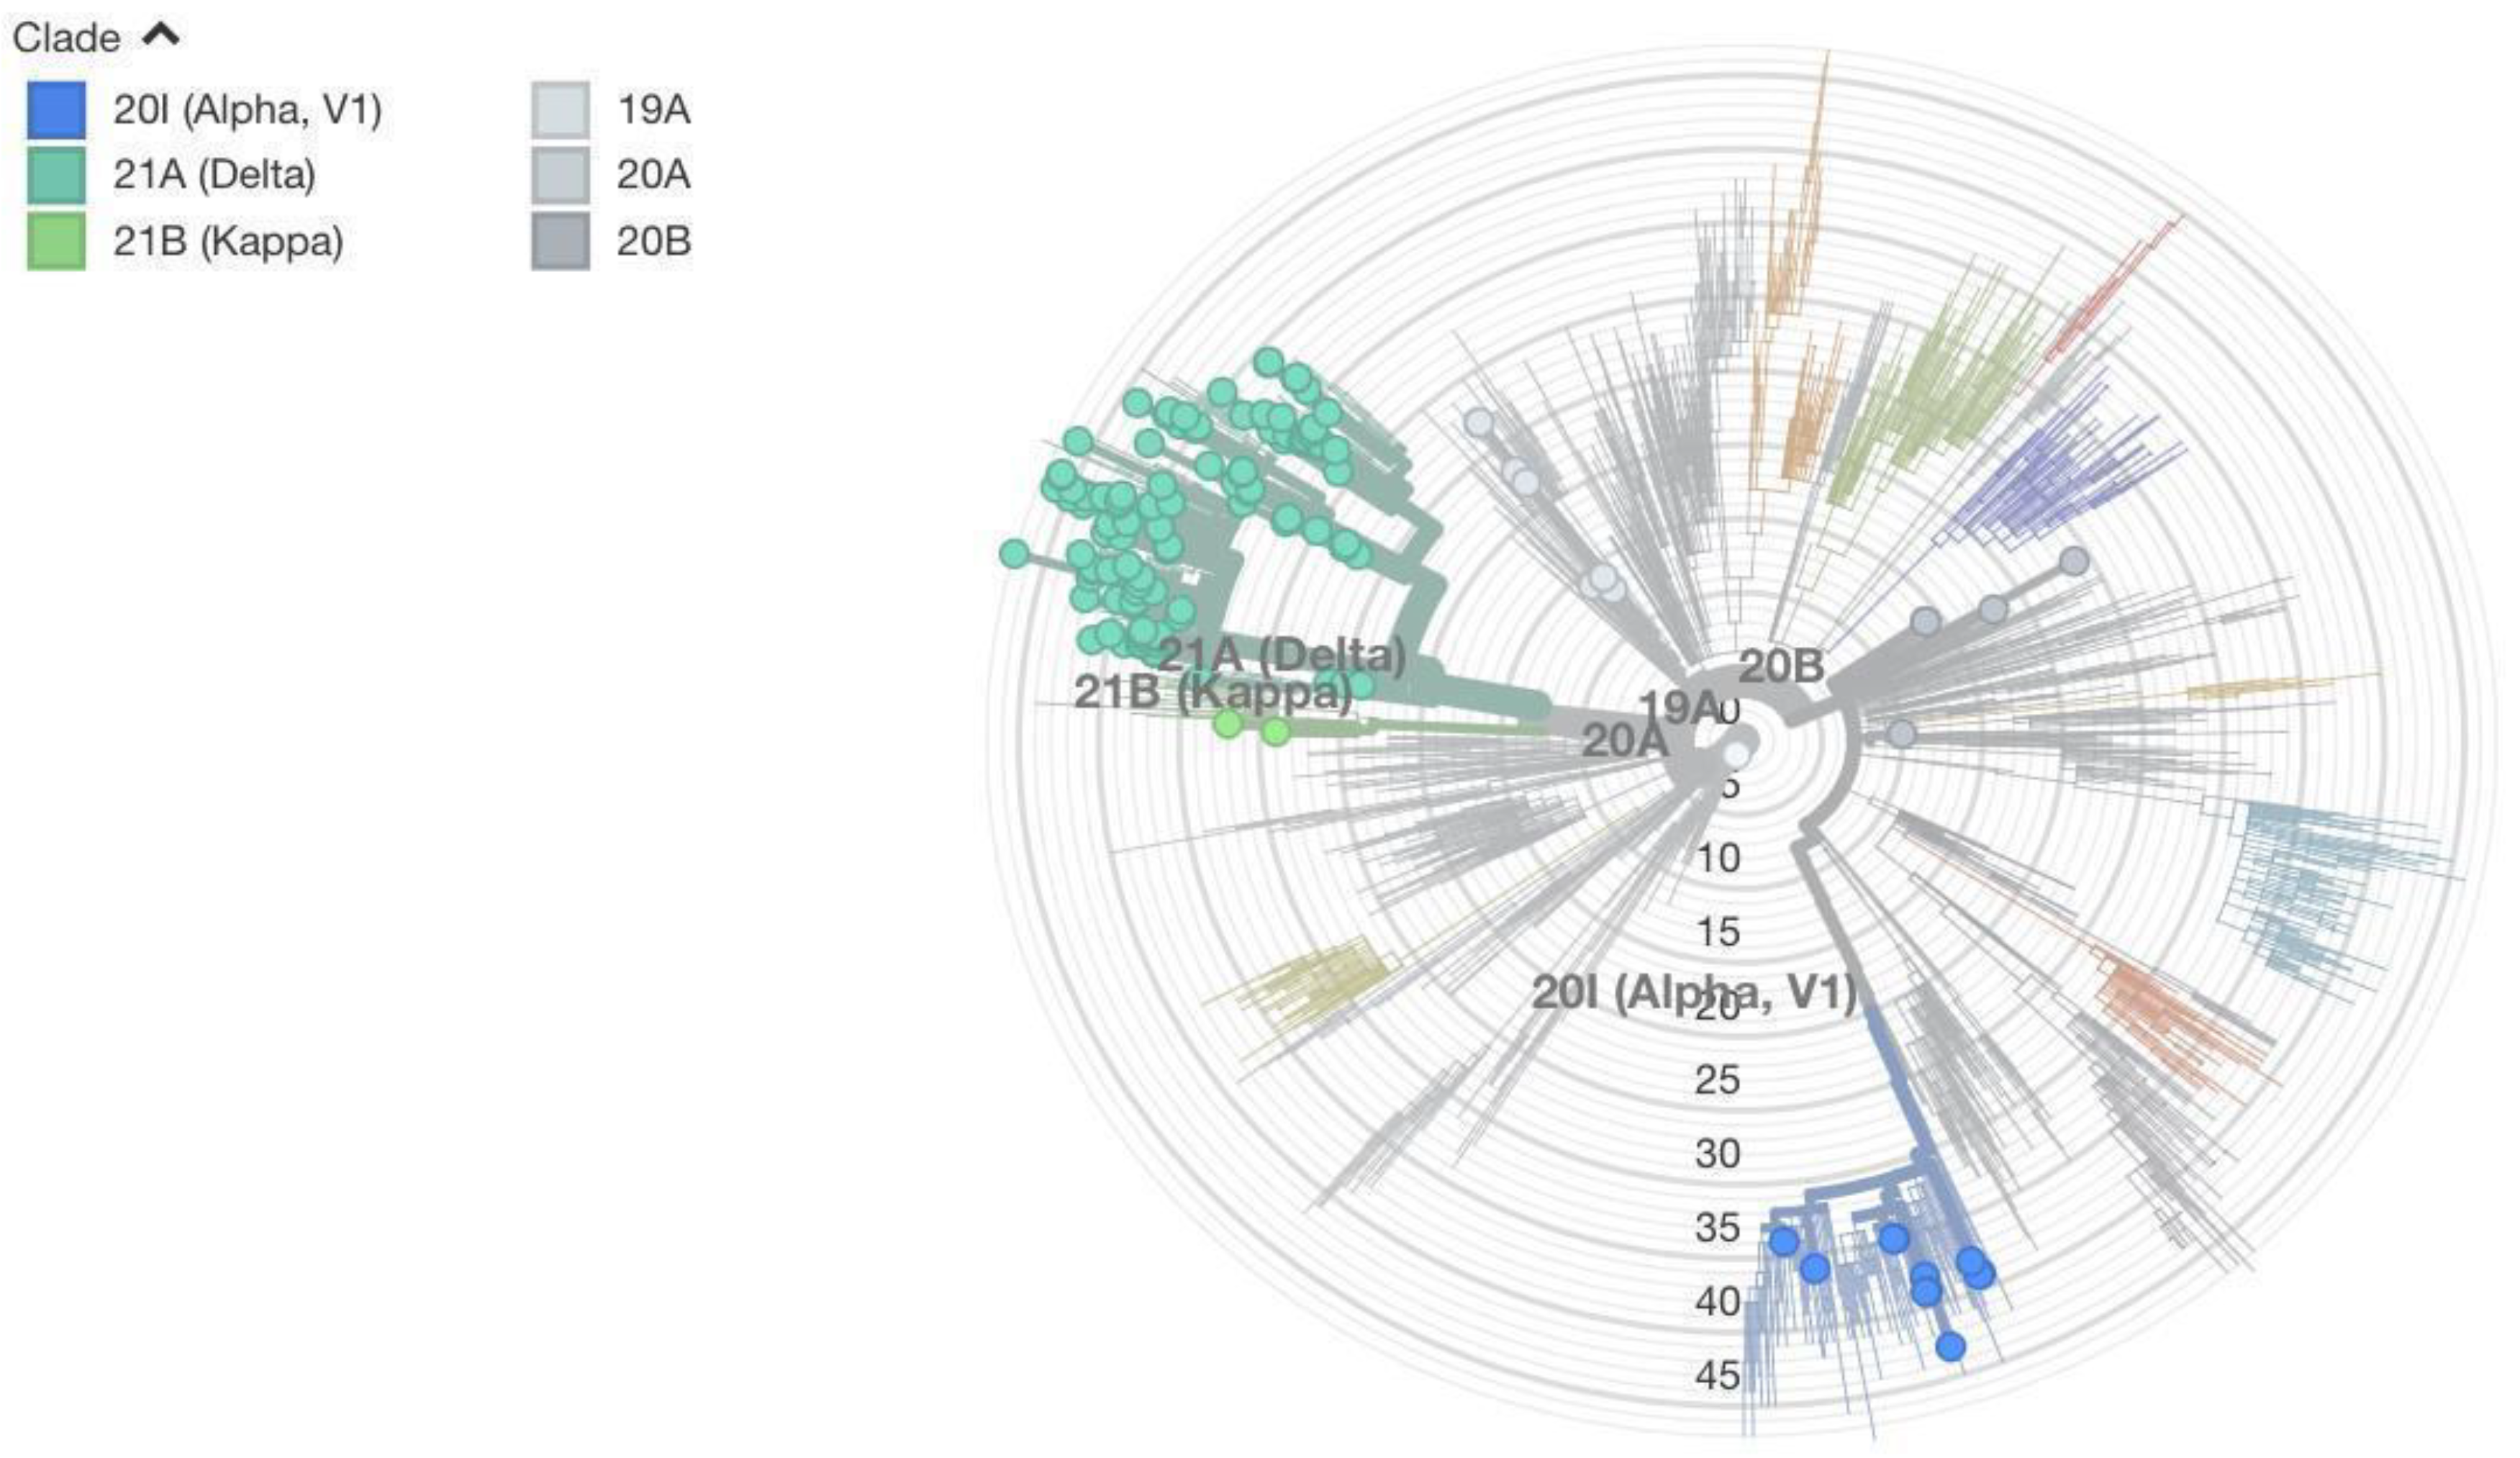
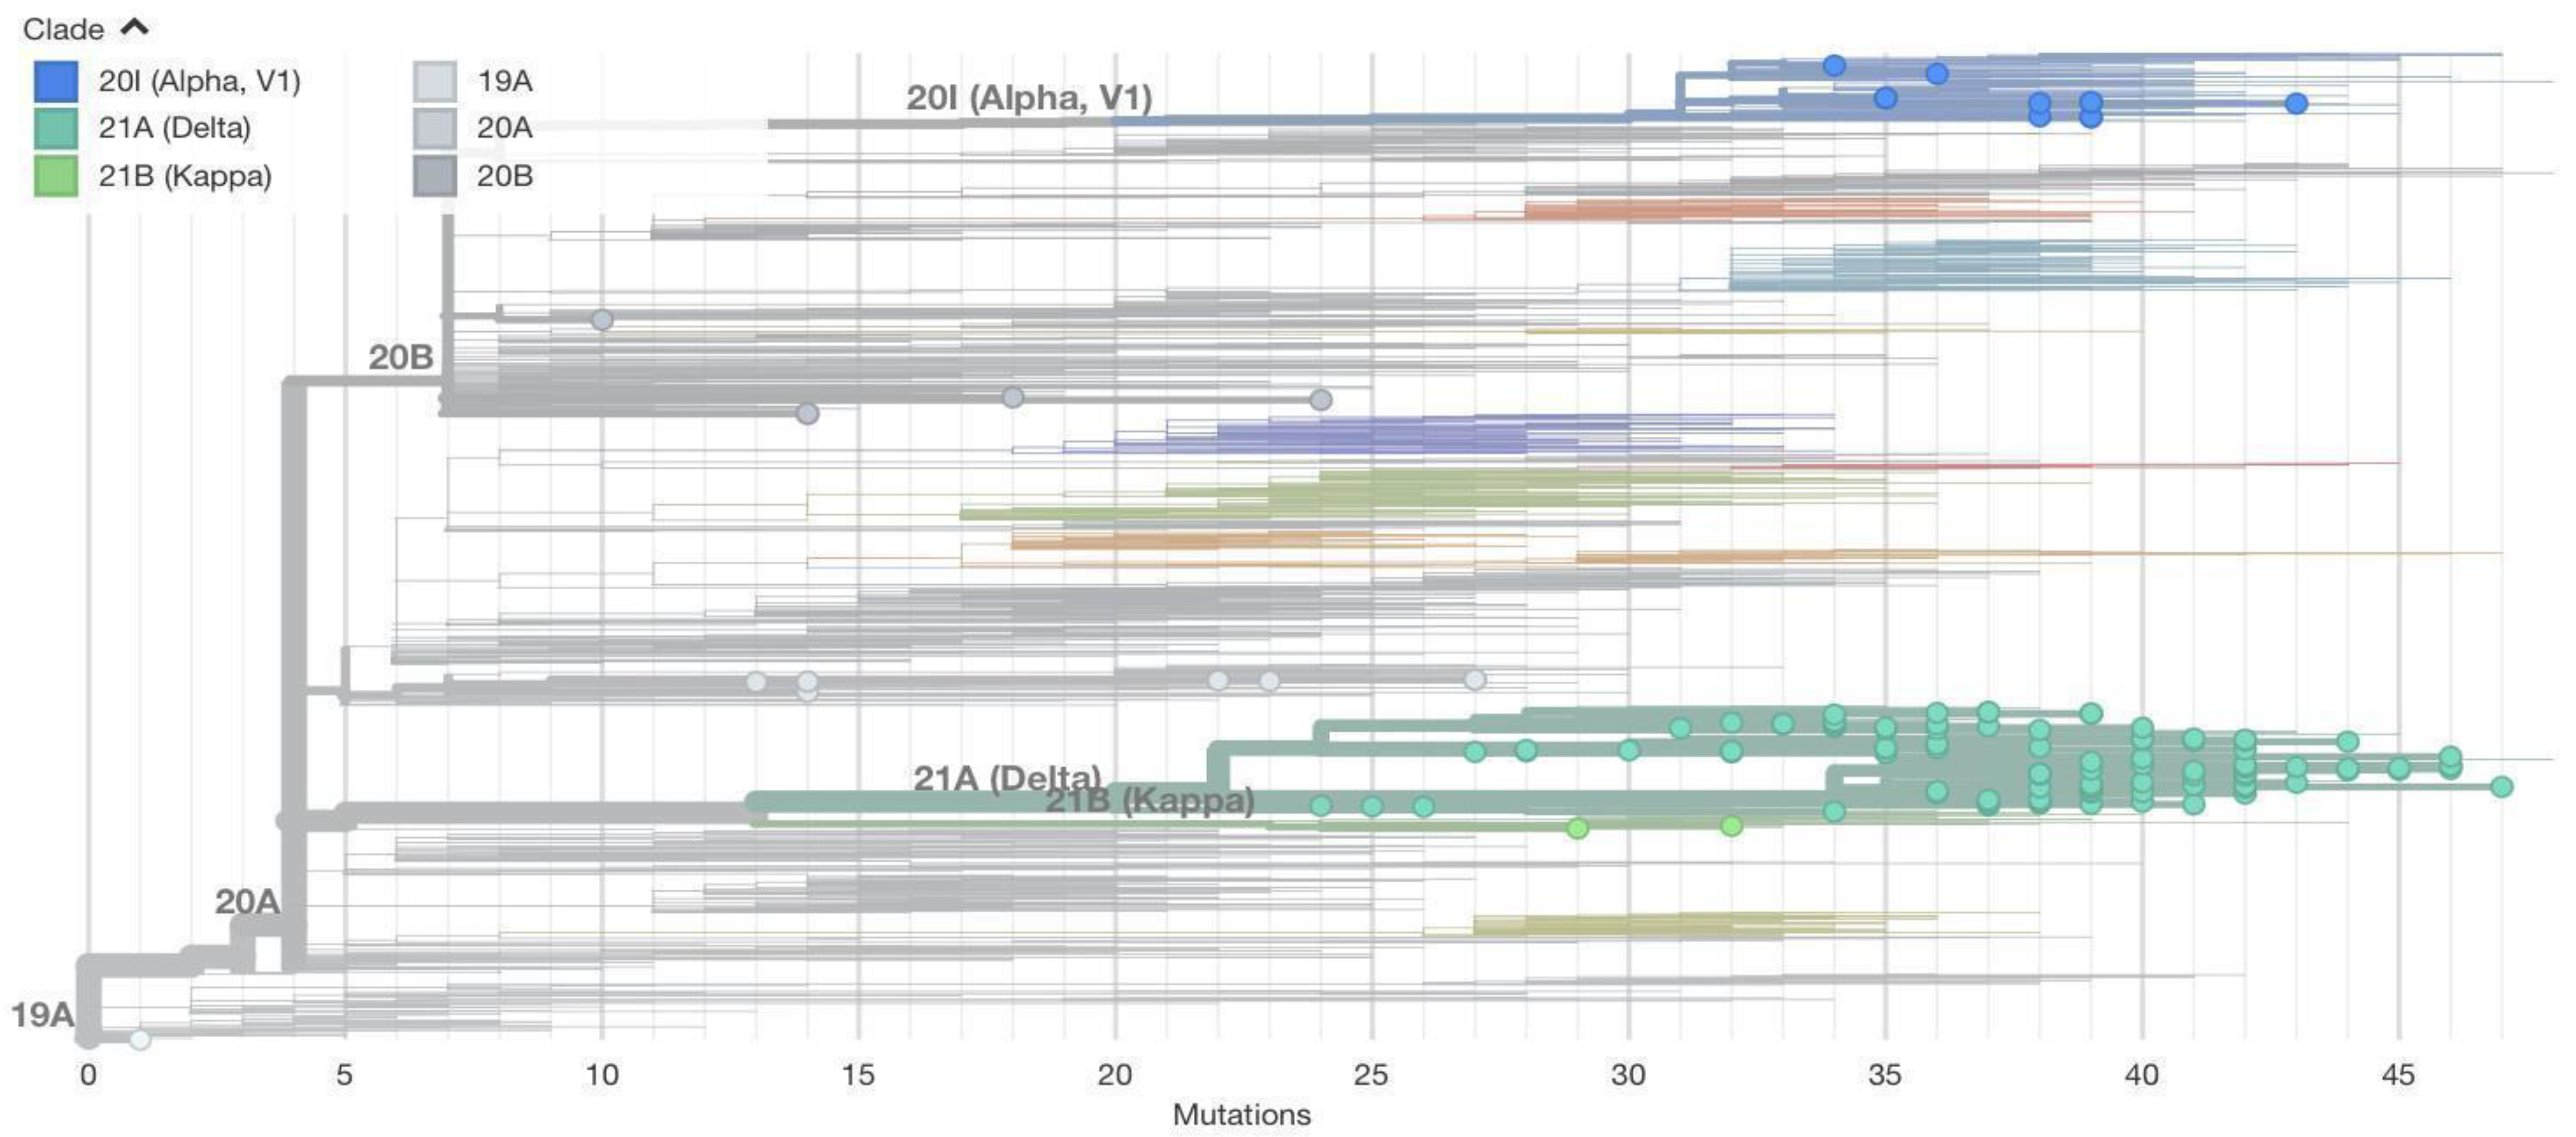
Besides looking at the amino acid substitution mutations in the S protein, we used the entire genome of the virus to construct the maximum likelihood phylogenetic tree. Sequences from Nepal were included along with global sequences to figure out where in the tree the sequences from Nepal lie. Two figures (Figure 4 and Figure 5) are dedicated to showing the phylogenetic tree radially and horizontally. In the radial tree (Figure 4), sequences from Nepal are marked in red. Various NextStrain clades are shown in colors ranging from various shades of blue to gray. The mutation numbers range from 0 to over 50. Most of Nepal’s sequences lie in the delta clade. Even within the delta clade there are several subclades. Nepal’s sequences do not lie in just one subclade of delta, which would indicate single transmission from abroad and several local transmissions. Instead, sequences lie in various subclades, indicating several cases of transmission from foreign countries followed by local transmission. Similar is the case with alpha and other variants. This shows the global nature of COVID-19, where strains develop in one part of the country very quickly and robustly spread throughout the world. Figure 5 shows our sequences in different colors. It can be seen that mutation numbers range from 0 to over 45. The first sequence from a student from Wuhan shows very few mutations (one mutation) and falls within the 19A clade. Other variants detected from Nepal are alpha, delta, kappa, 20A, and 20B, as initially described.
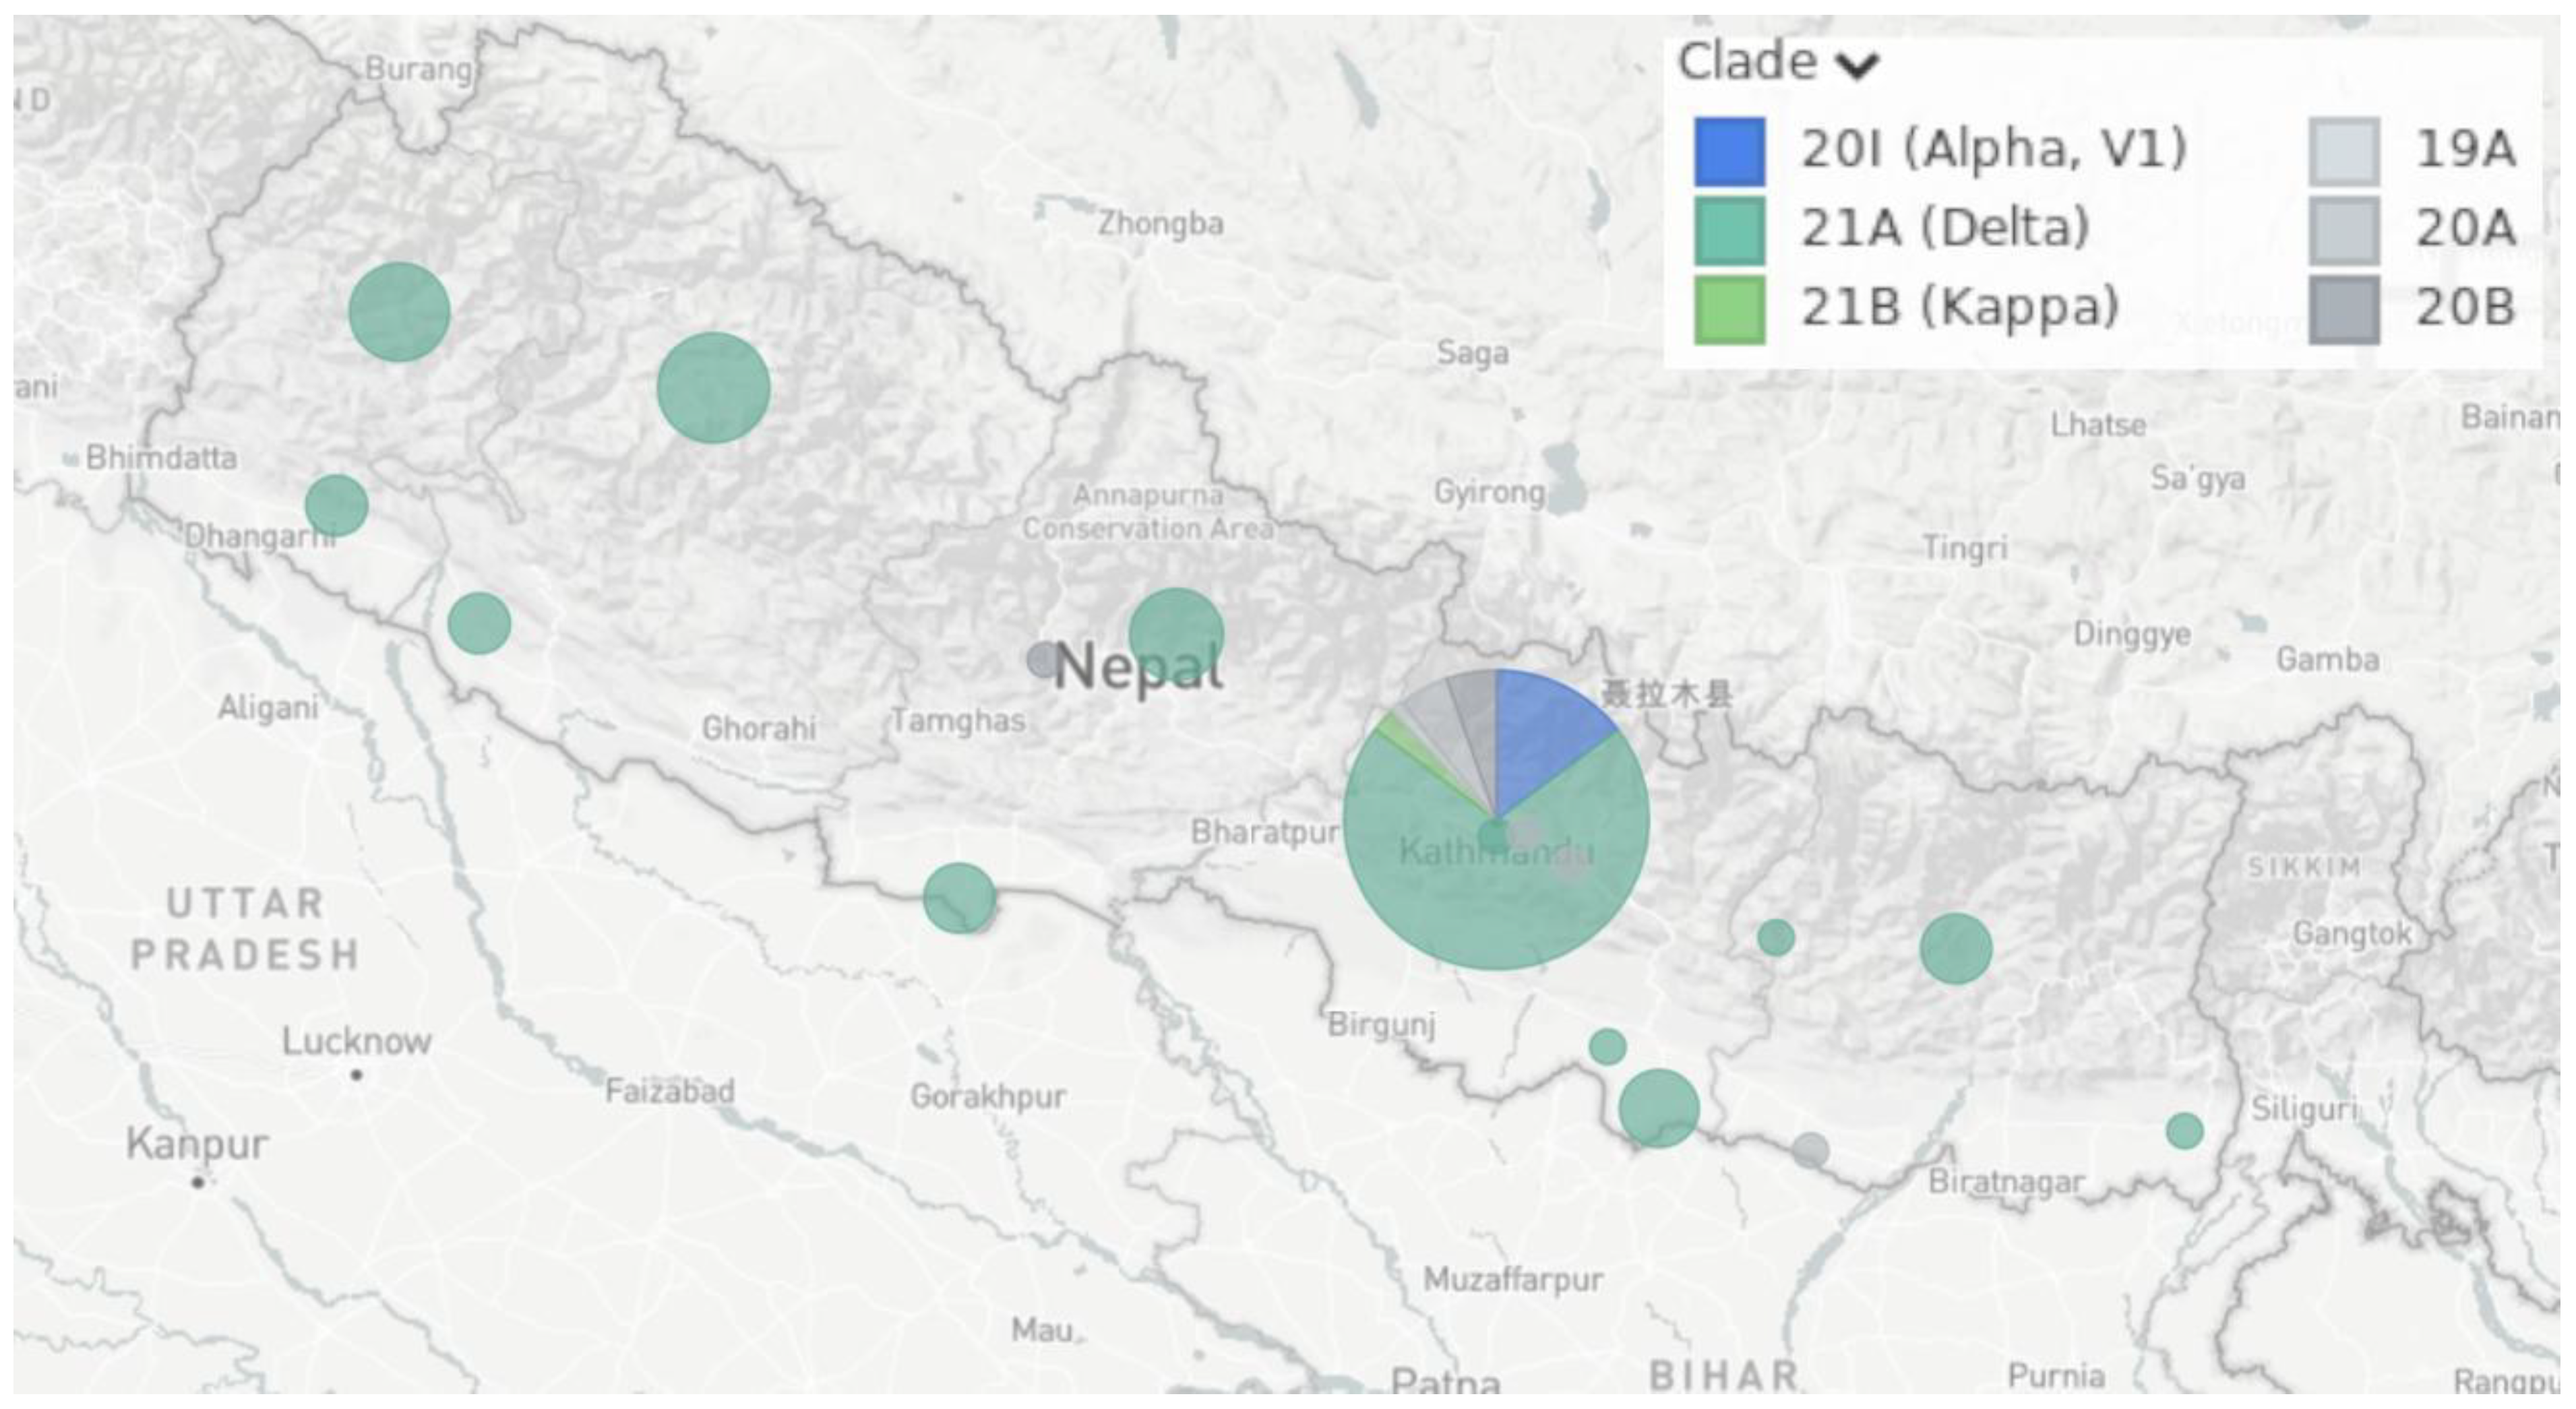
Next, sample subtrees showing local and global transmission events were constructed (Supplementary Material File S1). A congregation of strains from one location in the phylogenetic tree demonstrates a local transmission event, whereas the appearance of our strains in different clades represents a global transmission event. In these three sample trees, both local and global transmission events can be detected. Samples were collected from different parts of Nepal. The sizes of the sample groups collected from different regions of Nepal are shown as blobs in Figure 6. The region of Nepal where most of the samples were collected was the Central Development region, where Kathmandu, the capital city, is located.
To compare the impact of COVID-19 in Nepal versus that in the rest of the world, deaths per million population in Nepal and in countries with the highest and lowest death rates due to COVID-19 in different continents were plotted (Figure 7). It was found that in all continents, there were countries that fared better and worse than Nepal. This shows that how countries handled the pandemic had a large bearing on the death rate. In general, death rates in Europe, North America, and South America were higher than that in Nepal.
4. Discussion
The SARS-CoV-2 pandemic of 2020 and 2021 left Nepal guessing during its ups and downs. It came out of nowhere in 2020 and upended the normal way of life. During the first wave, deaths in Europe and America were at their peak and Nepal was left scrambling for options and measures to implement. Although rates of deaths and new cases were substantially lower than those in Western countries, Nepal imposed a very strict lockdown during the first wave. After the first wave, it felt as though Nepal had taken extra precautions that were not necessary. Lockdowns were lifted and life returned to normal. Only a few months into normality, cases and deaths began rising in India and, subsequently, in Nepal. The alpha variant was raging, and the delta variant had just been identified. It was not certain what to make of the rising numbers of cases and deaths. Since India was showing a wave bigger than the first wave, Nepal immediately took precautionary measures and declared a second round of lockdown as strict as the first one.
To give us a clear understanding of what was going on, very regular sequencing would have been very helpful. Nepal could have, over time, tracked which variant was appearing in different parts of the country. Through sequencing initiatives, the transmissibility of a variant can be better understood, since a more transmissible variant displaces other variants. Very few samples were collected during the early phase of the second wave, and there is confusion as to which strain was dominant in which month. To better understand the SARS-CoV-2 pandemic, larger, representative samples must be collected for sequencing. It would have been best to collect a large, fixed number of samples at regular time intervals of two weeks or one month. Several other countries have done so, and have gotten a good picture of strain prevalence. An example of one such country is Bangladesh [17]. From Dhaka’s data, it can be seen that the alpha variant was first identified on 6 January 2021. It outcompeted the Wuhan-like strain and preexisting variants. The beta variant was then introduced on 16 March 2021. The beta variant outcompeted the alpha variant and established itself as the major lineage. The delta variant then appeared at the beginning of May and became the dominant variant in May and June. This kind of granular time-lapsed data can help plan public policy.
Although such detailed sequencing data are not available in Nepal, we can surmise that the 19A variant that first appeared in early 2020 was replaced by the 20A and 20B variants. In the early part of 2021, alpha, kappa, and delta strains appeared. Although all three strains appeared, the delta strain outcompeted the other strains and established itself as the predominant strain by July 2021. From a policy point of view, it would be important to target the delta variant.
An evaluation of the death rate per infected person was calculated for different variants. Several studies have shown that the delta variant is more deadly than other variants of SARS-CoV-2 [18]. The data from Nepal show a similar result with a higher death rate for the delta variant.
In 2021, Nepal started vaccinating its population over the age of 16 years with vaccines approved by the WHO. Nepal has received donations and purchased vaccines made by Astrazeneca, Sinopharm, and Johnson and Johnson. Other vaccines have also been developed by Moderna and Pfizer. The technologies, efficacy, and safety of these vaccines have been discussed in previous studies in the literature. The Astrazeneca vaccine, which requires two doses to be administered intramuscularly for complete protection, has 62–90% efficacy, while the efficacy rates of the Moderna and Pfizer vaccines are 95 and 94%, respectively [19]. These vaccines were first tested against coronaviruses in 2020. Their efficacy is lower for the delta strain, which is a cause for concern. However, all these vaccines protect against the development of severe disease, hospitalization, and death [20,21]. New efficacy data regarding the vaccines are coming in every day. The government of Nepal should clearly watch for efficacy data against the delta variant before further rolling out vaccination programs.
From the phylogenetic data, the country from which the virus variants originated can be vaguely discerned. From supplementary Figure S1 we can make out that most of the transmissions took place from India or other Asian countries. This is indeed a logical conclusion since most of the travel in Nepal is to and from India. These data have to be taken with a pinch of salt because most of our transmissions might be taking place from India, but since India does not sequence very many samples, we might be missing out transmission hotspots. We can also observe from supplementary Figure S1 that there is local transmission as well, where different strains from Nepal congregate. These data are also very useful in planning lockdowns. It gives hints as to for which countries travel restrictions are needed during the lockdown.
From a global analysis of deaths per million population, throughout the world, most countries in Europe, South America, and North America performed worse than Nepal. The reason for this might be demographic. Nepal has a very young population, which might have been less affected by COVID-19. Alternatively, there might be other underlying, causes such as higher parasitic infection rates, which might have given greater protection to the Nepalese population compared to populations of the West [20].
The next big question regards whether there will be a third wave or a new variant capable of outcompeting the delta variant. Computational modeling work can be carried out to detect a possible variant that is more transmissible than the current delta variant. While such modeling may be able to predict the next variant, sequencing work will have to be continued to detect the emergence of such variants. Genomic surveillance can predict the emergence of the next variant and will be useful to the roll-out of COVID-19-related policies.
Supplementary Materials
The following supplementary materialas are available at https://0-www-mdpi-com.brum.beds.ac.uk/article/10.3390/covid1020036/s1.
Author Contributions
Conceptualization, H.K.B.; methodology, S.P.; software, S.P.; validation, H.K.B., A.D. and S.P.; formal analysis, H.K.B., S.P.; investigation, S.P.; data curation, S.P.; writing—original draft preparation, H.K.B., S.P.; writing—review and editing, H.K.B., S.P. and A.D.; supervision, H.K.B. All authors have read and agreed to the published version of the manuscript.
Funding
This research received no external funding.
Institutional Review Board Statement
Not applicable.
Informed Consent Statement
Not applicable.
Data Availability Statement
Not applicable.
Conflicts of Interest
The authors declare no conflict of interest.
References
- Zhou, P.; Yang, X.-L.; Wang, X.-G.; Hu, B.; Zhang, L.; Zhang, W.; Si, H.-R.; Zhu, Y.; Li, B.; Huang, C.-L.; et al. A pneumonia outbreak associated with a new coronavirus of probable bat origin. Nature 2020, 579, 270–273. [Google Scholar] [CrossRef] [PubMed] [Green Version]
- Sah, R.; Rodriguez-Morales, A.; Jha, R.; Chu, D.; Gu, H.; Peiris, J.S.; Bastola, A.; Lal, B.; Ojha, H.; Rabaan, A.; et al. Complete Genome Sequence of a 2019 Novel Coronavirus (SARS-CoV-2) Strain Isolated in Nepal. ASM Sci. J. 2020, 9, e00169-20. [Google Scholar] [CrossRef] [PubMed] [Green Version]
- CoVid19-Dashboard. Available online: https://covid19.mohp.gov.np/ (accessed on 13 September 2021).
- Liu, B.; Liu, K.; Zhang, H.; Zhang, L.; Bian, Y.; Huang, L. CoV-Seq, a New Tool for SARS-CoV-2 Genome Analysis and Visualization: Development and Usability Study. J. Med. Internet Res. 2020, 22, e22299. [Google Scholar] [CrossRef] [PubMed]
- Gorkhali, R.; Koirala, P.; Rijal, S.; Mainali, A.; Baral, A.; Bhattarai, H.K. Structure and Function of Major SARS-CoV-2 and SARS-CoV Proteins. Bioinform. Biol. Insights 2021, 15, 11779322211025876. [Google Scholar] [CrossRef] [PubMed]
- Harvey, W.T.; Carabelli, A.M.; Jackson, B.; Gupta, R.K.; Thomson, E.C.; Harrison, E.M.; Ludden, C.; Reeve, R.; Rambaut, A.; Peacock, S.J.; et al. SARS-CoV-2 variants, spike mutations and immune escape. Nat. Rev. Microbiol. 2021, 19, 409–424. [Google Scholar] [CrossRef] [PubMed]
- Mohammadi, E.; Shafiee, F.; Shahzamani, K.; Ranjbar, M.M.; Alibakhshi, A.; Ahangarzadeh, S.; Beikmohammadi, L.; Shariati, L.; Hooshmandi, S.; Ataei, B.; et al. Novel and emerging mutations of SARS-CoV-2: Biomedical implications. Biomed. Pharmacother. 2021, 139, 111599. [Google Scholar] [CrossRef] [PubMed]
- Plante, J.A.; Liu, Y.; Liu, J.; Xia, H.; Johnson, B.A.; Lokugamage, K.G.; Zhang, X.; Muruato, A.E.; Zou, J.; Fontes-Garfias, C.R.; et al. Spike mutation D614G alters SARS-CoV-2 fitness. Nature 2021, 592, 116–121. [Google Scholar] [CrossRef] [PubMed]
- Chiara, M.; D’Erchia, A.M.; Gissi, C.; Manzari, C.; Parisi, A.; Resta, N.; Zambelli, F.; Picardi, E.; Pavesi, G.; Horner, D.S.; et al. Next generation sequencing of SARS-CoV-2 genomes: Challenges, applications and opportunities. Brief. Bioinform. 2021, 22, 616–630. [Google Scholar] [CrossRef] [PubMed]
- Hadfield, J.; Megill, C.; Bell, S.M.; Huddleston, J.; Potter, B.; Callender, C.; Sagulenko, P.; Bedford, T.; Neher, R.A. Nextstrain: Real-time tracking of pathogen evolution. Bioinformatics 2018, 34, 4121–4123. [Google Scholar] [CrossRef] [PubMed]
- Rambaut, A.; Holmes, E.C.; O’Toole, Á.; Hill, V.; McCrone, J.T.; Ruis, C.; du Plessis, L.; Pybus, O.G. A dynamic nomenclature proposal for SARS-CoV-2 lineages to assist genomic epidemiology. Nat. Microbiol. 2020, 5, 1403–1407. [Google Scholar] [CrossRef] [PubMed]
- Tracking SARS-CoV-2 Variants. Available online: https://www.who.int/emergencies/emergency-health-kits/trauma-emergency-surgery-kit-who-tesk-2019/tracking-SARS-CoV-2-variants (accessed on 13 September 2021).
- Campbell, F.; Archer, B.; Laurenson-Schafer, H.; Jinnai, Y.; Konings, F.; Batra, N.; Pavlin, B.; Vandemaele, K.; Van Kerkhove, M.D.; Jombart, T.; et al. Increased transmissibility and global spread of SARS-CoV-2 variants of concern as at June 2021. Euro Surveill. 2021, 26, 2100509. [Google Scholar] [CrossRef] [PubMed]
- Martins, A.F.; Zavascki, A.P.; Wink, P.L.; Volpato, F.C.Z.; Monteiro, F.L.; Rosset, C.; De-Paris, F.; Ramos, Á.K.; Barth, A.L. Detection of SARS-CoV-2 lineage P.1 in patients from a region with exponentially increasing hospitalisation rate, February 2021, Rio Grande do Sul, Southern Brazil. Eurosurveillance 2021, 26, 2100276. [Google Scholar] [CrossRef] [PubMed]
- Sagulenko, P.; Puller, V.; Neher, R.A. TreeTime: Maximum-likelihood phylodynamic analysis. Virus Evol. 2018, 4, vex042. [Google Scholar] [CrossRef] [PubMed]
- Cherian, S.; Potdar, V.; Jadhav, S.; Yadav, P.; Gupta, N.; Das, M.; Rakshit, P.; Singh, S.; Abraham, P.; Panda, S.; et al. SARS-CoV-2 Spike Mutations, L452R, T478K, E484Q and P681R, in the Second Wave of COVID-19 in Maharashtra, India. Microorganisms 2021, 9, 1542. [Google Scholar] [CrossRef] [PubMed]
- Rahman, M.; Shirin, T.; Rahman, S.; Rahman, M.M.; Hossain, M.E.; Khan, M.H.; Rahman, M.Z.; Arifeen, S.E.; Ahmed, T. The emergence of SARS-CoV-2 variants in Dhaka city, Bangladesh. Transbound. Emerg. Dis. 2021, 1, 2. [Google Scholar] [CrossRef]
- Fisman, D.N.; Tuite, A.R. Progressive Increase in Virulence of Novel SARS-CoV-2 Variants in Ontario, Canada, February to June, 2021. medRxiv 2021. [Google Scholar] [CrossRef]
- Michele, C.; Maria AR, D.G.; Giovanni, N.R. Anti-Coronavirus Vaccines: Past Investigations on SARS-CoV-1 and MERS-CoV, the Approved Vaccines from BioNTech/Pfizer, Moderna, Oxford/AstraZeneca and others under Development Against SARSCoV-2 Infection. Curr. Med. Chem. 2021, 28, 1–15. [Google Scholar]
- Lopez Bernal, J.; Andrews, N.; Gower, C.; Gallagher, E.; Simmons, R.; Thelwall, S.; Stowe, J.; Tessier, E.; Groves, N.; Dabrera, G.; et al. Effectiveness of Covid-19 Vaccines against the B.1.617.2 (Delta) Variant. N. Engl. J. Med. 2021, 385, 585–594. [Google Scholar] [CrossRef]
- Sanderson, K. COVID vaccines protect against Delta, but their effectiveness wanes. Nature 2021. [Google Scholar] [CrossRef] [PubMed]
Figure 1.
(a) Ratio of deaths to new cases per day calculated for every month. The introduction of the delta variant in January 2021 significantly increased the ratio of new deaths to new infections. (b) Numbers of new cases and deaths in different months. The average numbers of daily cases and deaths were used to plot the monthly cases and deaths. The left axis and green curve denote the number of new cases, while the right axis and red curve show the number of deaths. The time when the delta variant was first sequenced is shown by the broken purple line. There was an upsurge in the number of cases and deaths only 3 months after the delta variant was first seen. It can be speculated that local transmission of the delta variant only occurred months after its first introduction in the country.

Figure 2.
The distribution of different variants of SARS-CoV-2 in Nepal. (a) The time range over which different variants were detected. Only the samples with a complete collection date were included. There was only one sample with a complete date for the 19A and kappa variants. Therefore, the time range was limited to the first detected time and the end of that month. The delta variant outgrew the other variants. (b) Pie chart showing the percentage abundance of different variants in the sequenced samples. The majority of the sequences belonged to the delta variant, partly because the sample collection and sequencing was sped up after the delta variant was found inside the country and partly due to the more infectious nature of the delta variant. (c) The graph shows the numbers of sequenced samples in different months. The first column, labeled 2021*, represents the samples for which the month of sample collection was not provided.

Figure 3.
The numbers of major S-protein substitution mutations found in the sequenced samples from Nepal. The metadata obtained from the Nextclade were used to count the numbers of similar mutations in the samples, and only the S-protein substitution was filtered. The S-protein substitutions found in three or more samples are plotted here and grouped according to the variants. For example, the blue bar represents the S-protein mutation found only in 20A, the purple bar represents the S-protein mutation found in both delta and kappa, and so on.

Figure 4.
Radial phylogeny tree. The tree was visualized using Nextstrain Auspice from the metadata produced by Nextclade. The distributions of different variants are marked by color and the small circles show the placement of uploaded samples. The figure shows that variants experienced by Nepal include alpha and delta variants, among others.

Figure 5.
Rectangular phylogeny tree. The tree was visualized using Nextstrain Auspice from the metadata produced by Nextclade. Only uploaded 127 sequences are shown in the tree in order to visualize the clear phylogenetic placement of viral samples from Nepal. The distributions of different variants are marked by color and the small circles show the placement of uploaded samples.

Figure 6.
Map of Nepal showing the distribution of various variants. The latitude and longitude data of the sampling locations were added to the sequences and uploaded in Nextstrain Auspice in order to obtain the map. The size of each circle is proportional to the number of samples. In the case of multiple variants, a pie chart is used to show the proportions of different variants.

Figure 7.
Deaths per million population of different countries due to COVID-19. Deaths per million population is plotted for Nepal and countries throughout the world with very good and very bad performance records against SARS-CoV-2. Various countries throughout the world performed better or worse than Nepal during the pandemic.

Publisher’s Note: MDPI stays neutral with regard to jurisdictional claims in published maps and institutional affiliations. |
© 2021 by the authors. Licensee MDPI, Basel, Switzerland. This article is an open access article distributed under the terms and conditions of the Creative Commons Attribution (CC BY) license (https://creativecommons.org/licenses/by/4.0/).
Share and Cite
MDPI and ACS Style
Paudel, S.; Dahal, A.; Bhattarai, H.K. Temporal Analysis of SARS-CoV-2 Variants during the COVID-19 Pandemic in Nepal. COVID 2021, 1, 423-434. https://0-doi-org.brum.beds.ac.uk/10.3390/covid1020036
AMA Style
Paudel S, Dahal A, Bhattarai HK. Temporal Analysis of SARS-CoV-2 Variants during the COVID-19 Pandemic in Nepal. COVID. 2021; 1(2):423-434. https://0-doi-org.brum.beds.ac.uk/10.3390/covid1020036
Chicago/Turabian StylePaudel, Samrat, Amol Dahal, and Hitesh Kumar Bhattarai. 2021. "Temporal Analysis of SARS-CoV-2 Variants during the COVID-19 Pandemic in Nepal" COVID 1, no. 2: 423-434. https://0-doi-org.brum.beds.ac.uk/10.3390/covid1020036