Article

Antibacterial Activity of the Pyrogallol against Staphylococcus aureus Evaluated by Optical Image

by
Lígia C. C. Oliveira
1,
Francisco A. A. Rodrigues
2,
Cristina Rodrigues dos Santos Barbosa
3,
Joycy Francely Sampaio dos Santos
3,
Nair Silva Macêdo
4,
Zildene de Sousa Silveira
4,
Henrique Douglas Melo Coutinho
1,* and
Francisco Assis Bezerra da Cunha
3
1
Laboratory of Spectroanalytical, Biological and Environmental Chemistry—LEQBA, Department of Biological Chemistry, Regional University of Cariri, Crato 63105-000, Brazil
2
Science and Technology Center, Universidade Federal do Cariri—UFCA, Juazeiro do Norte 63048-080, Brazil
3
Laboratory of Bioprospection of Semiarid and Alternative Methods—LABSEMA, Department of Biological Chemistry, Regional University of Cariri, Crato 63105-000, Brazil
4
Graduate Program in Biological Sciences, Federal University of Pernambuco, Recife 50670-901, Brazil
*
Author to whom correspondence should be addressed.
Submission received: 22 March 2022 / Revised: 20 April 2022 / Accepted: 16 May 2022 / Published: 20 May 2022
(This article belongs to the Special Issue Biological Drugs in the World)

Abstract

:
The minimum inhibitory concentration (MIC) is used to define the lowest concentration at which a substance can inhibit bacterial growth. This study aimed to evaluate the MIC of pyrogallol against Staphylococcus aureus and to propose a method for building growth inhibition curves of bacterial strains from MIC assays. S. aureus strains 1199B (NorA) and 1199 (wild type) were used for the assays. Pyrogallol MIC tests were performed by the broth microdilution method. The proposed method uses RGB images of the microdilution plate using the R (Red), G (Green), and B (Blue) channels to extract information for the construction of the bacterial growth inhibition curve (GIC). Pyrogallol demonstrated a MIC of 512 µg/mL against the two S. aureus strains tested. The GIC was calculated and the MIC point of pyrogallol was identified against the tested strains. The proposed method suggested the same MIC point for pyrogallol when using microplate images before and after the addition of resazurin. Through this methodology, the subjectivity of visual analysis in MIC tests can be eliminated.

1. Introduction

Minimum inhibitory concentration (MIC) assays are widely used to assess the lowest concentration of a substance capable of inhibiting the growth of bacterial strains [1,2,3,4]. Normally, antibacterial activity tests by MIC are determined by microdilution assays, in which serial dilutions of a substance are performed in varying concentrations [5,6]. This procedure allows the evaluation of the strain’s growth inhibition as a function of the different concentrations of the tested substance, that is, it evaluates the growth inhibition curve (GIC) of a strain. The evaluation of this curve allows, for example, the comparison of the growth inhibition of different strains by a given substance.
However, despite the importance of MIC assays, those that are evaluated by visual readings are not able to describe bacterial growth inhibition curves, given the human visual system is very subjective. In addition, traditional MIC analysis methods do not allow a quantitative assessment, consisting of a range of concentrations depending on the dilutions series used in the experiment [7].
However, MIC assays are widely used to assess the antibacterial potential of bioactive compounds against pathogenic microorganisms, such as the bacterium Staphylococcus aureus, which is associated with various infections in humans, such as endocarditis, joint infections, epidermal and soft tissue infections, pleuropulmonary infections and infections related to prosthetic devices [8].
In addition, infections caused by S. aureus are among the main causes of mortality in the hospital and outpatient settings [9] and their pathogenic potential has been further exacerbated by the development and frequent acquisition of mechanisms, which provide resistance to most commercially available antibiotics [10,11].
Given the above, there is a growing search for plant-derived natural compounds that have antibacterial activity [12], with the aim of using these compounds to reduce the rapid spread of resistant bacteria such as S. aureus, given the great diversity of plant-derived secondary compounds, known for being able to inhibit bacterial growth [13].
Among these substances are polyphenols, secondary metabolites present in leaves, fruits, seeds, and flowers from plant species. Pyrogallol is a polyphenol found in a variety of fruits and vegetables, including avocados and apricots [14]. Some studies in the literature report an antibacterial activity of pyrogallol against Gram-negative and Gram-positive bacteria [15,16,17,18].
In this sense, the objective of the present study was to evaluate the minimum inhibitory concentration (MIC) of pyrogallol on Staphylococcus aureus, as well as to propose a method for building growth inhibition curves of bacterial strains from MIC assays. In addition, through the RGB image of the microdilution plate, the R (Red), G (Green), and B (Blue) channels were investigated to propose a convex linear combination of the channels that allows for the extraction of the information necessary to generate the GIC.

2. Results

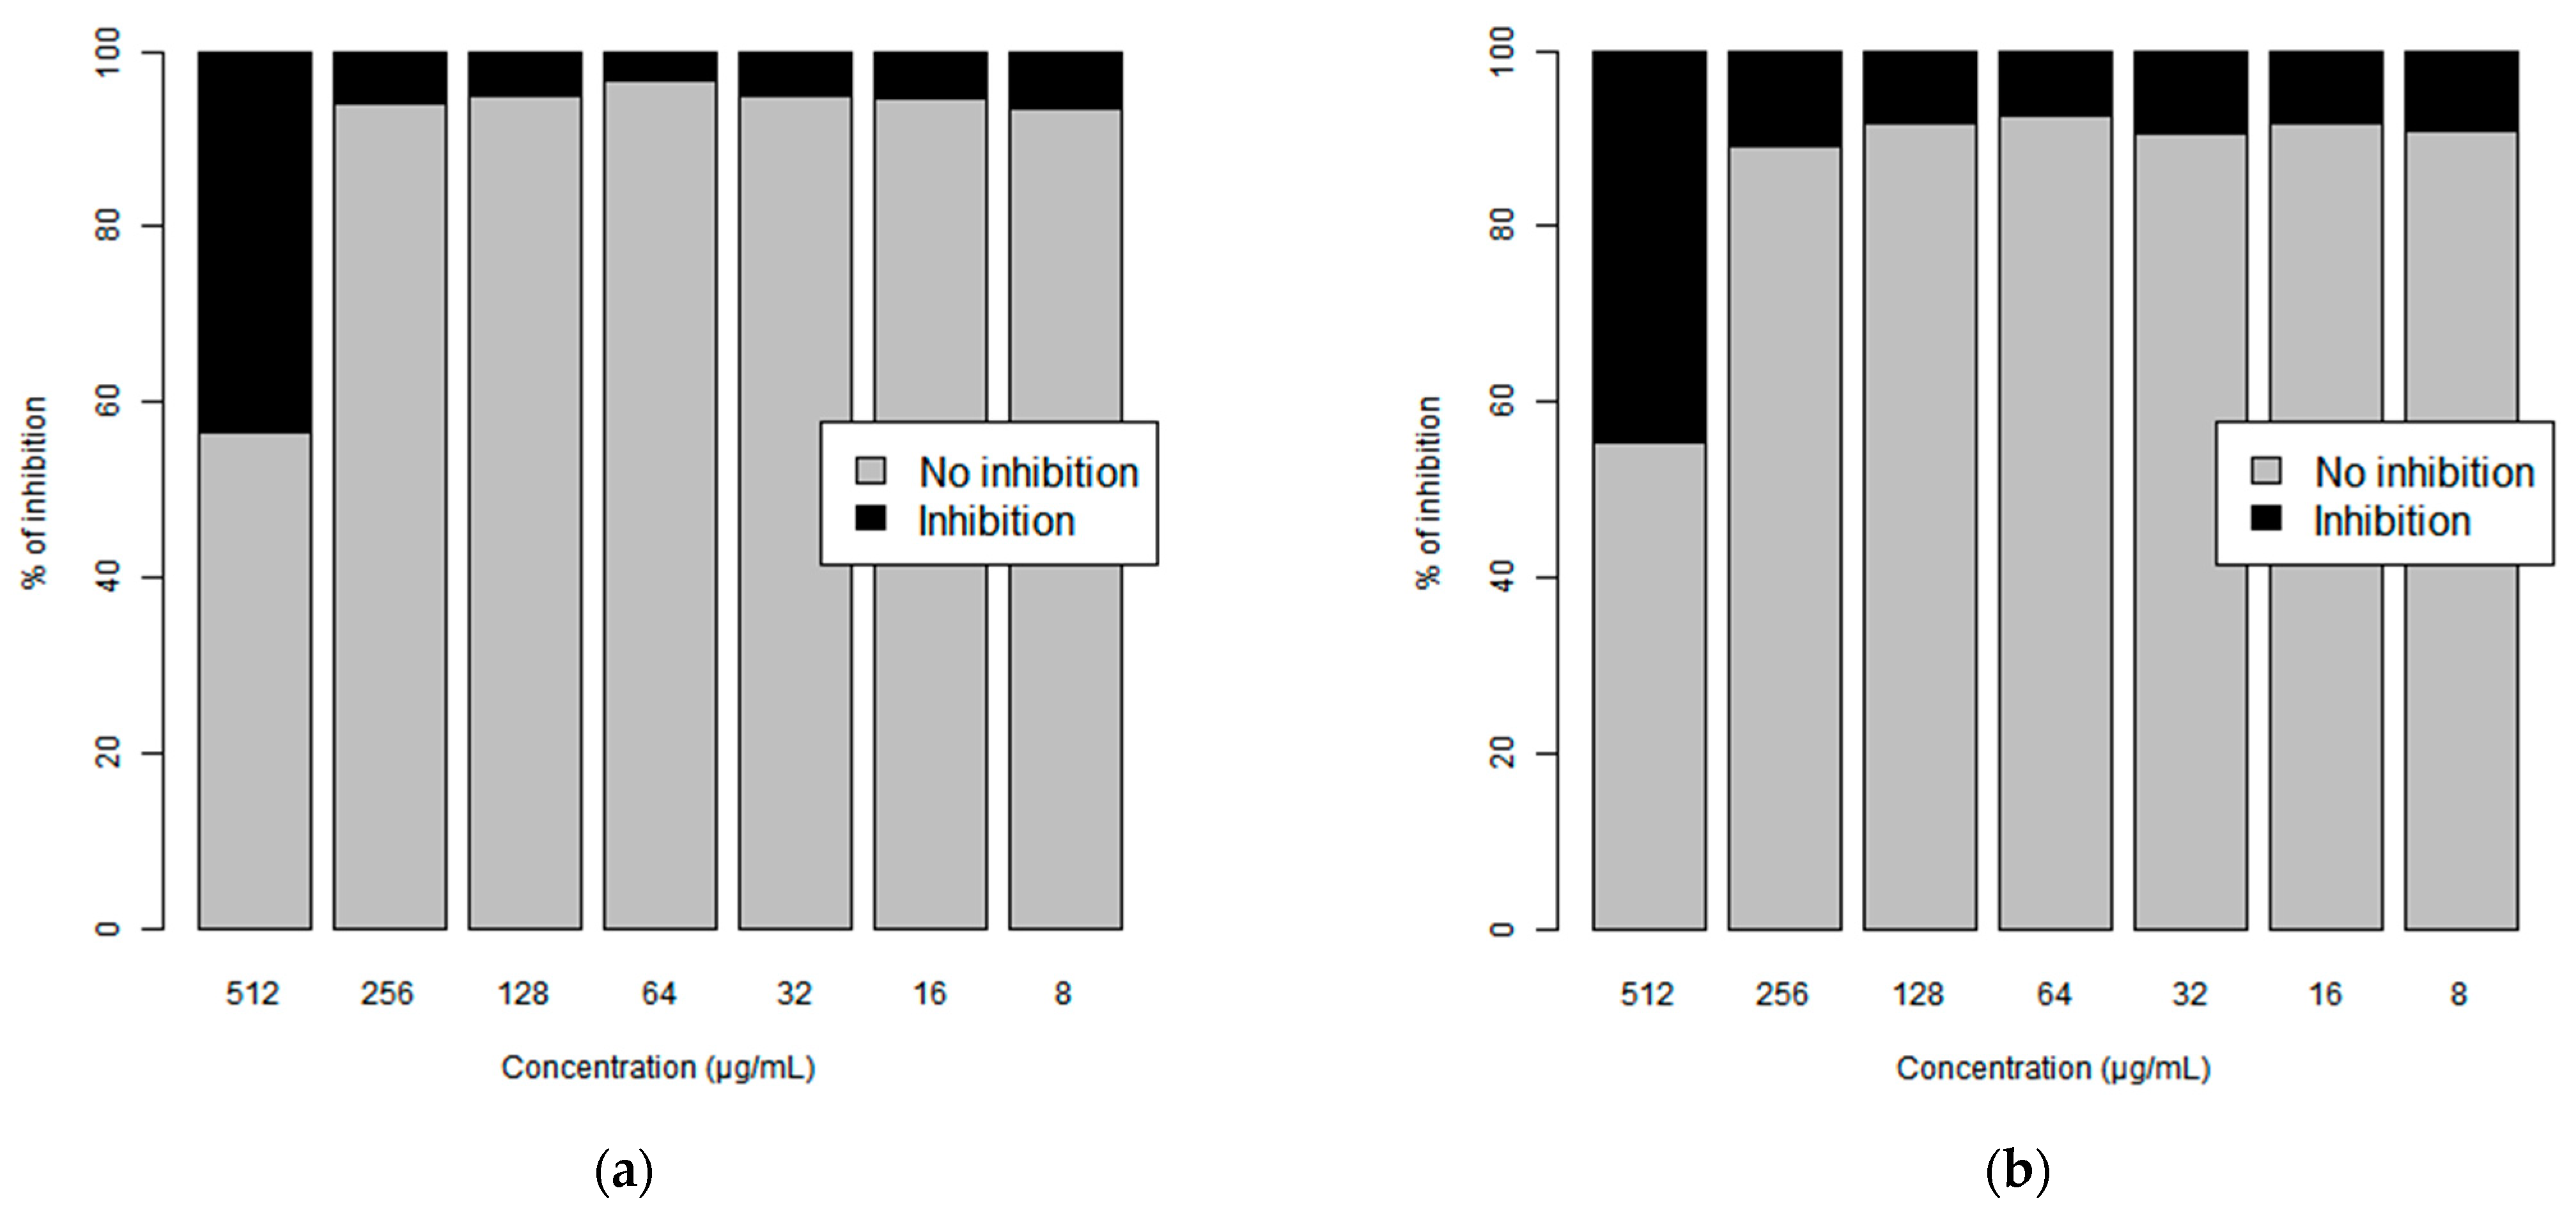
2.1. Minimum Inhibitory Concentration (MIC)
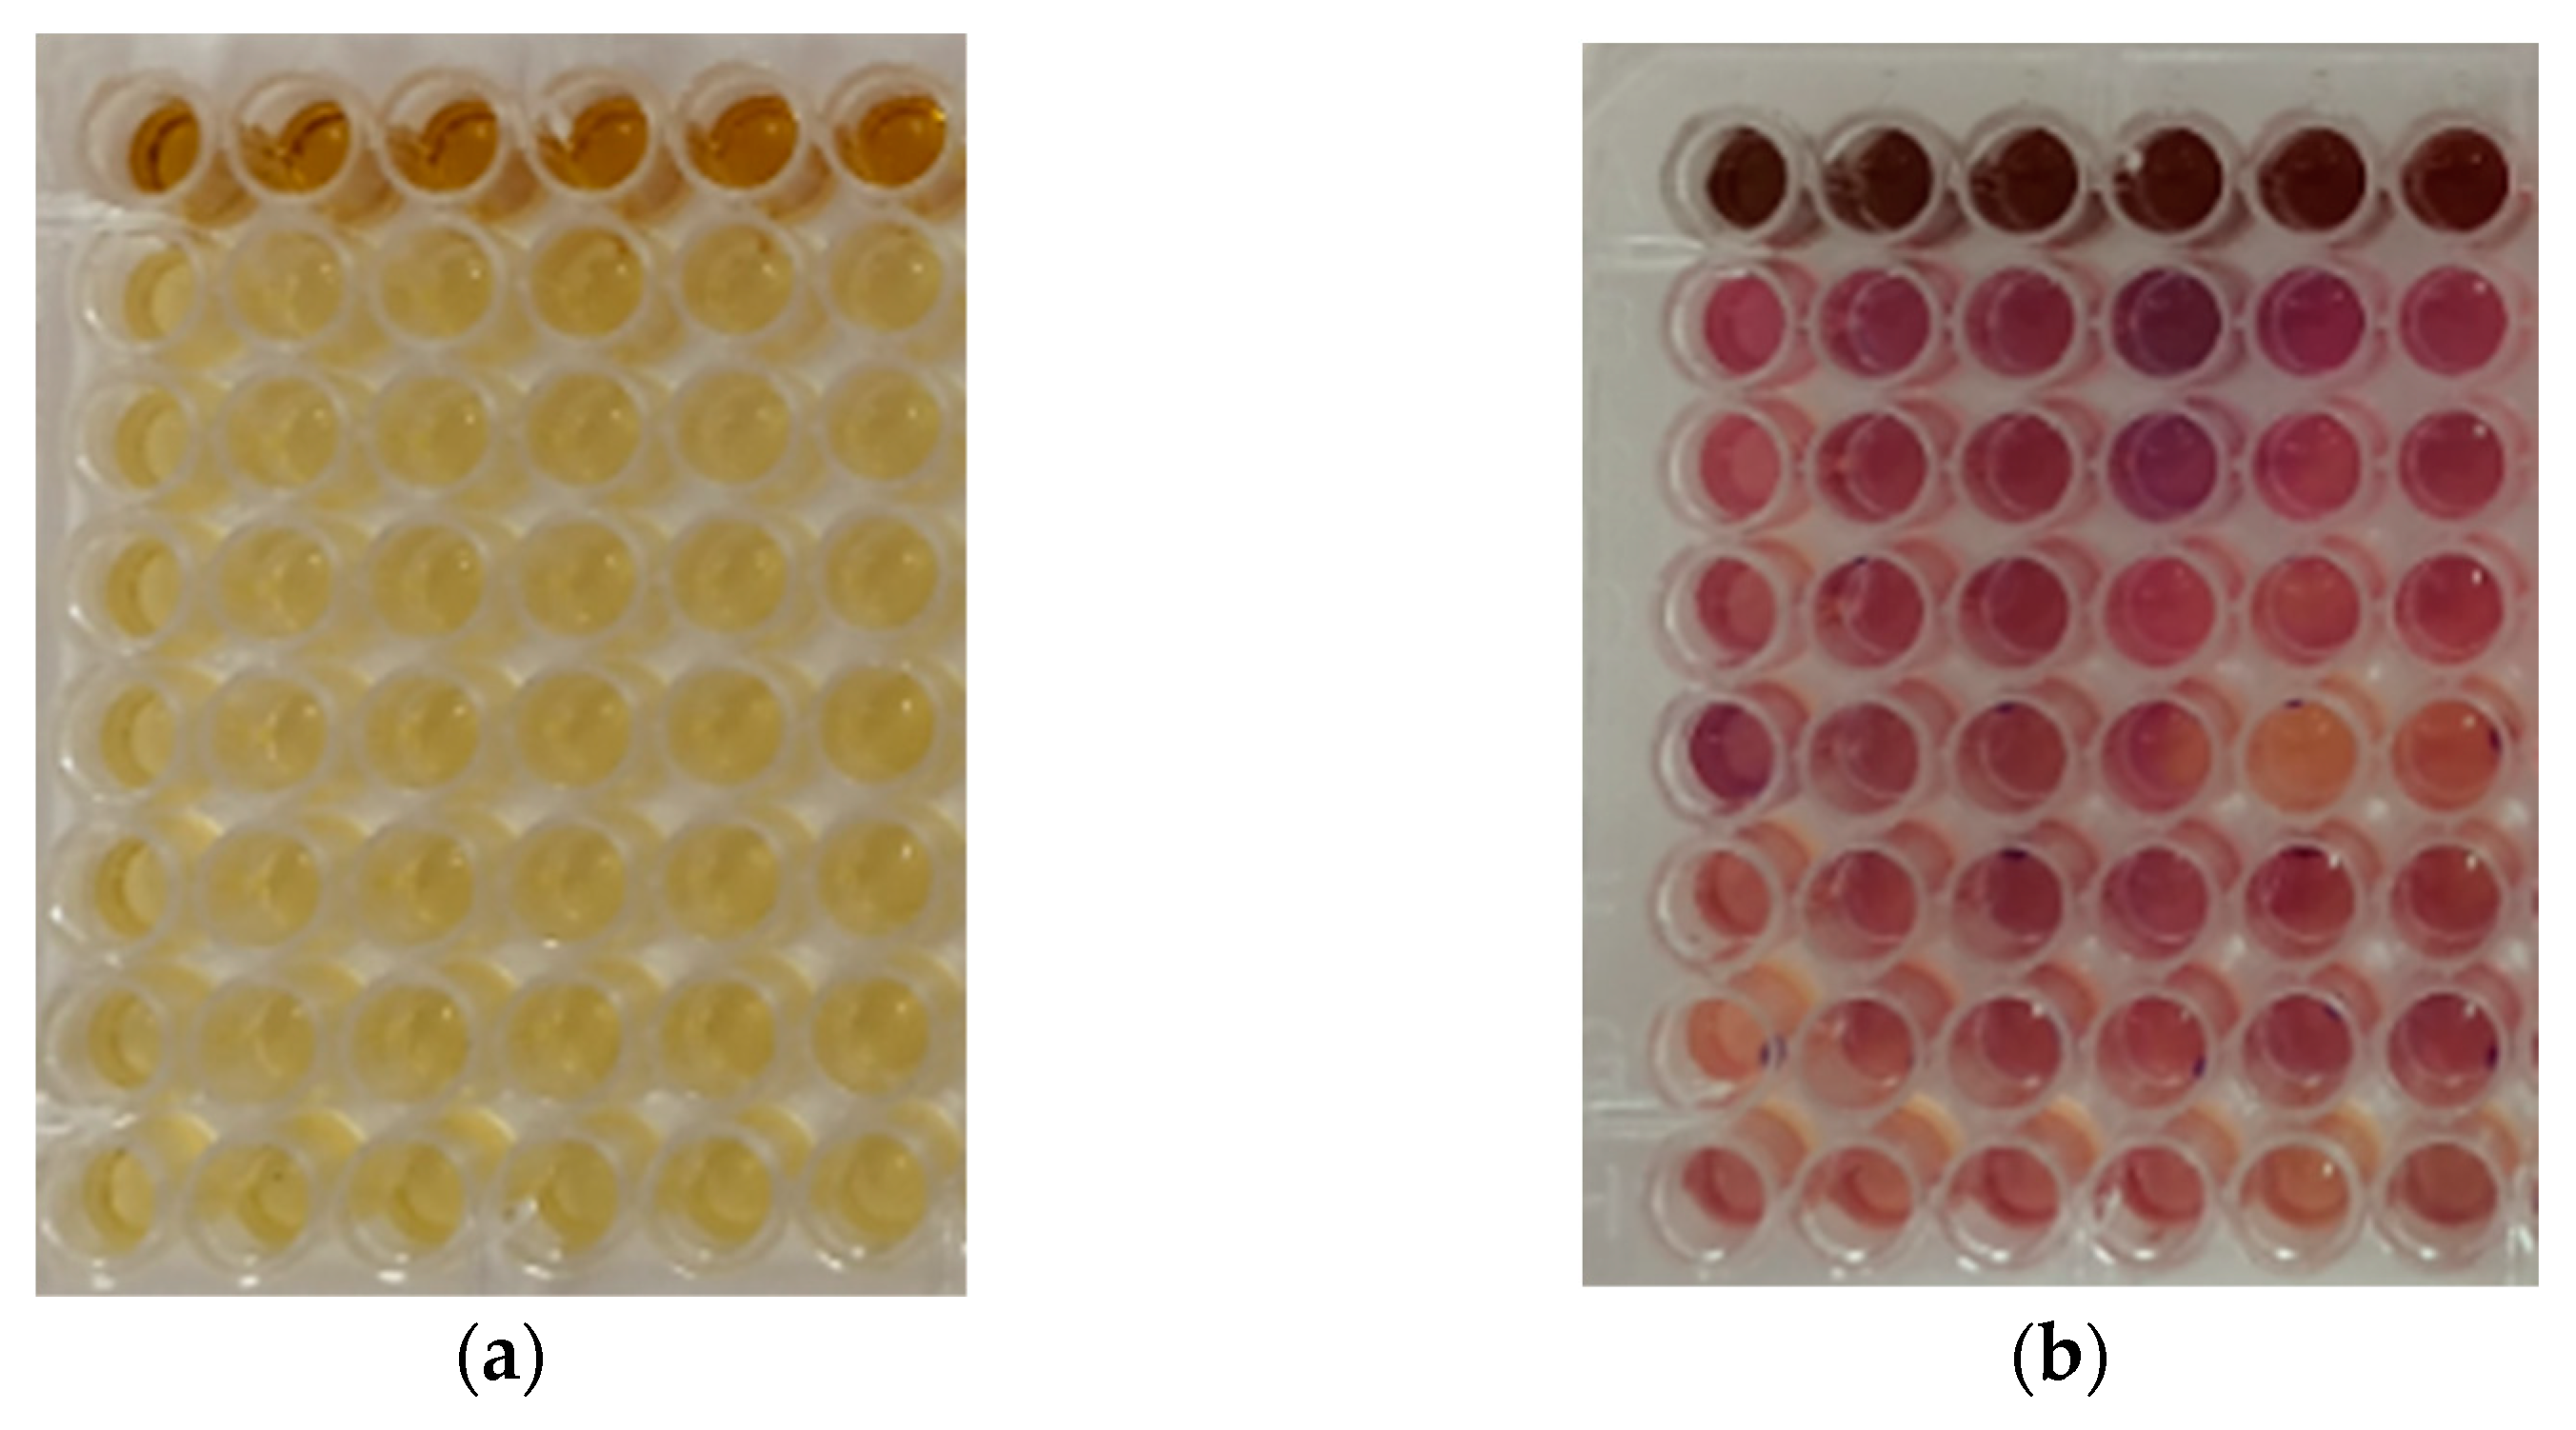
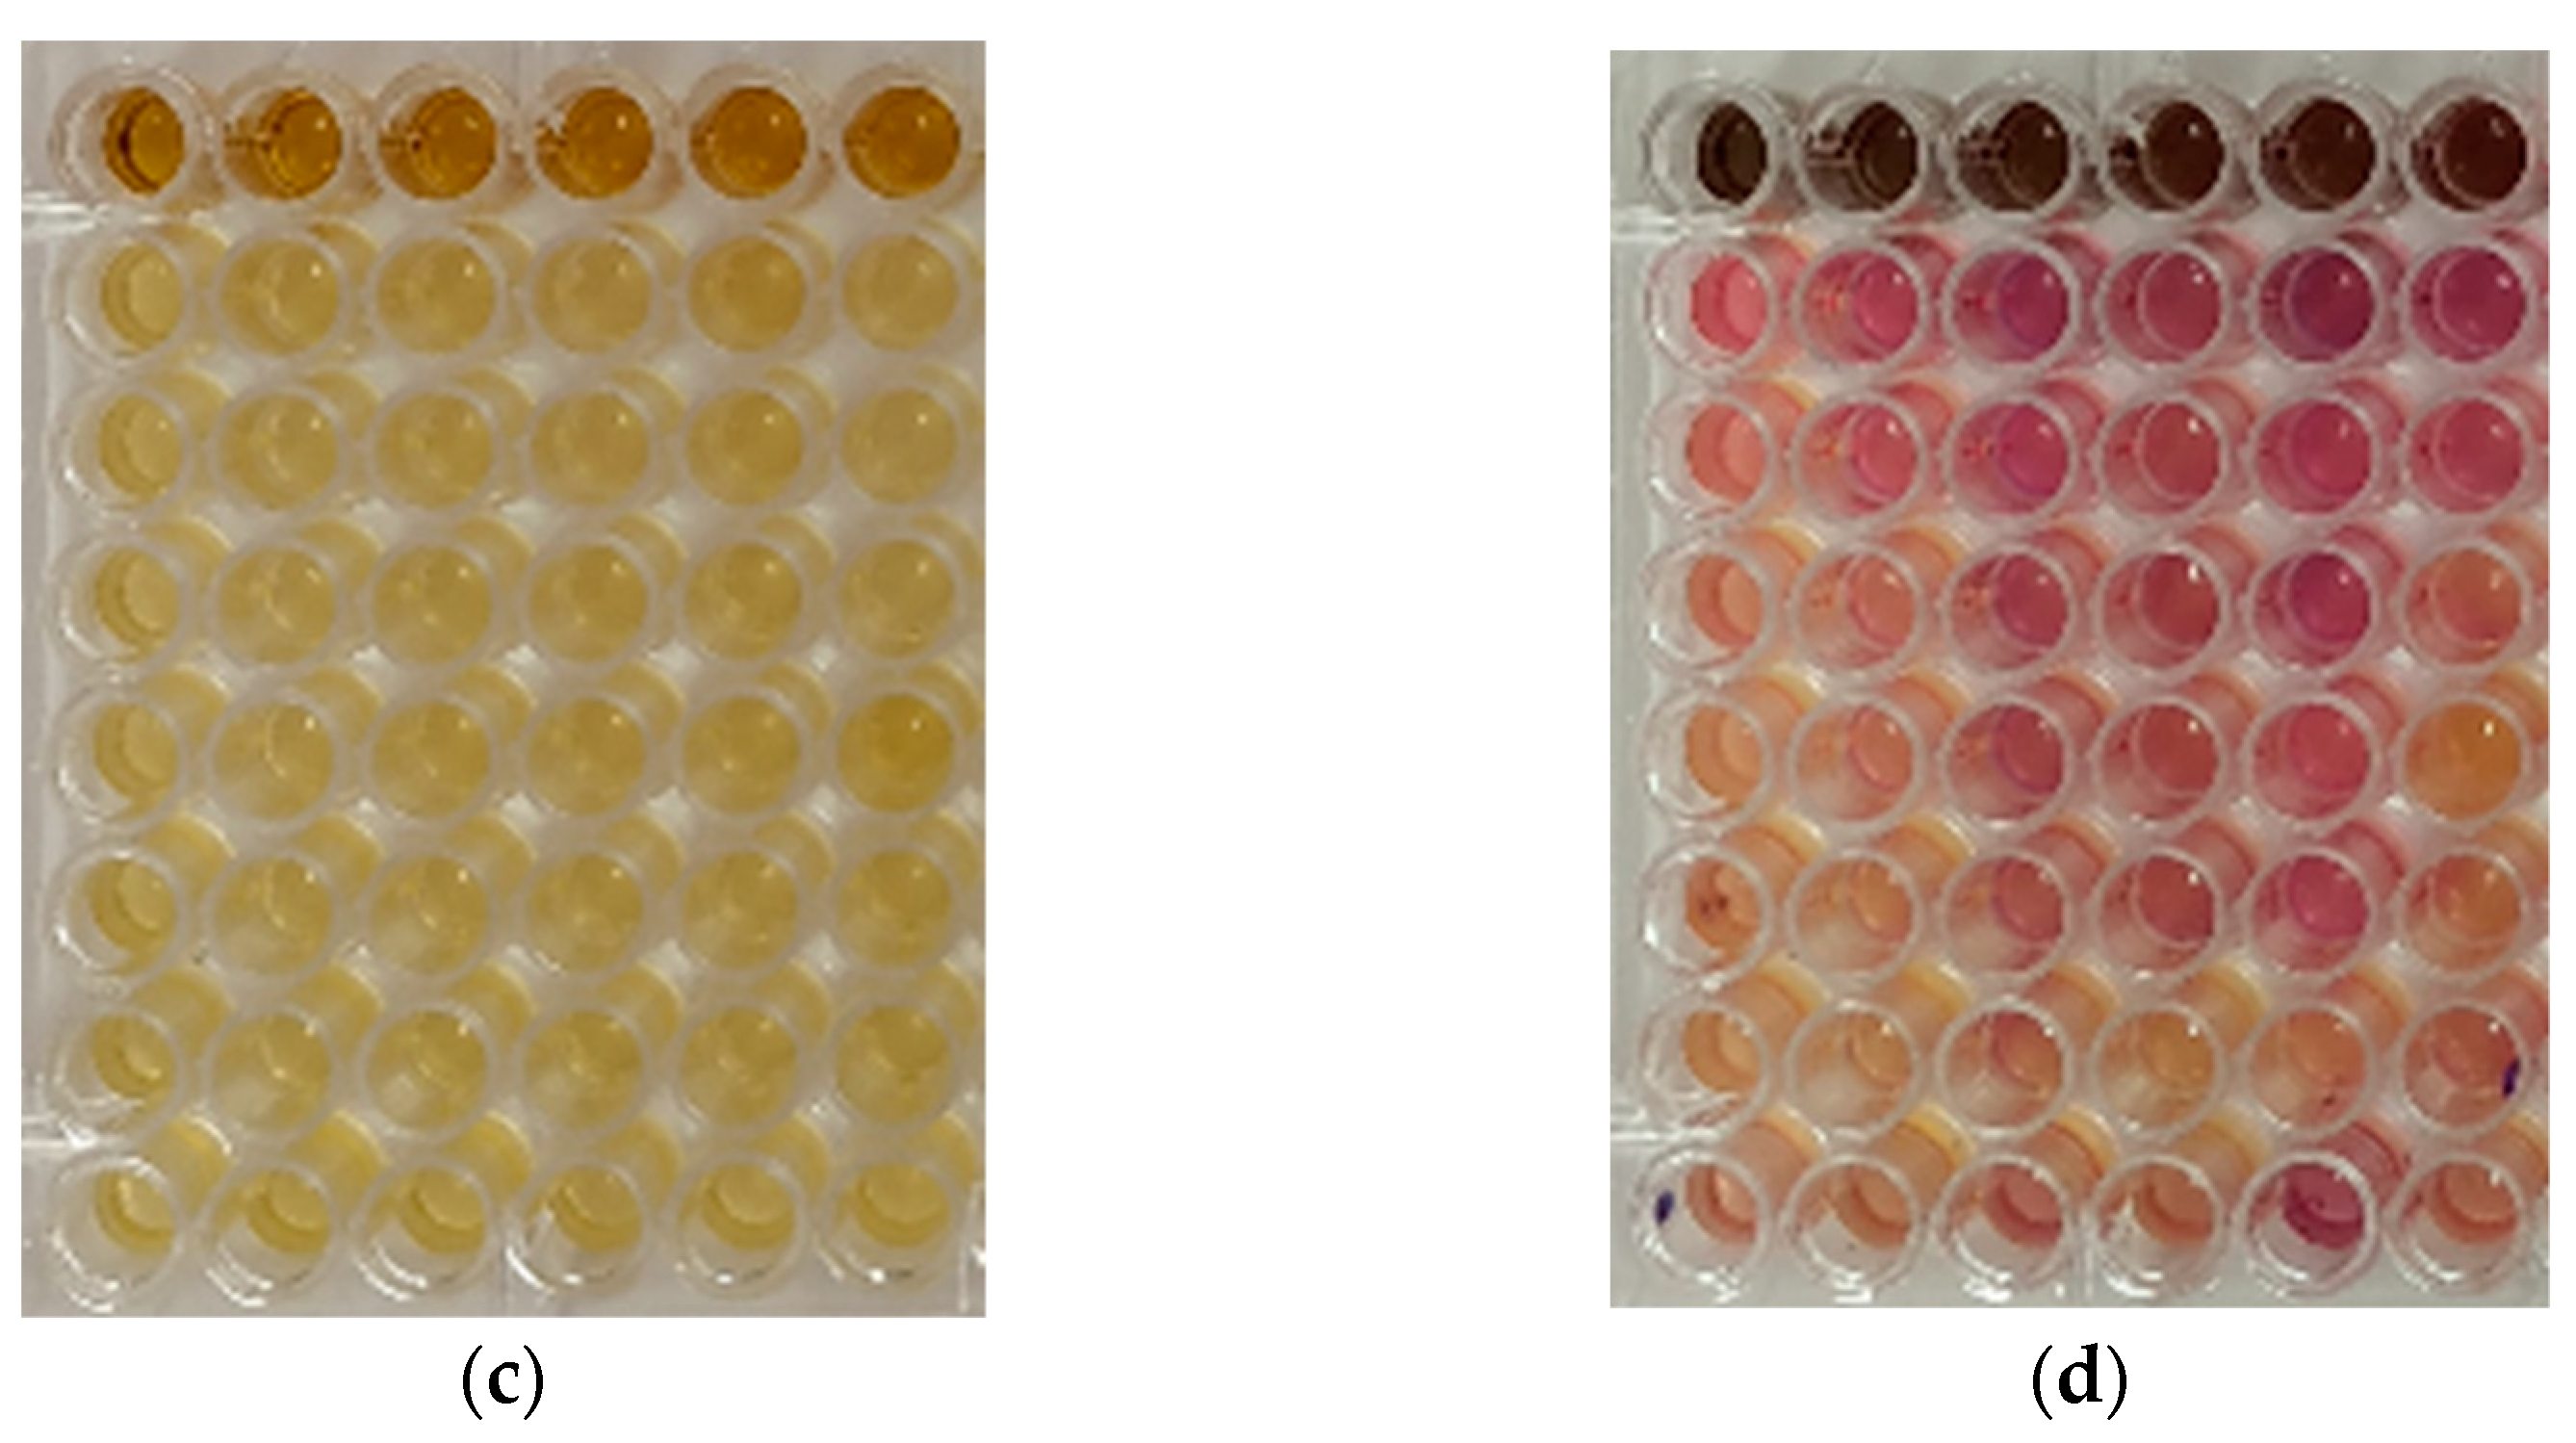
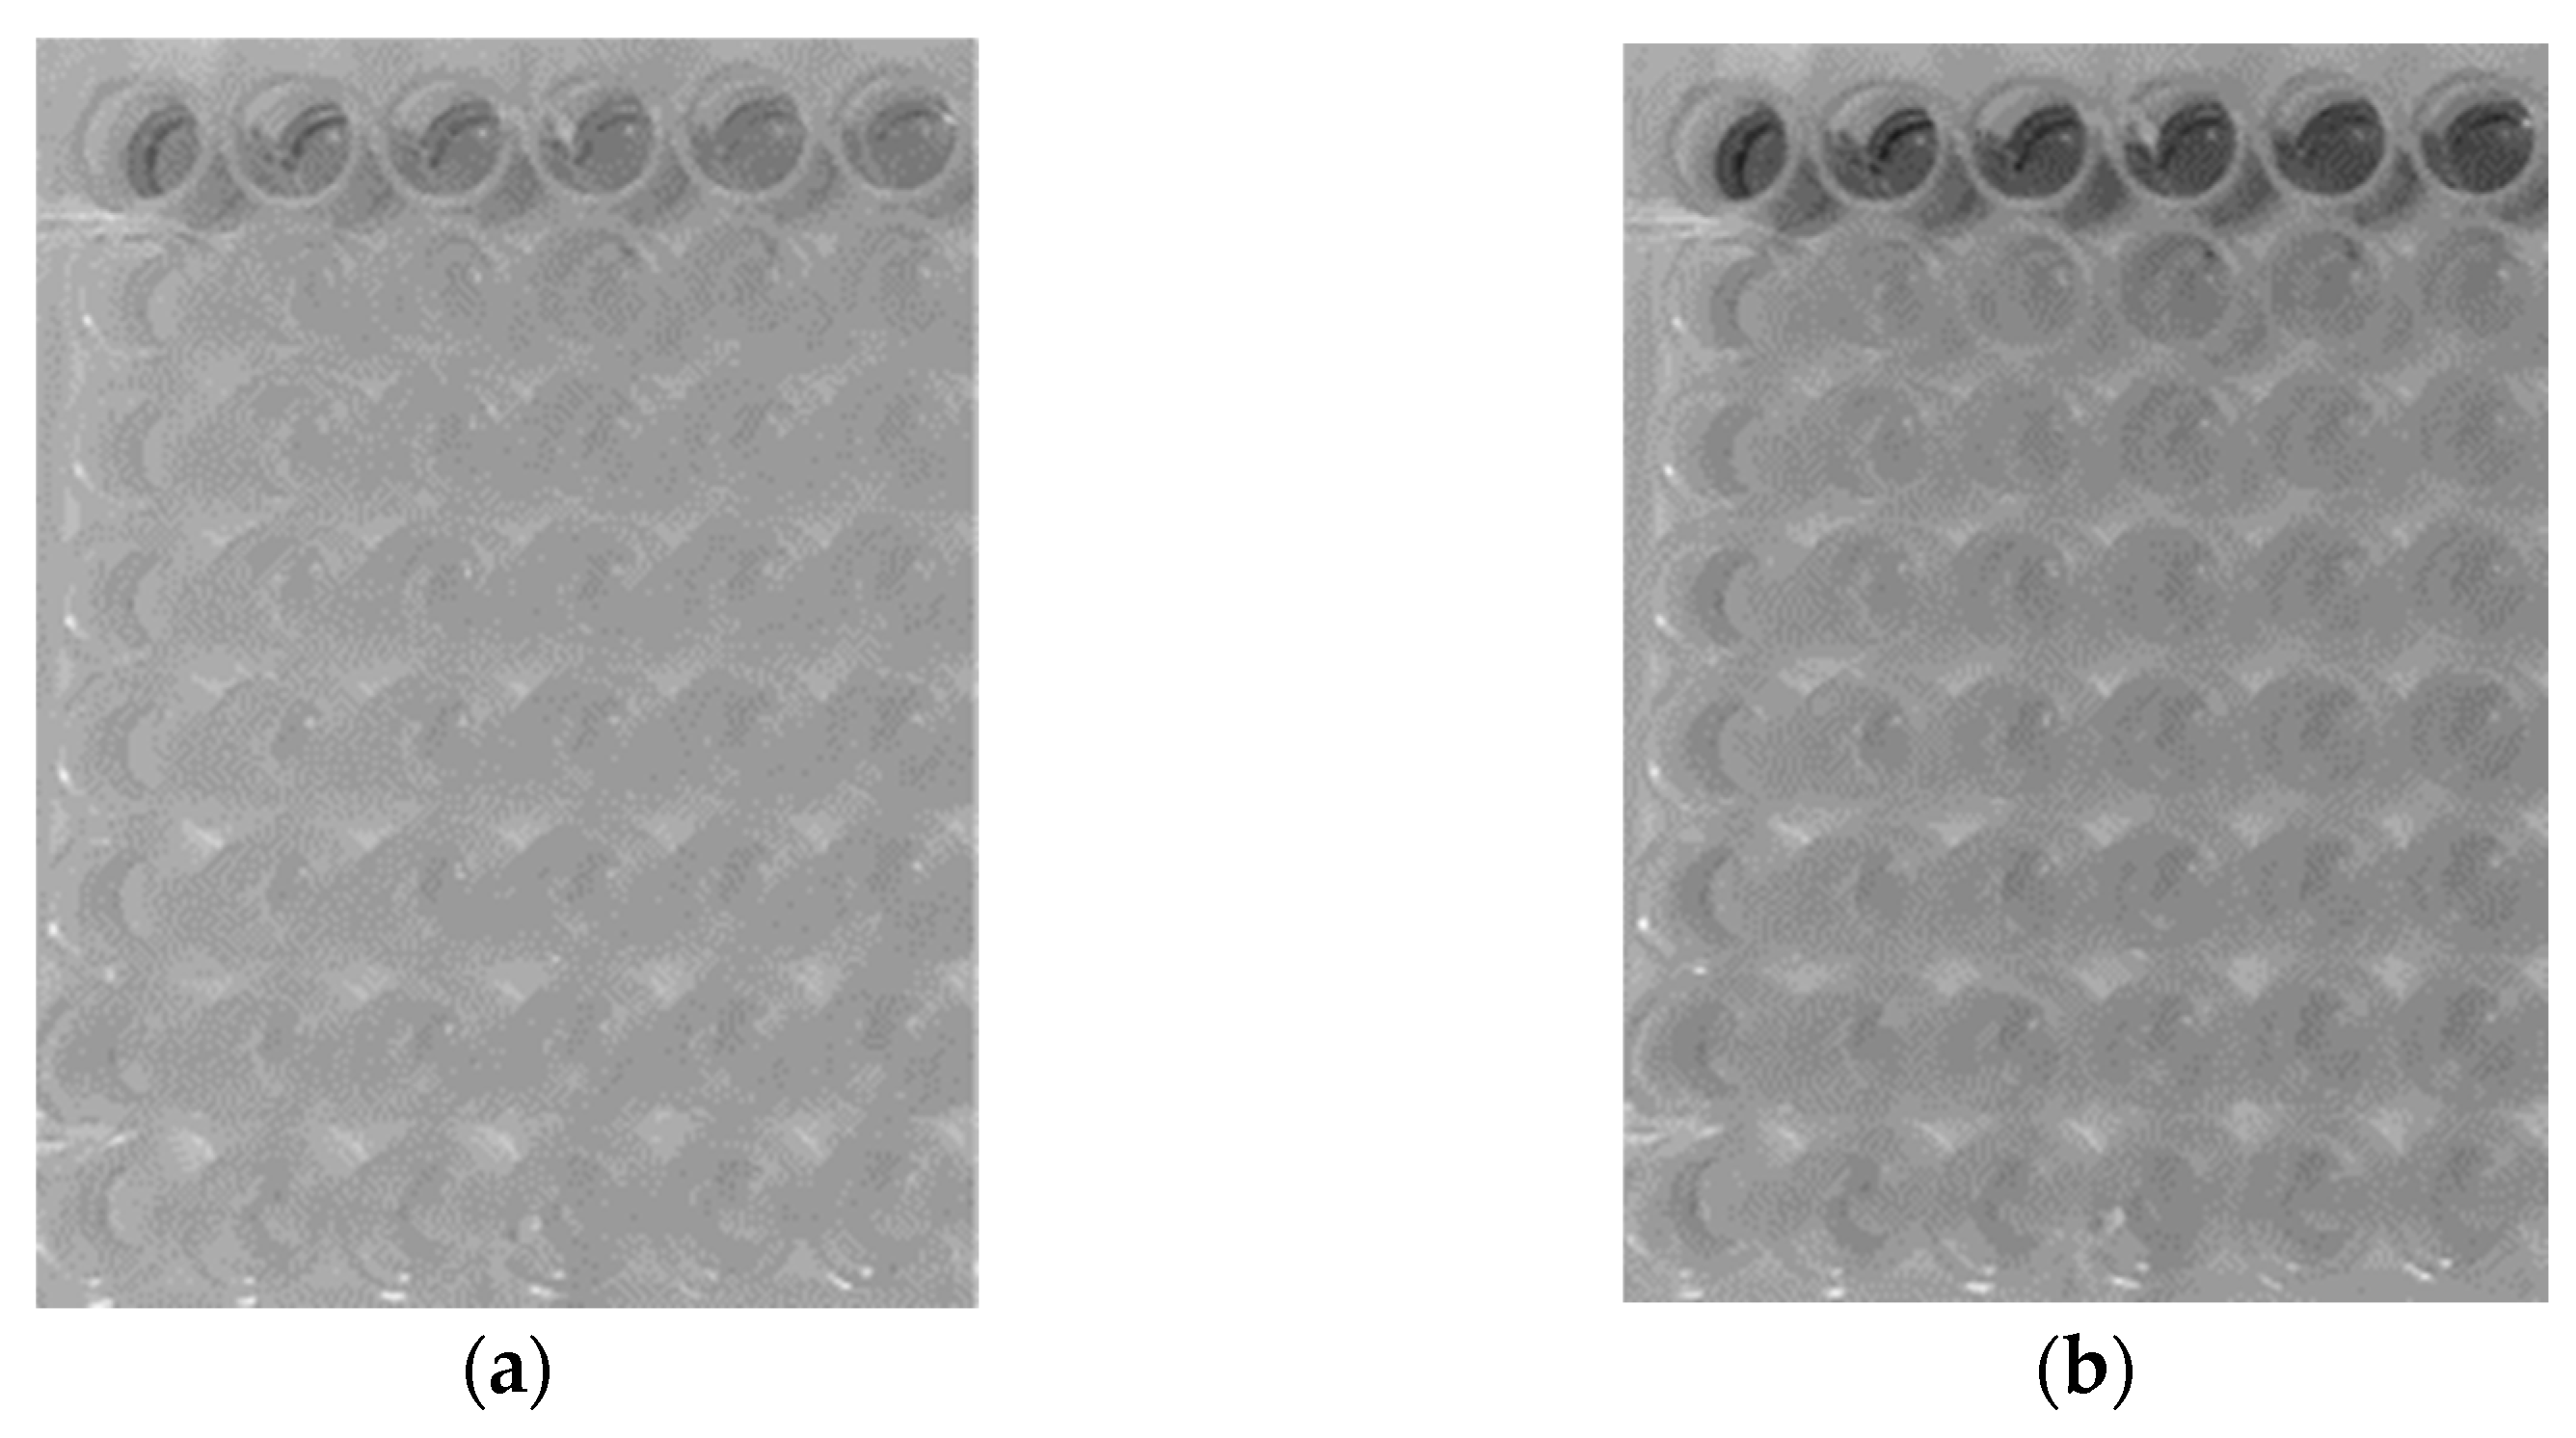
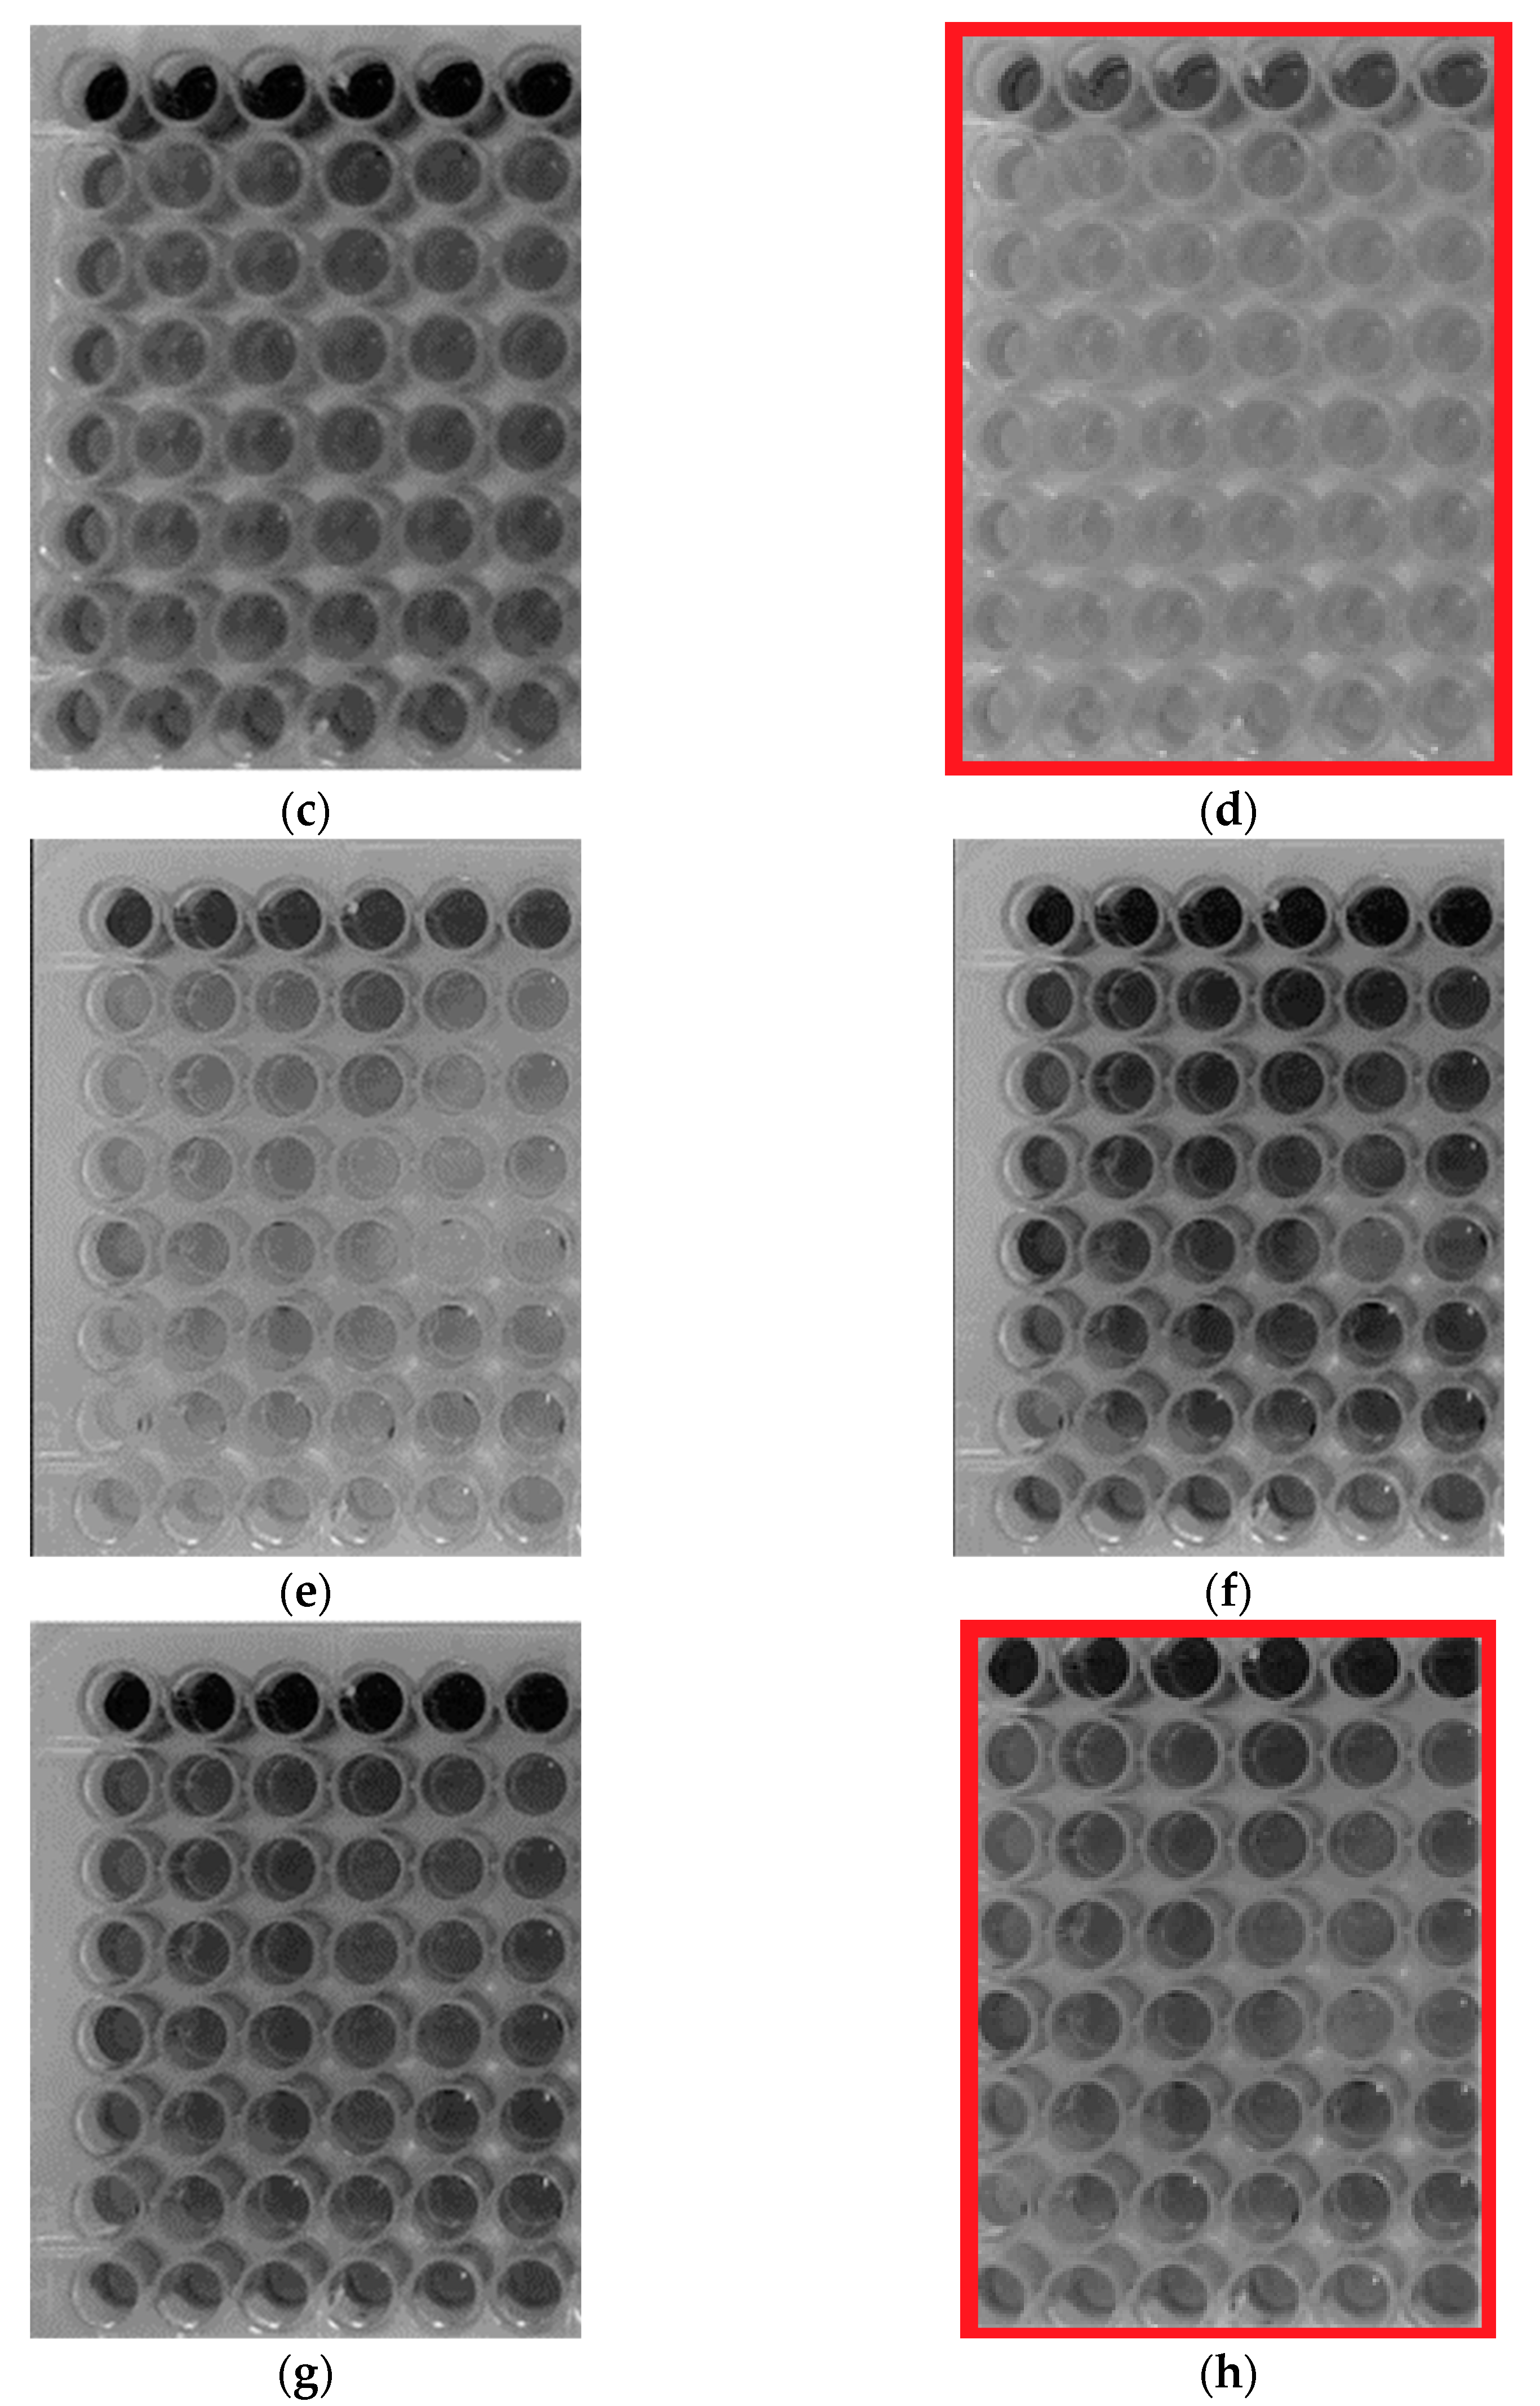
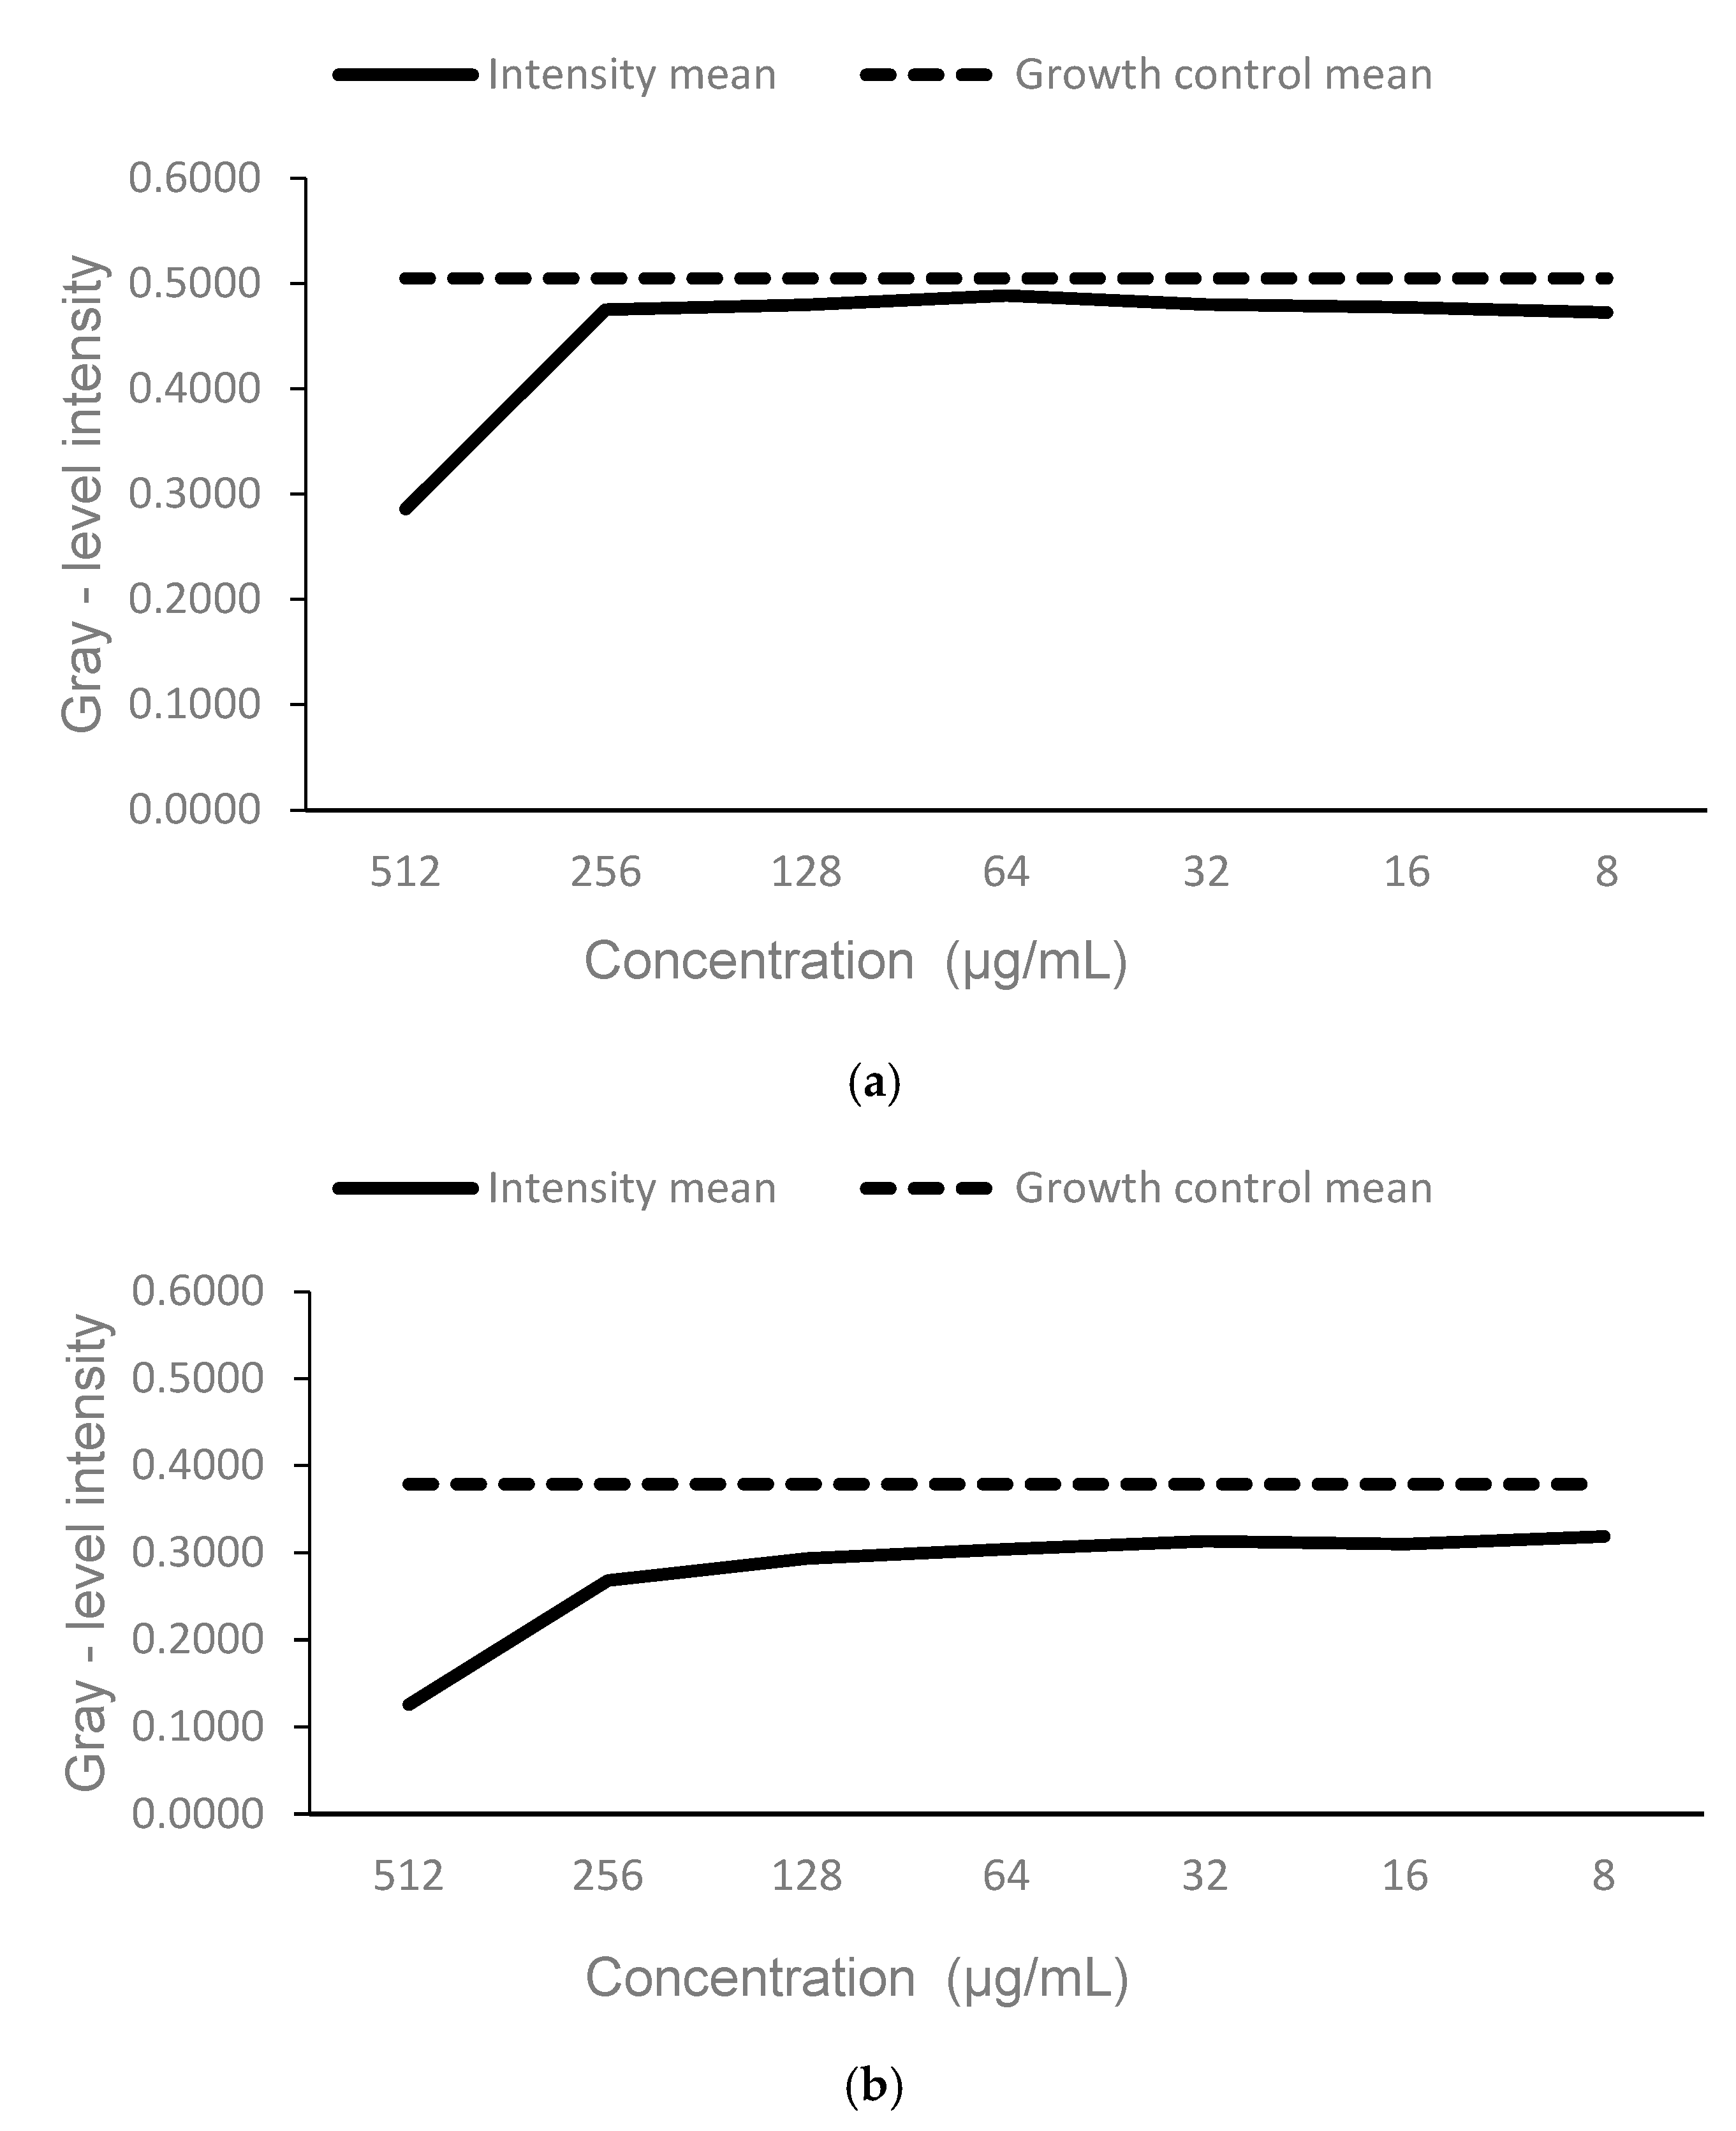
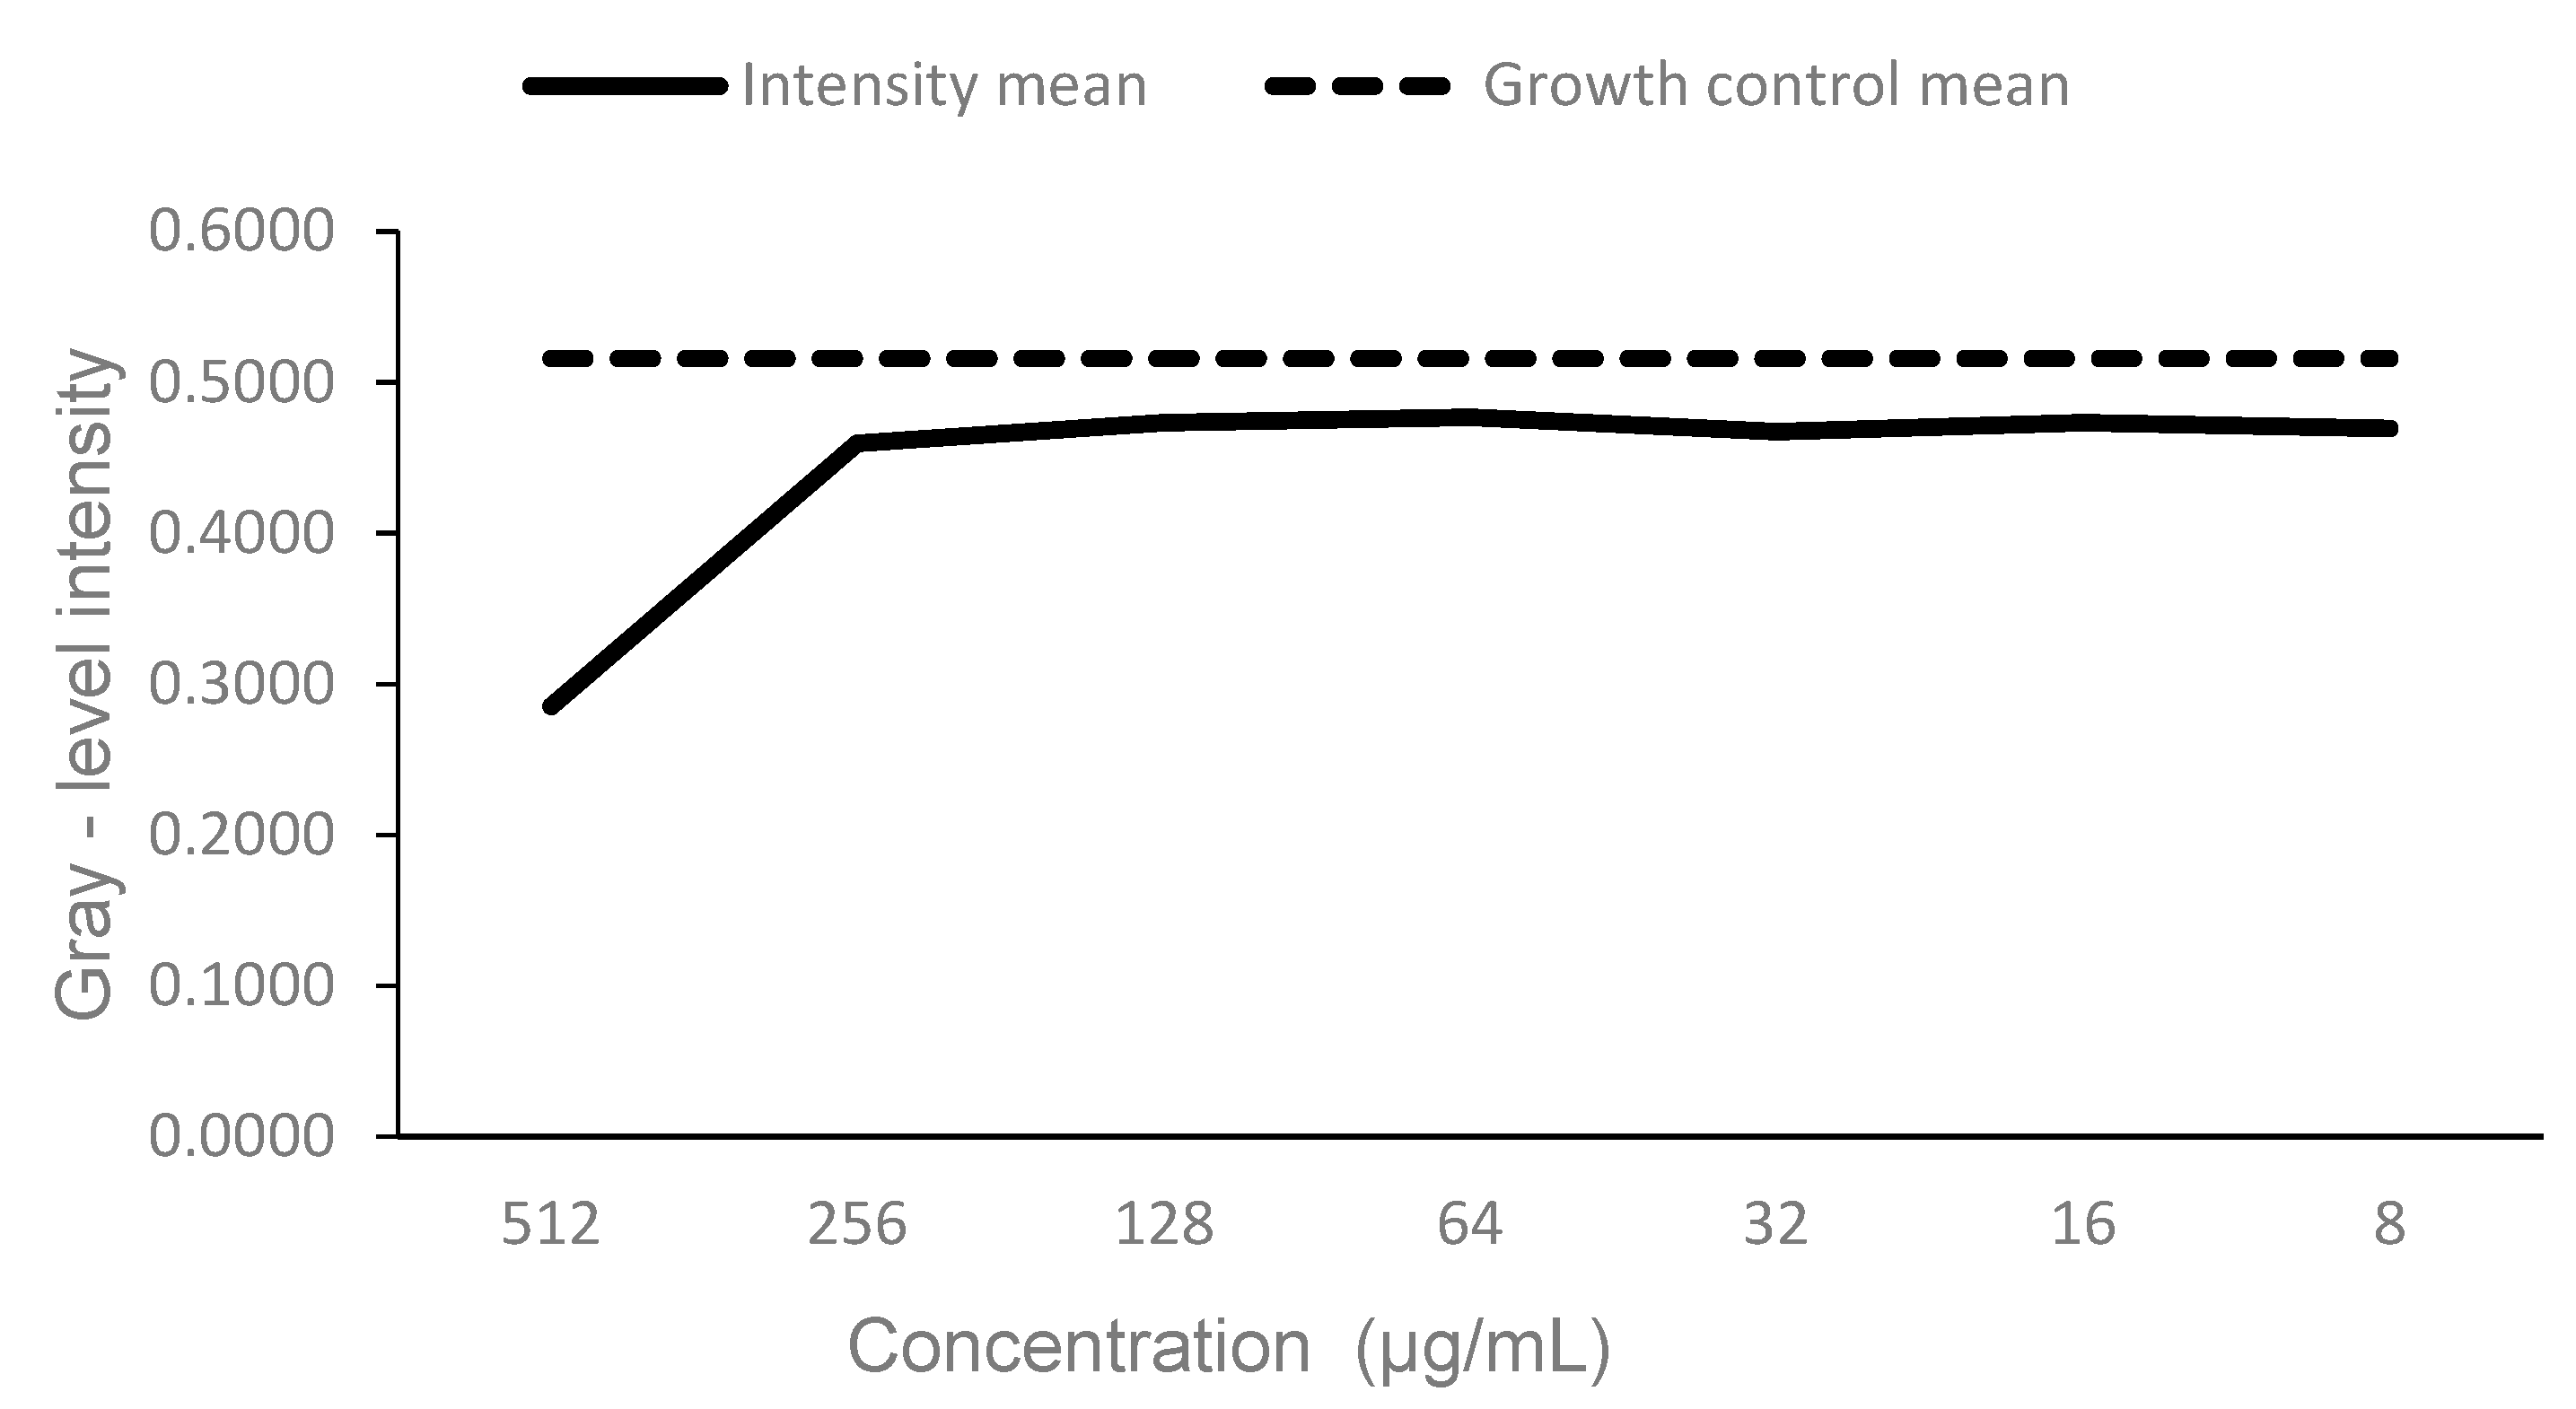
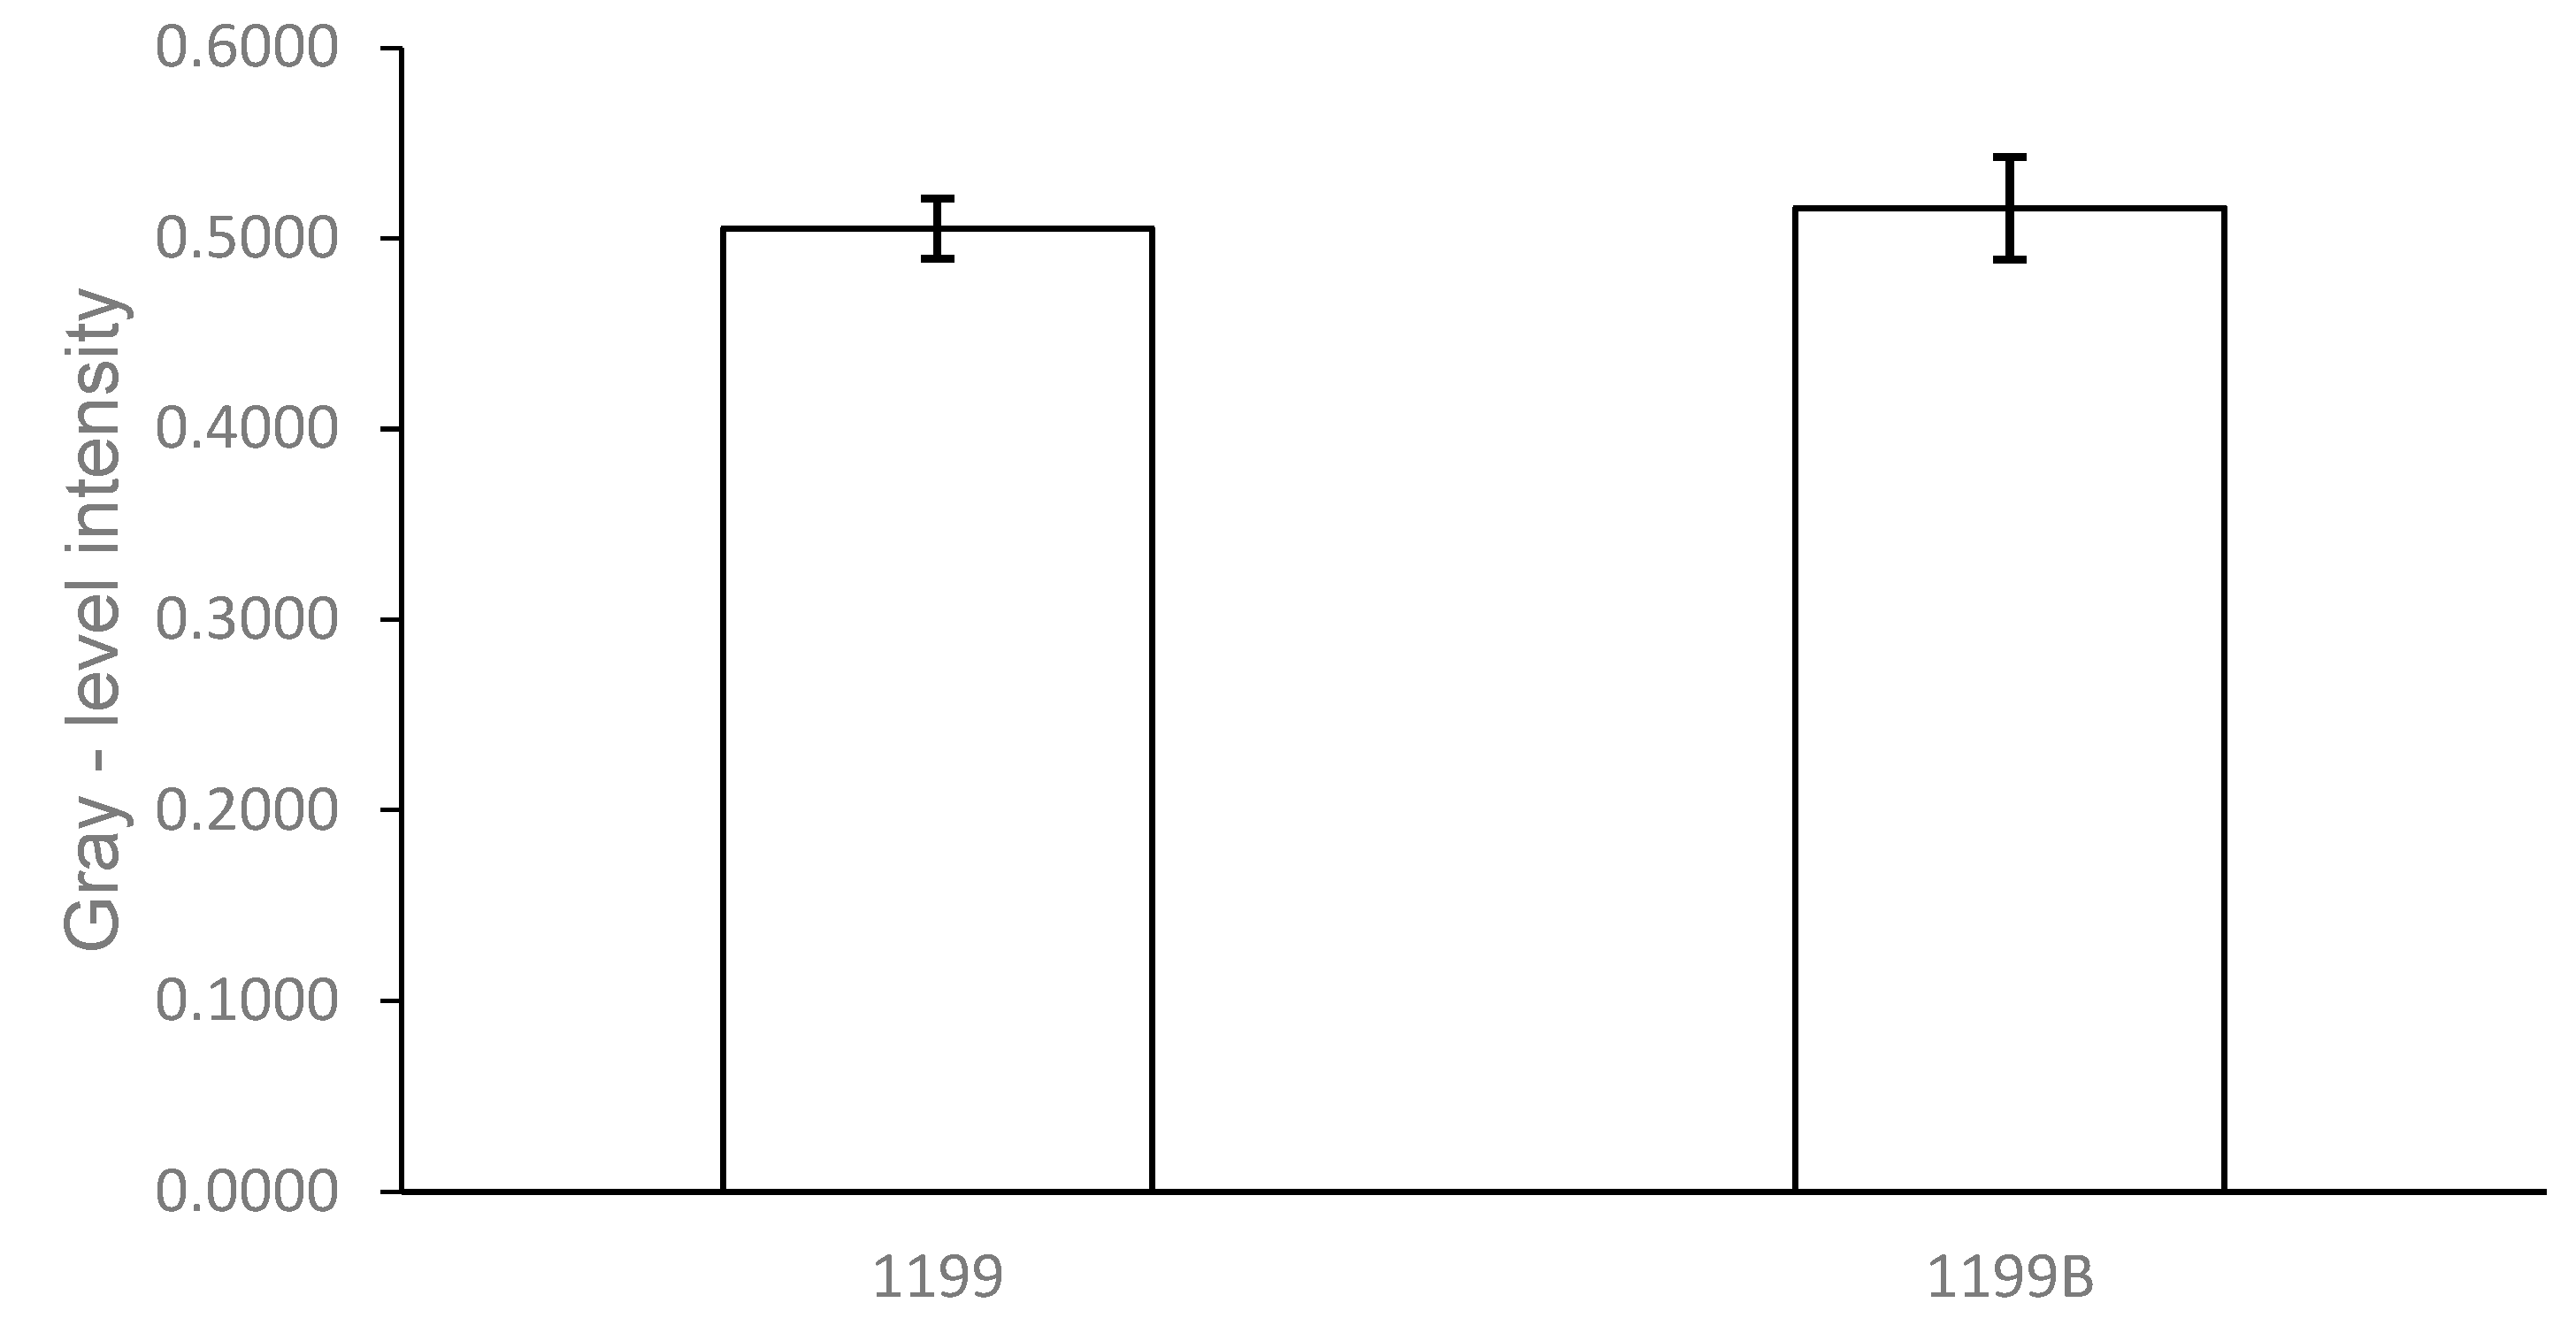
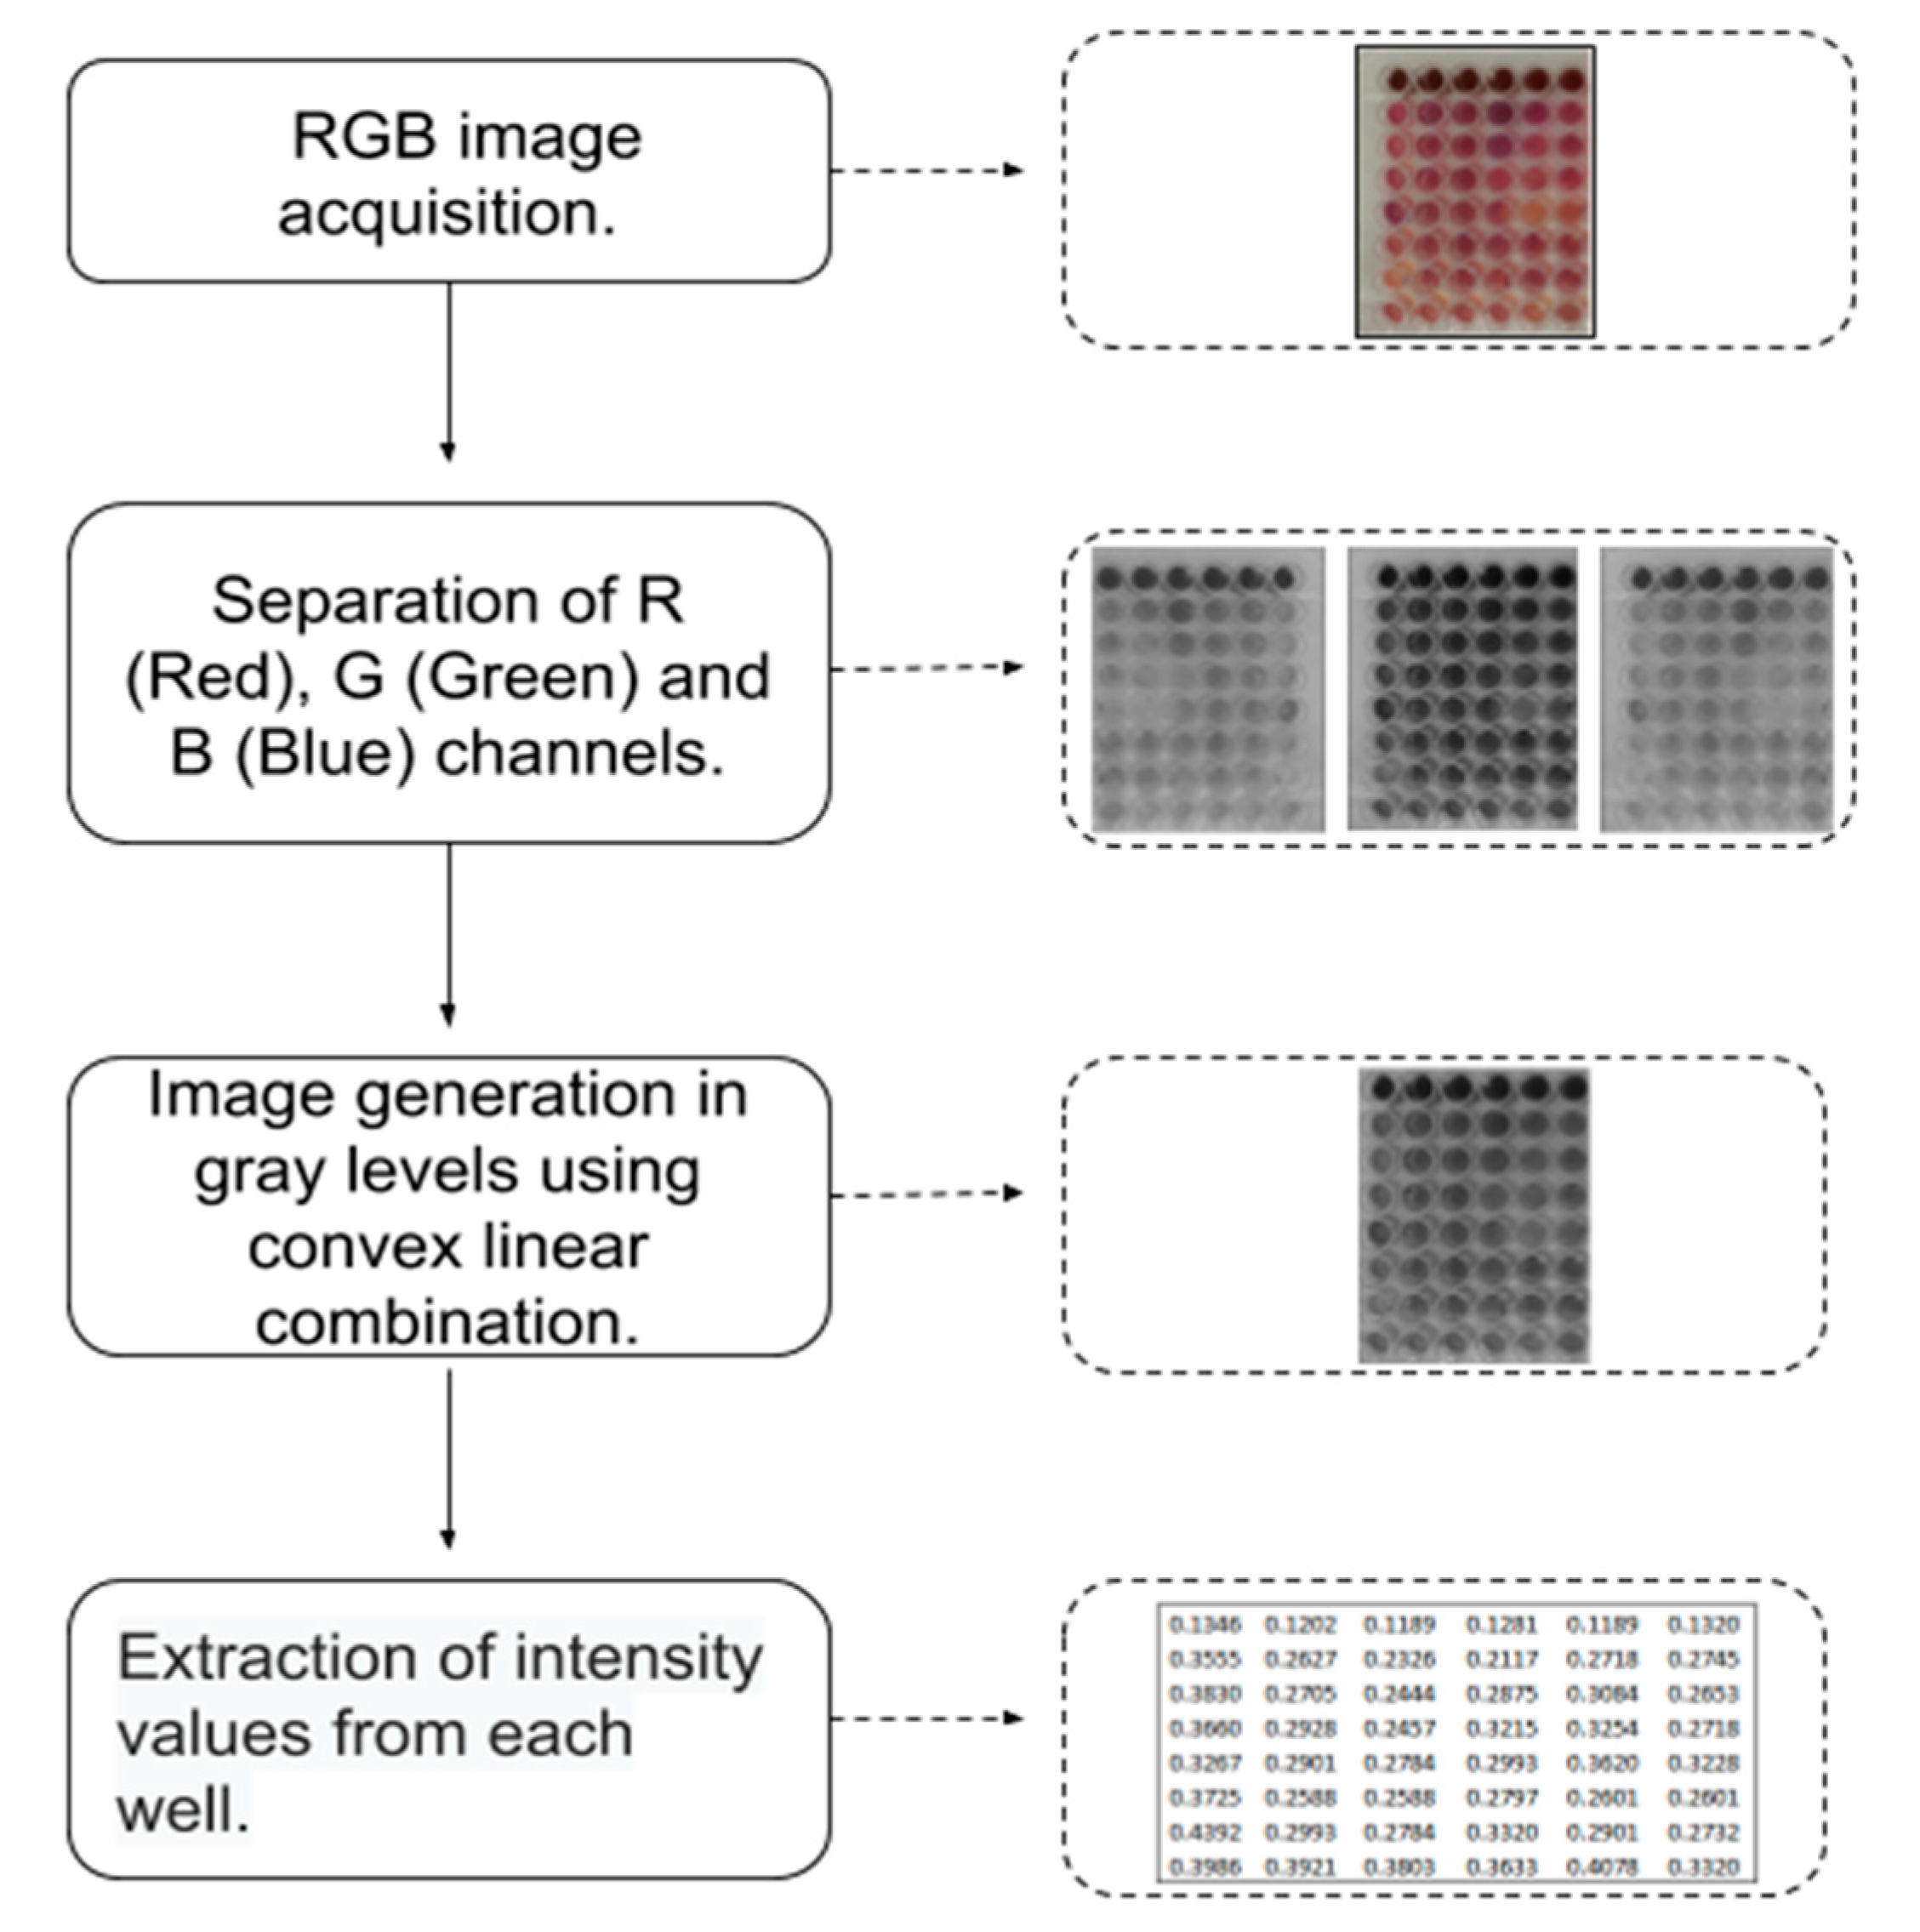
As verified in the tests from the present study, visual microplate reading following the addition of resazurin (0.4 mg/mL) showed a MIC of 512 µg/mL for pyrogallol against the two S. aureus strains tested, showing antibacterial activity against the 1199 and 1199B strains. Figure 1 presents the RGB images used to evaluate the performance of the methodology proposed to investigate the inhibition of bacterial growth induced by substances in MIC tests. Figure 1a,b refers to the MIC experiment with pyrogallol against the 1199 strain before and after the addition of resazurin, respectively. Figure 1c,d shows the results against the 1199B strain, before and after the addition of resazurin.

2.2. RGB Images

The choice of using RGB images before and after the addition of resazurin (0.4 mg/mL) was to investigate whether resazurin eventually interferes with the results from the proposed methodology. After obtaining the RGB images, the images referring to channels R, G and B were separated, and the convex linear combination, expressed in Equation (1), was used to generate the final images that are the input to the methodology.
Figure 2 presents the images referring to channels R, G, and B and the final images before the addition of resazurin in the experiment with the 1199 strain. From the final images, highlighted by red frames in Figure 2, the gray level intensity information from each well of the plate was extracted. For convenience, we chose the center of each well and extracted the intensities from these pixels.
As a result of the information extraction process from each well in Figure 3, gray level intensity matrices were obtained, which are represented in Table 1 and Table 2.
From these results, the average intensities were calculated for each concentration. This procedure allowed us to create a curve that describes the growth inhibition of the Staphylococcus aureus 1199 strain promoted by pyrogallol. The average of the intensities was also calculated for the control, in which case this information represents the maximum growth of the 1199 strain after 24 h without the interference of pyrogallol. Figure 4 shows the growth inhibition curve and the maximum growth of the 1199 strain.
Figure 3a,b shows the behavior, before and after the addition of resazurin, of the growth inhibition curves of the 1199 strain. The inhibition promoted by pyrogallol was more expressive in the 512 µg/mL concentration in both cases, that was considered as the MIC point of pyrogallol against the 1199 strain. This response can be visually verified in Figure 1a,b.
An important aspect that should be emphasized about the proposed methodology for the construction of the GIC is its sensitivity to small variations between wells of the same concentration (replicates), eventually caused when preparing solutions, such as pipetting, etc. Thus, this methodology can also help in estimating the uncertainty of the experiment. The addition of resazurin, that is, the addition of another source of uncertainty, possibly caused the differences between the curves in Figure 3. For this reason, we chose to use only experiments before the addition of resazurin.
Table 3 shows the gray level intensities, before the addition of resazurin, in the experiment with the 1199B strain. The procedure for constructing the growth inhibition and maximum growth curves was the same as previously described. The previously made comments also can be applied here.
The pyrogallol inhibition curve against the 1199B strain is shown in Figure 4. The concentration that obtained the greatest growth inhibition of the strain was 512 µg/mL, suggesting this as the MIC point. This response can be visually verified in Figure 1c,d.
Equations (2) and (3) were used to estimate the rates of inhibition and non-inhibition promoted by pyrogallol against the 1199 and 1199B strains. The respective rates are shown in Figure 5a,b.
An analysis comparing the average growth using gray levels of the 1199 and 1199B strains was performed. The purpose of this analysis was to investigate the growth of the strains without the interference of pyrogallol. Figure 6 shows the average growth in gray levels of the strains with their respective standard deviations. A student’s t test was performed with a significance level of 0.05 and no significant difference (p < 0.05) was detected between the average growths of the 1199 and 1199B strains, without the interference of pyrogallol.

3. Discussion

The proposed methodology, used information extracted from RGB images, from microplates used in MIC assays. This methodology allows the subjectivity of the human eye analysis to be eliminated, thus ensuring greater accuracy, in addition to reducing experimental costs.
The broth microdilution method using serial concentrations is an important tool to define the MIC of bioactive compounds, since through this technique the lowest concentration of a substance that has antibacterial activity can be observed [19]. This technique was also used in the literature by Florence et al. [17] to evaluate the antibacterial effect of pyrogallol against Escherichia coli and S. aureus strains, revealing inhibition values of 256 mg/mL and 512 mg/mL, respectively. The antibacterial activity of pyrogallol by broth microdilution assays was also observed against Vibrio parahaemolyticus, with MIC values ranging from 32 to 64 μg/mL [18]. These results corroborate the present study, revealing similar MIC values for S. aureus, in addition to demonstrating the efficacy of pyrogallol’s antibacterial activity against Gram-positive and Gram-negative bacterial strains.
The broth microdilution method is also commonly used to monitor the development and susceptibility assessment, as well as resistance of bacterial strains to antibiotics, through the assessment of the MIC [20]. In addition to being determined through manual visualization readings, the methods used in these tests involve semi-quantitative procedures. Therefore, they only provide ap-proximate results, which makes the inhibition ranges of these methods uncertain [21].
The use of resazurin as a growth indicator in microdilution assays to determine MIC is effective and is able to provide reproducible results for MICs [22]. However, studies have shown that higher concentrations of resazurin (0.4 mg/mL) can lead to false negative results, given the inability of bacteria to metabolize resazurin at such concentrations [23]. In the present study, we found that the manual addition of resazurin may contribute to an increase in the imprecision of the results, because the greater the number of components to be added to the final solution present in the plate well, the greater the possibility of human error.
In this way, the replacement of visual readings following the addition of resazurin, with instrumentation methods for the standardization of MIC point readings can produce MIC results with greater sensitivity [24]. With our proposed GIC construction, small variations between wells of the microdilution plate could be more easily perceived. As a result, possible false positives can be identified faster and the MIC determination made more accurate.

4. Materials and Methods

4.1. Bacterial Strains

The Staphylococcus aureus strains used were: 1199B, which expresses the NorA efflux protein that expels antibiotics such as fluoroquinolones and other drugs, such as DNA interleaving dyes, and the 1199 strain, the wild-type of the aforementioned strain. The strains were provided by Prof. S. Gibbons (University of London) and before the experiments, were grown for 24 h at 37 °C in a solid Brain Heart Infusion-Agar medium (BHI-Agar, Acumedia Manufacturers Inc., Lansing, MI, USA).

4.2. Culture Media

The following culture media were used to perform microbiological tests: Brain Heart Infusion-Agar prepared according to the manufacturer and Brain Heart Infusion (BHI, Acumedia Manufacturers Inc.) prepared at a concentration of 10%.

4.3. Substance

The pyrogallol substance was acquired from Sigma-Aldrich (São Paulo, Brazil), diluted in dimethyl sulfoxide (DMSO) and then in sterile water to a standard concentration of 1024 µg/mL, according to the guidelines of the Clinical and Laboratory Standards Institute (CLSI) [5]. The proportion of DMSO used was less than 5%, which is considered non-toxic for bacterial strains [25].

4.4. Minimum Inhibitory Concentration Assays

The minimum inhibitory concentration tests were performed using the broth microdilution method [26]. The strains used in the tests were sown 24 h before the experiments. After this period, the bacterial inoculum was suspended in saline, corresponding to 0.5 of the McFarland scale, approximately 1.5 × 10⁸ (CFU)/mL. The eppendorfs® were then filled with 900 µL of BHI and 100 µL of the inoculum, and the plates were filled with 100 µL of the final solution. Microdilution was performed with 100 µL in serial dilutions up to the penultimate well of the plate (1:1), the latter being used as a growth control. The concentrations of the compounds ranged from 512 µg/mL to 0.5 µg/mL. After 24 h of incubation, 20 µL of resazurin (0.4 mg/mL), (7-hydroxy-10-oxidophenoxazin-10-ium-3-one) were added and after 1 h of reaction, the readings were performed. Resazurin was oxidized in the presence of the acid medium caused by bacterial growth, promoting the color a change from blue to pink [5]. Resazurin is a molecule that serves as a redox indicator. It has a midnight blue color and low intrinsic fluorescence. After entering the cell, in response to the metabolic activity of living cells, resazurin is reduced to resorufin, which has a pink color and is fluorescent. The MIC was defined as the lowest concentration in which no growth can be observed. The tests were performed in triplicate.

4.5. The Proposed Method

The proposed method for constructing bacterial growth inhibition curves from MIC assays is illustrated in Figure 7.
According to the flowchart, the first step is to acquire an RGB image of the microplate containing the solutions for the MIC experiment. This procedure can be performed, for example, using a cell phone. In this study, we used the mobile device Samsung Chat 322 Duos (GT-C3222) with a 1.3 Mp camera.
After the acquisition of the RGB image, we separated the channels R, G and B using the R software. It is worth mentioning that the reading of the image made by the software is done in such a way that each pixel will be represented by a number (gray intensity). Then, using the three channels, we generated an image in gray levels from the following convex linear combination:
Igl = ar Ir + ag Ig + ab Ib
with I g l being the image, in gray levels, resulting from the convex linear combination, Ir the image from the red channel, Ig the image from the green channel and Ib the image from the blue channel. For Equation (1) to be a legitimate convex linear combination, it is necessary that each coefficient belongs to the interval [0,1] and their sum is equal to 1. In this study, equal values for the coefficients from Equation (1) were adopted, a r = a g = a b = 1 3 , this ensures that each channel contributes equally. Moreover, while the choice of values for the coefficients can be studied, our proposal does not include this analysis.
For each well of the microplate in the Igl image, the gray level intensity value located in the center of each well was empirically extracted. This procedure generates a matrix of gray level intensities with 6 columns and 8 lines, denominated here as Mgl. The columns of this matrix refer to the replicates and the lines to the investigated concentrations, with the exception of the last line, which is the growth control of the strain.
The construction of the GIC is then done with the information from the Mgl matrix. For each line of the matrix, the arithmetic mean was calculated, in such a way that each investigated concentration has an average gray level intensity as a response and so this paired information was plotted on a graph. The average corresponding to the last line of the Mgl, is added to the same graph and is used as the average growth of the strain after 24 h, without interference from substances.
Using the information contained in the aforementioned graph, we estimated the rates of inhibition and non-inhibition corresponding to each of the first 07 lines of the Mgl matrix, using Equations (2) and (3):
I c = ( I m e a n I o b s I m e a n ) .100
I c _ = 100 I c
with I c and I c _ being the rates of inhibition and non-inhibition of bacterial growth, respectively, at concentration c, Imean the average growth of the strain after 24 h in gray levels and Iobs the mean of the intensities corresponding to concentration c. The rate of growth inhibition is used here to guide us in identifying the MIC point.

5. Conclusions

The results from the present study revealed that pyrogallol has antibacterial activity against S. aureus 1199 and 1199B strains. This study also proposed a new method for evaluating bacterial growth in minimum inhibitory concentration (MIC) assays. The method combines the R, G and B channels from the RGB image of the microplate used in the MIC experiment and generates a resulting image that allows the construction of the bacterial growth inhibition curve. From this curve, the MIC point of pyrogallol against the 1199 and 1199B strains was identified. As expected, the proposed method suggested the same MIC point for pyrogallol when this was applied to the microplate images before and after the addition of resazurin. Another important aspect of the proposed method was its equivalence with the result from the visual analysis. In this way, the subjectivity of the analysis of the human eye in MIC assays can be eliminated. It is worth mentioning that the proposed method allowed the evaluation of the MIC of pyrogallol against S. aureus without the need to use resazurin. In other words, our proposal guarantees greater precision and reduced experimental costs. In addition, the proposed methodology allows the estimation of the rate of inhibition of bacterial growth, thus guaranteeing satisfactory and promising results to the methodology. Therefore, this study can assist the scientific community that develops MIC experiments, suggesting the MIC point and quantifying bacterial inhibition.

Author Contributions

Methodology: L.C.C.O. and F.A.A.R.; writing—original draft preparation: L.C.C.O., F.A.A.R., C.R.d.S.B., N.S.M. and Z.d.S.S.; writing—review and editing: F.A.B.d.C., N.S.M., Z.d.S.S. and J.F.S.d.S.; supervision, F.A.B.d.C.; project administration, H.D.M.C. All authors have read and agreed to the published version of the manuscript.

Funding

This study was funded by the Fundação Cearense de Apoio ao Desenvolvimento Científico e Tecnolgico—FUNCAP ((BPI 02/2020 (no. BP4-0172-00168.01.00/20 SPU (no. 09673071/2020)); Conselho Nacional de Desenvolvimento Científico e Tecnológico—CNPq.

Institutional Review Board Statement

Not applicable.

Informed Consent Statement

Not applicable.

Data Availability Statement

Data is contained within the article.

Acknowledgments

Regional University of Cariri and Graduate Program in Biological Sciences of Federal University of Pernambuco.

Conflicts of Interest

The authors declare no conflict of interest.

References

  1. Sousa Silveira, Z.d.; Macêdo, N.S.; Sampaio dos Santos, J.F.; Sampaio de Freitas, T.; Rodrigues dos Santos Barbosa, C.; Júnior, D.L.d.S.; Muniz, D.F.; Castro de Oliveira, L.C.; Júnior, J.P.S.; Cunha, F.A.B.d.; et al. Evaluation of the Antibacterial Activity and Efflux Pump Reversal of Thymol and Carvacrol against Staphylococcus aureus and Their Toxicity in Drosophila melanogaster. Molecules 2020, 25, 2103. [Google Scholar] [CrossRef] [PubMed]
  2. dos Santos, J.F.S.; Tintino, S.R.; de Freitas, T.S.; Campina, F.F.; de A. Menezes, I.R.; Siqueira-Júnior, J.P.; Coutinho, H.D.M.; Cunha, F.A.B. In vitro e in silico evaluation of the inhibition of Staphylococcus aureus efflux pumps by caffeic and gallic acid. Comp. Immunol. Microbiol. Infect. Dis. 2018, 57, 22–28. [Google Scholar] [CrossRef] [PubMed]
  3. Tintino, S.R.; de Souza, V.C.A.; da Silva, J.M.A.; de M. Oliveira-Tintino, C.D.; Pereira, P.S.; Leal-Balbino, T.C.; Pereira-Neves, A.; Siqueira-Junior, J.P.; da Costa, J.G.M.; Rodrigues, F.F.G.; et al. Effect of Vitamin K3 Inhibiting the Function of NorA Efflux Pump and Its Gene Expression on Staphylococcus aureus. Membranes 2020, 10, 130. [Google Scholar]
  4. Araújo, A.C.J.; Freitas, P.R.; Rodrigues, C.S.B.; Muniz, D.F.; Rocha, J.E.; Albuquerque, A.C.S.; Oliveira-Tintino, C.D.M.; Ribeiro-Filho, J.; Silva, L.E.; Confortin, C.; et al. GC-MS-FID characterization and antibacterial activity of the Mikania cordifolia essential oil and limonene against MDR strains. Food Chem. Toxicol. 2020, 136, 111023. [Google Scholar] [CrossRef] [PubMed]
  5. CLSI. Methods for Dilution Antimicrobial Susceptibility Tests for Bacteria That Grow Aerobically-CLSI. Clin. Lab. Standars Inst. 2015, 32, 18. [Google Scholar]
  6. Murari, A.L.; Carvalho, F.H.; Heinzmann, B.M.; Michelot, T.M.; Hörner, R.; Mallmann, C.A. Composição e atividade antibacteriana dos óleos essenciais de Senecio crassiflorus var. crassiflorus. Química Nova 2008, 31, 1081–1084. [Google Scholar] [CrossRef] [Green Version]
  7. Lambert, R.J.W.; Pearson, J. Susceptibility testing: Accurate and reproducible minimum inhibitory concentration (MIC) and non-inhibitory concentration (NIC) values. J. Appl. Microbiol. 2000, 88, 784–790. [Google Scholar] [CrossRef]
  8. Tong, S.Y.C.; Davis, J.S.; Eichenberger, E.; Holland, T.L.; Fowler, V.G. Staphylococcus aureus Infections: Epidemiology, Pathophysiology, Clinical Manifestations, and Management. Clin. Microbiol. Rev. 2015, 28, 603–661. [Google Scholar] [CrossRef] [Green Version]
  9. Youssef, D.; Molony, K. Staphylococcus aureus Bacteremia in Adults. In Frontiers in Staphylococcus aureus; InTech: Johnson City, TN, USA, 2017; Volume 395, pp. 116–124. [Google Scholar]
  10. Akanbi, O.E.; Njom, H.A.; Fri, J.; Otigbu, A.C.; Clarke, A.M. Antimicrobial Susceptibility of Staphylococcus aureus Isolated from Recreational Waters and Beach Sand in Eastern Cape Province of South Africa. Int. J. Environ. Res. Public Health 2017, 14, 1001. [Google Scholar] [CrossRef] [Green Version]
  11. Grace, D.; Fetsch, A. Staphylococcus aureus—A Foodborne Pathogen. In Staphylococcus aureus; Elsevier: Amsterdam, The Netherlands, 2018; pp. 3–10. [Google Scholar]
  12. Rossiter, S.E.; Fletcher, M.H.; Wuest, W.M. Natural Products as Platforms to Overcome Antibiotic Resistance. Chem. Rev. 2017, 117, 12415–12474. [Google Scholar] [CrossRef]
  13. Pasdaran, A.; Hamedi, A. Natural Products as Source of New Antimicrobial Compounds for Skin Infections, 1st ed.; Elsevier Inc.: Amsterdam, The Netherlands, 2017; Volume 2. [Google Scholar]
  14. Sarikaya, O.S.B. Acethylcholinesterase inhibitory potential and antioxidant properties of pyrogallol. J. Enzym. Inhib. Med. Chem. 2015, 30, 761–766. [Google Scholar] [CrossRef] [PubMed] [Green Version]
  15. Revathi, S.; Hakkim, F.L.; Kumar, N.R.; Bakshi, H.A.; Rashan, L.; Al-Buloshi, M.; Hasson, S.S.A.A.; Krishnan, M.; Javid, F.; Nagarajan, K. Induction of HT-29 Colon Cancer Cells Apoptosis by Pyrogallol with Growth Inhibiting Efficacy Against Drug-Resistant Helicobacter pylori. Anti-Cancer Agents Med. Chem. 2019, 18, 1875–1884. [Google Scholar] [CrossRef] [PubMed]
  16. Kocaçalışkan, I.; Talan, I.; Terzi, I. Antimicrobial Activity of Catechol and Pyrogallol as Allelochemicals. Z. Naturforsch. C 2006, 61, 639–642. [Google Scholar] [CrossRef] [PubMed]
  17. Florence, C.I.; Hery, S.; Akhmad, D. Antibacterial and antioxidant activities of pyrogallol and synthetic pyrogallol dimer. Res. J. Chem. Environ. 2018, 22, 39–47. [Google Scholar]
  18. Tinh, T.H.; Nuidate, T.; Vuddhakul, V.; Rodkhum, C. Antibacterial Activity of Pyrogallol, a Polyphenol Compound against Vibrio parahaemolyticus Isolated from The Central Region of Thailand. Procedia Chem. 2016, 18, 162–168. [Google Scholar] [CrossRef] [Green Version]
  19. Parvekar, P.; Palaskar, J.; Metgud, S.; Maria, R.; Dutta, S. The minimum inhibitory concentration (MIC) and minimum bactericidal concentration (MBC) of silver nanoparticles against Staphylococcus aureus. Biomater. Investig. Dent. 2020, 7, 105–109. [Google Scholar] [CrossRef]
  20. Wiegand, I.; Hilpert, K.; Hancock, R.E.W. Agar and broth dilution methods to determine the minimal inhibitory concentration (MIC) of antimicrobial substances. Nat. Protoc. 2008, 3, 163–175. [Google Scholar] [CrossRef]
  21. Li, J.; Xie, S.; Ahmed, S.; Wang, F.; Gu, Y.; Zhang, C.; Chai, X.; Wu, Y.; Cai, J.; Cheng, G. Antimicrobial activity and resistance: Influencing factors. Front. Pharmacol. 2017, 8, 364. [Google Scholar] [CrossRef] [Green Version]
  22. Eloff, J.N. Avoiding pitfalls in determining antimicrobial activity of plant extracts and publishing the results. BMC Compl. Altern. Med. 2019, 19, 106. [Google Scholar] [CrossRef] [Green Version]
  23. Elshikh, M.; Ahmed, S.; Funston, S.; Dunlop, P.; McGaw, M.; Marchant, R.; Banat, I.M. Resazurin-based 96-well plate microdilution method for the determination of minimum inhibitory concentration of biosurfactants. Biotechnol. Lett. 2016, 38, 1015–1019. [Google Scholar] [CrossRef] [Green Version]
  24. Jorgensen, J.H.; Ferraro, M.J. Antimicrobial susceptibility testing: A review of general principles and contemporary practices. Clin. Infect. Dis. 2009, 49, 1749–1755. [Google Scholar] [CrossRef] [PubMed]
  25. Jacob, S.W.; Herschler, R. Biological Actions of Dimethyl Sulfoxide. Ann. N. Y. Acad. Sci. 1975, 243, 104–109. [Google Scholar]
  26. Javadpour, M.M.; Juban, M.M.; Lo, W.-C.J.; Bishop, S.M.; Alberty, J.B.; Cowell, S.M.; Becker, C.L.; McLaughlin, M.L. De Novo Antimicrobial Peptides with Low Mammalian Cell Toxicity. J. Med. Chem. 1996, 39, 3107–3113. [Google Scholar] [CrossRef] [PubMed]
Figure 1. RGB images before and after the addition of resazurin (0.4 mg/mL). (a) The 1199 strain before the addition of resazurin (0.4 mg/mL); (b) 1199 strain after the addition of resazurin (0.4 mg/mL); (c) 1199B strain before the addition of resazurin (0.4 mg/mL) and (d) 1199B strain after the addition of resazurin (0.4 mg/mL).
Biologics 02 00011 g001aBiologics 02 00011 g001b
Figure 2. Images from the plate with the 1199 strain, before the addition of resazurin (0.4 mg/mL); (a) red, (b) green, (c) blue and (d) image resulting from the convex linear combination. Images from the plate with the 1199 strain, after the addition of resazurin (0.4 mg/mL); the (e) red, (f) green, (g) blue channels and (h) image resulting from the convex linear combination.
Biologics 02 00011 g002aBiologics 02 00011 g002b
Figure 3. (a)—Graph representing the growth inhibition curve (GIC) and the maximum growth of the 1199 strain before the addition of resazurin. (b)—Graph representing the growth inhibition curve (GIC) and the maximum growth of the 1199 strain after the addition of resazurin.
Biologics 02 00011 g003
Figure 4. Graph representing the growth inhibition curve (GIC) and the maximum growth of the 1199B strain before the addition of resazurin.
Biologics 02 00011 g004
Figure 5. Estimated inhibition rate for strains (a) 1199 and (b) 1199B.
Biologics 02 00011 g005
Figure 6. Average growth and standard deviation after 24 h of 1199 and 1199B strains without the interference of pyrogallol.
Biologics 02 00011 g006
Figure 7. Flowchart of the proposed methodology.
Biologics 02 00011 g007
Table 1. The 1199 strain—Gray levels intensity before the addition of resazurin.
Concentration (µg/mL)Gray Levels IntensityIntensity MeanStandard Deviation
5120.30720.29150.27580.27970.27450.28760.28610.0123
2560.55560.46270.43920.42750.44710.51900.47520.0508
1280.53200.47710.47970.46010.47450.45360.47950.0277
640.52290.48760.45620.46930.47450.52160.48870.0279
320.54510.48500.47060.47320.46540.44050.48000.0351
160.53200.47710.45490.48370.47060.44580.47730.0303
80.51370.48100.46540.45230.45620.46540.47230.0226
Control0.53200.50460.50460.48630.49280.50980.50500.0158
Table 2. The 1199 strain—Gray levels intensity after the addition of resazurin.
Concentration (µg/mL)Gray Levels Intensity Intensity MeanStandard Deviation
5120.13460.12030.11900.12810.11900.13200.12550.0070
2560.35560.26270.23270.21180.27190.27450.26820.0493
1280.38300.27060.24440.28760.30850.26540.29320.0490
640.36600.29280.24580.32160.32550.27190.30390.0428
320.32680.29020.27840.29930.36210.32290.31330.0303
160.37250.25880.25880.27970.26010.26010.31000.0452
80.43920.29930.27840.33200.29020.27320.31870.0626
Control0.39870.39220.38040.36340.40780.33200.37910.0277
Table 3. The 1199B strain—Gray levels intensity before the addition of resazurin.
Concentration (µg/mL)Gray Levels Intensity Intensity MeanStandard Deviation
5120.29540.29930.27840.27840.27580.28370.28520.0099
2560.51500.45880.45620.44440.43010.45230.45950.0291
1280.51500.47970.46800.46010.45490.46010.47300.0223
640.52420.48890.46010.46410.46800.45620.47690.0258
320.51500.48500.46800.46270.45620.41570.46710.0329
160.52420.48760.46540.45360.46930.43920.47320.0297
80.52290.49150.45360.44970.44840.44970.46930.0310
Control0.55690.51630.50720.47710.53200.50460.51570.0270
Publisher’s Note: MDPI stays neutral with regard to jurisdictional claims in published maps and institutional affiliations.

