
Robust Porcine GFR Measurement with Radiotracers and Only Late Blood Samples
by
 , , , and
Lars Jødal
1,*,
Juan Ignacio Brignone
2,
Pui-Ki Chan Ladefoged
1,
Lars Lund
2,3,4 and
Trine Borup Andersen
1 1
Department of Nuclear Medicine, Aalborg University Hospital, 9000 Aalborg, Denmark
2
Department of Urology, Aalborg University Hospital, 9000 Aalborg, Denmark
3
Department of Urology, Odense University Hospital, 5000 Odense, Denmark
4
Department of Clinical Research, University of Southern Denmark, 5000 Odense, Denmark
*
Author to whom correspondence should be addressed.
Biologics 2023, 3(4), 296-307; https://0-doi-org.brum.beds.ac.uk/10.3390/biologics3040015
Submission received: 18 July 2023
/
Revised: 18 September 2023
/
Accepted: 22 September 2023
/
Published: 29 September 2023
(This article belongs to the Section Diagnostics)
Abstract
:(1) Pigs are physiologically very relevant as animal models of human physiology. Radiotracer methods for porcine GFR (glomerular filtration rate) determination exist but require full-curve blood sampling or the application of correction formulas, which vary among studies. (2) We used porcine GFR data (40 datapoints from 20 juvenile pigs) for which the GFR was measured as the plasma clearance of [99mTc]Tc-DTPA. The reference clearance (Cl, GFR; range 41–85 mL/min) was measured from the full curve under the data. For simpler determination, an approximate clearance, Cl1, was based on the last five blood samples (acquired 120–240 min post injection). (3) The following formula for the GFR was developed: Cl = 1.27 · (Cl1)0.92. The spread (SD) was within 4% of the reference GFR. A comparison with the literature data showed that our correction formula was robust in pigs of various breeds, sizes up to approximately 200 kg, and GFRs up to approximately 400 mL/min, with a spread of up to 8%. The formula was also applicable for iohexol as the tracer. (4) A formula was developed that allows porcine GFR to be measured using only 4–5 late blood samples. This new formula can be applied across a wide range of swine breeds, animal sizes, and GFR ranges, allowing for robust determination of the GFR in pigs without full-curve blood sampling and without urine collection.
1. Introduction
Determination of the glomerular filtration rate (GFR) is needed in many preclinical studies when testing new surgical procedures or new drugs prior to implementing the treatment in humans. Given their anatomical and physiological similarities to humans, pigs are a very good model for validating new human treatments [1,2,3]. For urological surgical procedures or for the assessment of drugs that may positively or negatively affect renal function, it is important to have a reliable measurement of renal function in pigs.
The method of choice for quantitative GFR measurement is an injection of a small quantity of radiotracer that is filtered by the kidneys, combined with blood sampling. The faster the radiotracer disappears from the blood, the higher the GFR is. More specifically, for a radiotracer for which the plasma clearance (Cl) can be considered equal to the GFR, the rate of disappearance is determined from blood samples. This avoids the need for urine measurements. Instead, blood samples are taken to provide data on the plasma concentration curve, i.e., the concentration of the radiotracer in the blood plasma as a function of time.
It is, however, cumbersome to collect enough blood samples to fully describe the plasma concentration curve. In humans, well-established methods exist that involve measuring only a few, late blood samples and then correcting for this simplification [4,5]. A limited number of studies described similar approaches in pigs [2,6,7,8]. However, these studies were based on differing pig sizes and GFR ranges, and each research group developed their own correction formula. The latter would not be a problem if the various correction formulas agreed, but, as further discussed in Section 4, this is only the case when the animal groups are alike. As different studies use pigs of different breeds, sizes, ages (juvenile or full-grown), and GFR ranges, the results can considerably differ among the correction formulas, especially when formulas are used outside the ranges for which they were originally developed.
The present study used in-house GFR measurements of pigs to develop a new correction formula and evaluated the new formula based on the data and correction formulas from the above-cited literature. The aim was to develop and validate a simple and robust correction formula that can be broadly applied across pig populations and GFR ranges.
2. Material and Methods
2.1. Animals
The present study re-used data from Brignone et al. [9], in which GFR was measured as the plasma clearance of technetium-99m-labelled diethylenetriaminepentaacetic acid ([99mTc]Tc-DTPA) in 20 female juvenile Danish Landrace pigs. For each animal, the measurement was performed twice, one week before and two weeks after a laparoscopic partial nephrectomy. During the partial nephrectomy, the upper right kidney pole was excised, corresponding to removing approximately one-third of the entire kidney. While this would naturally reduce renal function, the growth of the juvenile pigs during three weeks could, in itself, increase renal function. Overall, the two GFR measurements took place at different times and in different settings, with potentially changed GFR from the first to the second measurement. The pigs weighed 26.0–38.0 kg at the time of the first measurement and 31.4–43.8 kg at the time of the second measurement.
All procedures were performed under general anaesthesia. The study was approved by the Animal Experiments Inspectorate of the Dept. of Veterinary and Food Administration (approval number 2018-15-0201-01576).
2.2. Reference GFR: Plasma Clearance Based on Full-Curve Data (Clref)
As an overall principle for using tracers for GFR determination, a high GFR value is seen as a quick clearance of the tracer from the blood plasma. Radiotracers have the advantage that radioactivity is easy to measure, so only minute quantities of radiotracer are needed. A short description of the principles of plasma clearance determination is given in Appendix A.
Consistent with guidelines from the British Nuclear Medicine Society (BNMS), the plasma clearance (Cl) of [99mTc]Tc-DTPA was considered equal to GFR without any conversion [10,11].
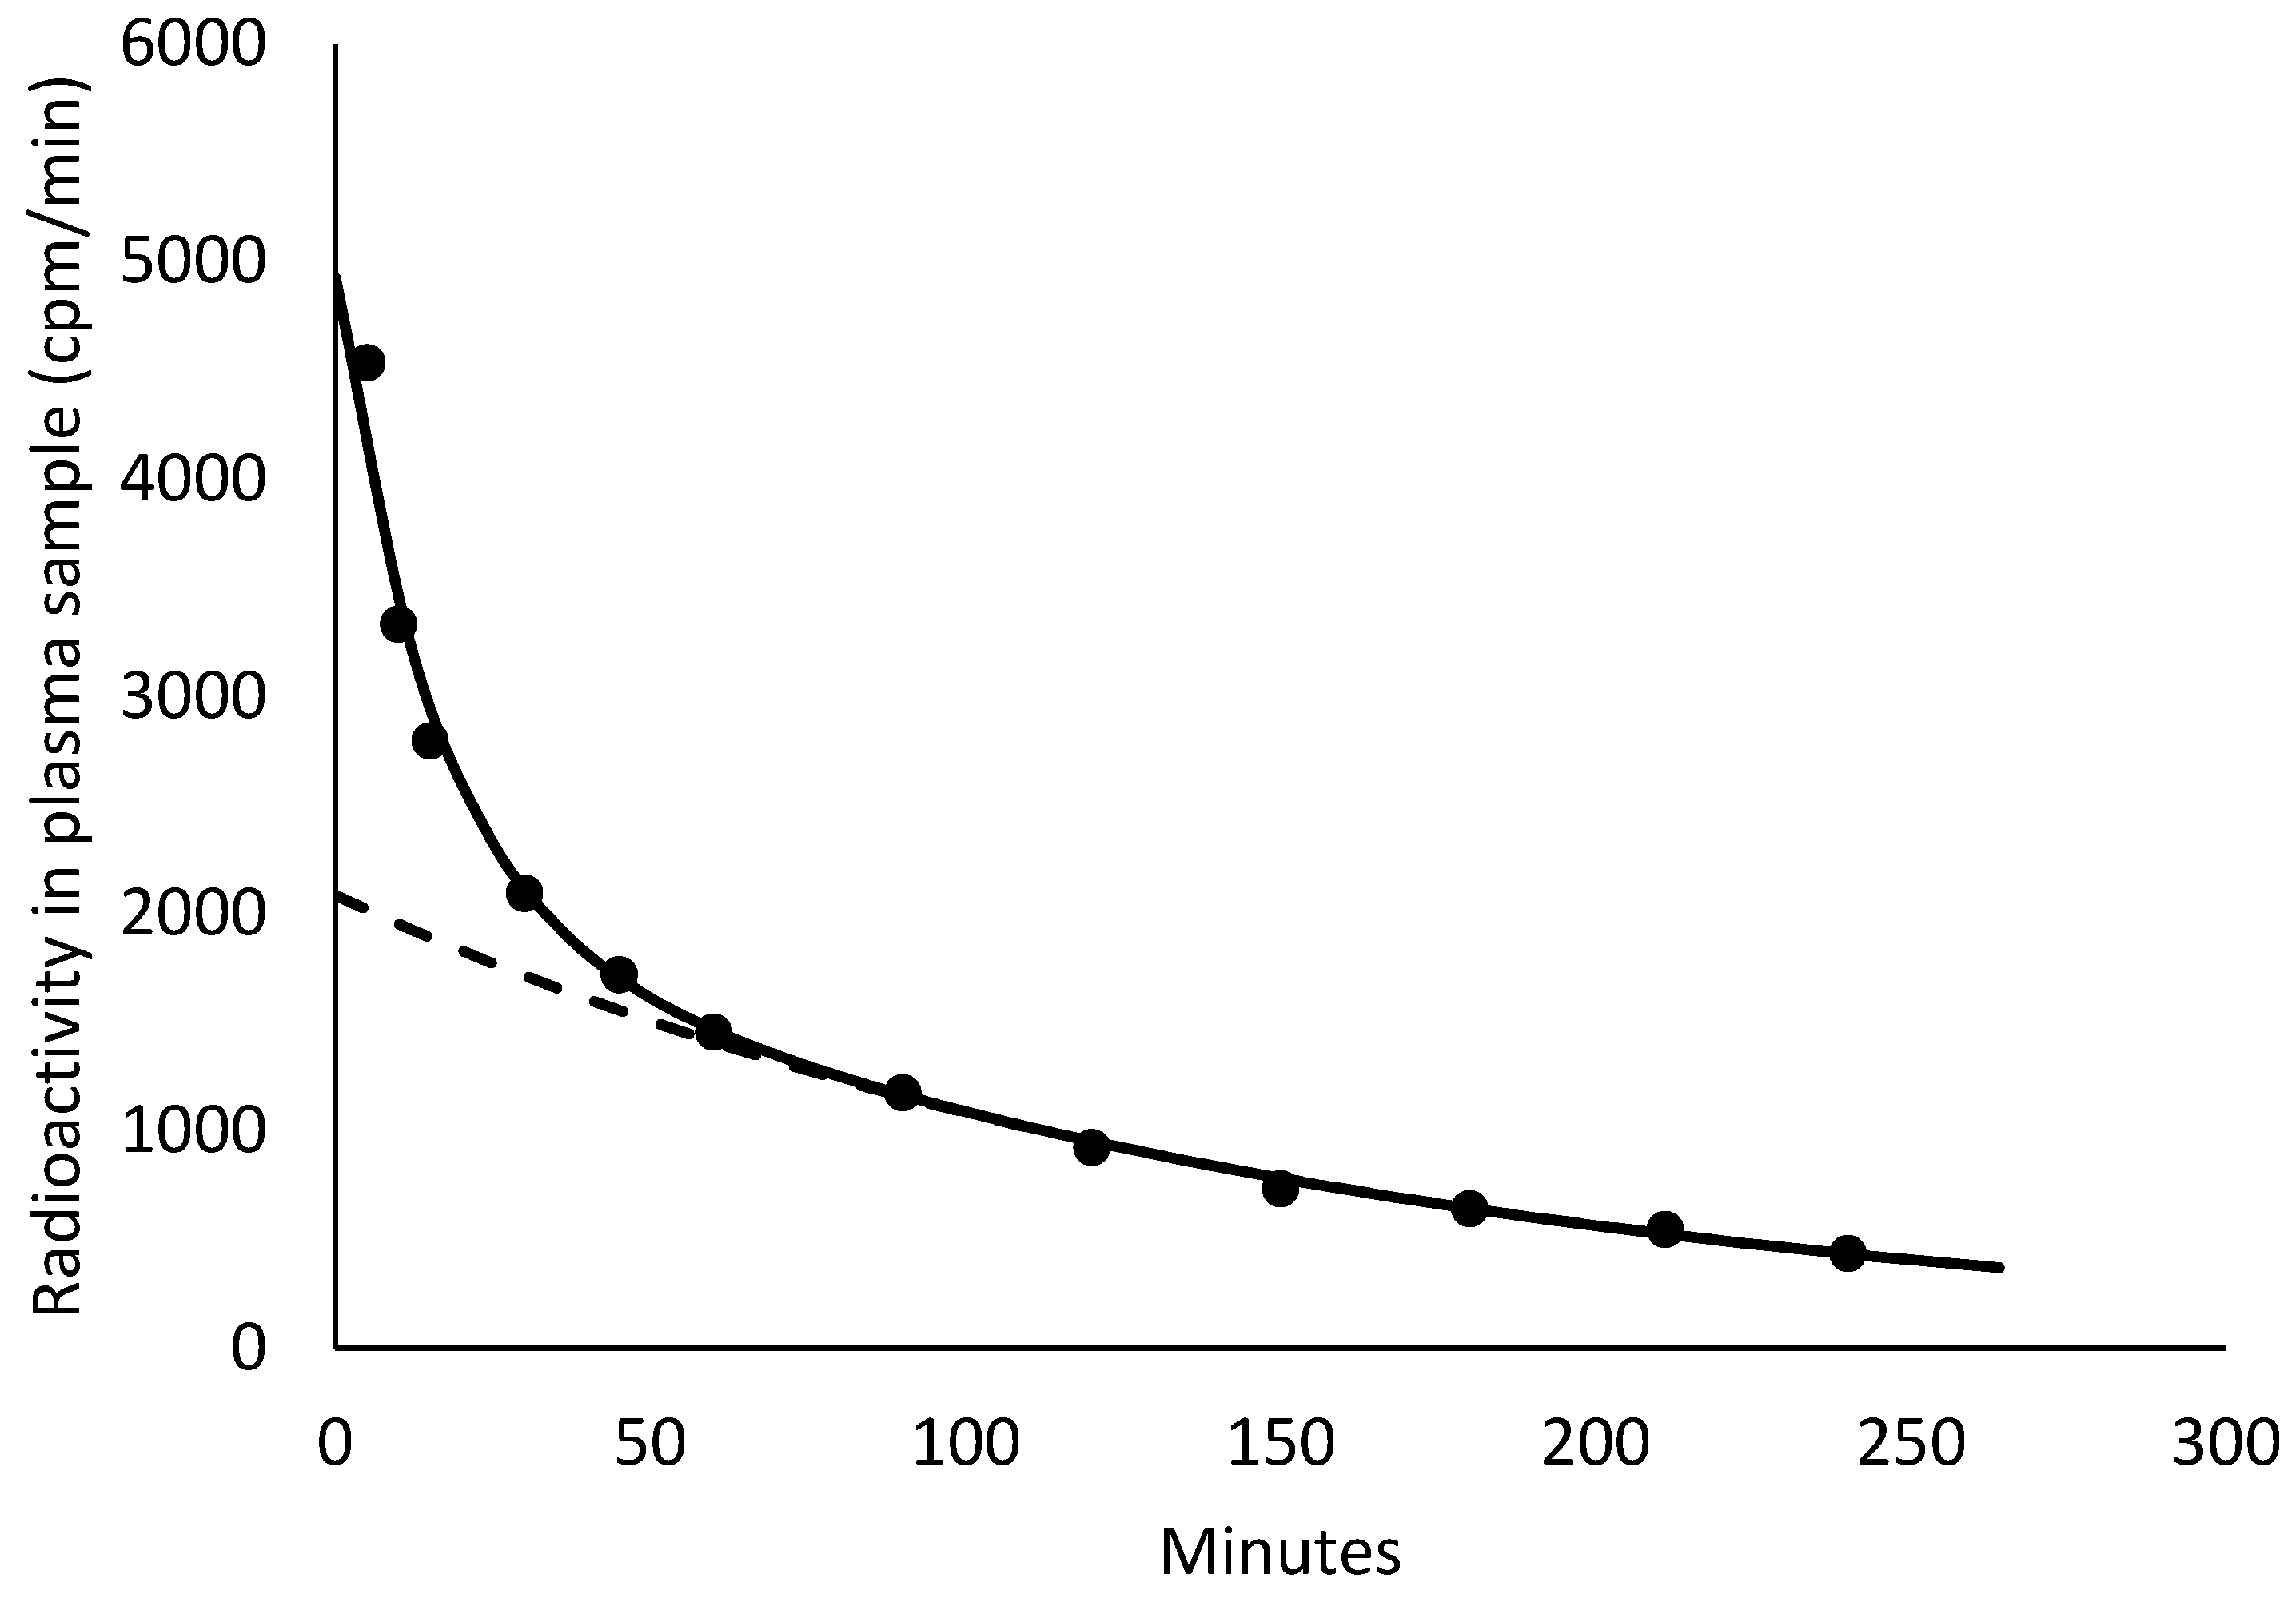
To measure GFR, the pig was administered 10 MBq of [99mTc]Tc-DTPA by intravenous injection. Blood samples were taken 5, 10, 15, 30, 45, 60, 90, 120, 150, 180, 210, and 240 min after the injection. The samples were centrifuged for 15 min at 2200× g, after which 2 mL plasma samples were drawn and measured to 10,000 counts in a Wizard2 2480 gamma counter (PerkinElmer, Waltham, MA, USA). The area under the curve (AUC) was determined by bi-exponential fitting. A sample fit is shown in Figure 1.
Reference clearance, Clref, was calculated as the injected activity divided by AUC (Formula (A1) in the Appendix A); overall, if clearance (Cl, GFR) is high then the curve decays quickly (small AUC), while a slowly decaying curve (large AUC) reflects a low clearance.
2.3. One-Pool Approximation Cl1 Based on Late-Sample Data
A first approximation, Cl1, was calculated based on the final, mono-exponential curve (dashed curve in Figure 1) using Formula (A4). This curve can be calculated based on only the late blood samples. As detailed in Appendix A, the approximation Cl1, sometimes called one-pool clearance, corresponds to replacing the full-curve AUC with AUCslow, the area under the dashed curve in Figure 1. As AUCslow is a smaller area than the full-curve AUC, one-pool clearance Cl1 overestimates the actual clearance Cl. Thus, Cl1 must be corrected to give Cl.
Values of Cl1 were determined from the last 5 blood samples, corresponding to the time interval 120–240 min post-injection (p.i.). To determine if a smaller time window could be used, Cl1 values were also calculated based on the last 4 (150–240 min p.i.) and the last 3 (180–240 min p.i.) blood samples.
2.4. Porcine GFR Correction Formula
This correction is simple, but it does not take into account the nonlinearity observed in other pig studies [2,6,7] and in correction formulas for humans [4,5].
Other studies used a quadratic correction of the mathematical form
with a negative value of a, possibly without the constant term, c (corresponding to c = 0). Such quadratic forms mimic the classical Brøchner-Mortensen correction [4] for human GFR measurement. However, a quadratic form mathematically represents a parabola with a maximal value, for which reason the correction necessarily begins to fail at some sufficiently high GFR; accordingly, Brøchner-Mortensen later presented an updated formula [5] to replace their classical formula [4] for human GFR measurement.
The porcine GFR correction formula presented here has the mathematical form of a power function:
i.e.,
This form correctly gives Clcorr = 0 for Cl1 = 0, and, unlike a quadratic correction, it does not impose a maximal value on Clcorr.
The values a and b were determined by standard linear fit on log–log data.
3. Results
With each of the 20 pigs measured at two separate time points (before and after the operation), 40 GFR measurements were available. Over the 40 data points, the weights of the pigs were 26–44 kg, and the measured Clref range was 41–85 mL/min. The individual data points are given in Supplementary Table S1.
The data are plotted in Figure 2 and as a log–log plot in Supplementary Figure S1. From the fit, the coefficients ± standard error were
a = 0.920 ± 0.029
b = 1.27 ± 0.17
Thus, our correction formula became
with both Clcorr and Cl1 in mL/min.
4. Discussion
This study demonstrated that in the investigated pigs, plasma clearance (and, thereby, the GFR) determination with a radiotracer could be performed using only the last (slowest) part of the curve. The radiotracer used was [99mTc]Tc-DTPA.
In summary, a mono-exponential function was fitted to the late-curve data: Formula (A2).
From this fit to the late-curve data and the quantity, Q0, of the injected activity, a first (one-pool) approximation, Cl1, for the clearance was calculated: Formula (A4).
This approximate value would overestimate the true clearance, Cl, and was, therefore, corrected to the final value: Formula (1).
4.1. Choice of Tracer
For both human and animal studies, the typical choice of radiotracer was [51Cr]Cr-EDTA, but this has, in recent years, been taken over by [99mTc]Tc-DTPA; these two tracers were shown to give GFR measurements that, for clinical purposes, can be considered equal [12,13,14]. Likewise, two pig studies by Frennby et al. [6,15] found that [51Cr]Cr-EDTA and iohexol were interchangeable.
While [51Cr]Cr-EDTA is no longer available on the market, the choice between iohexol or [99mTc]Tc-DTPA in practice, therefore, depends upon whether nuclear medicine procedures are available or not. Radiotracers can be measured in extremely small concentrations (10 MBq of [99mTc]Tc-DTPA corresponds to approximately 5 × 10⁻¹³ mol = 0.5 pmol of the radiotracer molecule), and the radiation dose from 10 MBq [99mTc]Tc-DTPA is minute (<0.1 mSv in an adult patient, slightly higher in small children). For these reasons, [99mTc]Tc-DTPA is widely used for GFR measurements in humans. Iohexol does not involve the handling of radioactivity but requires macroscopic amounts (grams) to be injected for the concentrations to be precisely measurable.
4.2. Previous Studies
In Table 2, the data material from the present study is compared with other identified studies that measured the GFR in pigs and presented a formula for correcting the clearance based on late samples (in our notation, the correction of Cl1 to Cl). A summary of each study is given below.
4.2.1. Frennby Studies
Frennby et al. [15] measured the GFR in n = 19 Swedish Landrace pigs weighing 21–27 kg with normal renal function. In a follow-up study [6], the same group measured the GFR in n = 21 pigs weighing 21–26 kg after reduction in the renal function by right-side nephrectomy. The first study did not provide information on the animals’ sexes, while the second study stated that they were of both sexes. The GFR was measured as the clearance of both iohexol and the radiotracer [51Cr]Cr-EDTA, with an excellent correlation between the two tracers. For the simplified determinations, four blood samples 180–360 min p.i. were used, and the authors reported the weight-scaled results in mL/min/10 kg. With our notation, their correction formula was
Measured as [51Cr]Cr-EDTA plasma clearance based on the full curve, the GFR was in the range of 16.5–26.3 mL/min/10 kg in the pigs with normal renal function. For the nephrectomised pigs, the range was 5.3–11.3 mL/min/10 kg.
4.2.2. Palnæs Hansen Study
Palnæs Hansen et al. [8] measured the GFR in Danish Landrace–Yorkshire female pigs weighing 30–40 kg. The authors first used constant infusion techniques with urine collection to compare inulin with the radiotracer [51Cr]Cr-EDTA. They found that the plasma clearance of [51Cr]Cr-EDTA was indistinguishable from the renal clearance of the GFR, i.e., Clplasma,EDTA was indistinguishable from the classical gold standard of GFR measurement. The authors then measured the clearance of [51Cr]Cr-EDTA with the single-injection technique (as in the present study) in n = 12 pigs and compared it with the clearance from late samples (“slope clearance”, Cl1). Blood sampling was up to 240 min p.i. It was found that the approximation Cl1 could be corrected by a factor:
Clcorr,Palnæs = 0.75 · Cl1
The range of the GFR was not specified (only mean and SD were stated), but, based on the authors’ Figure 4 (in Ref. [8]), the range was approximately 45–85 mL/min.
4.2.3. Luis-Lima Study
Luis-Lima et al. [2] measured the GFR in n = 16 female adult Iberian pigs weighing 101–212 kg, using iohexol as the tracer. The GFR range was 112–392 mL/min. For the simplified GFR determinations, six blood samples covering the time interval 120–420 min p.i. were used. Their correction formula was
This formula was based on eight of the pigs and was verified in the other eight pigs.
4.2.4. Van Gelder Study
Van Gelder et al. [7] measured the GFR in n = 5 Topigs Norsvin pigs (as well as in three goats), using iohexol as the tracer. The pigs had weights of 34–80 kg, and the GFR measurements were performed both before and after kidney failure was induced in the animals. The animals’ sexes were not reported. In total, 23 porcine GFR measurements were performed (10 measurements in four healthy pigs and 13 measurements in five pigs after kidney failure induction). A common correction formula for goats and pigs was developed:
(The study also scaled the GFR to the body surface area, BSA, calculated from the body weight, but the scaling was applied after the correction.)
The measured GFR values were not tabulated, but, reading from the authors’ Figure 3 (in Ref. [7]), the porcine GFR range was approximately 17–44 mL/min.
4.3. Comparison of Corrections
Luis-Lima et al. [2] tabulated the individual data points (pig weight, Cl, and Cl1), allowing for a direct comparison with their data. As shown in Figure 3, our correction (2) can be extrapolated to cover their data from much larger, adult pigs without a new fit. (Note for the curious reader: a fit to the combined data material (ours + Luis-Lima) gave the coefficients a = 0.925 ± 0.010 and b = 1.241 ± 0.058, i.e., essentially the same coefficients as those from our data alone, only with narrower spreads.) As seen in the figure, the Luis-Lima correction (4) fails if it is extrapolated downwards to cover the range of mL/min relevant for our data.
Figure 3 also presents the van Gelder correction (5). The van Gelder study [7] covered only the GFR up to ~44 mL/min (see Table 2). For a higher GFR, including most of the range of our data, the van Gelder correction fails due to the parabolic nature of the correction. For the GFR below 40 mL/min (i.e., below the range covered by our own data), the good agreement between the van Gelder correction and our correction (1) provides an indirect validation of our correction in the low GFR range.
The Palnæs Hansen correction (3) was omitted from Figure 3 to avoid cluttering an already full plot. It did not fit very well with our data, as seen in Figure S1.
The Frennby correction (2) was developed on weight-scaled GFR data (mL/min/10 kg) and, therefore, cannot be shown in the same plot as corrections that must be applied to unscaled GFR data (mL/min)—at least not without assumptions, such as a fixed weight or a presumed connection between the weight and the GFR. Instead, Figure 4 presents the Frennby correction along with the weight-scaled plots of the Luis-Lima dataset and our own dataset. Figure 4 shows that these two datasets fall in somewhat different groups after weight scaling; thus, no single curve can fit both groups well in this scaling. The Frennby correction falls somewhere between the two groups, although nearer to our data.
In summary, the Luis-Lima correction and the van Gelder correction failed for GFRs outside the original ranges (Figure 3). Weight scaling, as applied by Frennby et al. [6,15], does not appear to allow for a common correction for all data (Figure 4). In contrast, our own correction (1) appears to be generally applicable.
Although our correction formula was developed only on data from juvenile pigs weighing 26–44 kg with a GFR in the range 45–85 mL/min, it could be applied to the data from Luis-Lima et al. [2] on adult pigs weighing up to approximately 200 kg and with a GFR of up to approximately 400 mL/min. For a low-range GFR, our correction agreed with the correction by van Gelder et al. [7], which was developed on pigs with a GFR < 45 mL/min.
It can, furthermore, be noted that (as expected) it did not pose problems to mix data from the GFR determined with iohexol, [99mTc]Tc-DTPA, or [51Cr]Cr-EDTA; the developed correction was common for these tracers.
4.4. Time Range for Late Samples
Whether the single exponential was determined from 120–240 min (five blood samples) or 120–240 min (four blood samples), the difference from the reference GFR (Clref) was very low and had a spread (SD) of less than 4% (Table 1). If fewer data were used (180–240 min, three blood samples), the spread was larger, and a considerable number of outliers was observed (Figure 2).
4.5. Strengths and Limitations
A strength of the present study was that it used an animal model that represents human anatomy and physiology better than rodents and presented a method that allows for GFR measurement in pigs in a way similar to the methods used in human patients.
Our study was limited to 40 measurements in 20 juvenile pigs covering the GFR in the range of 41–85 mL/min. However, the developed correction formula was validated on a much higher GFR by the inclusion of data from Luis-Lima et al. [2], which strengthens the study by showing that the correction was also applicable to their data on adult pigs of a different breed, with the GFR in the range of 101–392 mL/min.
Another limitation was that we did not include pigs with a severely low GFR. However, in the very low range, the plasma tracer concentration curve slowly falls; thus, the area under the plasma curve (AUC) is dominated by the final part of the curve. Therefore, for a low GFR, only a small correction is needed [5], and our formula indeed gives a very small correction in mL/min for a low GFR (Figure 2). Furthermore, our correction had low-range agreement with the correction by van Gelder et al. [7], covering the GFR in a range below ours (Table 2 and Figure 3). As in human patients, the determination of a very low GFR is challenged by the fact that if the GFR is low then the plasma concentration only slowly falls; however, that challenge is related to the basal determination of the curve slope, not to the correction applied afterwards.
It can be considered a limitation that all individual data points are from female animals, and only one study specifically stated that both sexes were represented (Table 2). However, while the normal GFR level may depend on sex, there is little reason to suspect a sex difference in the correction from the one-pool clearance, Cl1, to the actual clearance, Cl. For comparison, widely used human corrections [4,5] are independent of sex.
4.6. Perspectives
GFR determination is used in many drug studies as well as renal studies. Physiologically, pigs are very relevant research animals for such studies. A tracer method that requires a single injection of the tracer, a limited number of blood samples, and no urine collection can greatly simplify GFR determination in pigs, thereby paving the way for more focused studies, replacing studies applying less relevant animals. This may eventually result in a reduction in the number of research animals needed.
The developed correction Formula (1) allows for such a simple GFR determination and was found to be robust over a wide range of pig sizes, breeds, and GFR ranges. The correction formula was validated on data based on the radiotracer [99mTc]Tc-DTPA (and, indirectly, [51Cr]Cr-EDTA) as well as the nonradioactive tracer iohexol.
5. Conclusions
Using the plasma clearance of [99mTc]Tc-DTPA as measure of the glomerular filtration rate (GFR), we developed a correction Formula (1) that allows for the determination of the GFR in pigs based on only four or five late blood samples taken 150–240 min or 120–240 min after the injection of a radiotracer. Within our own data material of juvenile pigs with a GFR of 41–85 mL/min, the results had a spread (SD) of approximately 4% around the reference value. In comparison to the data from the literature, we extended the validated range to adult pigs with a GFR of up to 400 mL/min, with a spread of approximately 8% around the reference value. Furthermore, we stated reasons why the correction is applicable for a GFR lower than 40 mL/min.
Thus, we consider the developed correction formula to be robust for GFR determination at all values up to 400 mL/min and across pigs of various sizes and various breeds. The formula is applicable for both [99mTc]Tc-DTPA and iohexol (and for [51Cr]Cr-EDTA, if available) as the chosen tracer.
Supplementary Materials
The following supporting information can be downloaded at https://0-www-mdpi-com.brum.beds.ac.uk/article/10.3390/biologics3040015/s1. Figure S1: Log–log plot of clearance data. Table S1: Weight, full-curve clearance (Cl), and one-pool approximation (Cl1) for the pigs in the present study.
Author Contributions
Conceptualisation, L.J. and T.B.A.; methodology: L.J., J.I.B. and P.-K.C.L.; resources, L.L.; data curation, L.J. and J.I.B.; writing—original draft, L.J.; writing—review and editing: L.J., J.I.B., P.-K.C.L., L.L. and T.B.A.; funding acquisition, L.L. All authors have read and agreed to the published version of the manuscript.
Funding
The study was supported by the Region of Southern Denmark/Region Zealand, the Karen Elise Jensen Foundation, the Novo Nordisk Foundation, and the Danish National Health Science Research Foundation.
Institutional Review Board Statement
The use of animals for the study was approved by the Animal Experiments Inspectorate under the Dept. of Veterinary and Food Administration (approval number 2018-15-0201-01576).
Informed Consent Statement
Not applicable.
Data Availability Statement
Detailed data are found in the Supplementary Materials. Raw data are available upon reasonable request.
Conflicts of Interest
The presented data are the result of independent research, and the authors have no potential conflicts of interest to disclose.
Appendix A. Theory of Plasma Clearance Measurements
Renal function (clearance, GFR) can be measured as the plasma clearance of a tracer that is only renally excreted. The tracer is injected into a blood vessel and is initially present only in the blood plasma. However, it quickly begins to dissipate into the larger volume of fluid outside the body cells:
extracellular volume = blood plasma volume + extravascular fluid volume
During the early phase, the tracer concentration in the blood plasma, therefore, decreases rather quickly. After an hour or so, a steady state is achieved with equal concentrations in the blood plasma and the extravascular fluid volume. In this late phase, the tracer concentration changes more slowly, now only decreasing due to the kidneys’ filtration of the blood plasma. This development of the tracer concentration in the blood plasma is illustrated in Figure 1.
Mathematically, it can be shown that the correct way to calculate the clearance is to divide the quantity of the injected tracer by the total area under the plasma concentration curve. Intuitively, the exchange with the extravascular volume (leaving and returning) changes the shape of the plasma concentration curve but does not influence the total area under the curve. Clearance, in contrast, removes the tracer that does not return and, therefore, determines the total area under the curve (the higher the clearance is, the smaller the area is).
Thus, the plasma clearance, Cl, of the tracer in mL/min can be calculated as
where
Q0 = quantity of injected tracer
AUC = area under the plasma concentration curve
The unit of Q0 may be the Bq of the radioactivity, or it may be the counts per minute (cpm) of a sample in a gamma counter. If the radioactivity concentration is measured in units of Bq/mL, then the unit for the AUC is min·Bq/mL. See, e.g., the classical study by Brøchner-Mortensen [4] for GFR determination in humans or a study by Frennby et al. [15] for a description of this principle for GFR determination in pigs.
The above calculation assumes that AUC is calculated from time 0 (injection of the tracer) to infinity. During this unlimited timespan, all the injected tracer is filtrated and excreted, i.e., the total amount of the tracer excreted in the urine equals the amount of the tracer that was injected, Q0. Therefore, Formula (A1) can be used without urine sampling, while blood sampling is needed to determine the AUC.
The calculation of the full AUC requires knowledge of the full curve. However, an approximate value for the AUCslow can be calculated based on only the late, more slowly falling part of the curve. The late, slow part of the plasma concentration curve behaves as a mono-exponential function:
The area under this mono-exponential curve can be mathematically calculated as
from which a first, too large, approximation for the plasma clearance can be calculated:
The Cl1 approximation is sometimes called one-pool clearance: the late, single exponential reflects the situation where the total extracellular volume behaves as a single pool of the tracer, reflected by a single exponential.
As the area of the AUCslow is smaller than the full area of the AUC (Figure 1), the one-pool approximation, Cl1, overestimates the actual clearance, Cl.
References
- Sachs, D.H. The Pig as a Potential Xenograft Donor. Vet. Immunol. Immunopathol. 1994, 43, 185–191. [Google Scholar] [CrossRef] [PubMed]
- Luis-Lima, S.; García-Contreras, C.; Vázquez-Gómez, M.; Astiz, S.; Carrara, F.; Gaspari, F.; Negrín-Mena, N.; Jiménez-Sosa, A.; Jiménez-Hernández, H.; González-Bulnes, A.; et al. A Simple Method to Measure Renal Function in Swine by the Plasma Clearance of Iohexol. Int. J. Mol. Sci. 2018, 19, 232. [Google Scholar] [CrossRef] [PubMed]
- Chade, A.R.; Williams, M.L.; Engel, J.; Guise, E.; Harvey, T.W. A Translational Model of Chronic Kidney Disease in Swine. Am. J. Physiol. Ren. Physiol. 2018, 315, F364–F373. [Google Scholar] [CrossRef] [PubMed]
- Brøchner-Mortensen, J. A Simple Method for the Determination of Glomerular Filtration Rate. Scand. J. Clin. Lab. Investig. 1972, 30, 271–274. [Google Scholar] [CrossRef] [PubMed]
- Jødal, L.; Brøchner-Mortensen, J. Reassessment of a Classical Single Injection 51Cr-EDTA Clearance Method for Determination of Renal Function in Children and Adults. Part I: Analytically Correct Relationship between Total and One-pool Clearance. Scand. J. Clin. Lab. Investig. 2009, 69, 305–313. [Google Scholar] [CrossRef] [PubMed]
- Frennby, B.; Sterner, G.; Almén, T.; Chai, C.-M.; Jönsson, B.A.; Mansson, S. Clearance of Iohexol, 51Cr-EDTA and Endogenous Creatinine for Determination of Glomerular Filtration Rate in Pigs with Reduced Renal Function: A Comparison between Different Clearance Techniques. Scand. J. Clin. Lab. Investig. 1997, 57, 241–252. [Google Scholar] [CrossRef] [PubMed]
- van Gelder, M.K.; Stevens, J.; Pieters, T.T.; Vaessen, K.R.D.; Joles, J.A.; Verhaar, M.C.; Gerritsen, K.G.F. Simplified Iohexol-Based Method for Measurement of Glomerular Filtration Rate in Goats and Pigs. Biology 2021, 10, 461. [Google Scholar] [CrossRef] [PubMed]
- Palnæs Hansen, C.; Bie, P.; Stadil, F. Assessment of Renal Function by 51Cr-EDTA and Endogenous Creatinine Clearances in the Pig. Acta Physiol. Scand 1997, 161, 253–260. [Google Scholar] [CrossRef] [PubMed]
- Brignone, J.; Jensen, M.; Jensen, B.L.; Assersen, K.B.; Goetze, J.P.; Jødal, L.; Andersen, T.B.; Magnusdottir, S.O.; Kloster, B.; Jønler, M.; et al. Protective Effect of Sacubitril/Valsartan (Entresto) on Kidney Function and Filtration Barrier Injury in a Porcine Model of Partial Nephrectomy. Nephrol. Dial. Transplant. 2023, 38, 80–92. [Google Scholar] [CrossRef] [PubMed]
- Fleming, J.S.; Zivanovic, M.A.; Blake, G.M.; Burniston, M.; Cosgriff, P.S. Guidelines for the Measurement of Glomerular Filtration Rate Using Plasma Sampling. Nucl. Med. Commun. 2004, 25, 759–769. [Google Scholar] [CrossRef] [PubMed]
- Burniston, M. Clinical Guideline for the Measurement of Glomerular Filtration Rate (GFR) Using Plasma Sampling—Report 2018; British Nuclear Medicine Society: London, UK, 2018; p. 23. [Google Scholar]
- Andersen, T.B.; Jødal, L.; Nielsen, N.S.; Petersen, L.J. Comparison of Simultaneous Plasma Clearance of 99mTc-DTPA and 51Cr-EDTA: Can One Tracer Replace the Other? Scand. J. Clin. Lab. Investig. 2019, 79, 463–467. [Google Scholar] [CrossRef] [PubMed]
- Rehling, M.; Møller, M.L.; Thamdrup, B.; Lund, J.O.; Trap-Jensen, J. Simultaneous Measurement of Renal Clearance and Plasma Clearance of 99mTc-Labelled Diethylenetriaminepenta-Acetate, 51Cr-Labelled Ethylenediaminetetra-Acetate and Inulin in Man. Clin. Sci. 1984, 66, 613–619. [Google Scholar] [CrossRef] [PubMed]
- Simonsen, J.A.; Thilsing-Hansen, K.; Høilund-Carlsen, P.F.; Gerke, O.; Andersen, T.L. Glomerular Filtration Rate: Comparison of Simultaneous Plasma Clearance of 99mTc-DTPA and 51Cr-EDTA Revisited. Scand. J. Clin. Lab. Investig. 2020, 80, 408–411. [Google Scholar] [CrossRef] [PubMed]
- Frennby, B.; Sterner, G.; Almén, T.; Chai, C.-M.; Anders Jönsson, B.; Månsson, S. Clearance of Iohexol, Chromium-51-Ethylenediaminetetraacetic Acid, and Creatinine for Determining the Glomerular Filtration Rate in Pigs with Normal Renal Function: Comparison of Different Clearance Techniques. Acad. Radiol. 1996, 3, 651–659. [Google Scholar] [CrossRef] [PubMed]
Figure 1.
Radiotracer concentration in plasma samples as a function of time. The full curve is a bi-exponential fit to all data, and the dashed curve is the single exponential fitted to the late part of the curve.
Figure 1.
Radiotracer concentration in plasma samples as a function of time. The full curve is a bi-exponential fit to all data, and the dashed curve is the single exponential fitted to the late part of the curve.

Figure 2.
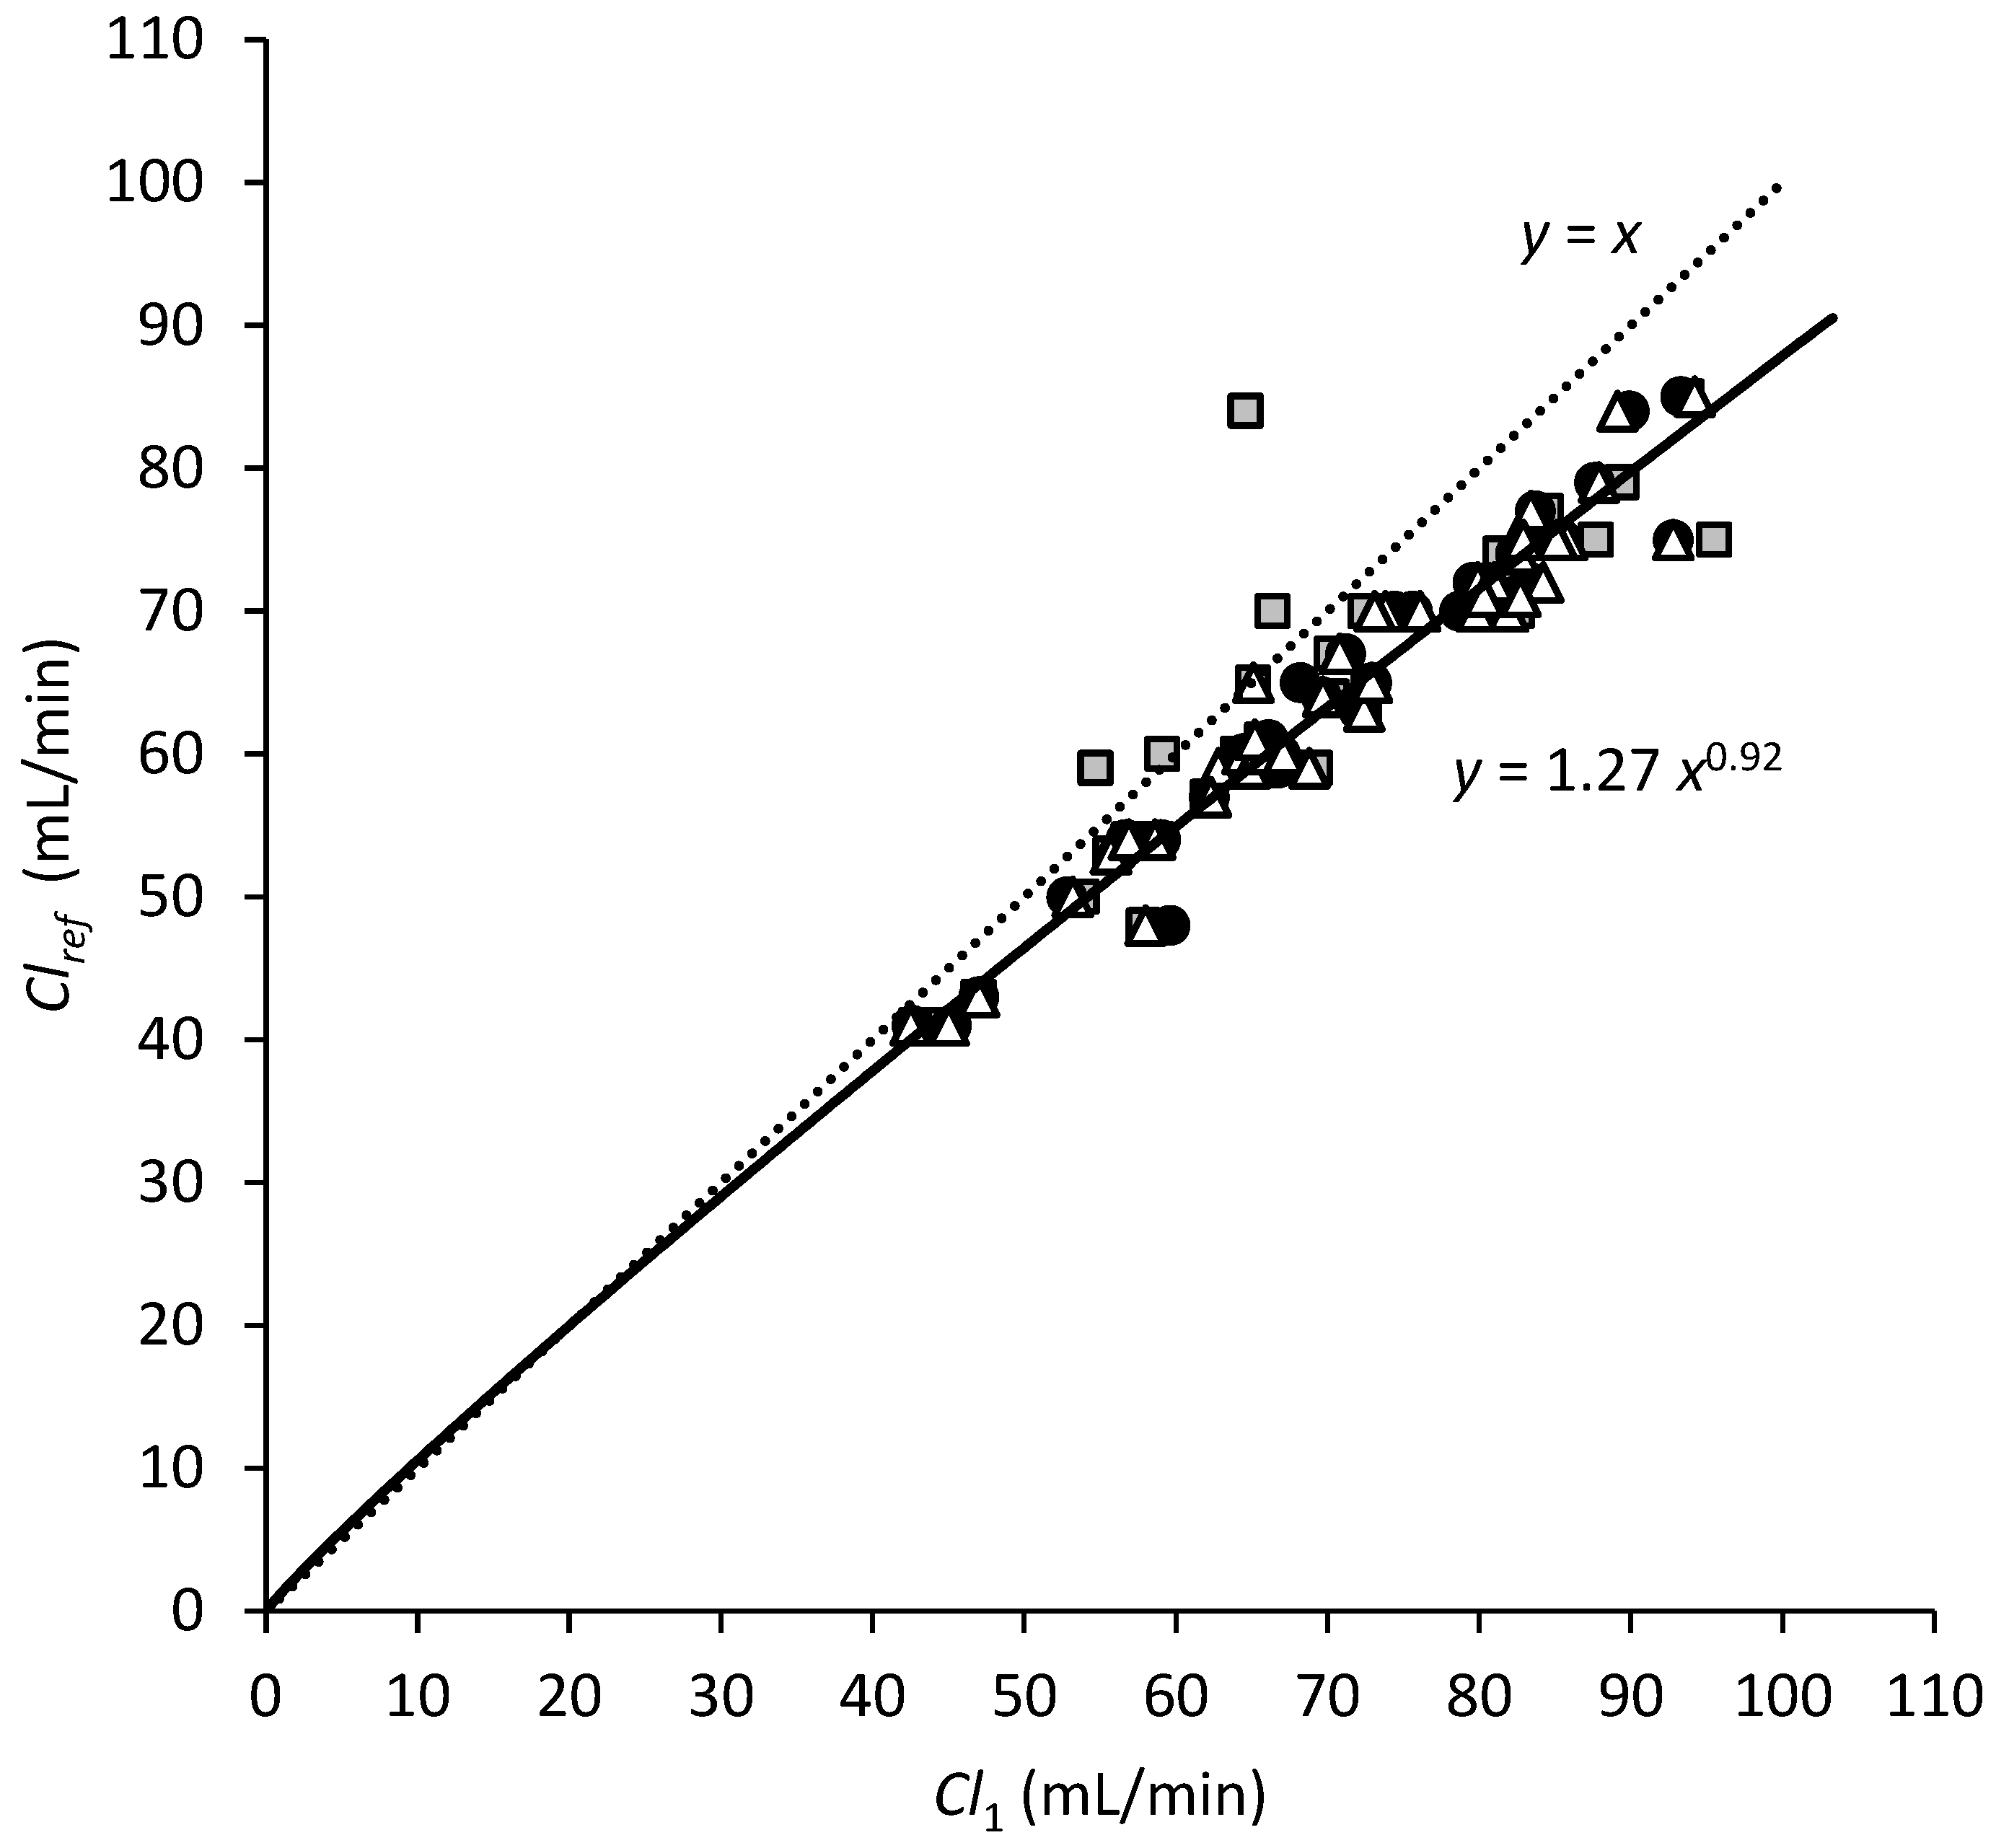
One-pool approximation, Cl1, and reference clearance data, Clref. The dotted line, y = x, represents no correction. The full curve, y = 1.27 x0.92, is a fit to the data points, with Cl1 based on the last 5 samples (black circles). For comparison, data points based on only 4 samples (white triangles) or 3 samples (grey squares) are also plotted.
Figure 2.
One-pool approximation, Cl1, and reference clearance data, Clref. The dotted line, y = x, represents no correction. The full curve, y = 1.27 x0.92, is a fit to the data points, with Cl1 based on the last 5 samples (black circles). For comparison, data points based on only 4 samples (white triangles) or 3 samples (grey squares) are also plotted.

Figure 3.
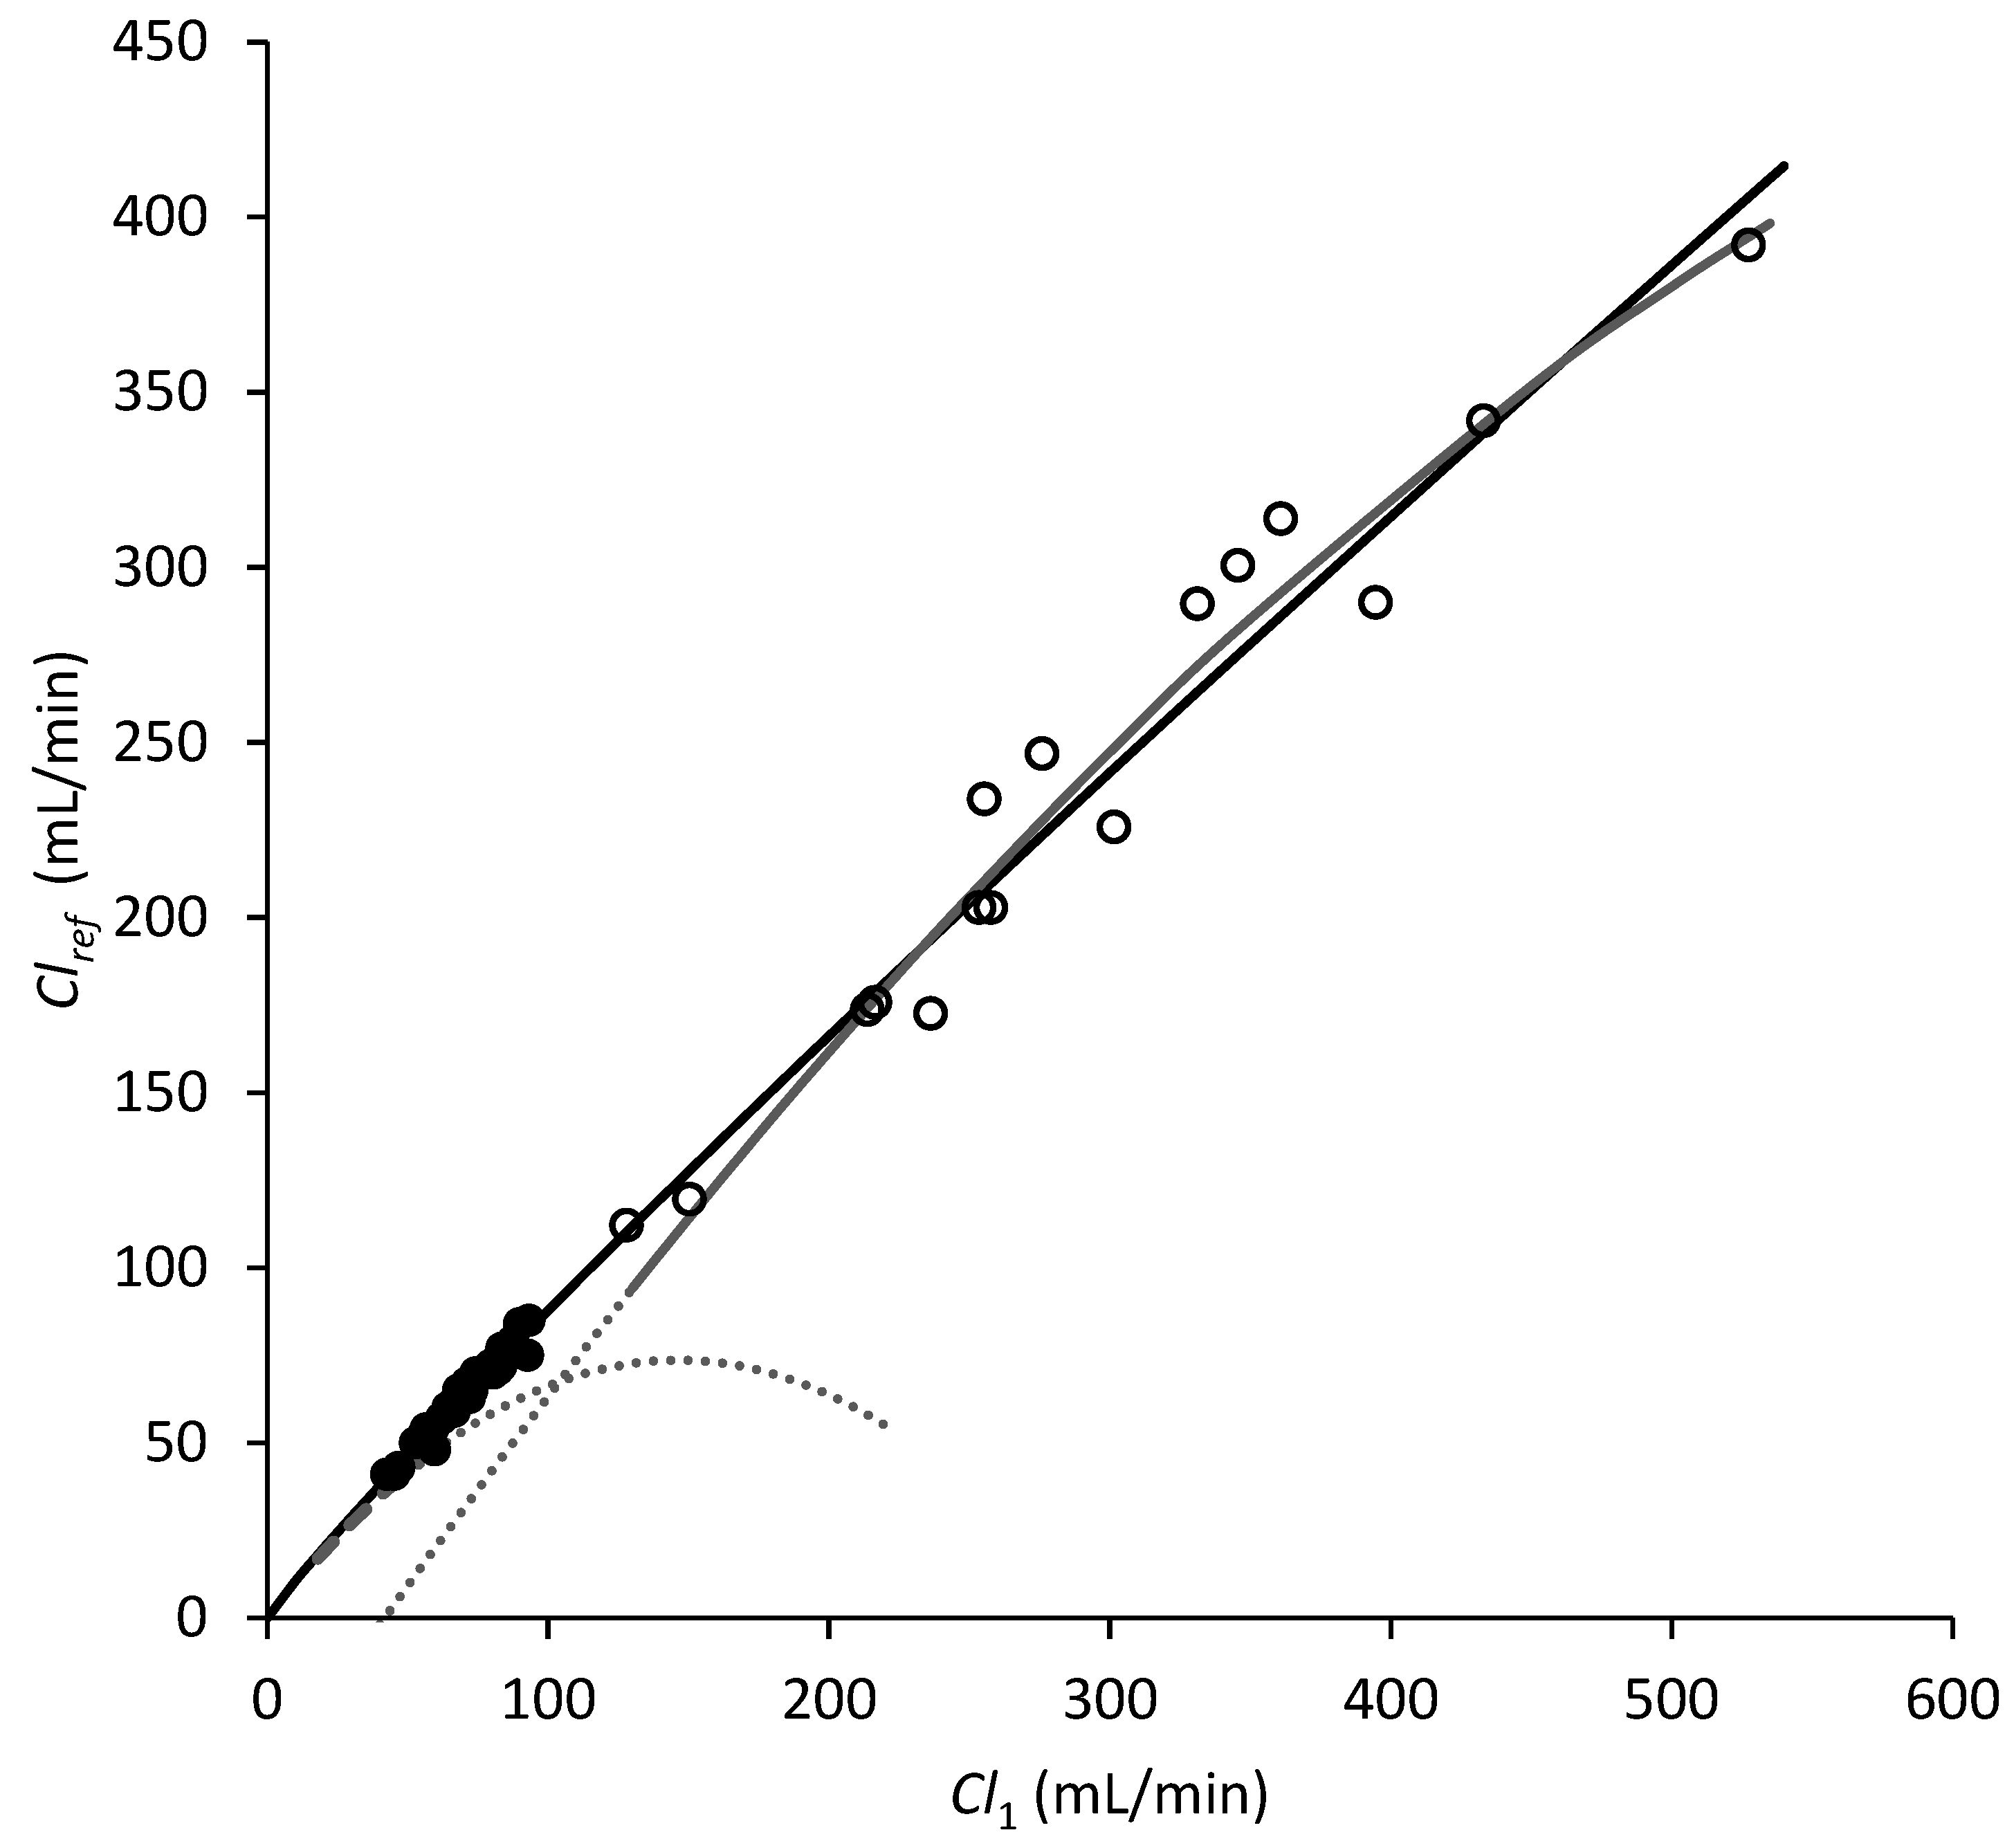
Comparison of the developed correction with data and correction from Luis-Lima et al. [2] and with the correction from van Gelder et al. [7]. Black circles are our data, and open circles are the Luis-Lima data. The grey full curve is the Luis-Lima correction (4) along with downward extrapolation. At low GFR, the grey dashed curve with upward extrapolation is the van Gelder correction (5). The black curve is our correction (1), fitted only to the black circle data points but shown in the full range of available data.
Figure 3.
Comparison of the developed correction with data and correction from Luis-Lima et al. [2] and with the correction from van Gelder et al. [7]. Black circles are our data, and open circles are the Luis-Lima data. The grey full curve is the Luis-Lima correction (4) along with downward extrapolation. At low GFR, the grey dashed curve with upward extrapolation is the van Gelder correction (5). The black curve is our correction (1), fitted only to the black circle data points but shown in the full range of available data.

Figure 4.
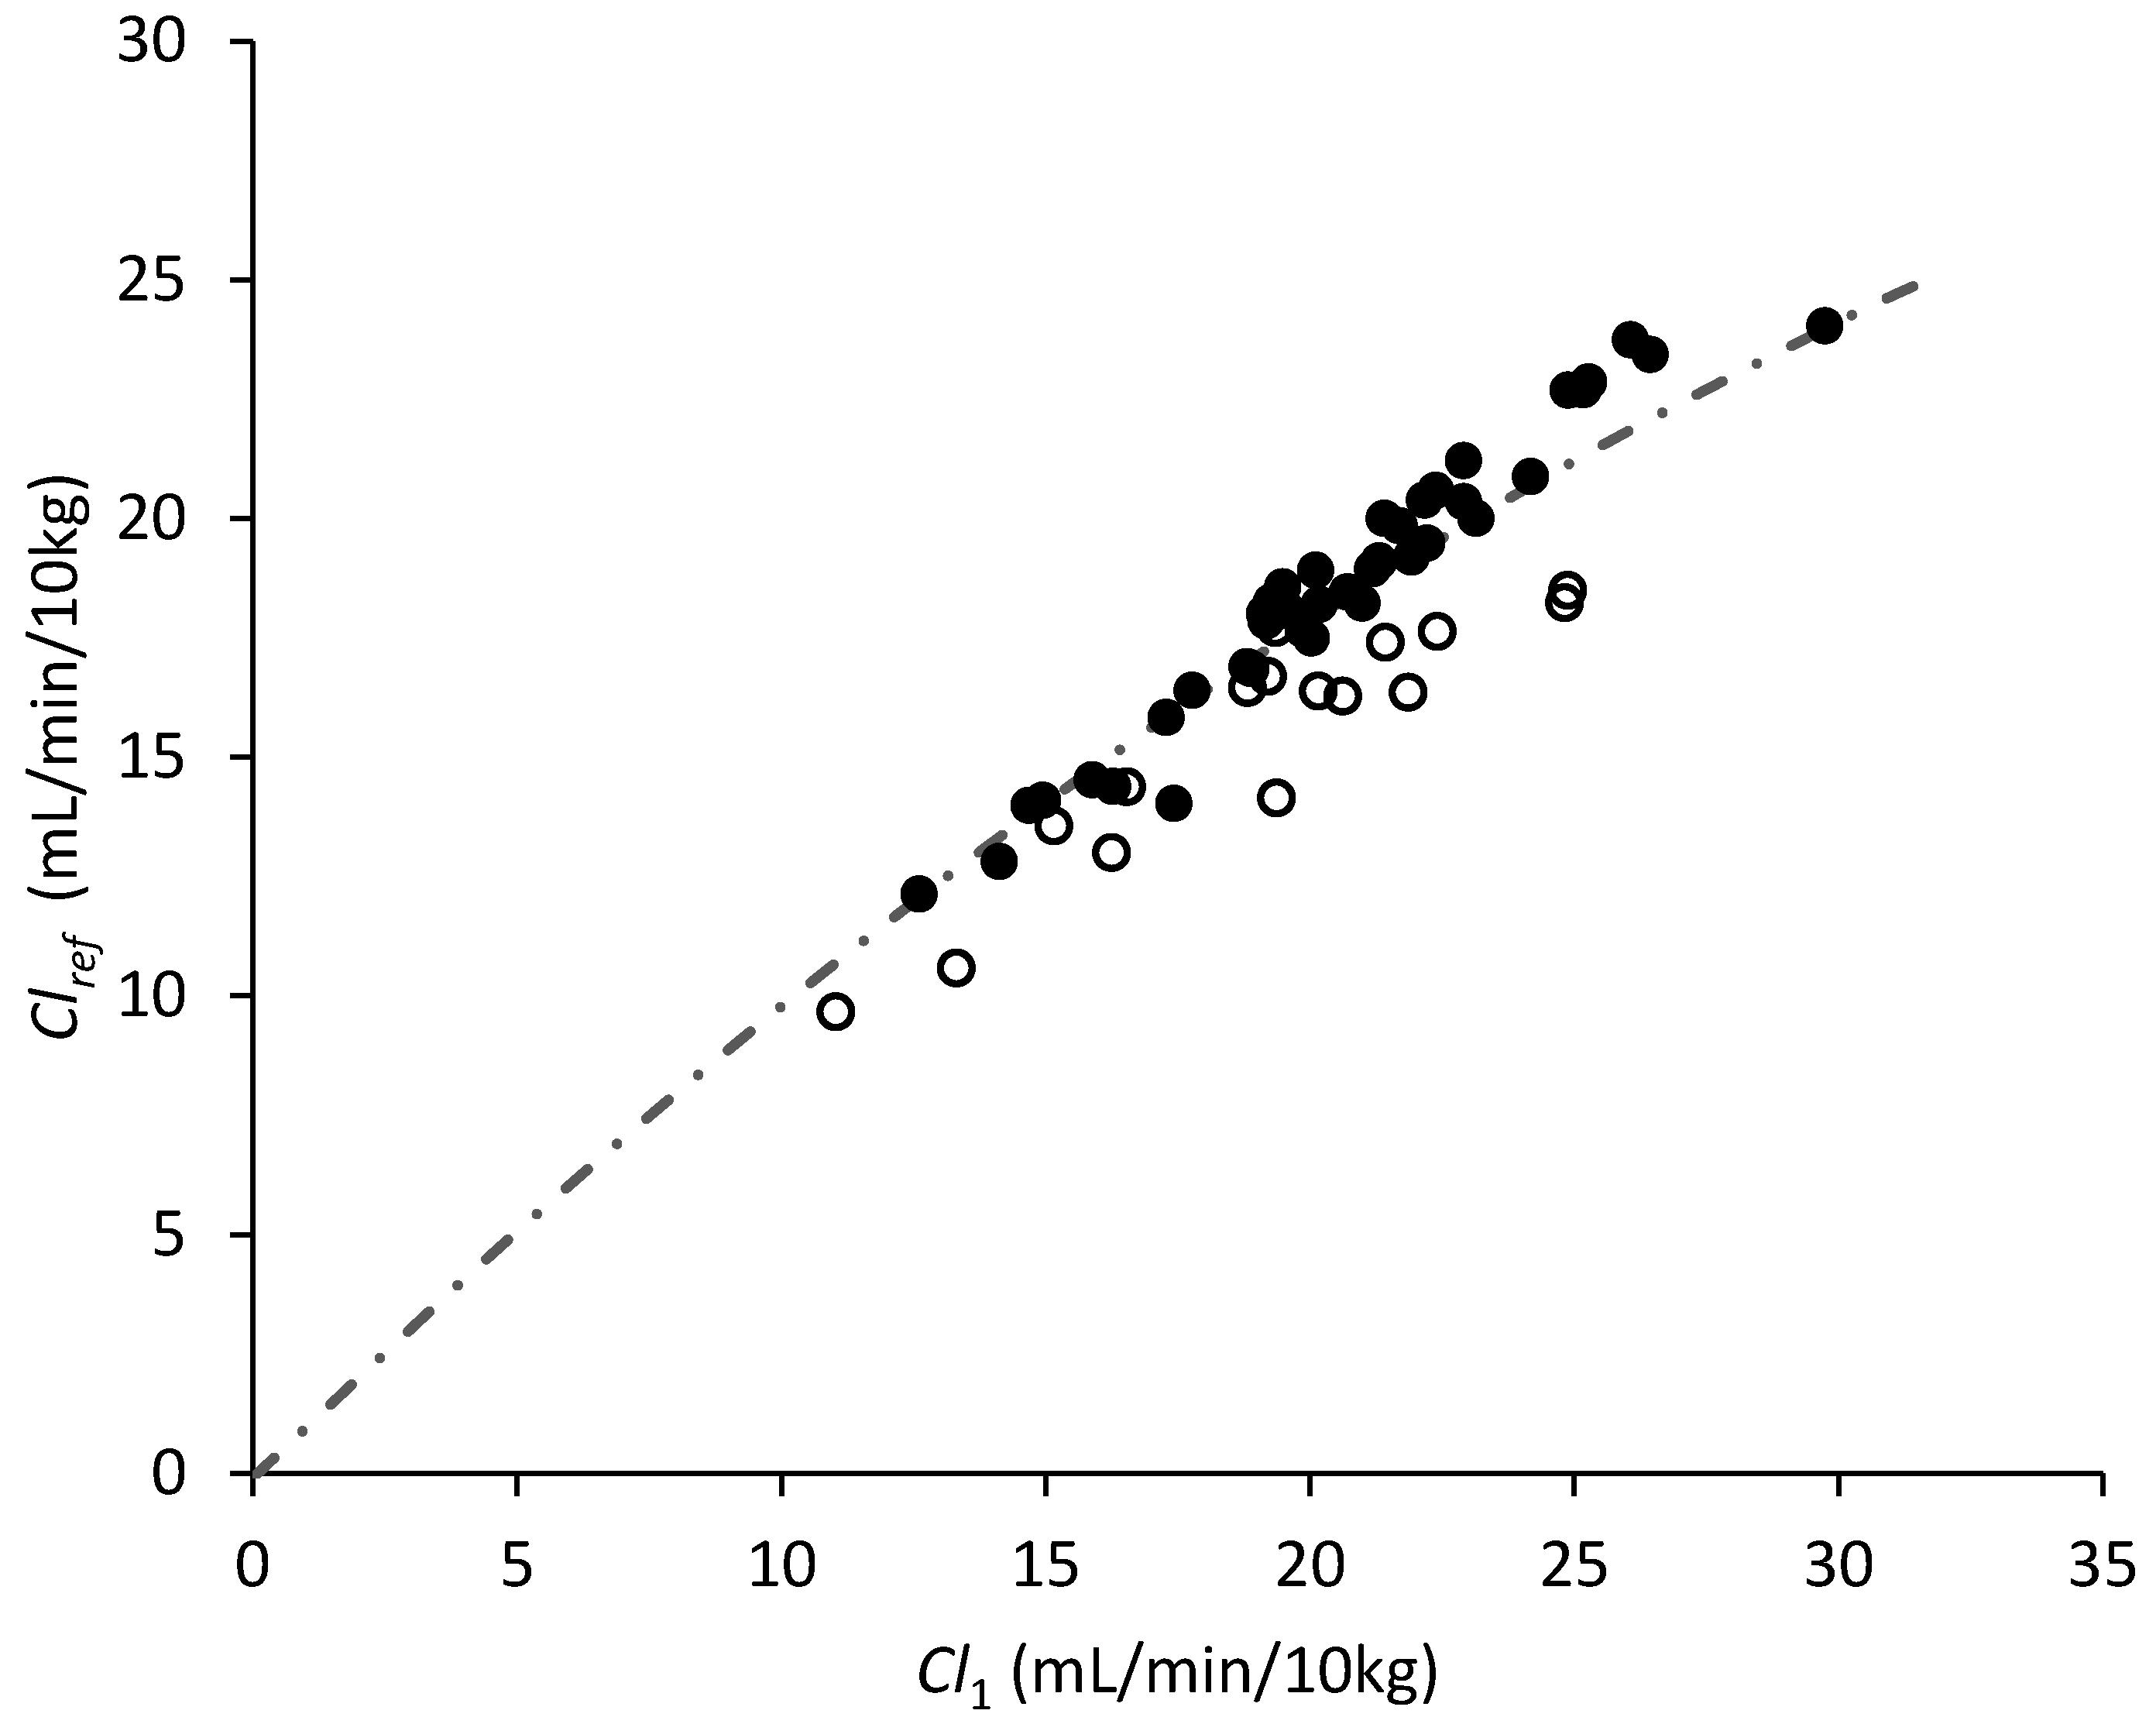
Presentation of the available data points scaled to a weight of 10 kg (mL/min/10 kg). Black circles are based on our data Table S1, and open circles are based on data from Luis-Lima et al. [2]. The dot-dashed line shows the Frennby correction, Formula (2).


Table 1.
Deviations in Clcorr (Formula (1)) from the reference value, Clref.
| No. of Samples (Time Interval) | Mean Deviation ± SD | |
|---|---|---|
| Absolute | Relative | |
| five (120–240 min) | 0.0 ± 2.3 mL/min | 0.1% ± 3.6% |
| four (150–240 min) | −0.2 ± 2.6 mL/min | −0.2% ± 3.9% |
| three (180–240 min) | −1.1 ± 5.2 mL/min | −1.5% ± 7.0% |
| Luis-Lima data * | −2.2 ± 17.7 mL/min | −0.2% ± 7.2% |
* Our correction applied to the original data from Luis-Lima et al. [2]; see Discussion.
Table 2.
Overview of studies.
| Study | Pigs | No. of GFR Measurements | GFR * | Correction Equation | |
|---|---|---|---|---|---|
| Weights | Sexes | ||||
| Present study | 26–44 kg | ♀ | 40 in 20 pigs | 41–85 mL/min | (1) |
| Frennby et al. (normal) [15] | 21–27 kg | (not stated) | 19 | 16.5–26.3 mL/min/10 kg | (2) |
| Frennby et al. (reduced) [6] | 21–26 kg | ♀♂ | 21 | 5.3–11.3 mL/min/10 kg | |
| Palnæs Hansen et al. [8] | 30–40 kg | ♀ | 12 | ~45–85 mL/min | (3) |
| Luis-Lima et al. [2] | 101–212 kg | ♀ | 16 | 112–392 mL/min | (4) |
| van Gelder et al. [7] | 34–80 kg | (not stated) | 23 in 5 pigs | ~17–44 mL/min | (5) |
* In accordance with the original studies, GFR ranges are presented as unscaled (mL/min) or weight-scaled (mL/min/10 kg) results. Approximate ranges (see main text) are identified with ~.
Disclaimer/Publisher’s Note: The statements, opinions and data contained in all publications are solely those of the individual author(s) and contributor(s) and not of MDPI and/or the editor(s). MDPI and/or the editor(s) disclaim responsibility for any injury to people or property resulting from any ideas, methods, instructions or products referred to in the content. |
© 2023 by the authors. Licensee MDPI, Basel, Switzerland. This article is an open access article distributed under the terms and conditions of the Creative Commons Attribution (CC BY) license (https://creativecommons.org/licenses/by/4.0/).
Share and Cite
MDPI and ACS Style
Jødal, L.; Brignone, J.I.; Ladefoged, P.-K.C.; Lund, L.; Andersen, T.B. Robust Porcine GFR Measurement with Radiotracers and Only Late Blood Samples. Biologics 2023, 3, 296-307. https://0-doi-org.brum.beds.ac.uk/10.3390/biologics3040015
AMA Style
Jødal L, Brignone JI, Ladefoged P-KC, Lund L, Andersen TB. Robust Porcine GFR Measurement with Radiotracers and Only Late Blood Samples. Biologics. 2023; 3(4):296-307. https://0-doi-org.brum.beds.ac.uk/10.3390/biologics3040015
Chicago/Turabian StyleJødal, Lars, Juan Ignacio Brignone, Pui-Ki Chan Ladefoged, Lars Lund, and Trine Borup Andersen. 2023. "Robust Porcine GFR Measurement with Radiotracers and Only Late Blood Samples" Biologics 3, no. 4: 296-307. https://0-doi-org.brum.beds.ac.uk/10.3390/biologics3040015