
Injection Moulding of Multipolar Polymer-Bonded Magnets into Soft Magnetic Inserts for Rotors in Reluctance Motors


Institute of Polymer Technology, Friedrich-Alexander-Universität Erlangen-Nürnberg, 91056 Erlangen, Germany
*
Author to whom correspondence should be addressed.
Magnetism 2021, 1(1), 3-21; https://0-doi-org.brum.beds.ac.uk/10.3390/magnetism1010002
Submission received: 10 September 2021
/
Revised: 6 October 2021
/
Accepted: 25 October 2021
/
Published: 26 October 2021
Abstract
:Due to lower magnetic properties of polymer-bonded magnets compared to sintered magnets, a complete redesign of the multipolar soft magnetic flux barriers in rotors with alignment guidelines was carried out to eliminate the frequently used rare-earth magnets, causing a new influence of the outer magnetic field on the cavity by using soft magnetic inserts. Within this new process, the main influencing factors on the magnetic flux density such as filler content, tool temperature, holding pressure and injection velocity were analysed and correlated. The studies were based on the compound of Polyamide 12 and up to a 60 vol.-% of the hard magnetic filler, strontium ferrite. Based on the study, the injection moulding of multipolar-bonded magnets into soft magnetic inserts for rotors and, in turn, into complex geometries can be optimized in terms of the orientation of the filler, the microstructure and the magnetic flux density. The investigations show no significant influence of the process parameters known from the literature such as the mass temperature Tm, which affects the magnetic flux density, as well as the orientation and the microstructure similar to tool temperature Tt, but is less efficient. The main influencing factors identified during the investigations are the tool temperature Tt, the injection velocity vin and the holding pressure ph. As known influencing factors are only based on simple geometries such as ring structures or plates, new factors were determined for complex rotor geometries.
1. Introduction
Polymer-bonded permanent magnets are mainly used in the field of sensor technology as signal transmitters, which help to drive this technology. In the field of motor concepts, among other things, a magnetic excitation of synchronous or direct current machines can be carried out by the use of polymer-bonded permanent magnets [1]. Thermoplastic-based matrix materials allow the fabrication of permanent magnets by injection moulding, and thus the utilization of the advantages in the area of geometry freedom and the accuracy of the components, especially in small and thin geometries due to a reduced shrinkage [2]. Furthermore, multipolar structures can be realized by integrating permanent magnets in the injection tool.
The polymer-bonded permanent magnets are composite materials consisting of a polymer matrix with embedded, hard, magnetic filler particles. In principle, polymer-bonded permanent magnets are processed in pressing and injection moulding, whereby pressed magnets have a high filler content, and thus higher magnetic properties. Within the filler types, two main groups are distinguished: ceramic materials such as strontium or barium ferrite (SrFeO, BaFeO), or rare earth materials such as neodymium-iron-boron (NdFeB) and samarium-cobalt (SmCo). They differ greatly in terms of magnetic properties, such as remanence BR and coercive field strength HC, as well as the possible application temperature and alignment in the outer magnetic field [3]. In general, all the available filler types are either magnetically isotropic and anisotropic, whereby the preferred orientation of the anisotropic particles controls the direction of the particles in an outer magnetic field, provided that the particles are still mobile and reveal a magnetic moment. As a result, magnetic properties of up to 50% higher than isotropic filler particles can be achieved [4]. The particle size is primarily material dependent and usually between approximately 1 and 10 μm for ferrite fillers and 100 and 400 μm for NdFeB fillers. The particle shape of the anisotropic SrFeO reveals a hexagonal structure, while anisotropic NdFeB have no defined shape, but clearly distinct fragments. Isotropic NdFeB has a spherical form. Among other things, the particle shape has an influence on the flow and orientation behaviour, since, for example, platelet-shaped particles can slide off each other, and thus can align themselves, mainly in parallel and in the flow direction [5]. Thus, the orientation of the fillers are influenced by the flow behaviour of the compound and particularly by the course of the viscosity of the matrix material with respect to the temperature, by the filler geometry and by a possible particle–particle interaction. This interaction is encouraged by the agglomerate-forming particles and a high filler content. In particular, the particles with a small size tend to build agglomerates [6].
Recent investigations aimed to enable the integration of polymer-bonded permanent magnets into electric plate packages in the drive motors of the electromobility using full geometry freedom. As a result, these new concepts can be applied, among others, in the field of separate, excited, asynchronous machines, which held a market share of 83% among the engine types in Germany in 2008 [7]. The figures between 2010 and 2020 show a steadily increasing demand for separate, excited, asynchronous machines, as these have occupied between 65 and 70% of the world’s production of electric motors annually over the last 10 years, and thus play an important role for the industry [8,9]. The new concepts in the field of synchronous machines enable an improvement in their performance and efficiency by exploiting the freedom of geometry. In particular, the new engine concepts enable miniaturization and a considerable reduction in the use of materials, as well as the elimination of materials that are difficult to obtain, by replacing them with resource-saving materials. Thus, the life cycle costs are diminished.
The synchronous reluctance motor is based on the physical principle of the reluctance force. The change of the magnetic resistance, and thus the reluctance, varies depending on the reduction in the resistance [10]. The stator consists of three coils, which are shifted by 120°. Within the rotor, the magnetic flux is specifically guided through sheet metal bars (d-axis) or blocked by air areas in the middle of the flux barriers (q-axis). The flux barriers are U-shaped gaps in the sheet metal package. In order to improve the mechanical output, and thus the rotation speed, the magnetic flux in the q-direction must be reduced or the magnetic flux in the d-direction must be increased relative to the q-axis. The materials for the sheet metal package limit the potential for further increasing the d-axis. The new concepts integrate polymer-bonded, permanent magnets in the flux barriers. This changes the principle of action of the d- and q-axis and significantly enlarges the difference between the two axes. According to [11], the first simulations show an increase of the internal torque by 33%. In addition, a raise in the output density and the efficiency could be shown as simulative and experimental [11].
In this investigation, the influence and the correlation between the process parameters, the material and the viscosity, as well as the magnetic properties regarding the fabrication of polymer-bonded, permanent, magnetic flux barriers within the rotors, are presented for a synchronous reluctance motor. The process parameters investigated in the research project were chosen with respect to the main influences based on the literature. So far, the mass temperature Tm [1] and the holding pressure ph [12] were detected as impacting the magnetic flux density and the orientation of the fillers mainly due the viscosity relative to temperature and time. The tool temperature Tt has only a small impact and the injection velocity vin has no impact on the magnetic flux density and the orientation [12] based on the literature. The investigations show that the main influencing factors regarding the geometry and the gate system of the rotors are the filler content, the tool temperature Tt, the holding pressure ph and the injection velocity vin. Investigations in the mass temperature Tm, the magnetic field, the flow path and the insert temperature Tin revealed a small or absent impact on the flux density and the orientation; therefore, they were not explained in detail within these investigations. The new realizations presented in this work allow the optimization of the fabrication of polymer-bonded, permanent, magnetic flux barriers within the rotors, and thus the opportunity to apply the new rotor concept for a synchronous reluctance motor with a commercial context.
2. Materials and Methods
2.1. Material
The investigations were carried out with a predefined rotor used as an insert and based on an electric plate package made of M530-50 A electrical sheet (manufactured by Feintoll System Parts Jessen GmbH (Jessen, Germany) and procured by HS Kaiserslautern, Institute of Electrotechnical Systems in Mechatronics (Kaiserslautern, Germany). The outer diameter of the rotor was 47.6 mm and the inner diameter was 13.0 mm. Further, the length of one insert was 16.0 mm. Eight poles and four north–south combinations were realized by two permanent magnet segments for each combination. The geometry of the rotor is shown in Figure 1A, which differed between the insert without the compound and the completed rotor after injection moulding. To evaluate the measurements of the rotor properly and to ensure the defined extraction of the test specimens for example in the microscopy, positions were defined on the rotor, which are further illustrated in Figure 1B.
The compound of the polymer-bonded permanent magnets was based on the thermoplastic matrix material Polyamide 12 (PA 12), type Vestamid BS 1636 from the company Evonik Industries AG (Essen, Germany) and the filler SrFeO, type OP71 of the company Dowa Holdings Co. Ltd. (Tokyo, Japan). These two components were chosen in terms of a standard matrix material without further demands on the temperature properties and an anisotropic filler with resource saving aspects. The compounds with a filler content between 50 and 60 vol.-% in 5 vol.-% steps were prepared in a twin-screw extruder, type ZSE HP-40D from the company Leistritz AG (Fürth, Germany). Both the filler and the polymer granules were added gravimetrically at different positions along the screw using a doser from the company K-Tron Deutschland GmbH (Genhausen, Germany). After the compounding, cooling was carried out by means of a vibratory feeder, followed by pelletizing to avoid contact with water. The compound reveals a density of 2.93 to 3.47 g/cm3 with respect to the filler content. The filler content of 60 vol.-% was chosen due to the fabrication limit of the injection moulding.
2.2. Fabrication of the Test Specimens
The full-factorial trial design provided the variation of the material used to fill the flux barriers in the rotors and the main process parameters (tool temperature Tt, holding pressure ph, injection velocity vin). The experiments were set with respect to the results from previous thermomechanical simulations and findings of factors influencing the magnetic flux density [12]. The inserts were filled with a hard, magnetic compound on the Arburg Allrounder injection moulding machine (400 kN) from Arburg Gmbh et al. KG (Lossburg, Germany) using the tool to fabricate rotors, which is explained in detail in [13]. The experimental plan is shown in Table 1, where the settings marked with a zero represent the reference parameters, one of which is varied in each case. The process parameters, aside from the varied parameters shown in Table 1, are held constant with a mass temperature Tm of 285 °C and an insert temperature Tin of 23 °C.
2.3. Characterization of the Compound
2.3.1. Differential Scanning Calorimetry (DSC)
To characterize the heating and cooling behaviour of the highly filled compounds, DSC measurements were first carried out on the basis of the DIN EN ISO 11357 standard using pellets and a weight of about 9.8 mg on the DSC of TA-Instruments (New Castle, DE, USA). The material was tempered at 0 °C for 10 min before being heated to 220 °C at a rate of 20 °C per minute in the first heating cycle. After an isothermal hold of 0.5 min, the material was cooled to 0 °C at a rate of 10 °C per minute and held isothermal for 5 min before being reheated to 220 °C in the second heating cycle. The melting peak temperature during the second heating and the crystallization peak temperature during cooling were determined.
2.3.2. Pressure–Volume–Temperature Measurement (pvT)
By using pvT measurements according to ISO 17744 standard on the SWO-pvT of Thermo Fisher Scientific Inc. (Waltham, MA, USA), the pressure-dependent glass transition temperature Tg of the compound was defined in addition to the characterization of the shrinkage behaviour as a function of four different pressure levels: 600, 800, 1200 and 1600 bar. The pvT measurements ran an isobar between a temperature of 60 °C and 250 °C.
2.3.3. Shear Viscosity by High-Pressure Capillary Rheometer
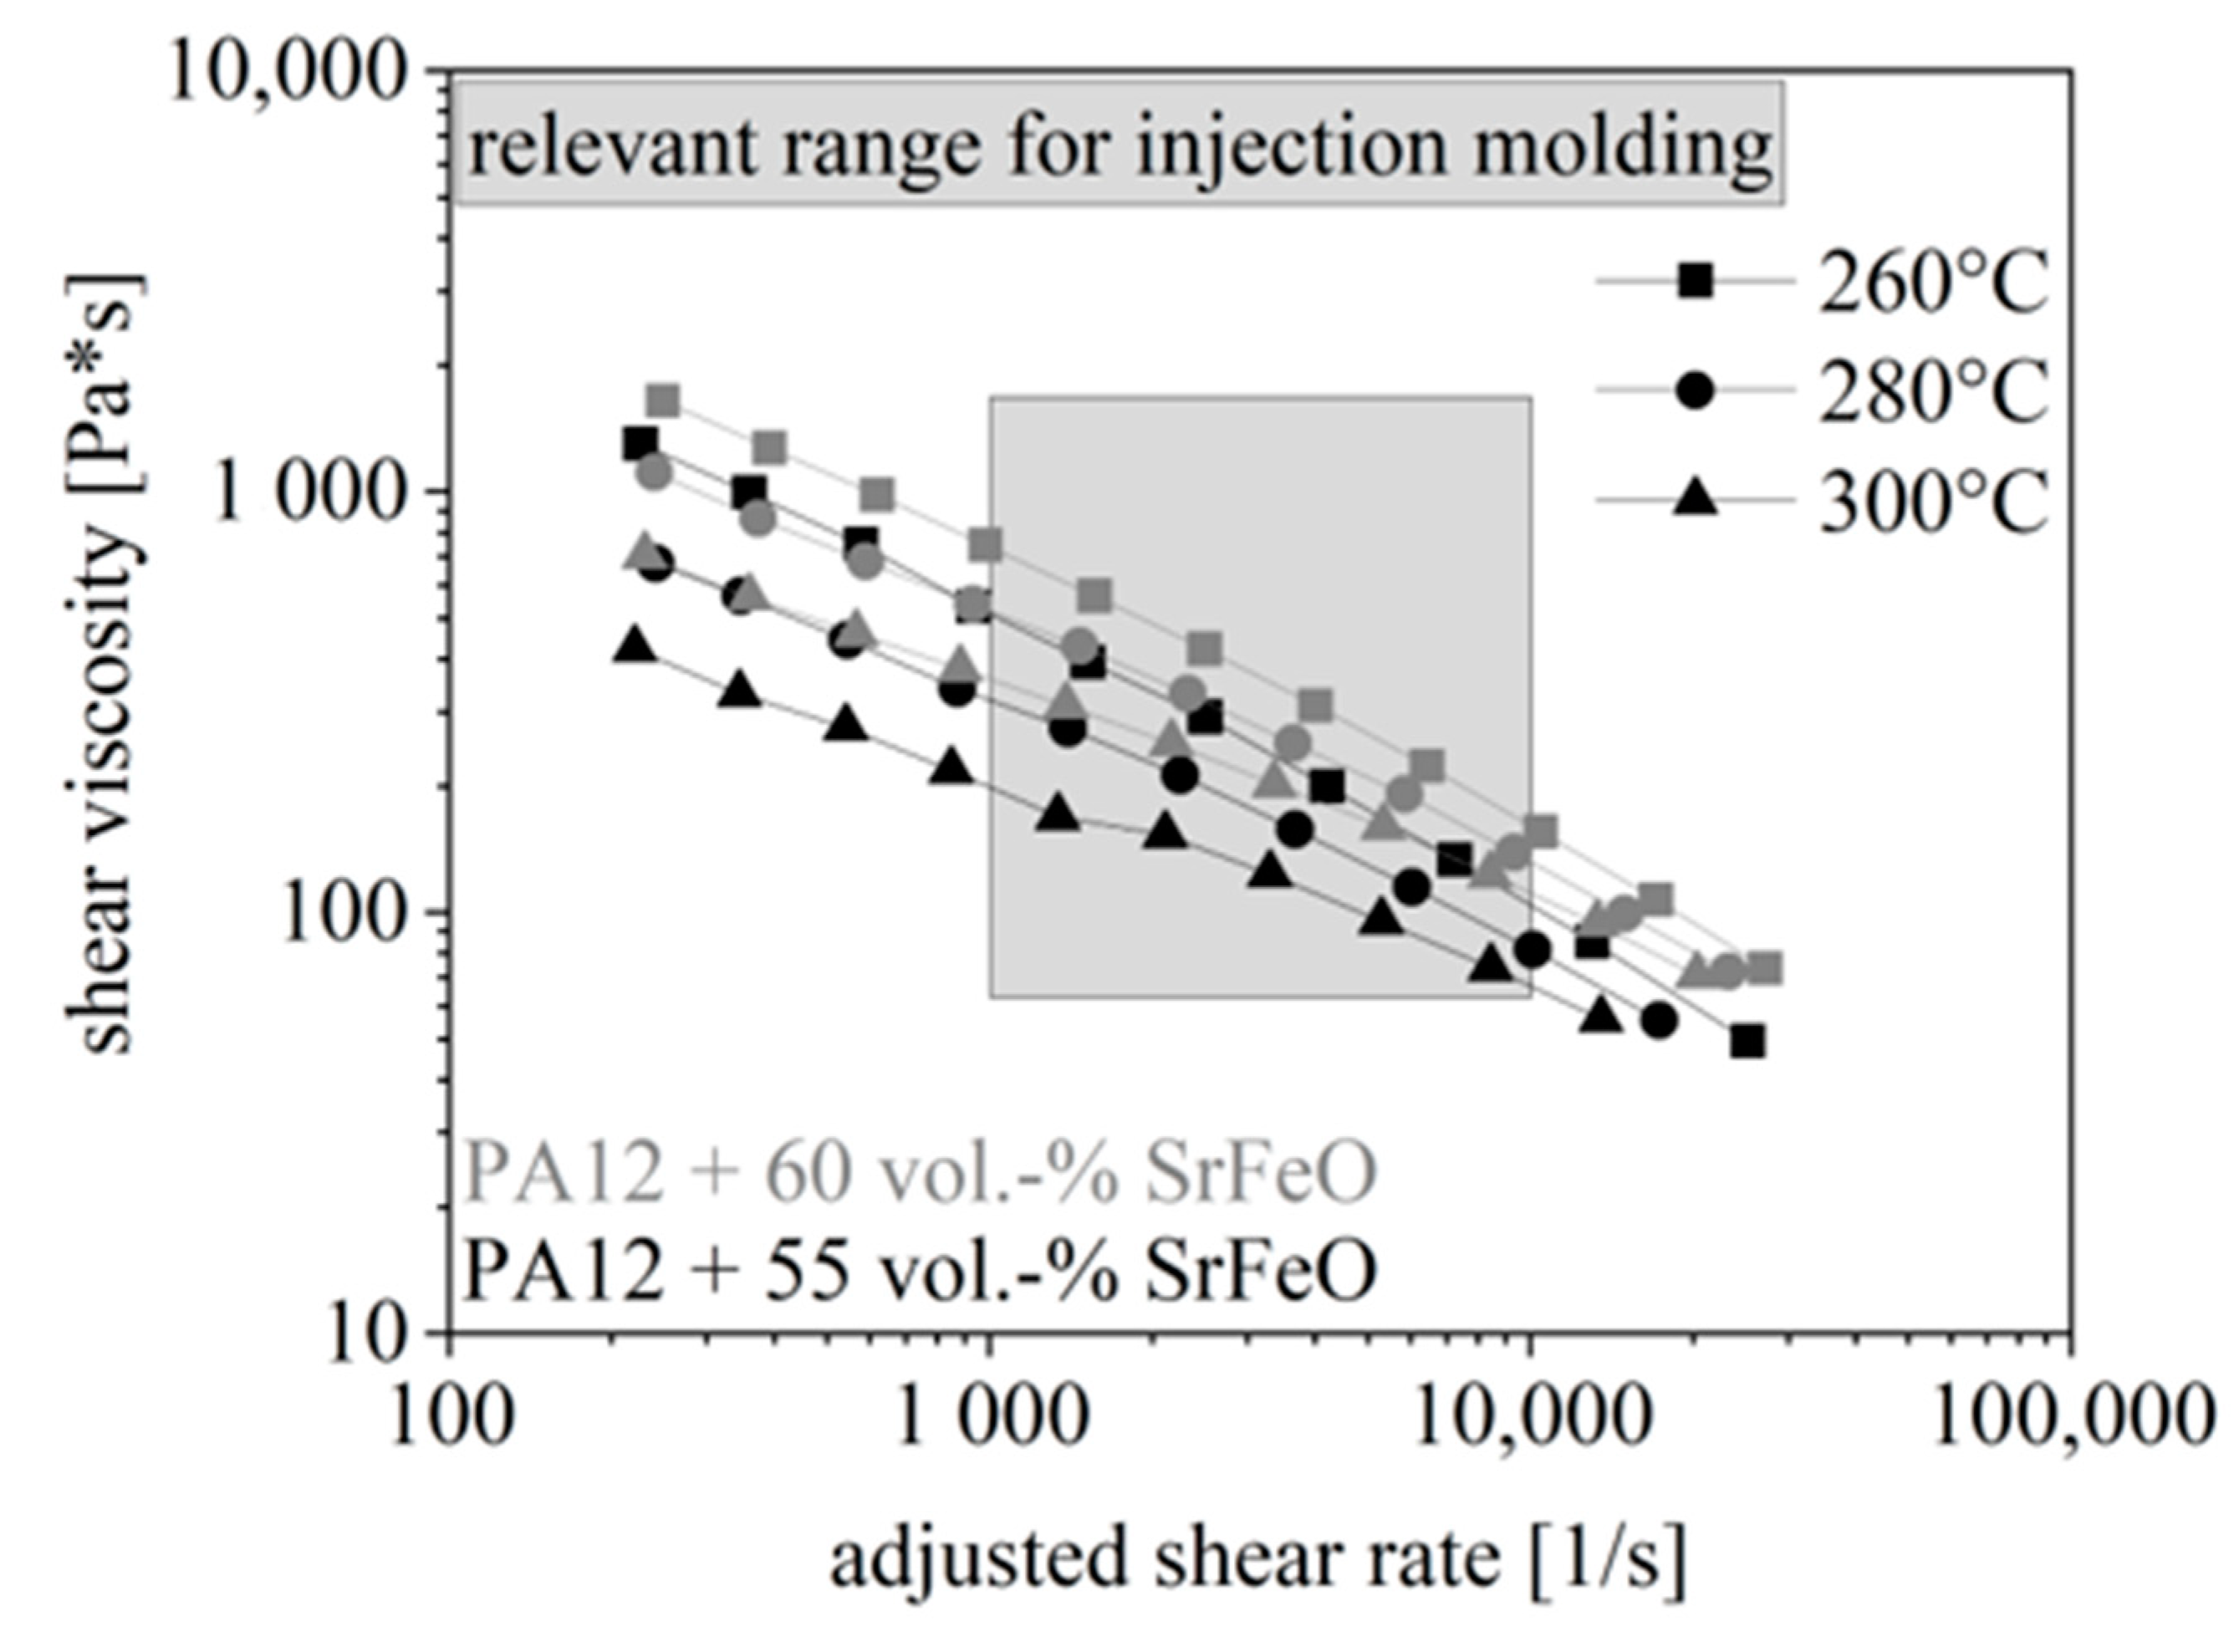
High-pressure capillary rheometer measurements were made to characterize the viscosity of the compound under process conditions. A double capillary rheometer from Malvern Instruments Ltd. (Malvern, UK) was used and the analyses were made at three different temperature levels of 260 °C, 280 °C and 300 °C as well as a shear rate of 102 to 104 s−1. The relevant range of the shear rate with respect to the injection moulding process was covered between the shear rate of 103 and 104 s−1 with respect to [14].
2.4. Characterization on the Test Specimens
2.4.1. Magnetic Properties
The determination of the magnetic properties or, more precisely, the magnetic flux density of the rotors was first carried out using a test rig, as shown schematically in Figure 2. Here, the rotors were picked up via a clamping device. The flux density was recorded radially via a Hall sensor relative to the rotation angle of the rotor. The angle of rotation was received using a rotary encoder from Heidenhain GmbH (Traunreut, Germany). For the radial data acquisition on the circumference of the rotors, the shaft was driven by a motor with an adjustable speed and number of revolutions or running time. This made it possible to determine the course of the magnetic flux density and the radial runout tolerance for 360° or any multiple. To ensure a comparison between the rotors, a defined position was specified on the rotors, which was taken into account when inserting the rotors into the injection mould and when measuring the rotors on the test rig. This ensured uniform positioning of the rotors during production and analysis.
The evaluation of the magnetic flux density, which was expected to be relative to the general set up of the synchronous reluctance motor and the position of the d-flux and the q-flux, was not sufficient. It became apparent that the assumed magnetic structure in the component, due to the permanent magnets in the mould, was different from what was expected and demonstrated in simulations carried out in the conception phase of the tool. These simulations were based on the magnetic design of the tool based on [13]. The evaluation criteria were adapted so that one quadrant (position 2 to 4 according to Figure 1B) was considered, and three positions were distributed symmetrically in this quadrant. Figure 3A shows the position of the d- and q-axis corresponding to the evaluation criteria in one quadrant of the rotor and corresponding to Figure 3B with the typical route of the magnetic flux density of the rotor.
These positions reflect the large flux barrier (position I), the small flux barrier (position II) and the middle area (position III) between the flux barriers. Improved conditions for the synchronous reluctance motor were reached by a low value corresponding to the q-axis at positions I and III, and a high value corresponding to the d-axis at position II [10]. Therefore, the difference between the three positions, namely the distinction between I and II, as well as II and III, needed to be high to increase the performance of the rotor and the two differences were evaluated in the following. Their optimization should reach a high value and a similar value for both distinctions.
2.4.2. Concentricity
The concentricity of the rotors was documented comparatively before and after the injection moulding of the flux barriers in the rotor in order to determine the potential influence of the injection moulding process on the radial geometry of the rotors, especially on thin webs. The test rig shown in Figure 2, as well as an inductive displacement sensor was used. The deviation was determined for one quadrant (position 2 to 4) relative to the rotor before manufacturing. Low deviation of the concentricity should be reached.
2.4.3. Microstructure
The rotors were characterized with respect to the microstructure by a stereo microscope (type: Axio Zoom.V16) from Carl Zeiss AG (Oberkochen, Germany). For the microscopic investigations, the large flux barriers were first removed from the rotors (position 3) with minimum temperature impact using a saw. They were embedded in cold-curing epoxy resin (type: Epofix) from the company Struers GmbH (Ottensoos, Germany). The specimens were then split in the centre using a water-cooled saw with minimal temperature input so that microscopic examinations could be performed in the centre of the specimen. The specimens were demagnetized and polished.
2.4.4. Filler Orientation
Further, the filler orientation was determined by a scanning electron microscope (type: Gemini Ultra-Plus) from Carl Zeiss AG (Oberkochen, Germany). The test specimens of the characterization of the microstructure (position 3) were used and 9 areas—in the edge and centre areas of the flux barrier, in the corner areas (positions A to C and G to I) and in centre areas (positions D to F)—were defined. The corresponding positions are shown in Figure 4. On the basis of the images taken by the scanning electron microscope, a differentiation between the matrix material and the filler was carried out by means of a grey scale threshold analysis. The orientation was evaluated along the longest axis of the individual particles in order to determine the main orientation angle between 0° and 180°. According to the formation of the histogram, a preferred orientation of the fillers or a reduced orientation due to a broad scattering of the histogram could be deduced. This could also be seen schematically in Figure 4. Here, a distinction was made between a good and a bad orientation according to the scattering width of the histogram.
2.4.5. Void Formation
In addition, the determination of void formation over the entire small and large flux barriers from position 5 of the rotor was performed by computed tomographic imaging on a subµ-CT from Frauenhofer Institute for Integrated Circuits (IIS) e.V. (Erlangen, Germany). Here, the images were taken at a voxel size of 17 µm. For optical analysis, individual images were taken from the three-dimensional images of the specimens in one plane. These images were taken at regular intervals between areas of the specimen close to and at a distance from the gate. Note that the metallic fillers in the specimen led to overexposure, and thus an artefact in the images. Nevertheless, it was possible to evaluate these samples to determine the shrinkage within the specimen.
3. Results and Discussions
In the following section, the different influencing factors, such as the material or the process parameters, are separately discussed in terms of their impact on the magnetic flux density, the concentricity, the microstructure and the filler orientation. Further, the material analyses are considered in terms of physical correlations.
3.1. Characterization of the Compound
3.1.1. Melting Peak Temperature and Crystallization Peak Temperature Based on DSC
The DSC behaviour during cooling and the crystallization peak temperature for the materials with filler contents of 50, 55 and 60 vol.-% are shown in Figure 5 by the heat flow relative to the temperature between 70 °C and 210 °C. The melt peak temperature decreases with the increasing filler content from 165 °C at 50 vol.-% to 158 °C at 60 vol.-% due to the higher thermal conductivity of the filler. This effect, however, is only efficient at a filler content above 55 vol.-%, since an equivalent melt peak temperature to the base material PA 12 is reached for lower filler contents. In addition to the crystallization peak temperature, the enthalpy also decreases with the increasing filler content, as shown in Figure 5. This is due to the influence of the thermal conductivity caused by the filler. Accordingly, a high filler content tends to allow a longer time for the filler orientation to occur. At the same time, the particle interaction increases.
3.1.2. Pressure-Dependent Glass Transition Temperature by pvT
The glass transition temperature can be determined using DSC measurement where the pressure cannot be varied. Further it can be analysed with respect to pvT measurements and depending on the pressure. Figure 6 shows the change of the glass transition temperature relative to the material content and the pressure steps. Furthermore, the range of the temperature of crystallization is, for example, at 50 vol.-%, with respect to the DSC measurement and Figure 5. The glass transition temperature is independent of the filler content and increases linearly relative to the different pressure steps. The increasing compression of the material leads to compact test samples, which increase the glass transition temperature due to a more effective temperature control. Even though the glass transition temperature is similar to a range, in which the material changes its physical state from liquid to solid and the definition of an exact parameter that characterizes the transformation of the material is difficult, the glass transition temperature defined by the pvT measurement is a guideline for the temperature where most of the physical change takes place. DSC analyses reveal the temperature range of the crystallization without pressure. Since the pressure influences the glass transition temperature significantly, DSC measurements are insufficient.
3.1.3. Shear Viscosity by High-Pressure Capillary Rheometer
The shear viscosity relative to the temperature, as shown in Figure 7, decreases due to an increase in temperature, independent of the filler content, as the molecules become more moveable due to higher temperatures. Furthermore, the viscosity increases slightly due to an increase in the filler content because the particles act as incompressible and rigid parts in the matrix. The influence of the filler content on the shear viscosity becomes more important with higher temperatures as the increasing mobility of the molecules is more affected due to the fillers. With that the choice of the filler content and the temperature can reduce the viscosity by half of a decade in the logarithmic scale, which defines the possible orientation of the fillers in the processing.
3.2. Characterization on the Test Specimens
3.2.1. Influence of the Material
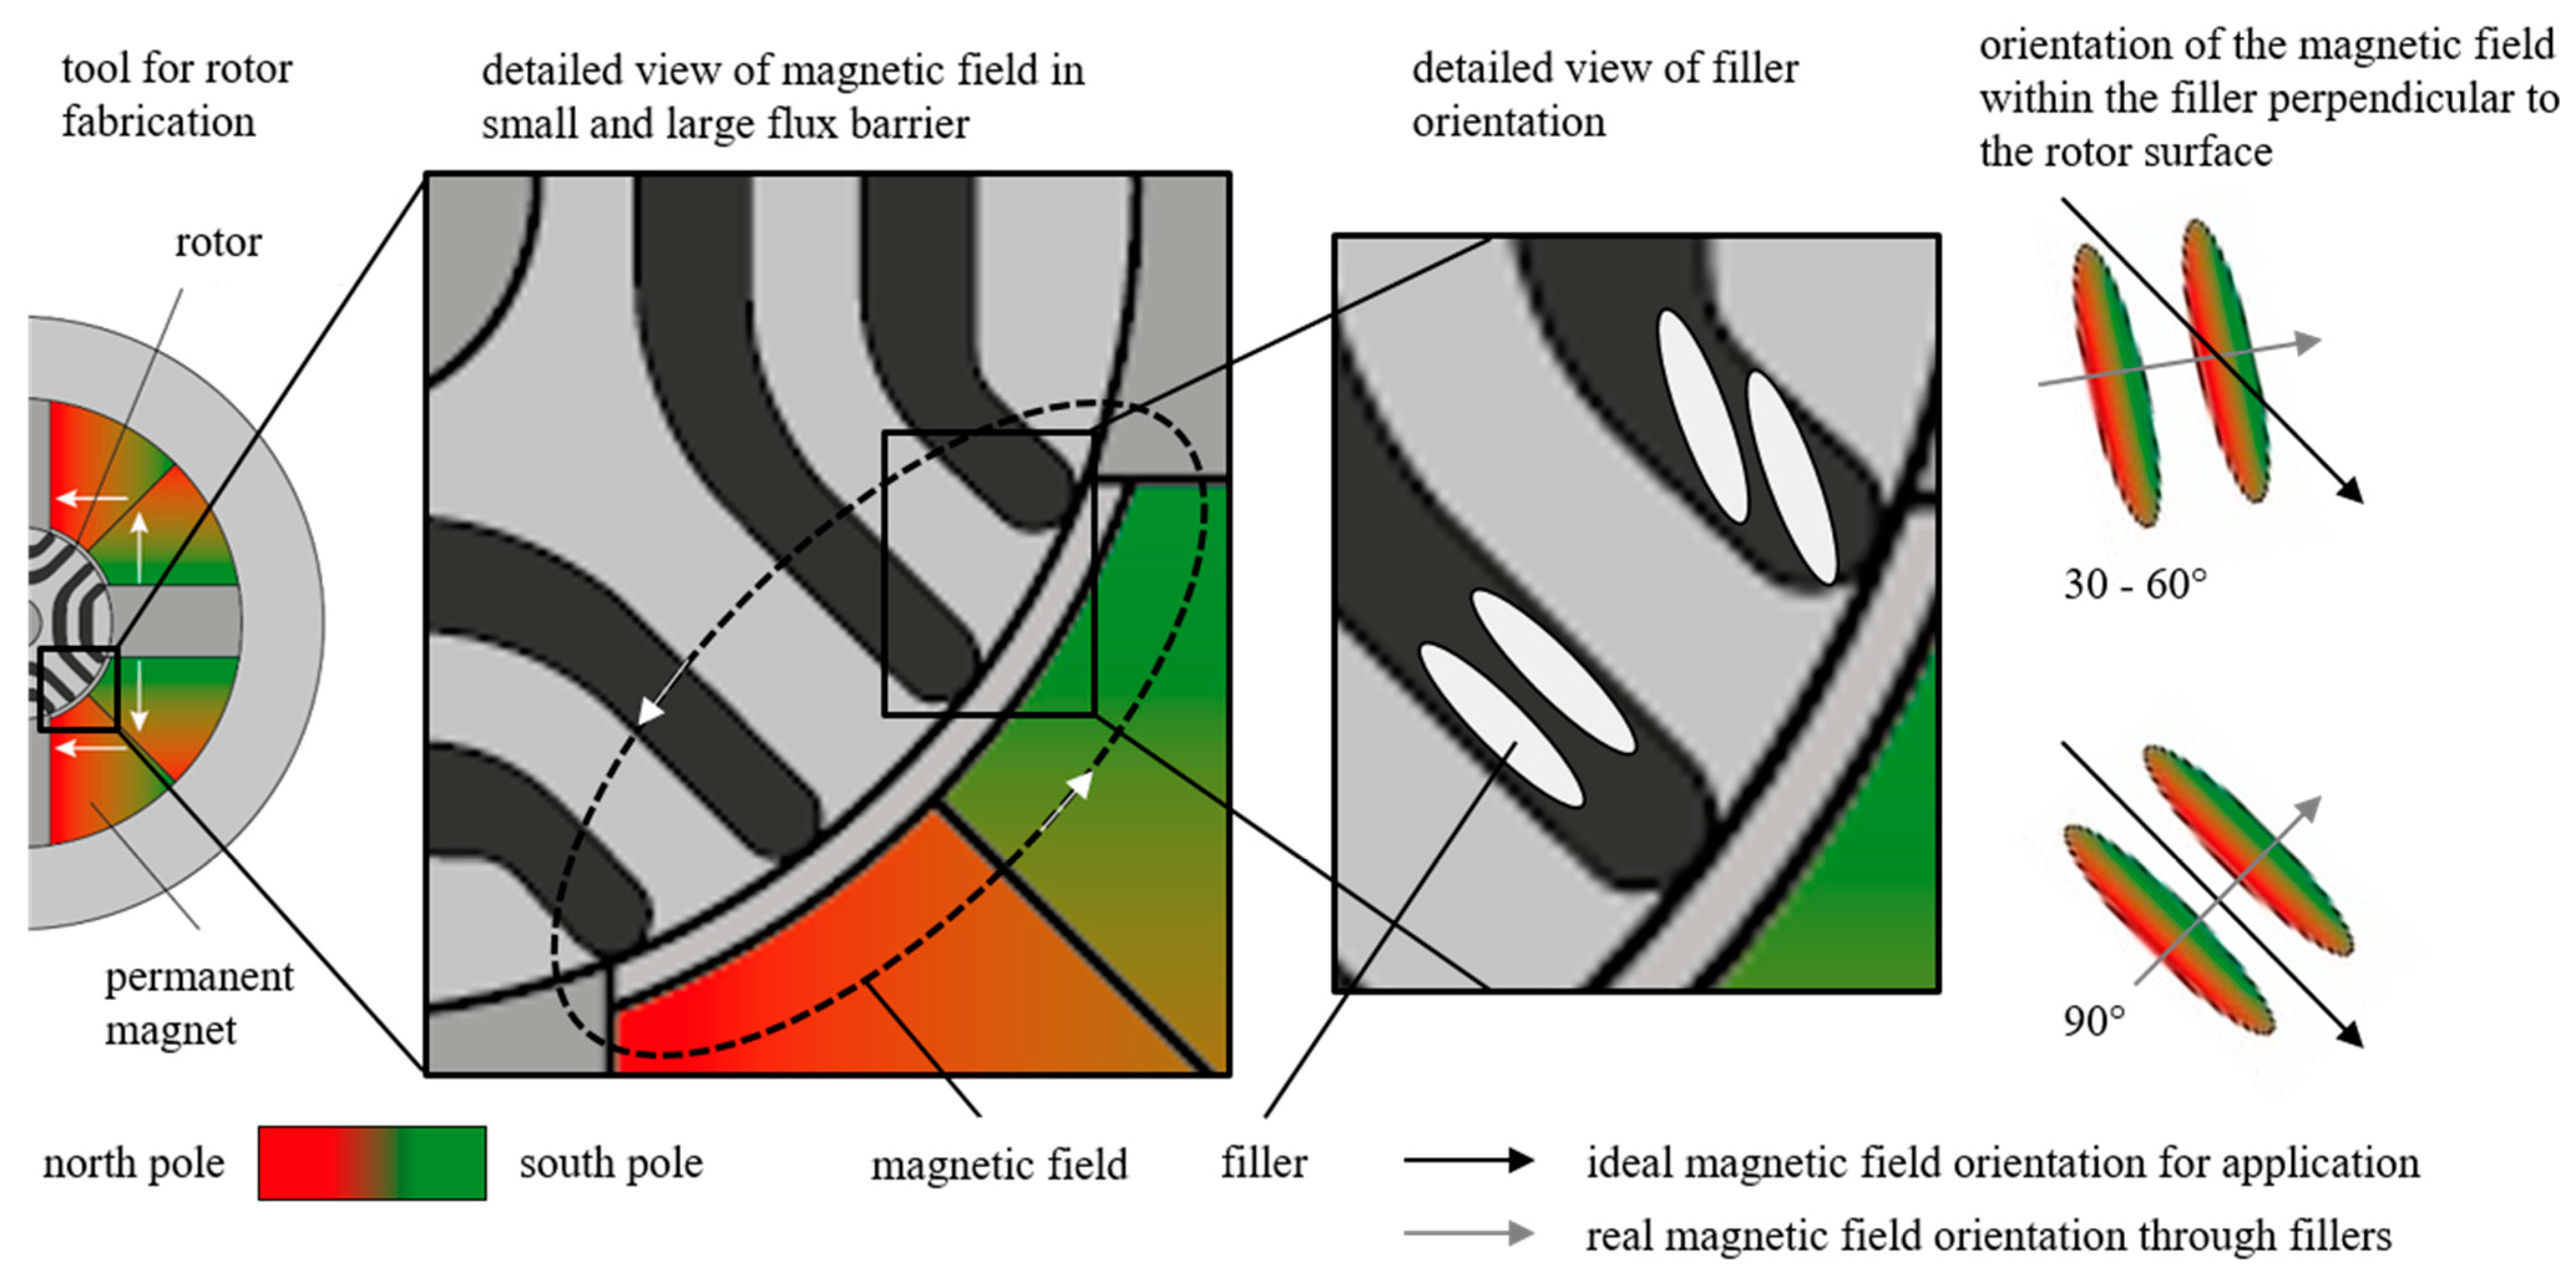
The impact of the filler content, and thus the impact of the compound formulation on the magnetic flux density is shown in Figure 8. The parameters are initially reduced by an increasing filler content and then significantly increase. The difference between positions I (large flux barrier) and II (small flux barrier) is higher than between positions II and III (central region) and the distinction increases with the filler content. The standard deviation for the magnetic parameters increases with the increasing filler content, and thus the reproducibility decreases significantly. The orientation of the fillers in the small and large flux barrier can be illustrated by the example of a stereo microscope image shown in Figure 8 at position C for 55 and 60 vol.-% filler contents. A clear shift in orientation can be seen for the small flux barriers in the angular range between 30° and 60°, whereas in the large flux barriers an orientation of mainly 90° is achieved with respect to the filler content of 60 vol.-%. The orientation of 55 vol.-% fillers in the compound is broad and significantly less specific.
An increase in the filler content initially leads to a reduction in the magnetic flux density as a result of the mutual interferences between the fillers at a content of 55 vol.-% and a corresponding reduction in their orientation. A further increase up to a 60 vol.-% filler content improves the magnetic flux density due to the higher filler content, which can partly compensate for the reduction through the interference between the filler particles. In addition, the magnetic flux density in the position I is significantly lower than in the position II. The magnetic flux density at position III is hardly influenced by the material variation. Therefore, the difference between the three positions changes with the increasing filler content. The reason for this is the orientation and magnetization direction of the fillers in the mould. This was defined by the choice of permanent magnets and their preferred direction of 105° in the tool, with the slightly obtuse angle leading to an improvement and homogenization of the flux density in the cavity [11]. At the same time, this design mainly favours a homogeneous orientation in the large flux barrier, while an inhomogeneous orientation occurs in the small flux barrier. However, taking the application into account, the orientation in the small flux barrier is more favourable than in the large one, since in the large flux barrier the magnetic field of the fillers, as a result of the orientation, is conveniently perpendicular to the application. In the small flux barriers, the fillers have an orientation of 30° to 60°, which means that they are proportionally orientated in the direction of the application. Ideally, the real magnetic field direction should match the ideal orientation in the application and should, therefore, reveal the standard orientation of 0° or 180°. Accordingly, a higher magnetic flux density is produced in the small flux barriers (position II) and, in turn, the difference between the d and q-axis increases. A schematic representation of the orientation in the small and large flux barriers corresponding to the preferred direction of the permanent magnets in the mould, as well as the orientation relative to the application case, can be taken from Figure 9.
In general, the manufacturing of the rotors by filling the flux barriers with a hard magnetic compound leads to a deformation of the rotor towards an oval structure. As a result of the thin lamination in the area of the small and large flux barrier and the shrinkage behaviour of the material at positions I and II, the dimensions of the rotor are reduced and at the same time the rotor is widened at position III. In the following, the influence of the parameter variation on the concentricity is not discussed in detail, since the formation of an oval structure is caused by the manufacturing process. The exact impact on the structure cannot be reliably detected due to the high standard deviation.
3.2.2. Influence of the Tool Temperature Tt
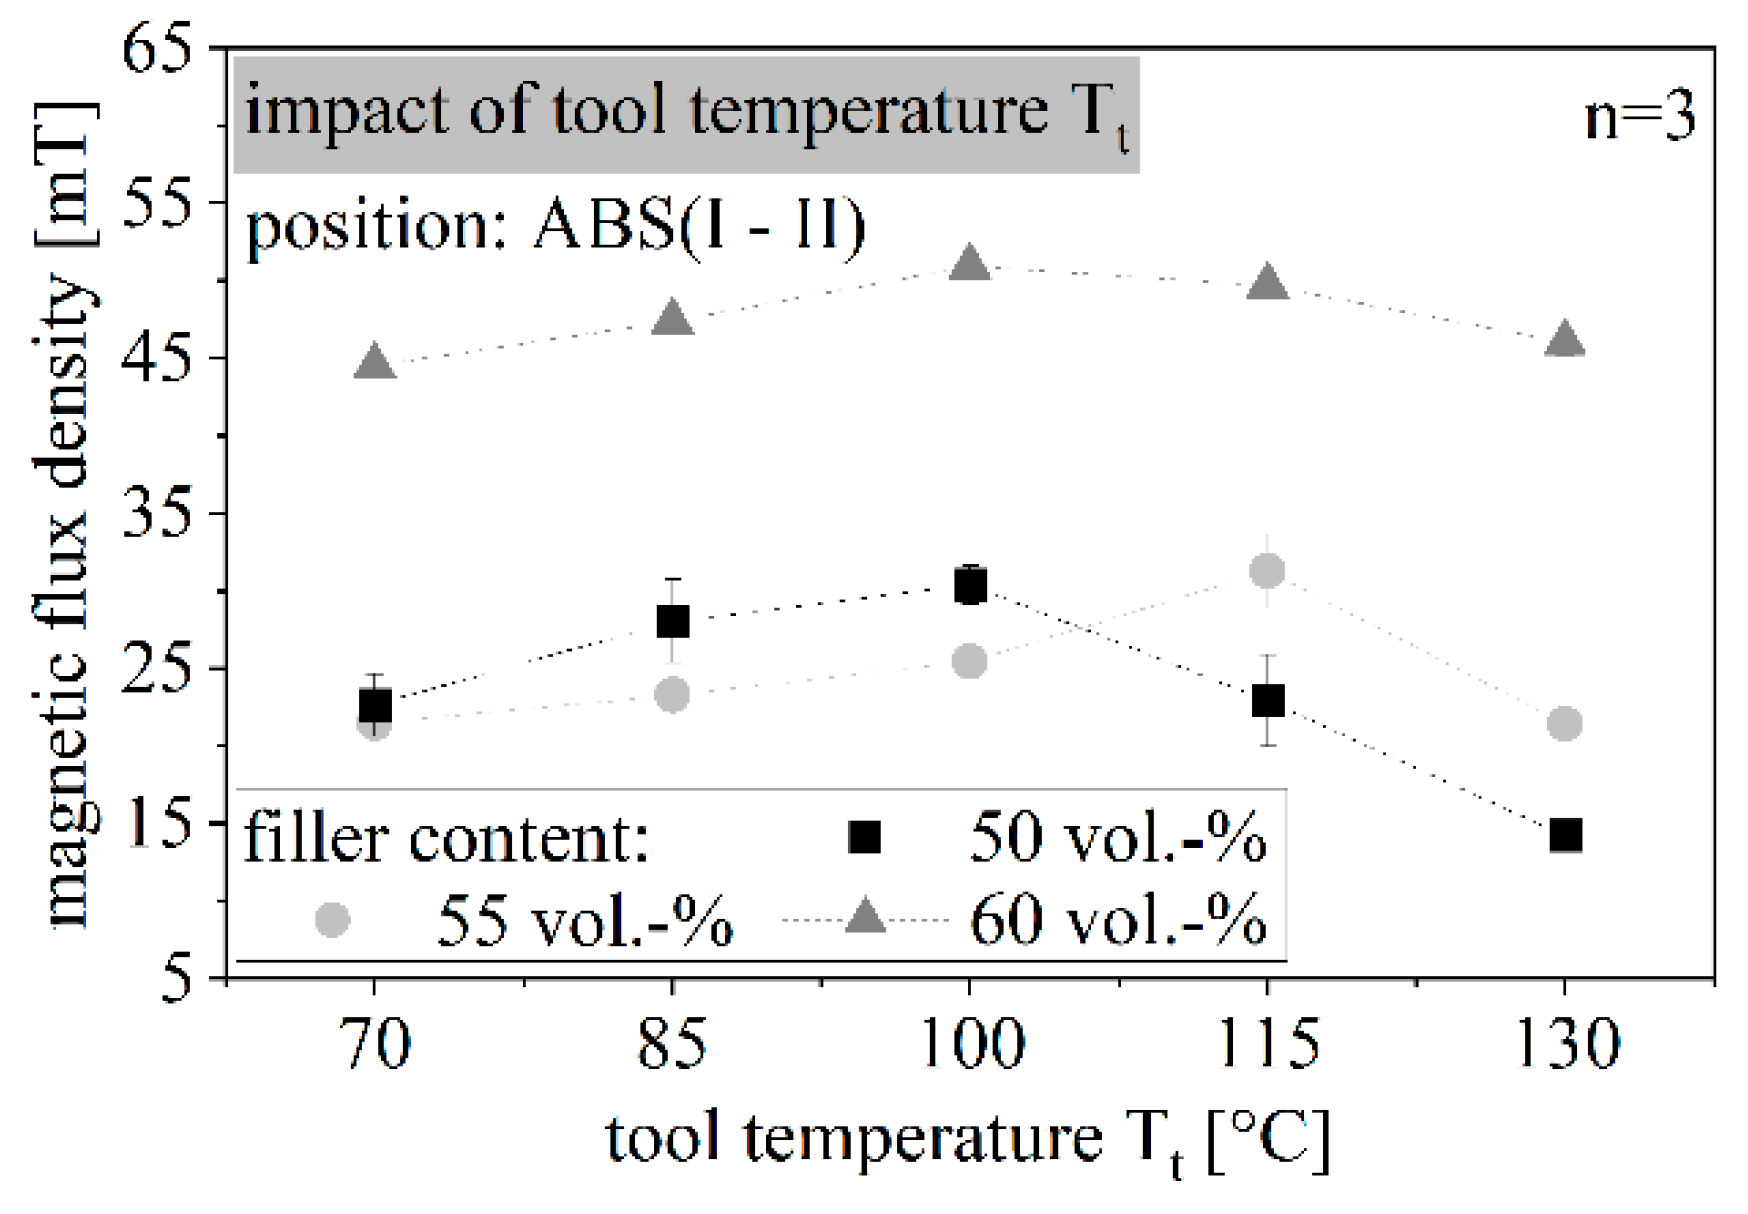
The impact of tool temperature Tt on the magnetic flux density relative to the filler content is shown in Figure 10 for the difference between the exemplar positions, I and II. Both the distinctions between I and II, as well as II and III, reveal similar behaviour. The magnetic flux density increases with higher tool temperature Tt and reaches its maximum at 100 °C for 50 vol.-% filler content and at 115 °C for 55 and 60 vol.-%. The magnetic flux density is further reduced by a tool temperature Tt of 130 °C and reaches a similar or lower magnetic flux density relative to tool temperature Tt of 70 °C. Again, the magnetic flux density is increased by higher filler contents, but the contents are similar for 50 and 55 vol.-% at a low tool temperature Tt.
The magnetic flux density is initially improved by increasing tool temperature Tt, since the smaller difference between the tool temperature Tt and the mass temperature Tm results in a slower cooling below the glass transition temperature Tg or the room temperature. Due to the higher temperatures, there is a higher molecular mobility, which favours the orientation of the fillers. This higher mobility is further depicted by the HKR measurement, as shown in Figure 7, and compensates the increase of the viscosity due to higher filler contents. At the same time, the time range in which the orientation takes place is extended. Aside from this, thermal crosslinking can occur in the matrix material, which varies depending on the filler content and the temperature. The additional crosslinking points lead to a reduction in the movement possibilities of the molecular chains, and thus hinder the orientability of the fillers. With respect to the reduction in the magnetic flux density, thermal crosslinking significantly hinders the filler contents of 55 vol.-% and higher above a temperature of 115 °C, while this already occurs at 100 °C at lower filler contents of 50 vol.-%. The thermal crosslinking is also evident from the DSC measurements, as a translocation of the peaks of the cooling behaviour occurs (compare Figure 5). This translocation is an indication of the thermal crosslinking in the material. However, an increasing filler content relocates the temperature at which cross linking reduces the magnetic flux density to a higher tool temperature Tt.
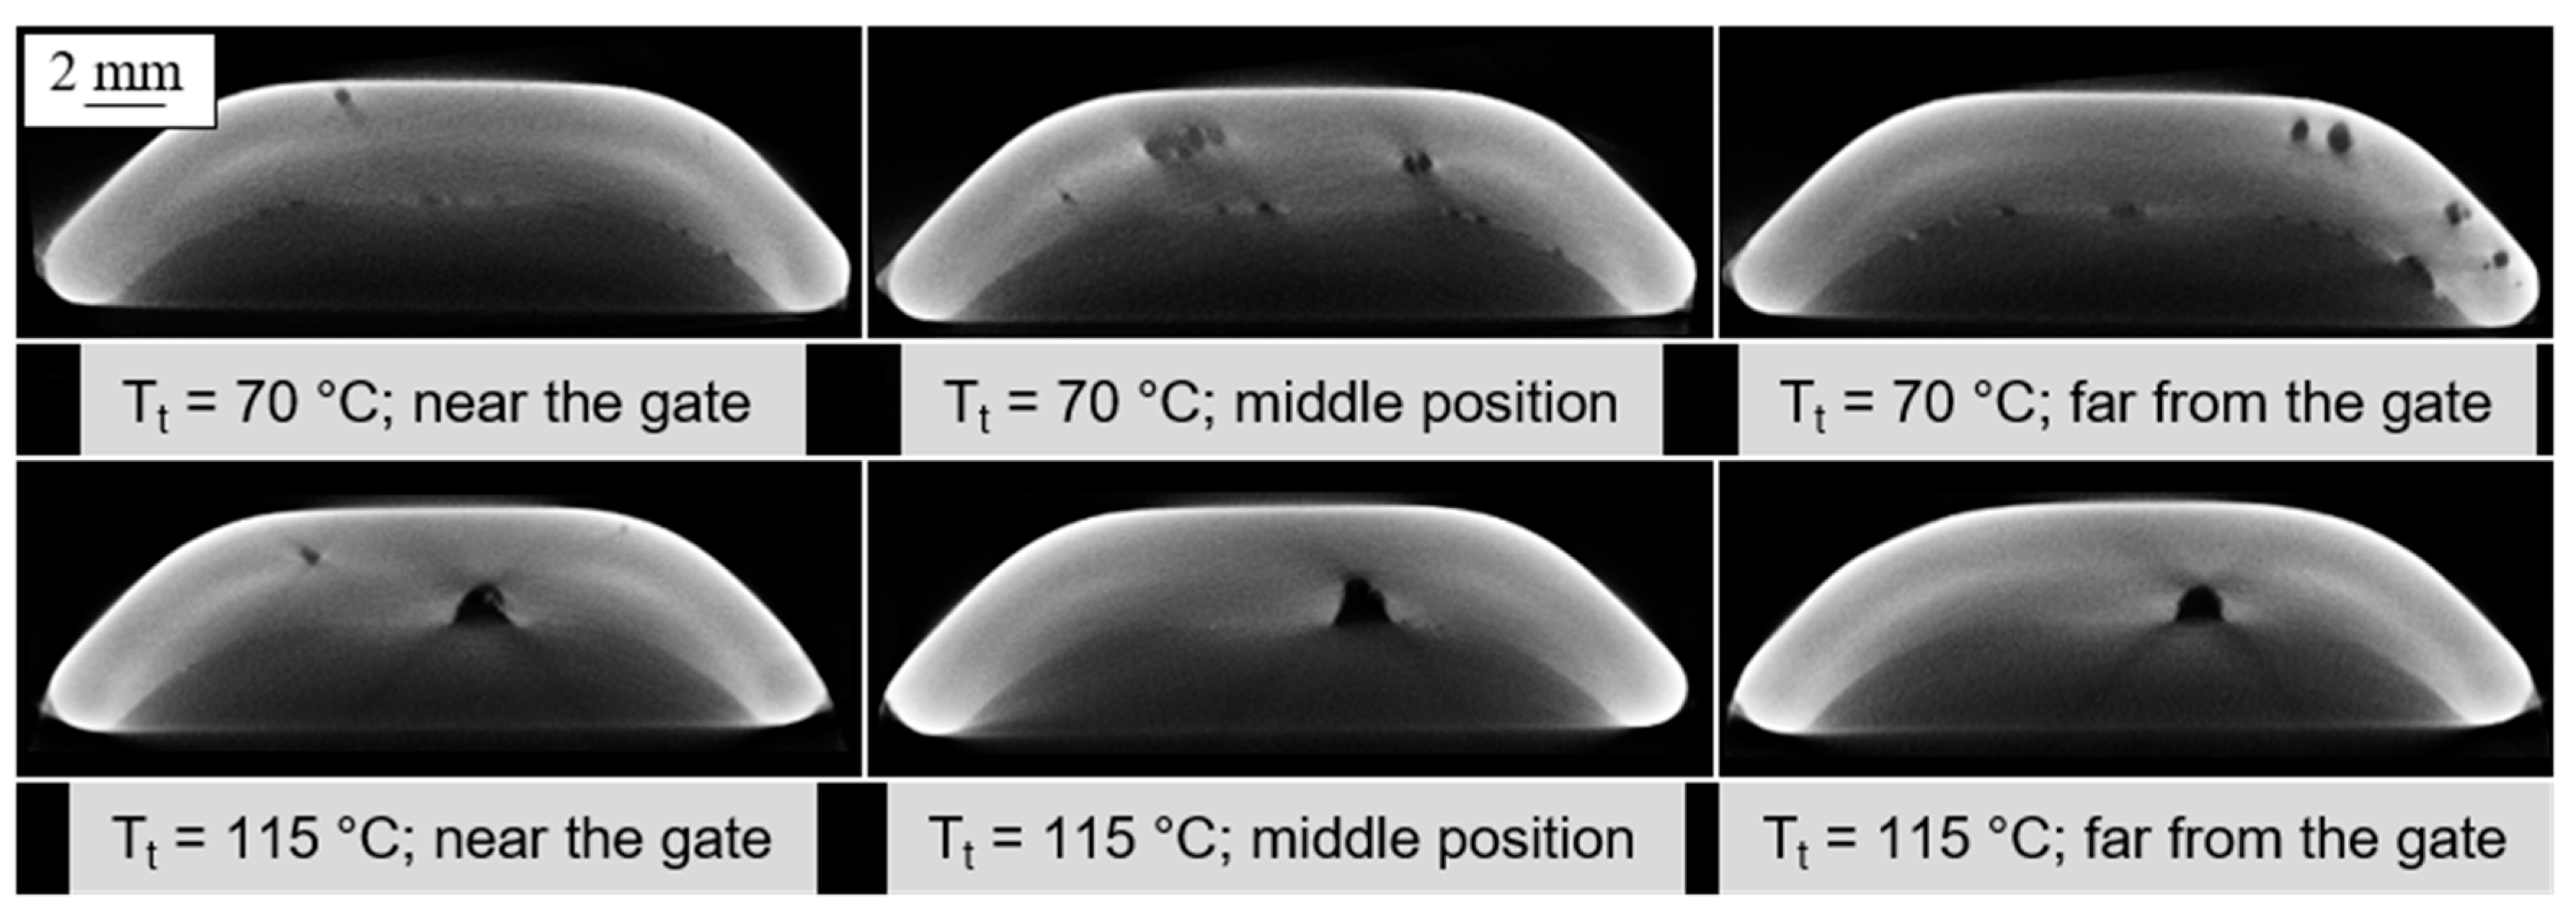
The computed tomographic investigations support the choice of a tool temperature Tt at 115 °C, since a microstructure without shrinkage cavities can be produced compared to the reference and low tool temperature Tt. As shown in Figure 11, blowholes occur in high numbers at low temperatures of 75 °C, especially in the small flux barrier, whereas this kind of defect is almost absent for a high tool temperature Tt of 115 °C. Figure 11 further reveals that the presence of the blowholes is independent of the position in the sample, and thus only influenced by tool temperature Tt.
Furthermore, the microscopic images also show that the use of a higher tool temperature Tt leads to a homogeneous microstructure with a slightly pronounced “liquid” core. Figure 12 shows the microscopic images for a filler content of 60 vol.-% at an unfavourable (75 °C) and favourable (115 °C) tool temperature Tt. This “liquid” core is caused by rapid cooling, especially in the surface layer, and is shown in the microscopic images by a bright inner region. This inner area portrays a section of non-solidification during fabrication. Due to the different conditions in the cooling, the microstructure differs from the outer region [14].
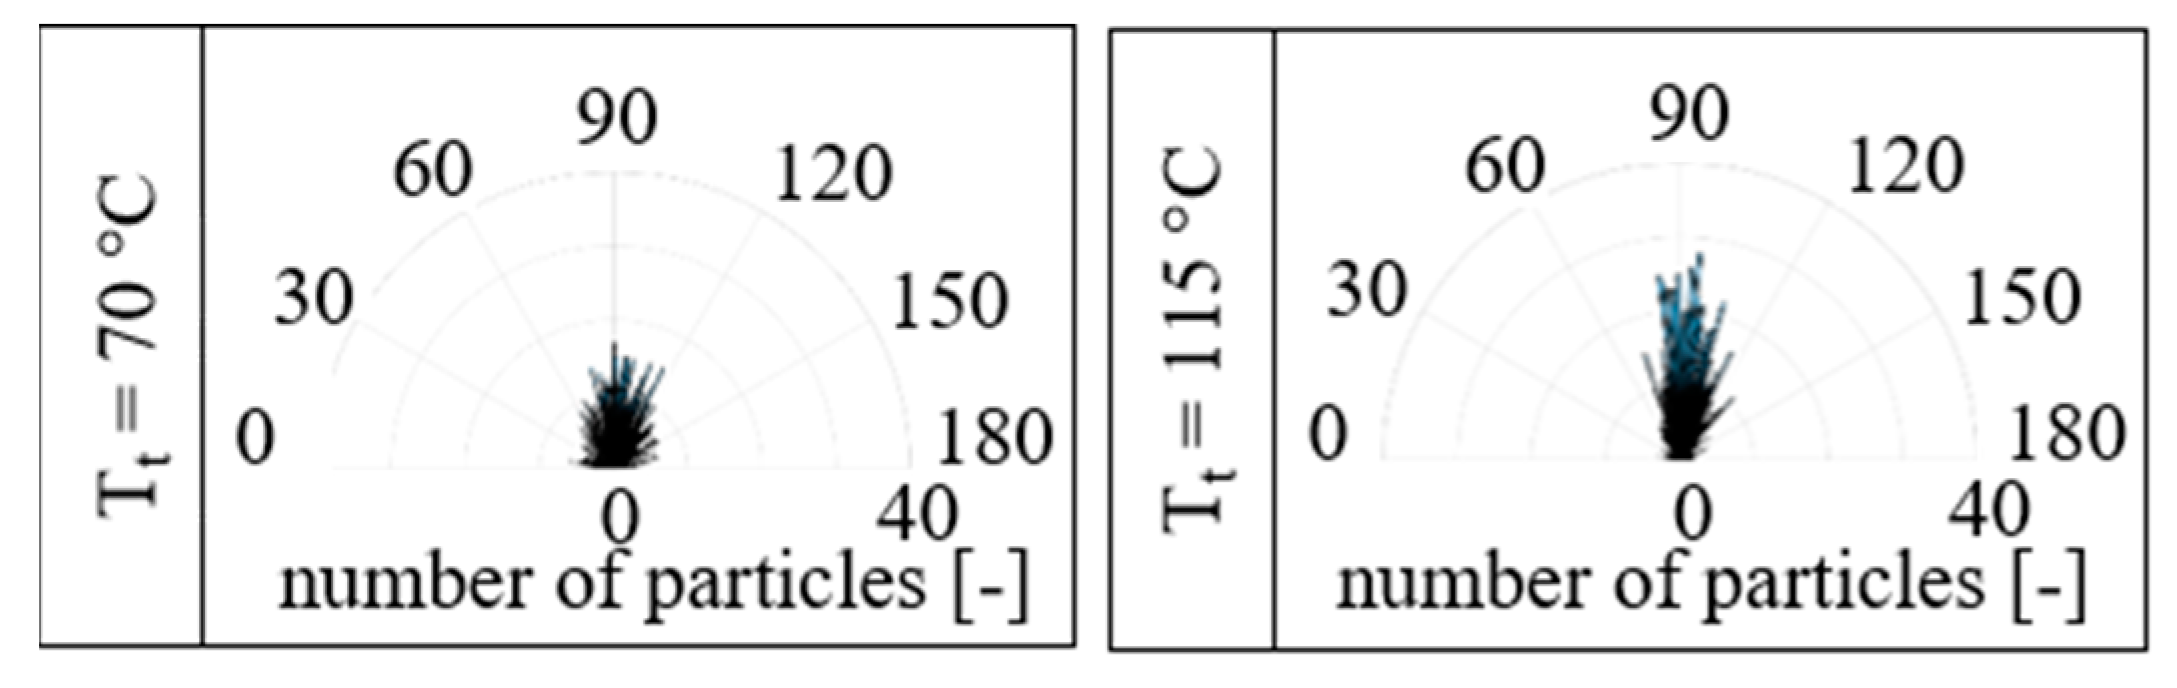
Aside from the microstructure of the sample, the orientation of the fillers is also influenced by the tool temperature Tt. As an example, Figure 13 shows the orientation at the stereo microscopy position A for a tool temperature Tt of 75 °C and 115 °C at a filler content of 60 vol.-%. At a low tool temperature Tt the orientation range is broad between 50° and 130°, whereas it is slimmer for a higher tool temperature Tt with a range between 80° and 110°.
A high tool temperature Tt favours the orientation in the flux barriers. It is assumed that the geometry of the cavity relative to the gating point influences the orientation of the positive fillers. At the same time, this leads to an improved microstructure. By increasing the tool temperature Tt, the flowability of the material is improved and the time for the orientation is increased. As a result, correspondingly higher magnetic flux densities are generated in the components. This effect is superimposed by thermal cross-linking and the corresponding hindrance of orientation at a high tool temperature Tt.
3.2.3. Influence of Holding Pressure ph
Figure 14 shows the impact of ph on the magnetic flux density relative to the filler content for the difference between, for example, position I and II. Both distinctions between I and II, as well as II and III, reveal similar behaviour. The magnetic flux density increases independent of the filler content with an increasing holding pressure of up to 300 bar. A higher ph significantly reduces the magnetic flux density. For a lower ph, the test samples with 55 vol.-% filler content reach a lower magnetic flux density relative to the filler content of 50 vol.-%. Above a ph of 300 bar, the samples with 55 vol.-% reach similar properties of samples with 60 vol.-%.
The limit for the holding pressure ph, up to which the magnetic flux density is improved depends on the filler content in the compound formulation. In general, an increasing filler content leads to a reduction in the holding pressure effect due to the lower proportion of compressible matrix material [12]. However, it must be taken into account that the ph can only act for a short time during the production of the rotors, because of the early freezing of the gate. Note that the glass transition temperature Tg in the filler range from 50 vol.-% to 60 vol.-% is not influenced by the filler content (see Figure 6). Above 300 bar, the glass transition temperature Tg is reached very quickly due to the existing temperature balance in the cavity, resulting in a low or magnetic flux density reducing the effect of the holding pressure. Furthermore, a high ph especially leads to a significant deformation of the rotors and even the thin webs in the area of the flow barriers being pressed out. This has a negative effect on the measurement results when they are determined on the test rig, since the proportion of sheet metal per position is changed, and thus no longer comparable with measurements for rotors without a change in the sheet metal structure. Within the geometry of the rotors, a lower ph can improve the magnetic flux density, contrary to the exisiting studies in the literature. A higher ph reduces the magnetic flux density, most likely due to a deformation of the rotor structure and position changes in the measurement set up.
The orientation of the fillers is shown in Figure 15 for a ph of 0, 300 and 600 bar at a filler content of 60 vol.-%. Independent of the pressure level, the orientation of the fillers is similar between 0° and 30°, as well as 150° and 180°. Therefore, the orientation is slim and within the range expected to be reached at the position E. Furthermore, Figure 15 shows the microscopic images for the ph of 0 bar and 600 bar. Due to a high ph, the formation of blowholes is fully reduced; the dimension of the “liquid” core is significantly reduced. The reduction in blowholes can further be seen in the computed tomographic investigations examples shown in Figure 15 for the large flux barriers and a ph of 0 bar and 600 bar at the middle position. Within the computed tomographic investigations, the amount of blowholes can be seen as independent from the position in the sample.
The holding pressure ph has no significant influence on the orientation of the fillers. The investigations on the orientation of the fillers at 300 bar and 600 bar show no improvement of these relative to the samples with no ph. Accordingly, at a high ph, the geometrical deformation of the inserts, but no disorientation, occurs. The reason for the low magnetic flux density at a low ph was, therefore, not the orientation of the fillers themselves, but the microstructure that was formed. Within the computed tomographic investigations, the number of blowholes can be seen independent of their position in the sample. The microstructure is significantly improved by the application of a holding pressure ph, since the formation of blowholes and the dimension of the “liquid” core is reduced. Due to the large number of blowholes in the samples with a holding pressure ph of 0 bar, the magnetic flux density is significantly reduced, with respect to the high air content in the sample, especially at the tips of the flux barrier (position A and B).
Accordingly, a maximum holding pressure ph of 300 bar in the rotors should be aimed for in order to be able to utilize the effect of the holding pressure. In this case, the orientation and the microstructure are not affected by a higher ph, and a high magnetic flux density can be achieved at the same time. However, it must be taken into account that selecting a ph that is too high will damage the rotor lamination and this should be avoided. The choice of a higher ph is attributed to the geometry relative to the gating system, which influences the orientation conditions and the positive effect of the holding pressure.
3.2.4. Influence of Injection Velocity vin
The impact of vin on the magnetic flux density relative to the filler content is shown in Figure 16, as an example of the difference between position I and II, as both distinctions between I and II, as well as II and III, reveal similar behaviour. Regardless of the filler content, the magnetic flux density increases from a lower to a medium vin and further decreases with a high vin. The level of the magnetic flux density additionally increases with a higher filler content. The value of the magnetic flux density reached with the low and high vin are similar.
The injection velocity vin has a clear influence on the magnetic flux density of the flux barriers since low and high vin reduce them significantly. It is assumed, that a high vin leads to a disorientation in the rotor as a result of the swirling of the fillers, and a low vin results in partial solidification, and thus an impediment to orientation, especially in the central edge regions (tip of the flux barrier). At the same time, this may lead to a more homogeneous microstructure, since the material can solidify slowly and uniformly and no additional shear heat is introduced as a result of high vin.
The orientation at the stereo microscopy position A and B is presented in Figure 17 in comparison for medium and high vin. At Position A the orientation is spread between 60° and 120° for a medium vin and between 30° and 150° for a high vin. The scattering of the orientation is similar at Position B where it is dispersed between 70° and 95° for a medium vin and without a clear preferred direction for a high vin. Further, Figure 17 depicts the microstructure in the rotor at a medium vin of 50 ccm/s and a high vin of 70 ccm/s. This microstructure exhibits no blowholes and a relatively small “liquid” core for a medium vin, whereas the blowholes are especially significant for a high vin.
The injection velocity vin has a significant effect on microstructure and orientation. The orientation in the outer tip region (stereo microscopy position B) is reduced due to partial cooling. With a high vin, blowholes are formed in the centre region around a small “liquid” core and a clear disorientation of the fillers is caused by swirling. For this reason, a medium vin of 50 ccm/s must be selected in order to reach the maximum of the magnetic flux density and, consequently, a small spread of orientation of the fillers and microstructure without blowholes.
4. Conclusions
After recent investigations dealt with new rotor concepts to enable the integration of polymer-bonded, permanent magnets into electric plate packages in the drive motors of the electromobility, this approach was transferred to a synchronous reluctance motor. Through the integration of polymer-bonded permanent magnets, the principles of action of the d- and q-axis were changed, which enlarged the difference between the two axes significantly. The investigations revealed the influence and the correlation between the process parameters, the material and mainly the viscosity, as well as the magnetic properties in terms of the magnetic flux density with respect to the fabrication of polymer-bonded, permanent magnetic flux barriers.
In general, a high filler content should be aimed for in the material in order to improve the magnetic flux density. In addition to the usage of additives, flowability should also be improved. The general temperature balance in the cavity must be considered, taking thermal crosslinking and damage into account. Furthermore, this behaviour is also influenced by the rotor geometry as a function of the temperatures. The holding pressure ph mainly affects the microstructure, whereas the magnetic flux density is also influenced by the formation of blowholes. However, the filler orientation is not influenced by the holding pressure ph. In particular, there is no disorientation of the fillers. Therefore, a high holding pressure ph should be aimed at in order to produce a favourable microstructure. However, it must be taken into account that a holding pressure ph that is too high can lead to a geometrical deformation of the rotors as a result of thin sheet areas breaking out. The injection velocity vin has a significant influence on the microstructure and orientation, and this also affects the magnetic flux density. A medium injection velocity vin must be achieved to prevent a partial premature cooling. However, depending on the geometry of the rotors, vin is limited, since an excessively high velocity leads to swirling of the fillers, and thus to their disorientation. The recommendations corresponding to a rotor geometry based on the investigations and the general material properties of viscosity and thermal conditions, as well as general advice, are summarized in Table 2. Note that the recommendations based on the investigations are clearly specified by a numerical value and depend on the material properties, the gating system and the rotor geometry, whereas the general advice is described with bracketed words and does not refer to a specific material or geometry.
The investigations show no significant influence by process parameters studied in the literature [1] such as the mass temperature Tm, which affects the magnetic flux density, as well as the orientation and the microstructure similar to the tool temperature Tt, but is less efficient in this regard. The known influencing factors are only based on simple geometries such as ring structures or plates and are therefore only partly transferable for complex rotor geometries. The examinations were further executed with a commercial compound. Therefore, the results of the main influencing factors can be transferred to independent materials and based on the new rotor geometry.
In general, the production of the rotors can cause them to have an oval structure as a result of the deformation in the injection moulding process. To avoid this deformation, the rotor laminations should be optimized, locally reinforced or supported by the tool. In addition, the thickness of the rotor lamination can be adjusted to consider of the local shrinkage behaviour. Furthermore, it was shown that the orientation in the small flux barriers is better suited to the application than that in the large flux barriers. The reason for this is that, in the large flux barrier, the magnetic field of the fillers is ideally perpendicular to the application as a result of the orientation. In the small flux barriers, the fillers have an orientation from 30° to 60°, which means that they are proportionally oriented in the direction of the application. This proportional orientation in the small flux barriers increases the magnetic flux density for the application. This must be taken into account in future designs of the tool for the production of rotors. In particular, the course and flux of the d-axis and the q-axis must also be considered in order to adapt them accordingly to the application. The separate orientation in the large and small flux barriers can further be considered, in order to optimize both areas separately in the alignment of the fillers. When designing the mould, especially with regard to the permanent magnets and the magnetic flux in the mould, it must be taken into account that a magnetic field mainly affects the orientation of the fillers in the central area, while the orientation of the fillers in the peripheral areas is caused by the flow conditions. Further research will be conducted on the improved outer magnetic field in terms of realising the appropriate orientation conditions for applications in both flux barriers.
Author Contributions
U.R.: Conceptualization, Methodology, Validation, Investigation, Writing—Original Draft, Visualization; D.D.: Writing—Review and Editing, Supervision, Project. All authors have read and agreed to the published version of the manuscript.
Funding
This work has been funded within the joint project HYDRESS with the funding code FKZ 03VNE2052D by Bundesministerium für Bildung und Forschung (BMBF) and VDI/VDE/IT and supervised by Projektträger Jülich. We want to thank the project partners and the project management, in particular the company Schliessmeyer GmbH for constant collaboration and production of the injection mould and fabrication of the parts.
Data Availability Statement
Restrictions apply to the availability of these data. The data were obtained from project partners within the project HYDRESS with the funding code FKZ 03VNE2052D and are available from the author with the permission of the project partners.
Acknowledgments
We want to thank the project partners and the project management of the joint project, HYDRESS, with the funding code FKZ 03VNE2052D, and, in particular, the company Schliessmeyer GmbH for constant collaboration and the production of the injection mould and fabrication of the parts.
Conflicts of Interest
The authors declare no conflict of interest. The funders had no role in the design of the study; in the collection, analyses, or interpretation of data; in the writing of the manuscript, or in the decision to publish the results.
References
- Drummer, D. Verarbeitung und Eigenschaften Kunststoffgebundener Dauermagnete. Ph.D. Thesis, University of Erlangen-Nuremberg, Erlangen, Germany, 2004. [Google Scholar]
- MS Schramberg GmbH & Co. KG, Umfassend. 2010. Available online: https://www.magnete.de/de.html (accessed on 26 October 2021).
- Brandstetter, F. Kunststoffe—Ein reifes Arbeitsgebiet? Kunstst. —Werkst. Verarb. Anwend. 2004, 8, 20–23. [Google Scholar]
- Hering, E.; Martin, R.; Stohrer, M. Physik für Ingenieure, 12th ed.; Springer Vieweg: Berlin, Germany, 2016. [Google Scholar]
- Otaigbe, J.U.; Kim, H.S.; Xiao, J. Effect of Coupling Agent and Filler Particle size on melt rheology of polxmer-bonded Nd-Fe-B Magnets. Polym. Compos. 1999, 20, 607–704. [Google Scholar] [CrossRef]
- Oniku, O.D.; Arnold, D.P. High-Energy-Density Permanent Micromagnets Formed from Heterogeneous Magnetic Powder Mixtures. In Proceedings of the 25th International Conference on Micro Electro Machanical Systems (MEMS), Paris, France, 29 January–2 February 2012. [Google Scholar]
- Buchert, M.; Manhart, A.; Suttler, J. Untersuchung zu Seltenen Erden: Permanentmagnete im Industriellen Einsatz in Baden-Württemberg; Öko-Institut eV: Freiburg, Germany, 2014. [Google Scholar]
- Axel Jack Metayer, Asynchronmotor. 2020. Available online: https://www.kfz.net/autolexikon/asynchronmotor/ (accessed on 7 May 2020).
- Jens Kleinholz, Der Drehstrom-Asynchronmotor: Der am Häufigsten Gebaute Elektromotor der Welt. 2010. Available online: https://www.elektro-motoren.org/drehstrom-asynchronmotor/ (accessed on 7 May 2020).
- Brosch, P.F. Die Hochwirkungsgrad-Alternative zum Asychronmotor: IE4-Sychron-Reluktanzmotor. 2016. Available online: https://www.elektrotechnik.vogel.de/die-hochwirkungsgrad-alternative-zum-asynchronmotor-a-403655/ (accessed on 13 July 2020).
- Dolgirev, J.; Kalter, M.; Urschel, S.; Funck, R.; Jung, J.; Schimmelpfennig, V. Resource-saving Cirulating Pump on basis of an Integrated Synchronous-Reluctance Drive System. In Proceedings of the IEEE 4th International Future Energy Electronics Conference (IFEEC), Singapore, 25–28 November 2019; pp. 1–7. [Google Scholar]
- Kurth, K. Zum Spritzgießen Polorientierter Kunststoffgebundener Dauermagnete. Ph.D. Thesis, University of Erlangen-Nuremberg, Erlangen, Germany, 2019. [Google Scholar]
- Rösel, U.; Drummer, D.; Köjer, M. Production of an injection molding tool for the production of flow barriers from plastic-bound permanent magnets in a synchronous reluctance motor. Mater. Manuf. 2021. [Google Scholar]
- Baur, E.; Brinkmann, S.; Osswald, T.; Rudoplh, N.; Schmachtenberg, E. Saechtling Kunststoff Taschenbuch, 31st ed.; Carl Hanser Verlag: München, Germany, 2013. [Google Scholar]
Figure 1.
Geometry of the rotor (A) and positions at the rotor circumference for defined evaluation (B).
Figure 1.
Geometry of the rotor (A) and positions at the rotor circumference for defined evaluation (B).

Figure 2.
Schematic setup of the test rig for determining the magnetic flux density on the rotors.

Figure 3.
Distribution of the d-axis and q-axis according to the evaluation criteria of the magnetic flux density and corresponding to the position in the rotor (A) in comparison to the general route of the magnetic flux density of the rotor (B).
Figure 3.
Distribution of the d-axis and q-axis according to the evaluation criteria of the magnetic flux density and corresponding to the position in the rotor (A) in comparison to the general route of the magnetic flux density of the rotor (B).

Figure 4.
Positions for the evaluation of the orientation of the fillers and the corresponding scatter width of the histogram for the preferred and reduced orientation.
Figure 4.
Positions for the evaluation of the orientation of the fillers and the corresponding scatter width of the histogram for the preferred and reduced orientation.

Figure 5.
Extract of the cooling behaviour according to a DSC measurement for a filler content of 50, 55 and 60 vol.-% and enthalpy values.
Figure 5.
Extract of the cooling behaviour according to a DSC measurement for a filler content of 50, 55 and 60 vol.-% and enthalpy values.

Figure 6.
Glass transition behaviour relative to pressure steps for a filler content of 50, 55 and 60 vol.-% and in comparison to the example of the temperature range of crystallization for 50 vol.-% by DSC.
Figure 6.
Glass transition behaviour relative to pressure steps for a filler content of 50, 55 and 60 vol.-% and in comparison to the example of the temperature range of crystallization for 50 vol.-% by DSC.

Figure 7.
Shear viscosity for a filler content of 55 vol.-% and 60 vol.-% at three different temperature levels and relevant shear rate range for injection moulding relative to [14].
Figure 7.
Shear viscosity for a filler content of 55 vol.-% and 60 vol.-% at three different temperature levels and relevant shear rate range for injection moulding relative to [14].

Figure 8.
Magnetic flux density as a function of the compound formulation and filler orientation in small and large flux barrier, for example, at position C for 55 and 60 vol.-% filler content.
Figure 8.
Magnetic flux density as a function of the compound formulation and filler orientation in small and large flux barrier, for example, at position C for 55 and 60 vol.-% filler content.

Figure 9.
Schematic representation of filler orientation in the small and large flux barrier relative to the ideal magnetic field direction for application and in the mould.
Figure 9.
Schematic representation of filler orientation in the small and large flux barrier relative to the ideal magnetic field direction for application and in the mould.

Figure 10.
Magnetic flux density as a function of the tool temperature Tt relative to the filler content of between 50 and 60 vol.-%.
Figure 10.
Magnetic flux density as a function of the tool temperature Tt relative to the filler content of between 50 and 60 vol.-%.

Figure 11.
Computed tomographic images at different positions in the test sample for tool temperature Tt of 70 and 115 °C with a filler content of 60 vol.-%.
Figure 11.
Computed tomographic images at different positions in the test sample for tool temperature Tt of 70 and 115 °C with a filler content of 60 vol.-%.

Figure 12.
Microscopic image of the large flux barriers centred at an unfavourable (left) and a favourable (right) tool temperature Tt for 60 vol.-% filler content.
Figure 12.
Microscopic image of the large flux barriers centred at an unfavourable (left) and a favourable (right) tool temperature Tt for 60 vol.-% filler content.

Figure 13.
Comparison of filler orientation in the large flux barrier under the influence of tool temperature Tt (70 °C and 115 °C) with 60 vol.-% filler content at stereo microscopy position A.
Figure 13.
Comparison of filler orientation in the large flux barrier under the influence of tool temperature Tt (70 °C and 115 °C) with 60 vol.-% filler content at stereo microscopy position A.

Figure 14.
Magnetic flux density as a function of the holding pressure ph relative to the filler content between 50 and 60 vol.-%.
Figure 14.
Magnetic flux density as a function of the holding pressure ph relative to the filler content between 50 and 60 vol.-%.

Figure 15.
Comparison of the filler orientation in the large flux barrier relative to the holding pressure ph for filler content of 60 vol.-% at stereo microscopy position E and microscopic images, as well as computed tomographic investigations in the centre at low ph (0 bar) and high ph (600 bar).
Figure 15.
Comparison of the filler orientation in the large flux barrier relative to the holding pressure ph for filler content of 60 vol.-% at stereo microscopy position E and microscopic images, as well as computed tomographic investigations in the centre at low ph (0 bar) and high ph (600 bar).

Figure 16.
Magnetic flux density as a function of the injection velocity vin relative to the filler content between 50 and 60 vol.-%.
Figure 16.
Magnetic flux density as a function of the injection velocity vin relative to the filler content between 50 and 60 vol.-%.

Figure 17.
Comparison of filler orientation in large flux barrier relative to the injection velocity vin for filler content of 60 vol.-% at stereo microscopy position A and B; microscopic images in the centre.
Figure 17.
Comparison of filler orientation in large flux barrier relative to the injection velocity vin for filler content of 60 vol.-% at stereo microscopy position A and B; microscopic images in the centre.


Table 1.
Process parameter overview for the fabrication of rotors with self-produced compounds based on PA 12 and a filler content of 50, 55 and 60 vol.-% SrFeO.
Table 1.
Process parameter overview for the fabrication of rotors with self-produced compounds based on PA 12 and a filler content of 50, 55 and 60 vol.-% SrFeO.
| Process Parameter | - - - | - - | - | 0 | + | + + | + + + |
|---|---|---|---|---|---|---|---|
| Tool temperature Tt [°C] | 70 | 85 | 100 | 115 | 130 | ||
| Holding pressure ph [bar] | 0 | 100 | 200 | 300 | 400 | 500 | |
| Injection velocity vin [ccm/s] | 30 | 50 | 70 |
Table 2.
Recommendations for important process parameters and settings in the fabrication of rotors.
Table 2.
Recommendations for important process parameters and settings in the fabrication of rotors.
| Process Parameter | Recommendation |
|---|---|
| Filler content | 60 (high) |
| Tool temperature Tt [°C] | 115 (high, but limited by thermal crosslinking and damage) |
| Holding pressure ph [bar] | 300 (high, but limited by geometrical deformation) |
| Injection veolcity vin [ccm/s] | 50 (medium) |
Publisher’s Note: MDPI stays neutral with regard to jurisdictional claims in published maps and institutional affiliations. |
© 2021 by the authors. Licensee MDPI, Basel, Switzerland. This article is an open access article distributed under the terms and conditions of the Creative Commons Attribution (CC BY) license (https://creativecommons.org/licenses/by/4.0/).
Share and Cite
MDPI and ACS Style
Rösel, U.; Drummer, D. Injection Moulding of Multipolar Polymer-Bonded Magnets into Soft Magnetic Inserts for Rotors in Reluctance Motors. Magnetism 2021, 1, 3-21. https://0-doi-org.brum.beds.ac.uk/10.3390/magnetism1010002
AMA Style
Rösel U, Drummer D. Injection Moulding of Multipolar Polymer-Bonded Magnets into Soft Magnetic Inserts for Rotors in Reluctance Motors. Magnetism. 2021; 1(1):3-21. https://0-doi-org.brum.beds.ac.uk/10.3390/magnetism1010002
Chicago/Turabian StyleRösel, Uta, and Dietmar Drummer. 2021. "Injection Moulding of Multipolar Polymer-Bonded Magnets into Soft Magnetic Inserts for Rotors in Reluctance Motors" Magnetism 1, no. 1: 3-21. https://0-doi-org.brum.beds.ac.uk/10.3390/magnetism1010002