Article

Serum Metabolic Profiling Identifies Key Differences between Patients with Single-Ventricle Heart Disease and Healthy Controls

by
Julie Pires da Silva
1,
Ashley E. Pietra
2,
Angela N. Baybayon-Grandgeorge
1 and
Anastacia M. Garcia
2,*
1
Department of Medicine, Division of Cardiology, University of Colorado Anschutz Medical Campus, Aurora, CO 80045, USA
2
Department of Pediatrics, Section of Cardiology, University of Colorado Anschutz Medical Campus, Children’s Hospital Colorado, Aurora, CO 80045, USA
*
Author to whom correspondence should be addressed.
Int. J. Transl. Med. 2022, 2(1), 78-96; https://0-doi-org.brum.beds.ac.uk/10.3390/ijtm2010008
Submission received: 13 December 2021 / Revised: 17 February 2022 / Accepted: 18 February 2022 / Published: 23 February 2022
(This article belongs to the Special Issue Biomarker Discovery in Medical and Health Contexts Using Metabolomics)

Abstract

:
There are growing numbers of infants and children living with single-ventricle congenital heart disease (SV). However, cardiac dysfunction and, ultimately, heart failure (HF) are common in the SV population and the ability to predict the progression to HF in SV patients has been limited, primarily due to an incomplete understanding of the disease pathogenesis. Here, we tested the hypothesis that non-invasive circulating metabolomic profiles can serve as novel biomarkers in the SV population. We performed systematic metabolomic and pathway analyses on a subset of pediatric SV non-failing (SVNF) and failing (SVHF) serum samples, compared with samples from biventricular non-failing (BVNF) controls. We determined that serum metabolite panels were sufficient to discriminate SVHF subjects from BVNF subjects, as well as SVHF subjects from SVNF subjects. Many of the identified significantly dysregulated metabolites were amino acids, energetic intermediates and nucleotides. Specifically, we identified pyruvate, palmitoylcarnitine, 2-oxoglutarate and GTP as promising circulating biomarkers that could be used for SV risk stratification, monitoring response to therapy and even as novel targets of therapeutic intervention in a population with few other options.

1. Introduction

Due to enhanced surgical interventions, better long-term care and improved treatment of late sequelae, the population of children and young adults living with congenital heart disease (CHD) is on the rise. The survival benefit is most striking in patients with complex lesions, such as those with single-ventricle congenital heart disease (SV), and it is estimated that there are about 1.6 per 10,000 children and young adults living with SV physiology today [1]. CHD with SV physiology encompasses a group of severe abnormalities in the cardiac structure, characterized by underdevelopment of one side of the heart, resulting in a univentricular circulation. SV patients have a higher risk of mortality than patients with any other CHD and patients with a systemic right ventricle (RV) in particular, such as those with hypoplastic left heart syndrome (HLHS), represent the most common SV sub-type and tend to have worse outcomes [2,3,4,5,6,7,8,9,10,11]. However, while survival of SV has improved, progressive ventricular dysfunction and ultimate heart failure remain both a common cause of death and indication for cardiac transplantation in this population [12,13,14,15]. Moreover, the increased survival of infants and children with SV results in a growing number of patients at risk for this atypical form of heart failure (HF) and prototypical pharmacological HF therapies have been largely ineffective in mitigating the need for cardiac transplantation [1,2,3,4]. In fact, SV patients are the most rapidly growing group of young patients presenting for heart transplantation in the recent era [16]. Unfortunately, however, the ability to predict HF in SV patients has been limited, primarily due to an incomplete understanding of the disease pathogenesis. Therefore, there is an unmet need to identify predictive and prognostic biomarkers that can provide both a rational basis for treatment and a better understanding of risk stratification and HF progression in the SV population.
Metabolites are small molecules that represent biological processes and can influence cell responses locally or systemically. Additionally, metabolites may provide important insights into the mechanisms that underlie disease-related processes and disease progression. The global systematic quantification of metabolites, known as metabolomics, is an emerging -omic technology that has received more attention after the development of transcriptomics, proteomics and genomics [17]. A metabolomic analysis provides a detailed characterization of metabolic phenotypes that can enable the identification of metabolic derangements associated with disease, discovery of new therapeutic targets and identification of biomarkers that may be used for diagnostic purposes or to monitor response to therapy. Additionally, metabolites have the potential to be used individually (i.e., specific metabolites) or in combination to provide a metabolic signature of the disease. However, while metabolomics methods have been applied to an increasing number of disease etiologies with prognostic implications, there is only limited application of this technology in patients with SV [18,19] and even fewer in high-risk young patients with a systemic RV [20].
Because the adaptations of the RV are not tailored to support the high-pressure systemic circulation, patients with SV of RV morphology are at particularly increased risk of morbidity and mortality [2,3,4,5,6,7,8,9,10,11] and may be uniquely vulnerable to metabolic changes in energy generation and utilization. In fact, patients with SV have significantly decreased exercise tolerance [21], further suggesting their inability to modulate metabolic demand appropriately. Therefore, patients with a systemic RV in particular are the focus of this study. We performed an untargeted metabolomic analysis on serum from a cohort of non-failing SV subjects (SVNF; n = 5) and SV subjects with heart failure (HF) (SVHF; n = 5), compared with normal biventricular non-failing controls (BVNF; n = 5). We determined that distinct circulating metabolite profiles discriminated SVNF and SVHF subjects from the controls. Moreover, based on a statistical biomarker assessment, we determined that circulating serum metabolites could be a viable non-invasive tool with potential predictive diagnostic and prognostic value. These findings may assist in the risk stratification of SV patients, may serve as valuable measures in response to therapy/intervention and may help identify novel therapeutic targets for the treatment of SVHF.

2. Materials and Methods

2.1. Study Cohort

The subjects or guardians of subjects less than 18 years of age included in this study gave written informed consent prior to inclusion in the study and donated their hearts to the Institutional Review Board-approved pediatric biobank at the University of Colorado Denver-Anschutz Medical Campus. The subjects included in this study were males and females of all ethnic backgrounds, less than 18 years of age. Samples from BVNF subjects originated from normal NF patients with preserved cardiac structure and function (EF > 50%). All SV subjects had single-ventricle hearts of right ventricular morphology. Non-failing SV subjects included in this study were patients with SV with normal cardiac function and free from any overt HF symptoms. Failing SV subjects included in this study were patients with overt systolic HF, defined as decreased RV systolic function on transthoracic echocardiogram.

2.2. Blood Processing

Between 3 and 5mL of whole blood was collected in a Red-Top anticoagulant-free tube (Fisher Scientific, Waltham, MA, USA). The samples were incubated for 30 min at room temperature and centrifuged at 600× g, at 4 °C for 20 min to separate serum. Freshly isolated sera were snap-frozen and stored at −80 °C for future analyses.

2.3. Metabolomic Analyses

Serum samples were used for untargeted metabolomics performed by University of Colorado Metabolomics Core Facility via ultra-high pressure liquid chromatography coupled to online mass spectrometry (UHPLC-MS), as described previously [22,23]. Briefly, samples were extracted in ice-cold lysis/extraction buffer (methanol:acetonitrile:water 5:3:2) at 1:25 dilution. Samples were then agitated at 4 °C for 30 min and then centrifuged at 10,000 g for 15 min at 4 °C. Protein and lipid pellets were discarded, while supernatants were stored at −80 °C prior to metabolomic analyses. Sample extracts were injected into a UPLC system (Ultimate 3000; Thermo, San Jose, CA, USA) and run on a Kinetex XB-C18 column (150 × 2.1 mm and 1.7 μm particle size; Phenomenex, Torrance, CA, USA) at 250 μL/min (mobile phase, 5% acetonitrile; Sigma-Aldrich, St. Louis, MO, USA), 95% 18 mΩ H2O (Sigma-Aldrich, St. Louis, MO, USA) and 0.1% formic acid (Sigma-Aldrich, St. Louis, MO, USA). The UPLC system was coupled online with a QExactive system (Thermo, San Jose, CA, USA), scanning in Full MS mode (2 μscans) at a 70,000 resolution in the 60–900 m/z range, 4 kV spray voltage, 15 sheath gases and 5 auxiliary gases, operated in negative- and then positive-ion mode (separate runs). Calibration was performed before each analysis against positive- or negative-ion mode calibration mixes (Piercenet; Thermo Fisher, Rockford, IL, USA) to ensure subparts per million error of the intact mass. Metabolite assignments were performed using Maven software [5] (Princeton, NJ, USA), upon conversion of .raw files into .mzXML format through MassMatrix (Cleveland, OH, USA). Such software allows peak picking, feature detection and metabolite assignment against the KEGG pathway database to be conducted. Assignments were further confirmed against chemical formula determination (as gleaned from isotopic patterns and accurate intact mass) and retention times against an in-house validated standard library (>650 compounds, including various metabolites, amino acids and acylcarnitines) (Sigma-Aldrich, St. Louis, MO, USA; MLSMS, IROATech, Bolton, MA, USA). Relative quantitation was performed by exporting integrated peak area values into Excel (Microsoft, Redmond, CA, USA) for statistical analyses.

2.4. Data Integration and Statistical Analyses

Significant changes in metabolite expression between any two groups were calculated using Welch’s t-test, p < 0.05. Data integration, statistical analyses and visualization were carried out using the R-based platform, MetaboAnalyst 5.0 [24,25,26]. Differentially regulated metabolites were subjected to canonical pathway and network analyses using MetaboAnalyst 5.0 [24,25,26]. Given the small sample size, adjusted p-values were not used.
Both classical univariate receiver operating characteristic (ROC) analyses and multivariate exploratory ROC analyses were performed using MetaboAnalyst 5.0 [24,25,26]. Classical univariate ROC curve analyses were used to generate ROC curves and to calculate the area under the ROC curve (AUROC), as well as their 95% confidence intervals for individual biomarkers. For the multivariate analysis, ROC curves were generated by Monte Carlo cross-validation (MCCV) using balanced sub-sampling. In each MCCV, two-thirds (2/3) of the samples were used to evaluate the feature importance. The top 2, 3, 5, 10…100 (max) important features were then used to build classification models, which were validated on the 1/3 of samples that was left out. The procedure was repeated multiple times to calculate the performance and confidence interval of each model. A linear support vector machine (SVM) was used for classification, while features were ranked based on the T-statistic.

3. Results

3.1. Patient Characteristics

The aggregate characteristics for patients included in this study are listed in Table 1. This study included five young patients with normal cardiac structure and function (BVNF; n = 5), five young SV patients with no symptoms of heart failure (SVNF; n = 5) and five young SV patients with systolic heart failure and required transplant (SVHF; n = 5). The BVNF group had a median age of 5.4 years, an interquartile range (IQR) of 4.1–5.6 and 80% were male. The SVNF group had a median age of 0.6 years, an IQR of 0.3–1.8 and 40% were male. The SVHF tissue group had a median age of 3.9 years, an IQR of 2.8–12.3 and 40% were male. There were no significant differences in age in the BVNF vs. the SVHF groups (p > 0.99) or the SVNF vs. the SVHF groups (p = 0.15); however, the SVNF patients were significantly younger than the BVNF cohort (p = 0.02).

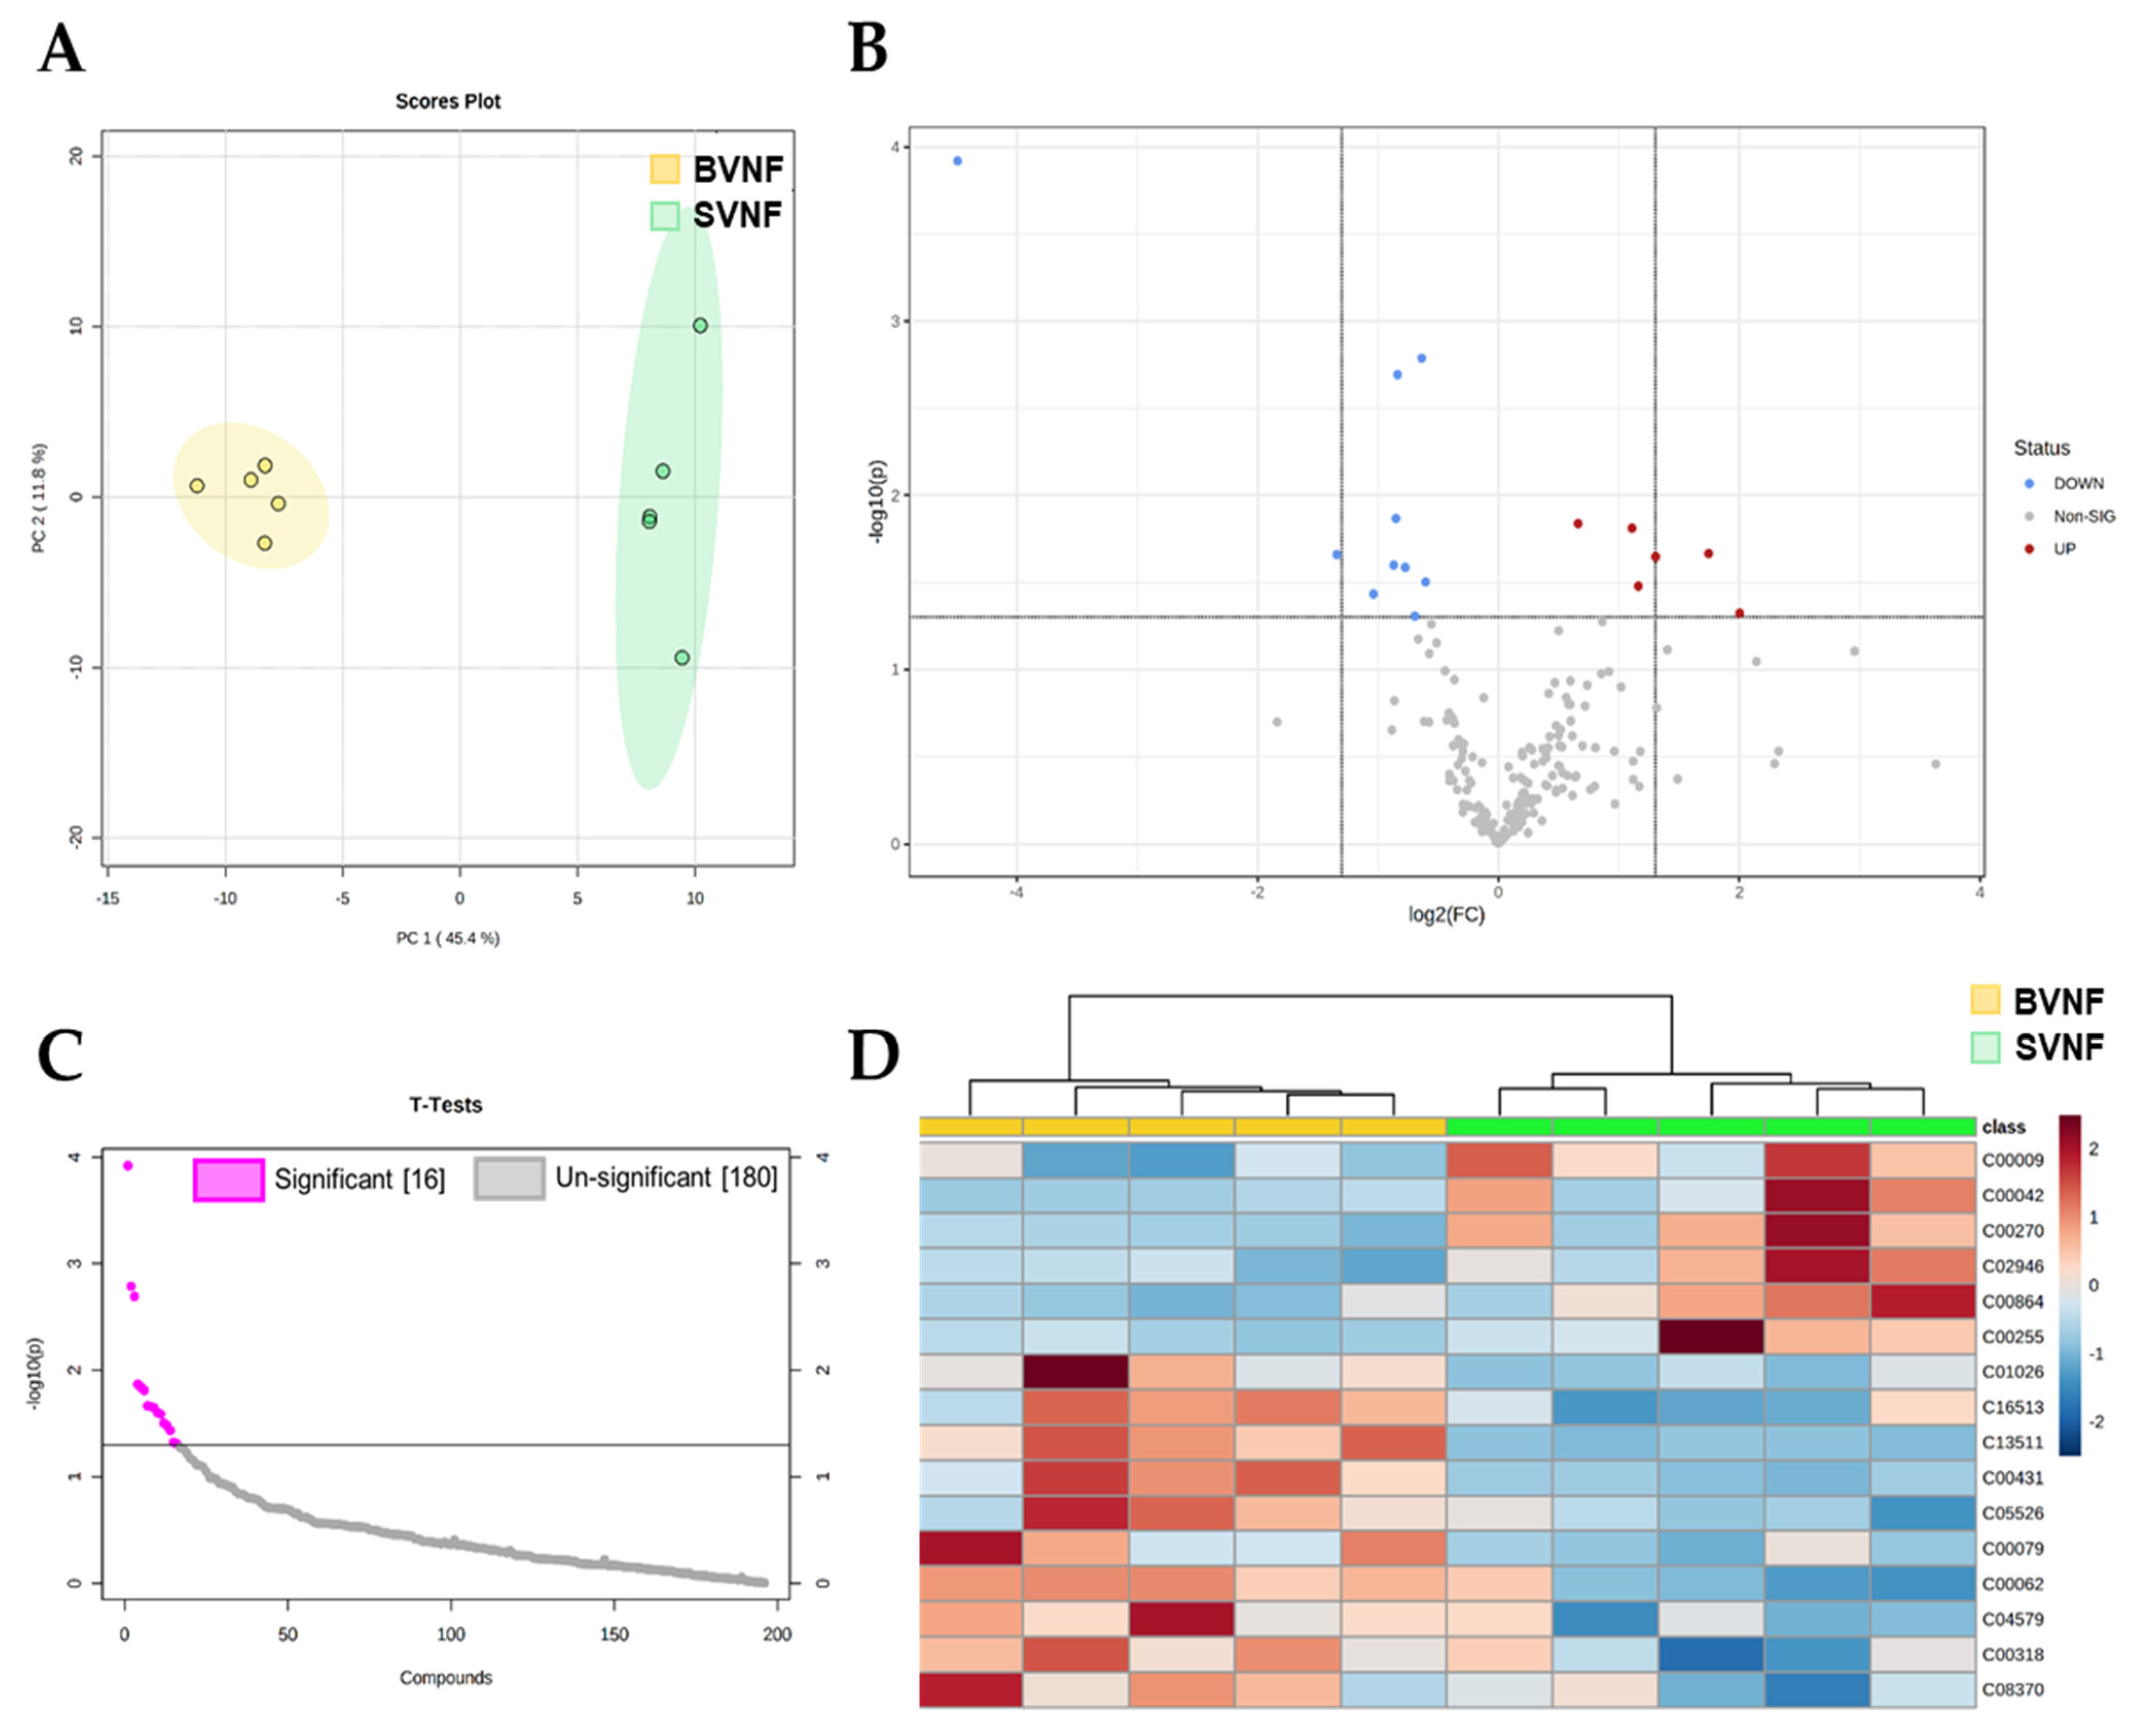
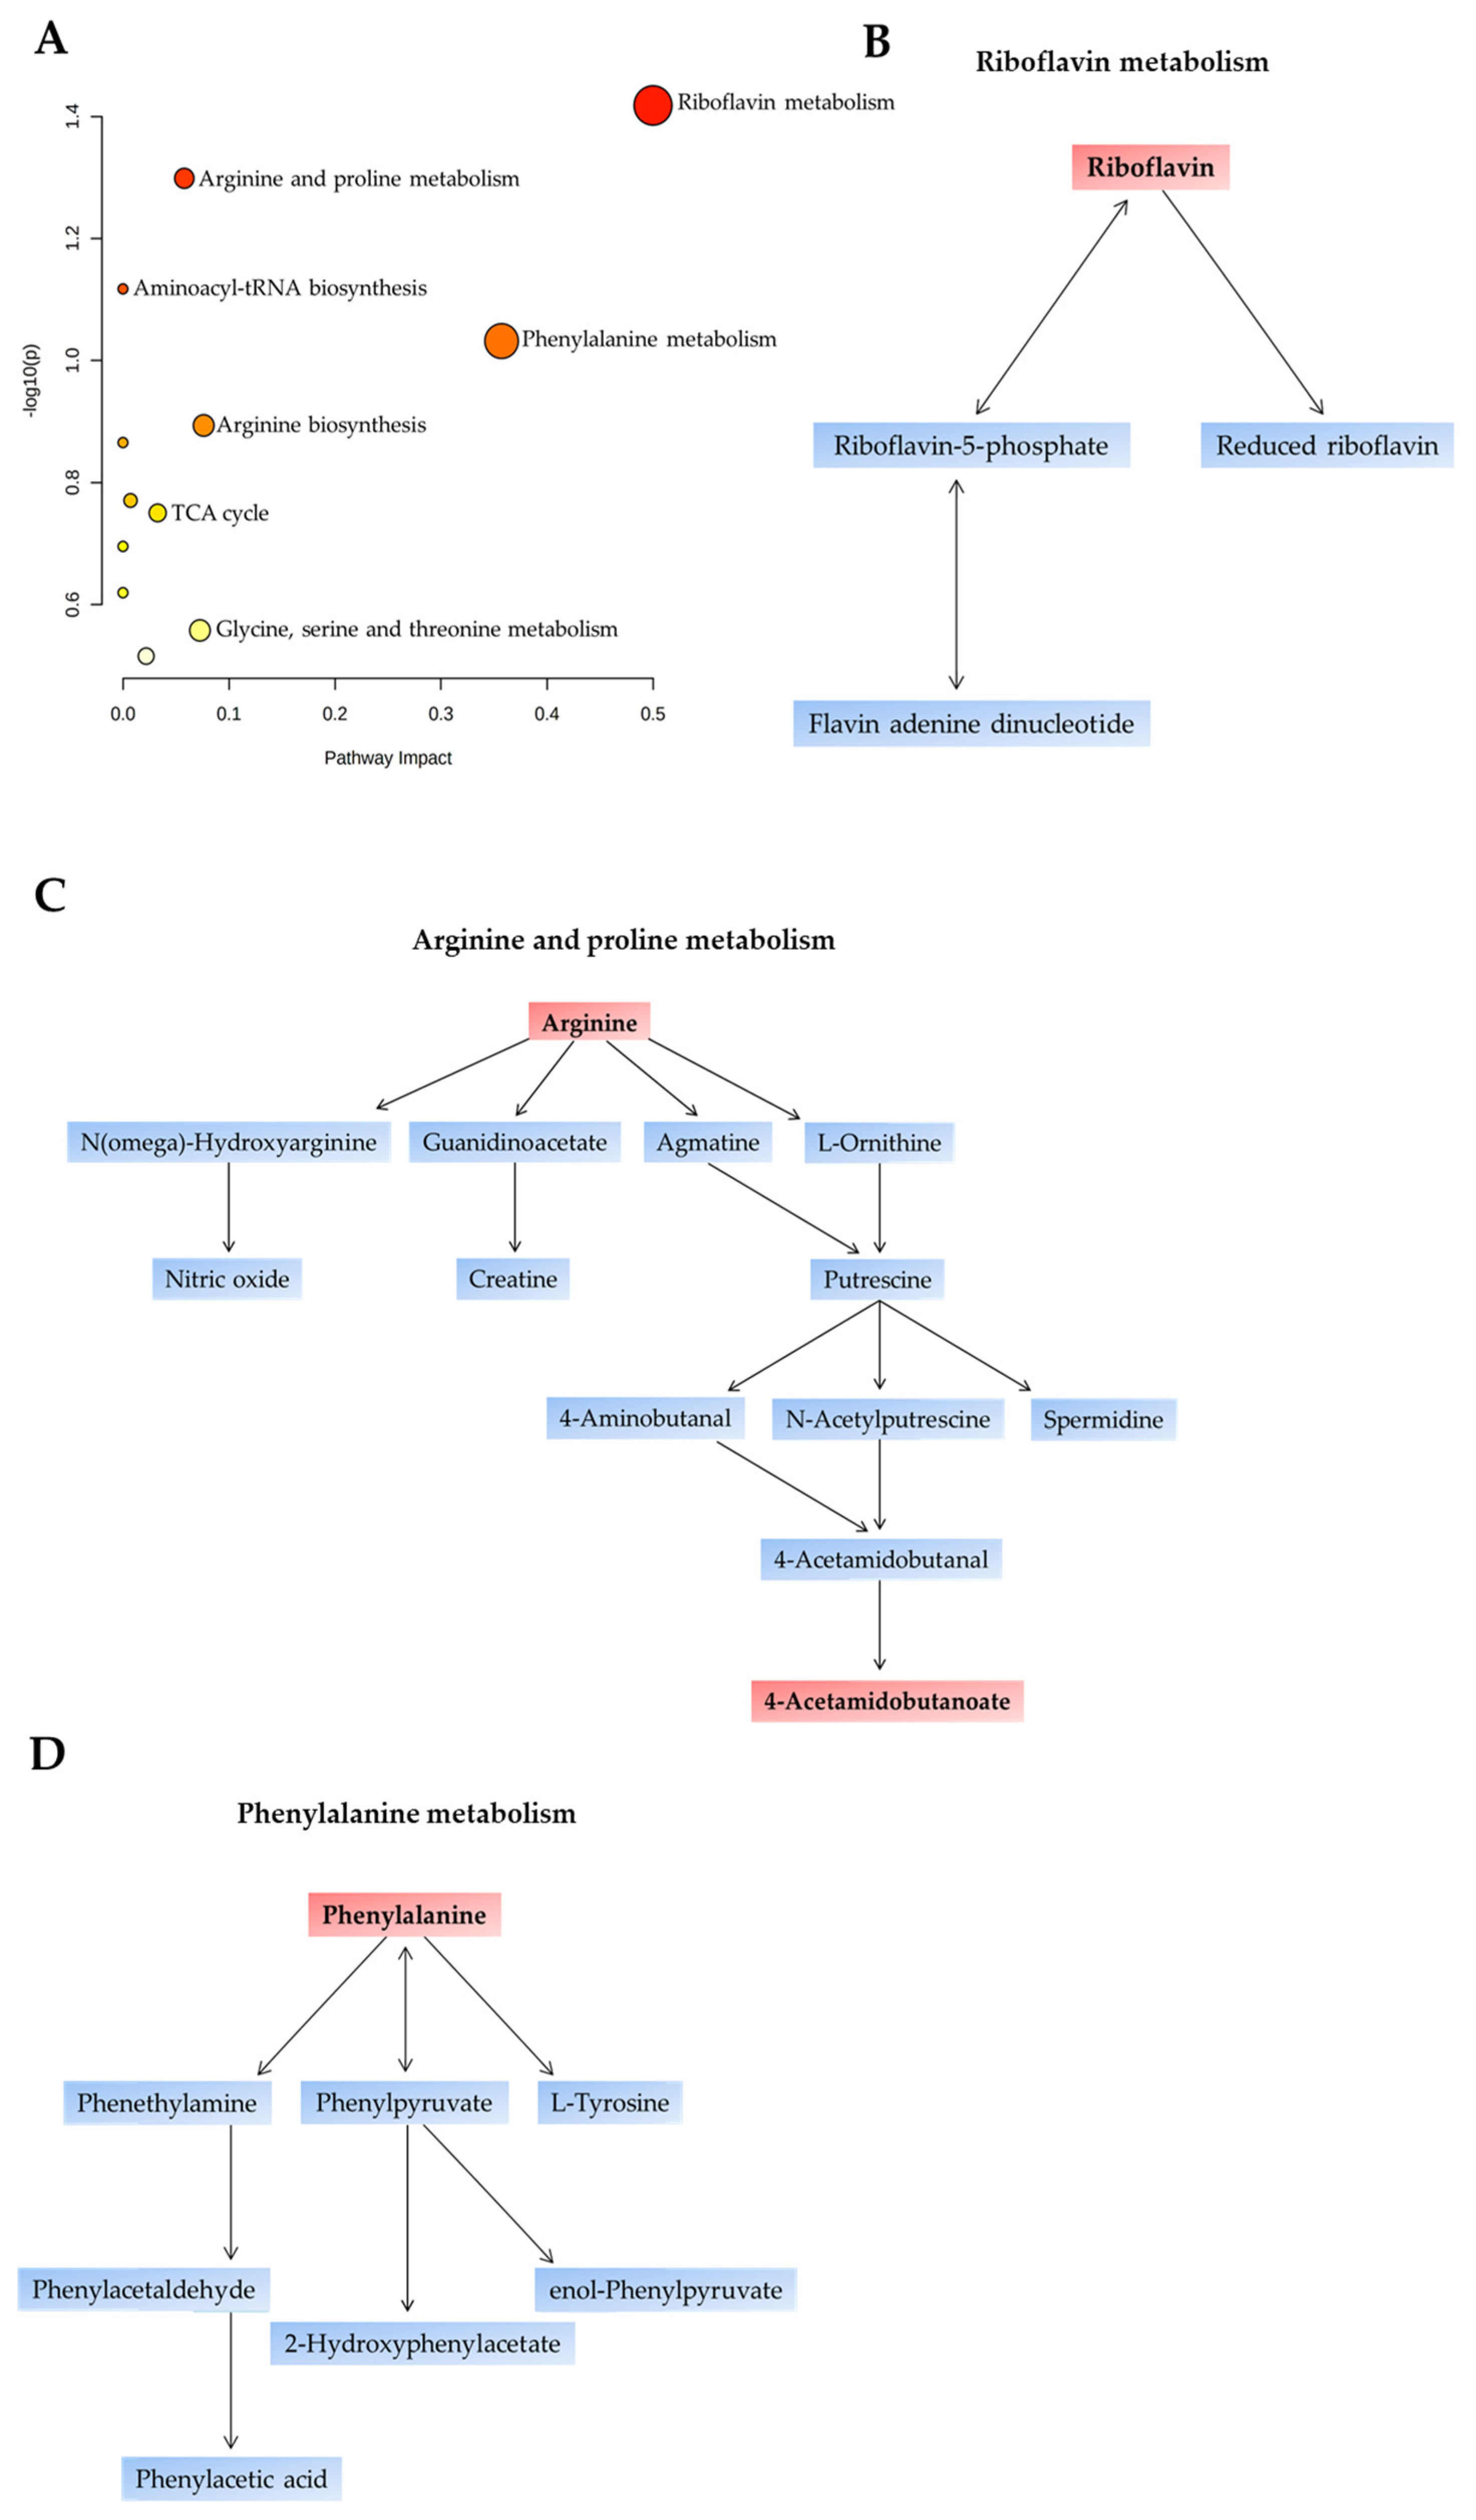
3.2. Metabolomic Profiling of Serum Circulating Factors Identified Dysregulated Amino Acid Metabolism in SVNF Subjects

The metabolomic analysis on serum from BVNF controls and from SVNF patients identified 196 metabolites in total (Supplementary Table S1). The unsupervised principal component analysis (PCA) and hierarchical clustering segregated the BVNF and SVNF groups based on all circulating metabolites (Figure 1A,D). Among these 196 metabolites, 16 were significantly differentially expressed between BVNF and SVNF serum samples (p < 0.05) (Figure 1B,C). Of the 16 differentially expressed metabolites, 10 were significantly downregulated and 6 were significantly upregulated (Figure 1C,D).
We next sought to determine the specific metabolomic pathways altered between BVNF and SVNF serum samples. The 16 significantly dysregulated metabolites are listed in Table 2, classified by the implicated pathway. We observed a total of 12 metabolic pathways significantly altered between BVNF and SVNF sera (Figure 2A and Table 2). The most prominent differences were found in the pathways involved in riboflavin metabolism (Figure 2B), arginine and proline metabolism (Figure 2C) and phenylalanine metabolism (Figure 2D). Together, these results indicate that SVNF subjects displayed altered circulating levels of amino acid and vitamin B2 metabolites compared to BVNF controls.

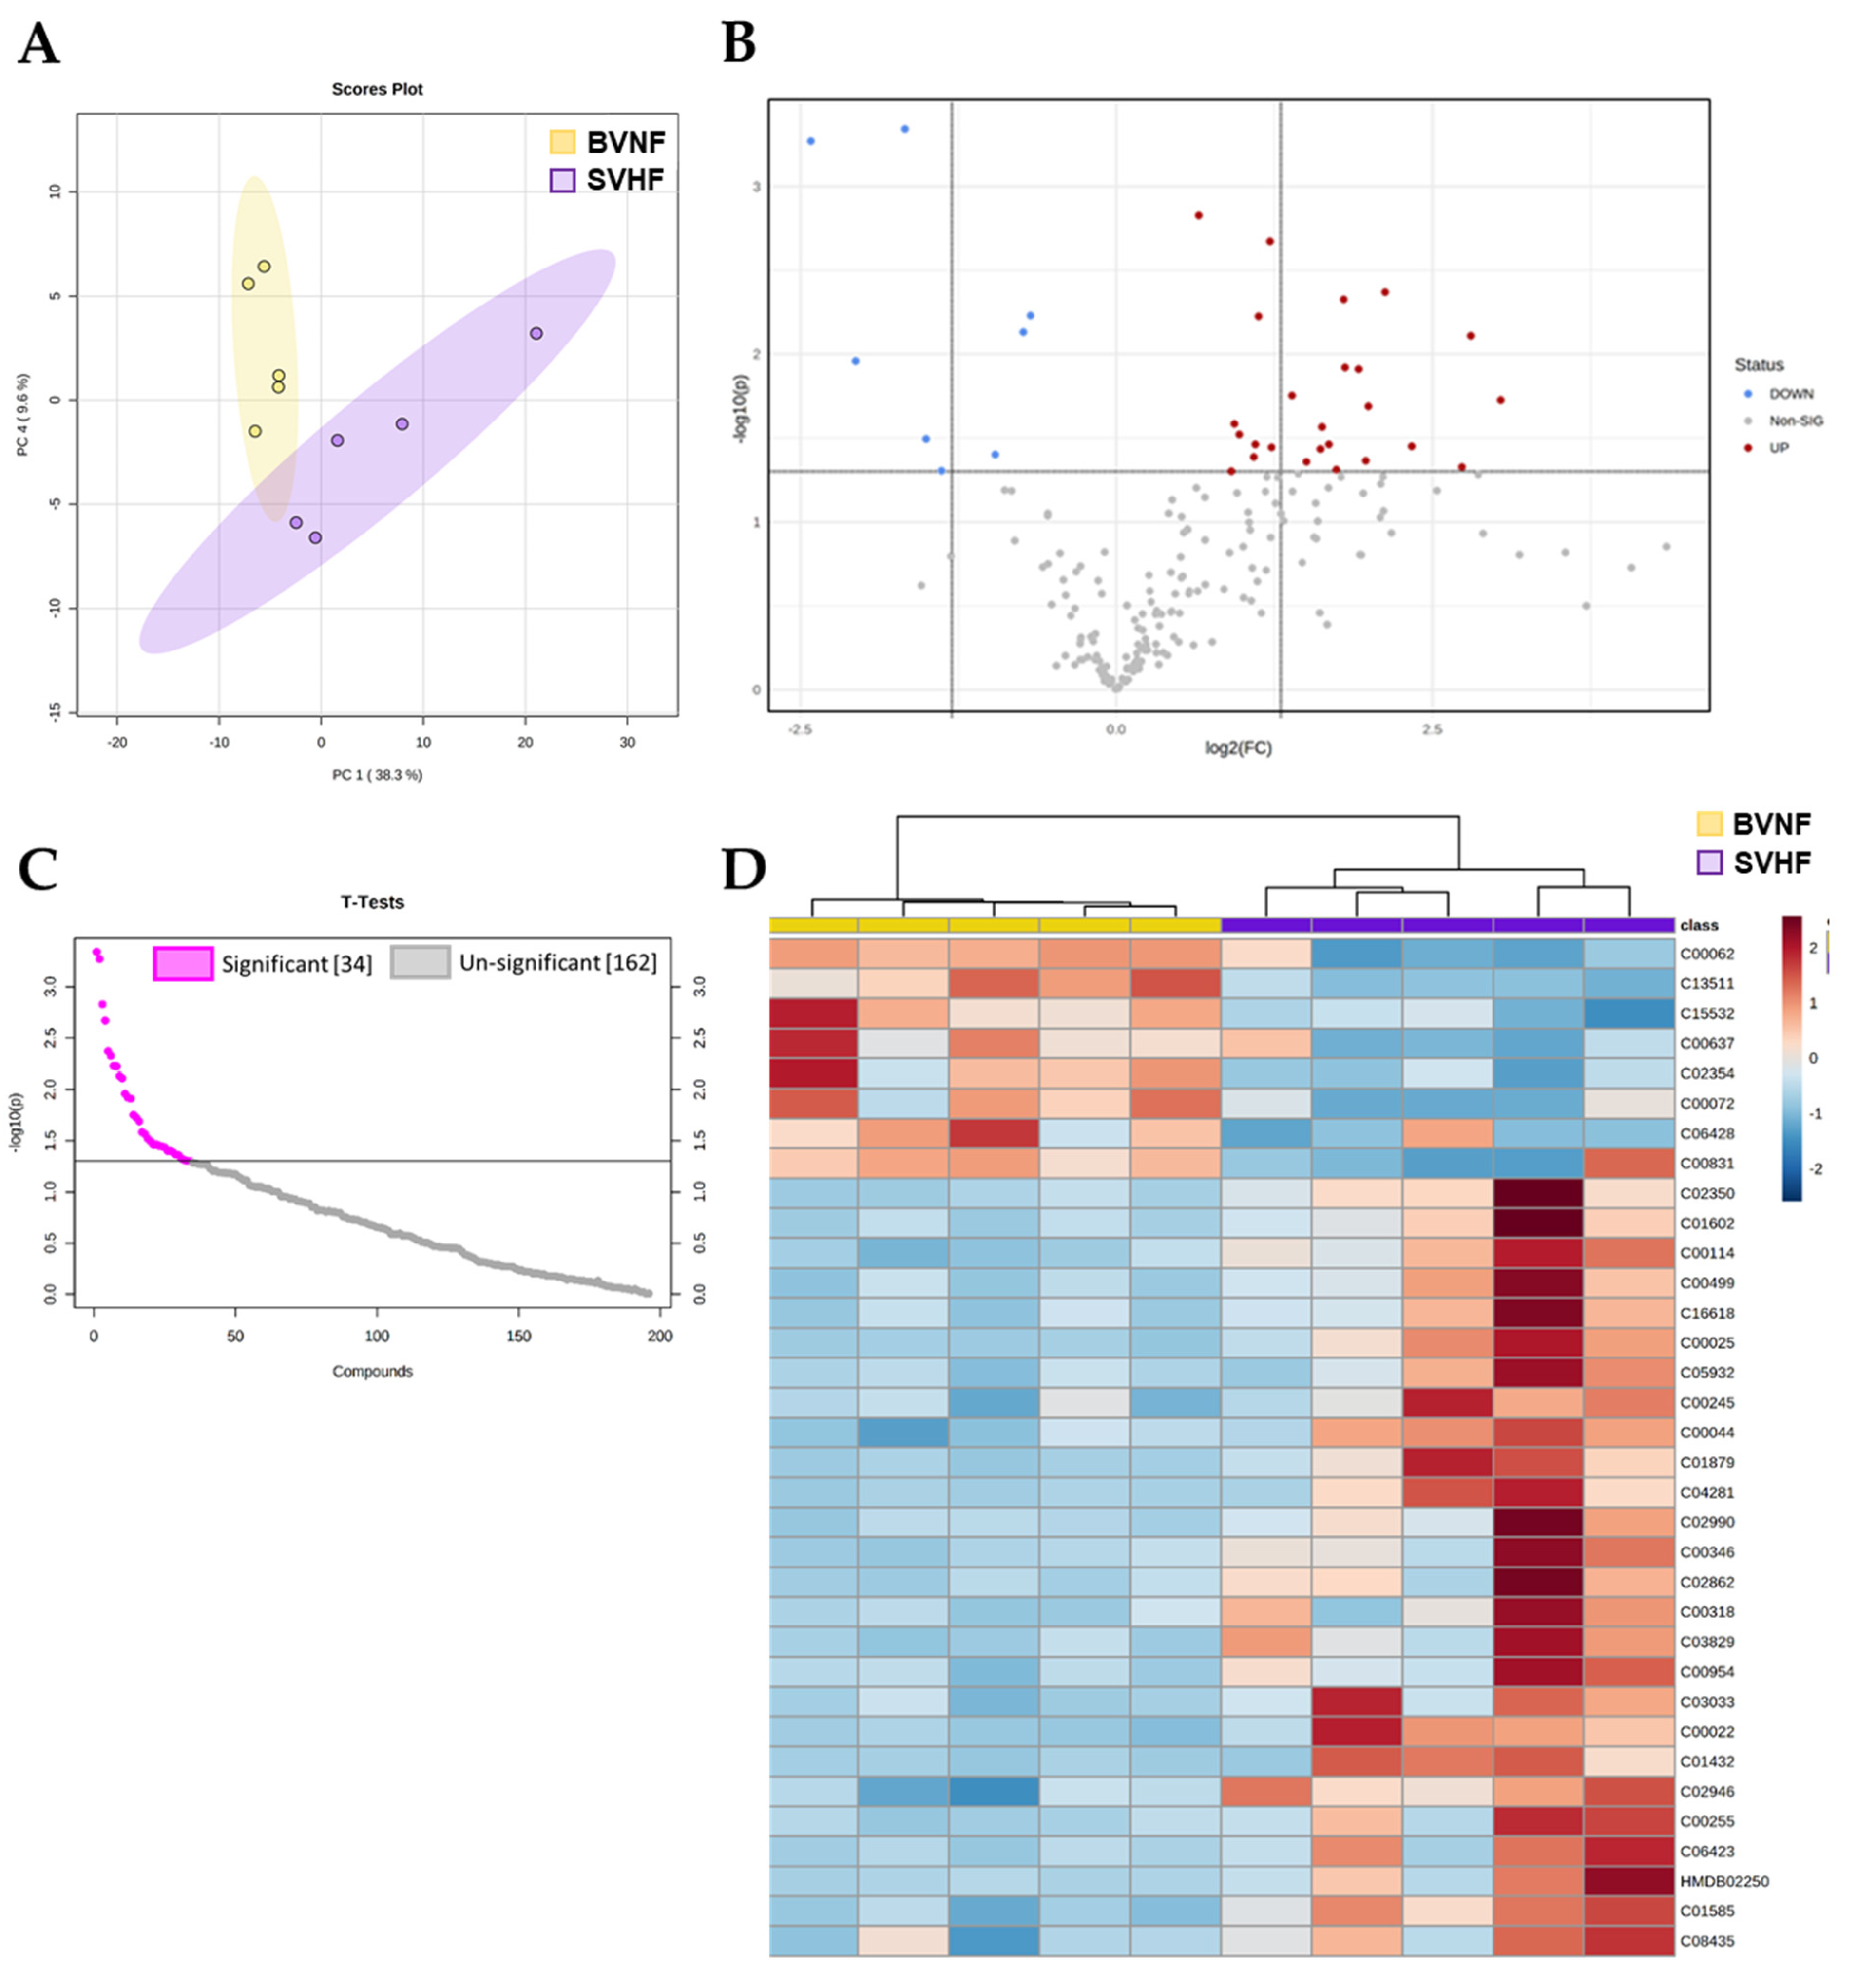
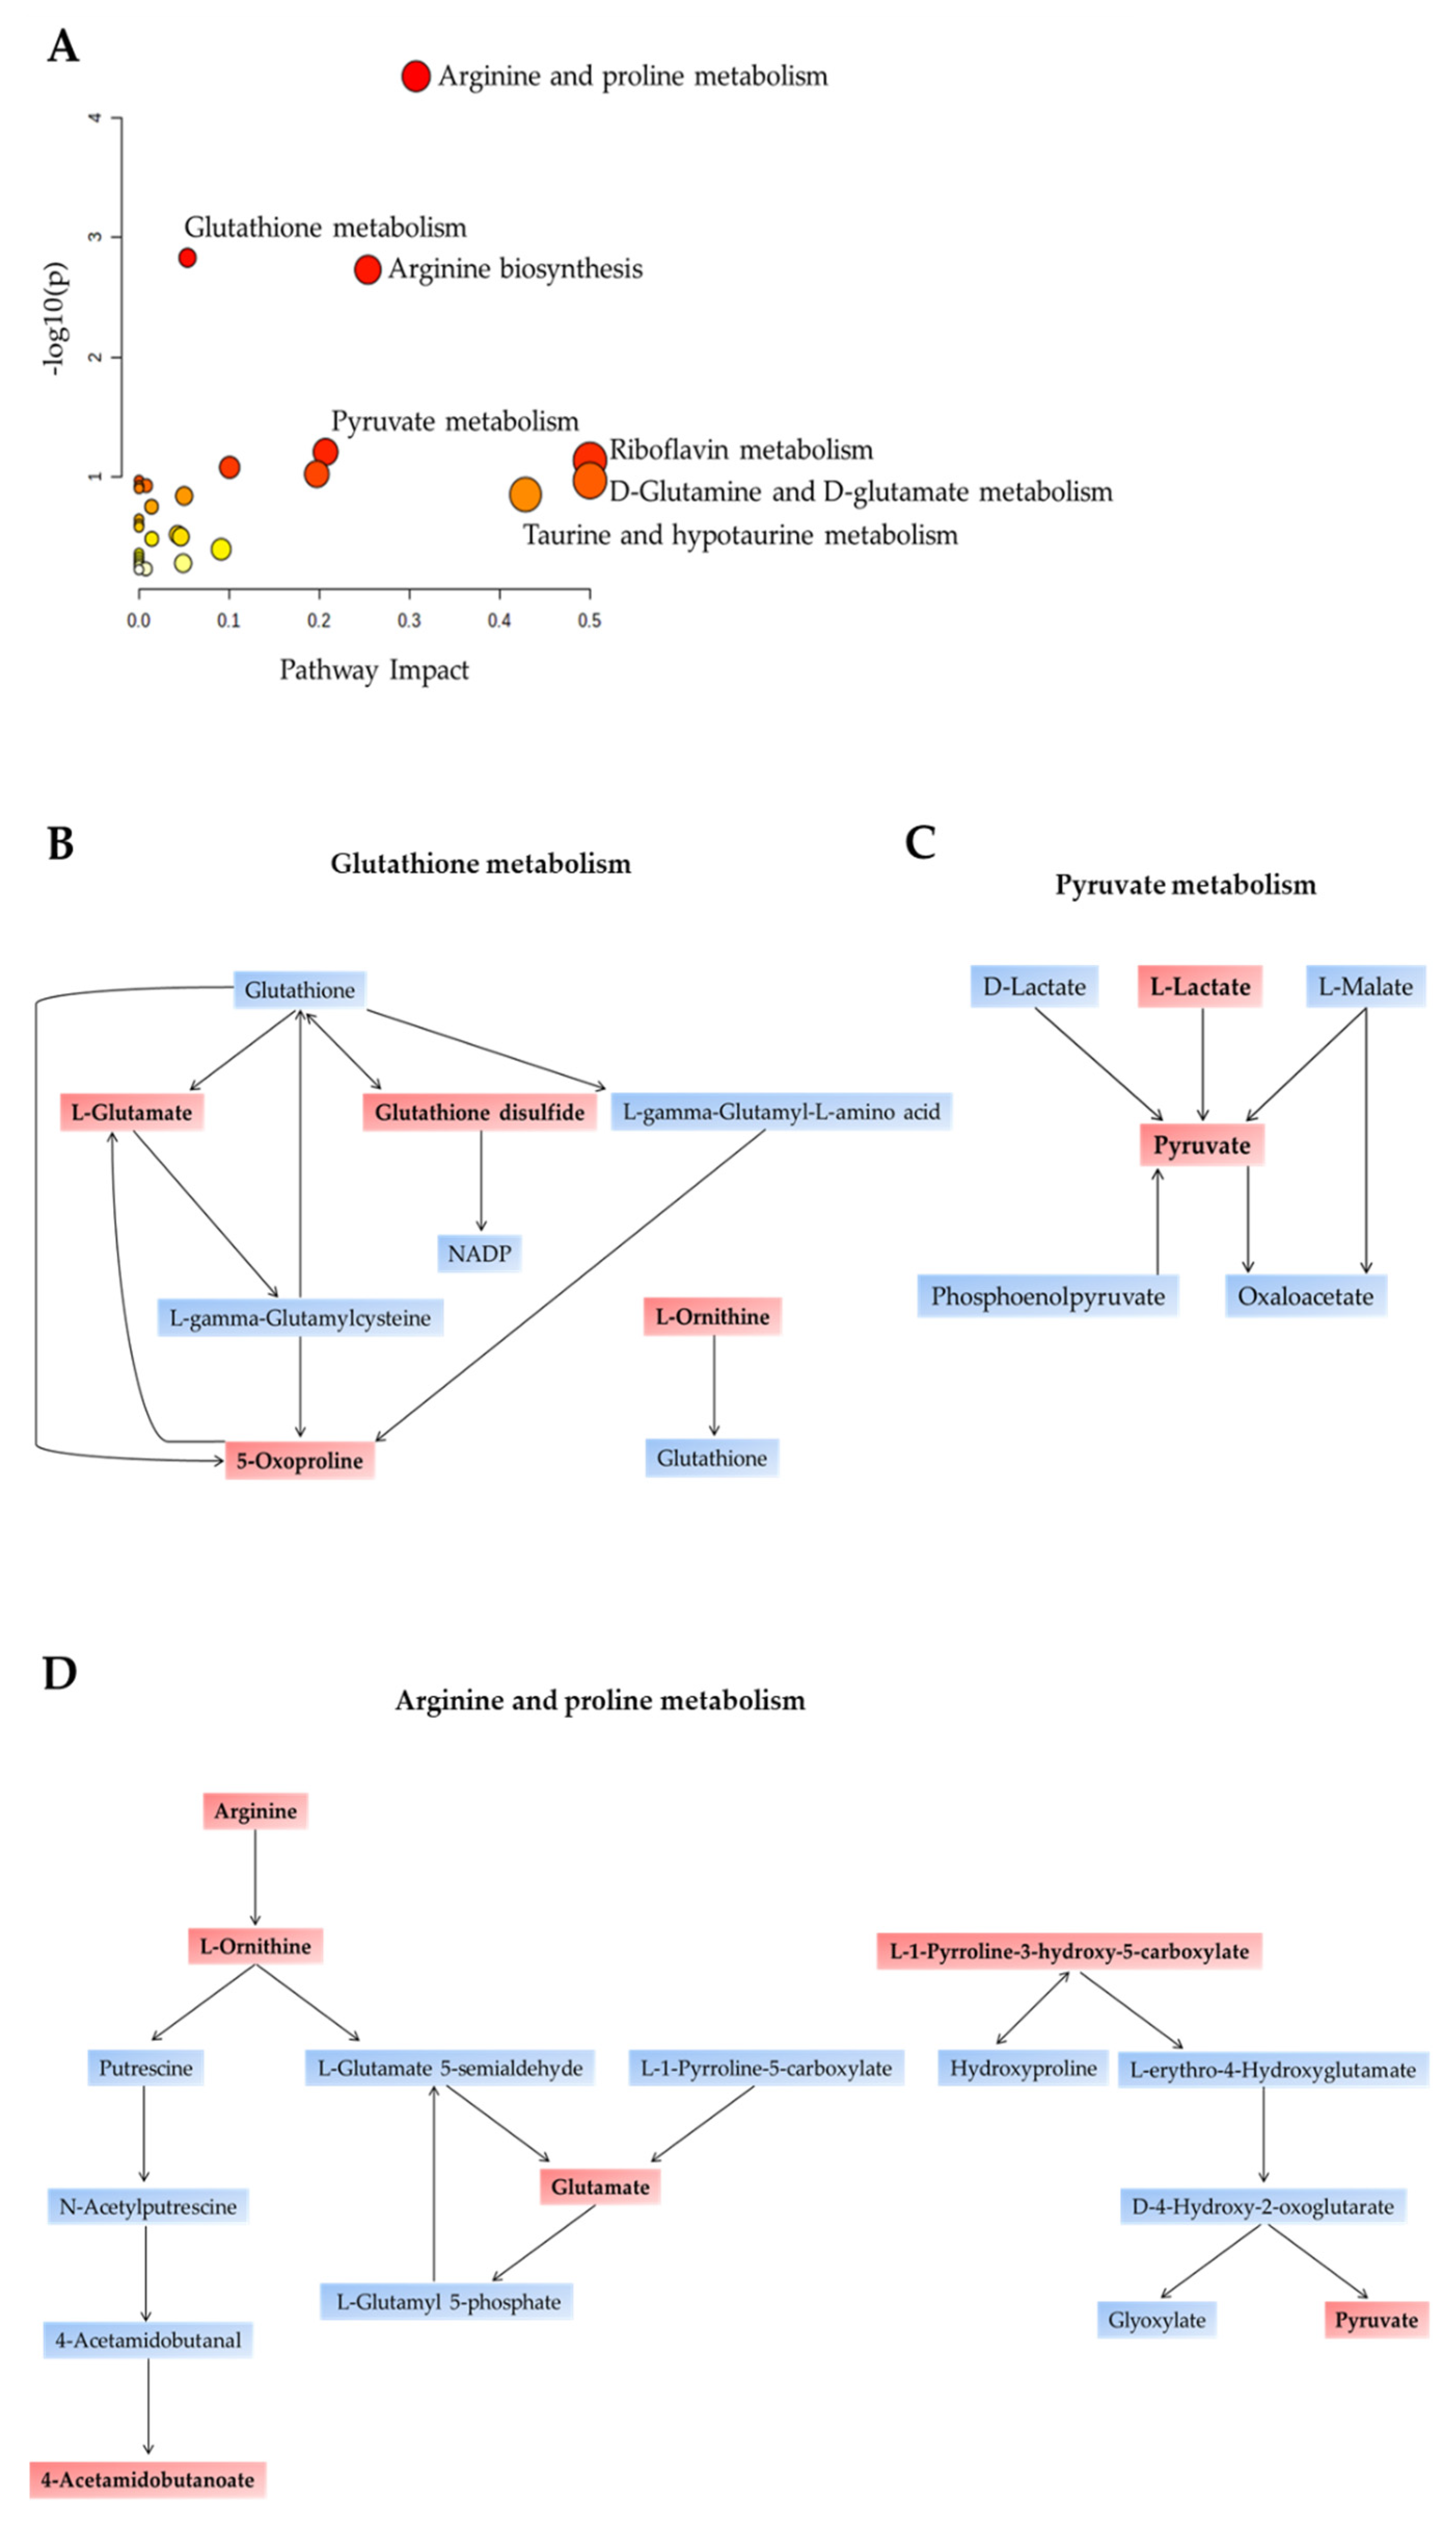
3.3. Metabolomic Profiling of Serum Circulating Factors Identified Dysregulated Amino Acid, Pyruvate and Antioxidant Metabolism in SVHF Subjects

Next, we compared serum metabolomic profiles from BVNF controls and SVHF subjects. We identified 196 metabolites in total (Supplementary Table S2). The unsupervised principal component analysis (PCA) and hierarchical clustering segregated the BVNF and SVHF groups based on all circulating metabolites (Figure 3A,D). Among these 196 metabolites, 34 were significantly differentially expressed between BVNF and SVHF serum samples (p < 0.05) (Figure 3B,C). Of the 34 differentially expressed metabolites, 9 were significantly downregulated and 25 were significantly upregulated (Figure 3C,D).
The 34 significantly dysregulated metabolites are listed in Table 3, classified by their respective implicated pathway. Further, we conducted a pathway analysis on the significantly differentially expressed metabolites and observed a total of 18 metabolic pathways significantly altered in SVHF serum (Figure 4A and Table 3). The most prominent differences were found in the pathways involved in antioxidant defense (glutathione metabolism; Figure 4B), arginine and proline metabolism (Figure 4D) and pyruvate metabolism (Figure 4C). Together, these results indicate that the metabolite composition of SVHF serum differs from the circulating metabolite profile of SVNF patients. While amino acid metabolism was commonly dysregulated in all SV subjects, SVHF subjects displayed altered circulating levels of energetic metabolites (e.g., pyruvate, lactate) and dysregulated glutathione metabolism (e.g., glutathione dysulfide, 5-oxoproline), suggesting metabolically distinct profiles between SVNF and SVHF circulating metabolites.

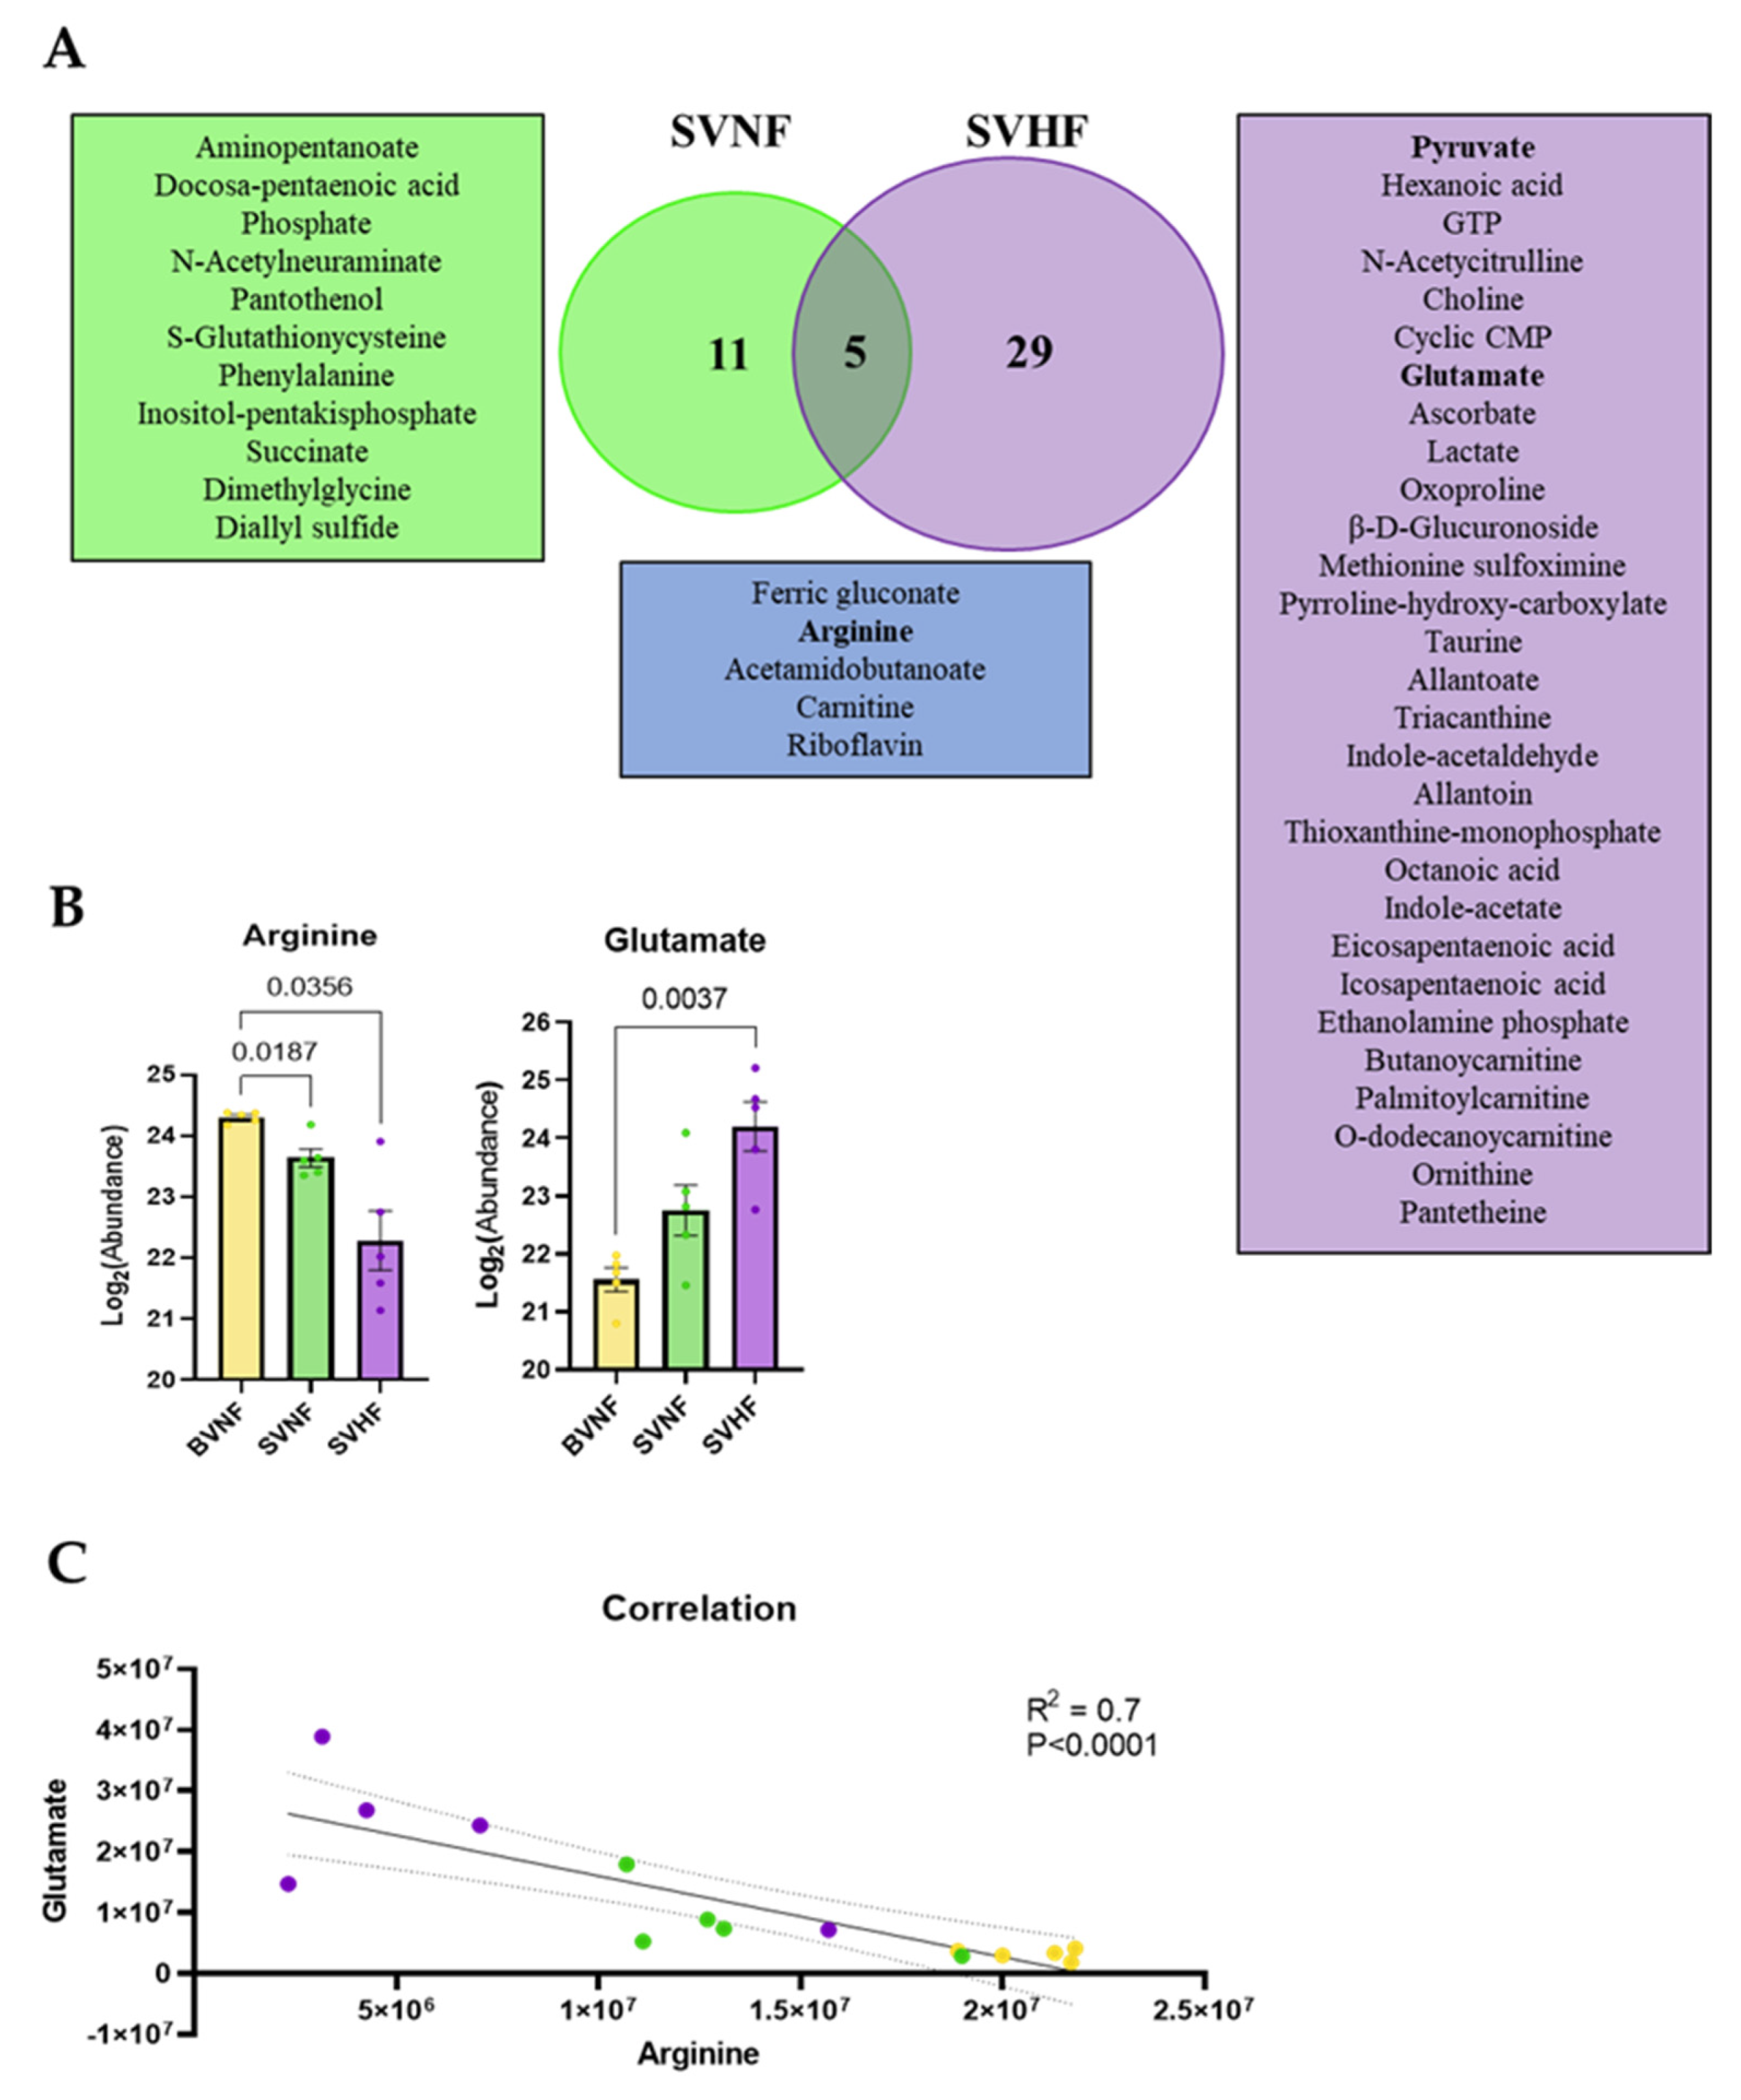
3.4. Metabolomic Profiling of Serum Circulating Factors Discriminated between SVNF and SVHF Subjects

There were five significantly dysregulated metabolites between the SVNF and the SVHF subjects, including ferric gluconate, arginine, acetamidobutanoate, carnitine and riboflavin (Figure 5A,B), suggesting that these circulating metabolites are associated with SV regardless of HF status. However, significantly increased levels of glutamate were seen specifically in SVHF subjects and the level of glutamate correlated inversely with the level of arginine; the levels appeared to be related to disease progression based on the clustering of each group together on the correlation curve (Figure 5C).

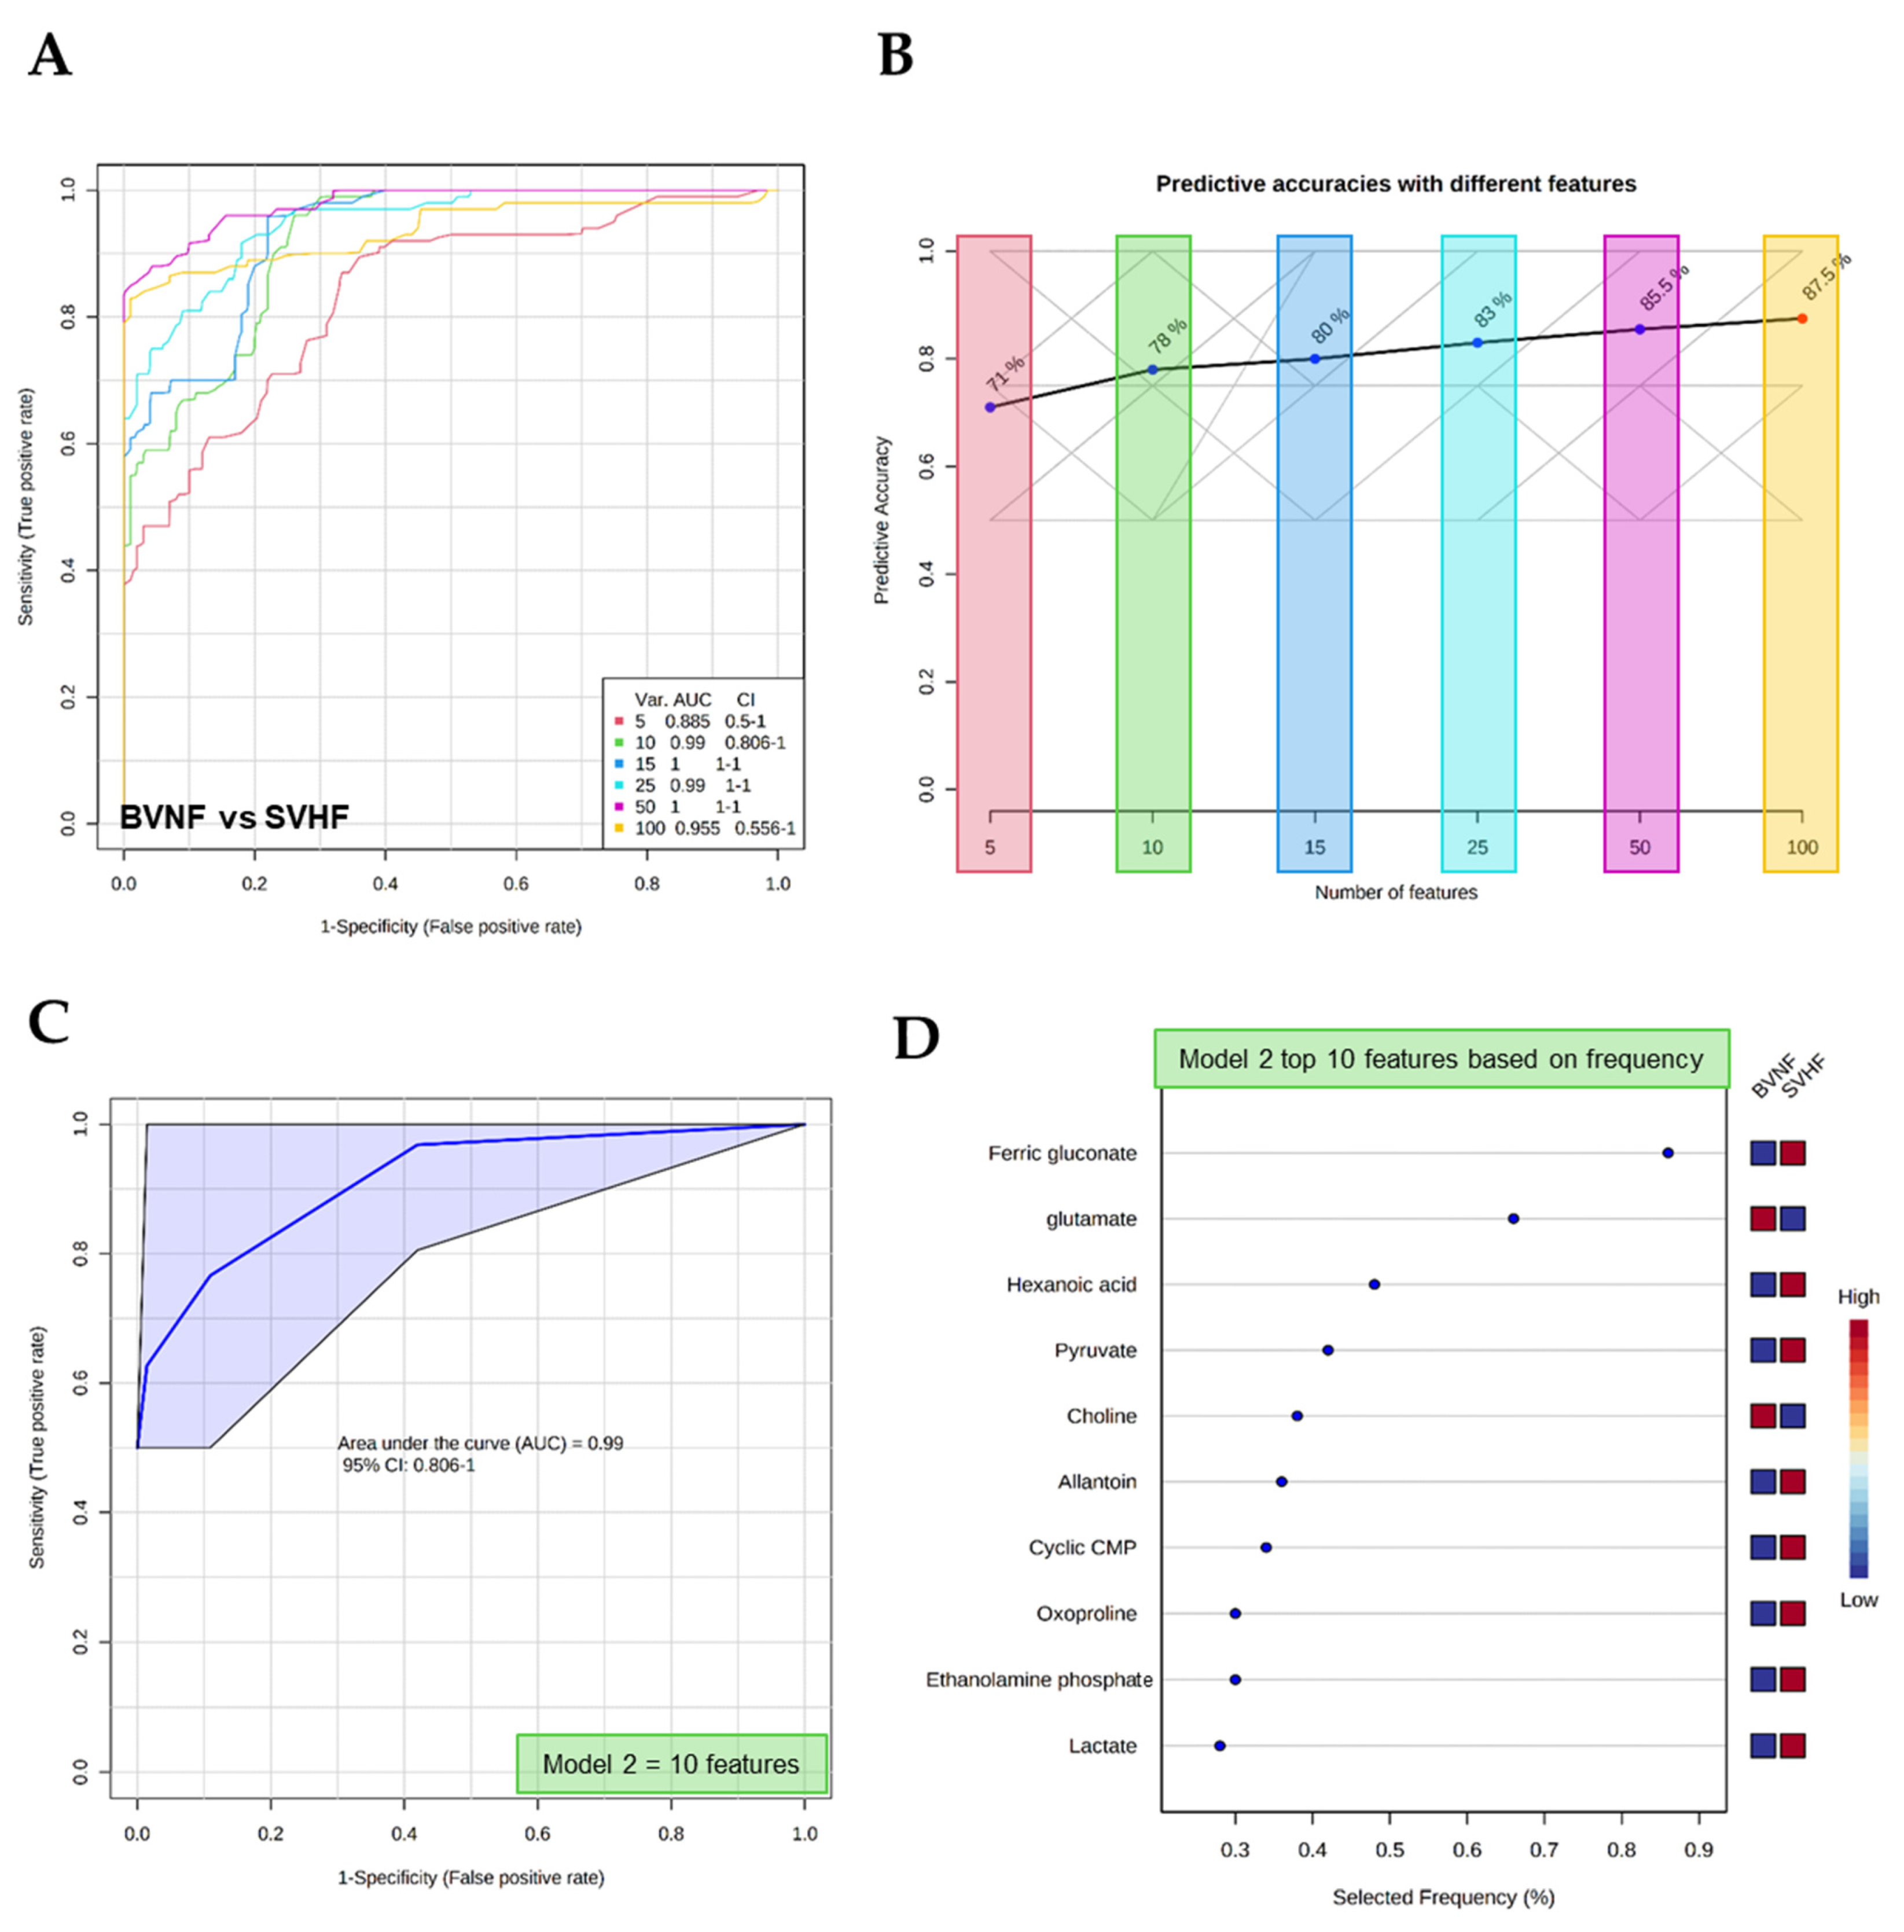
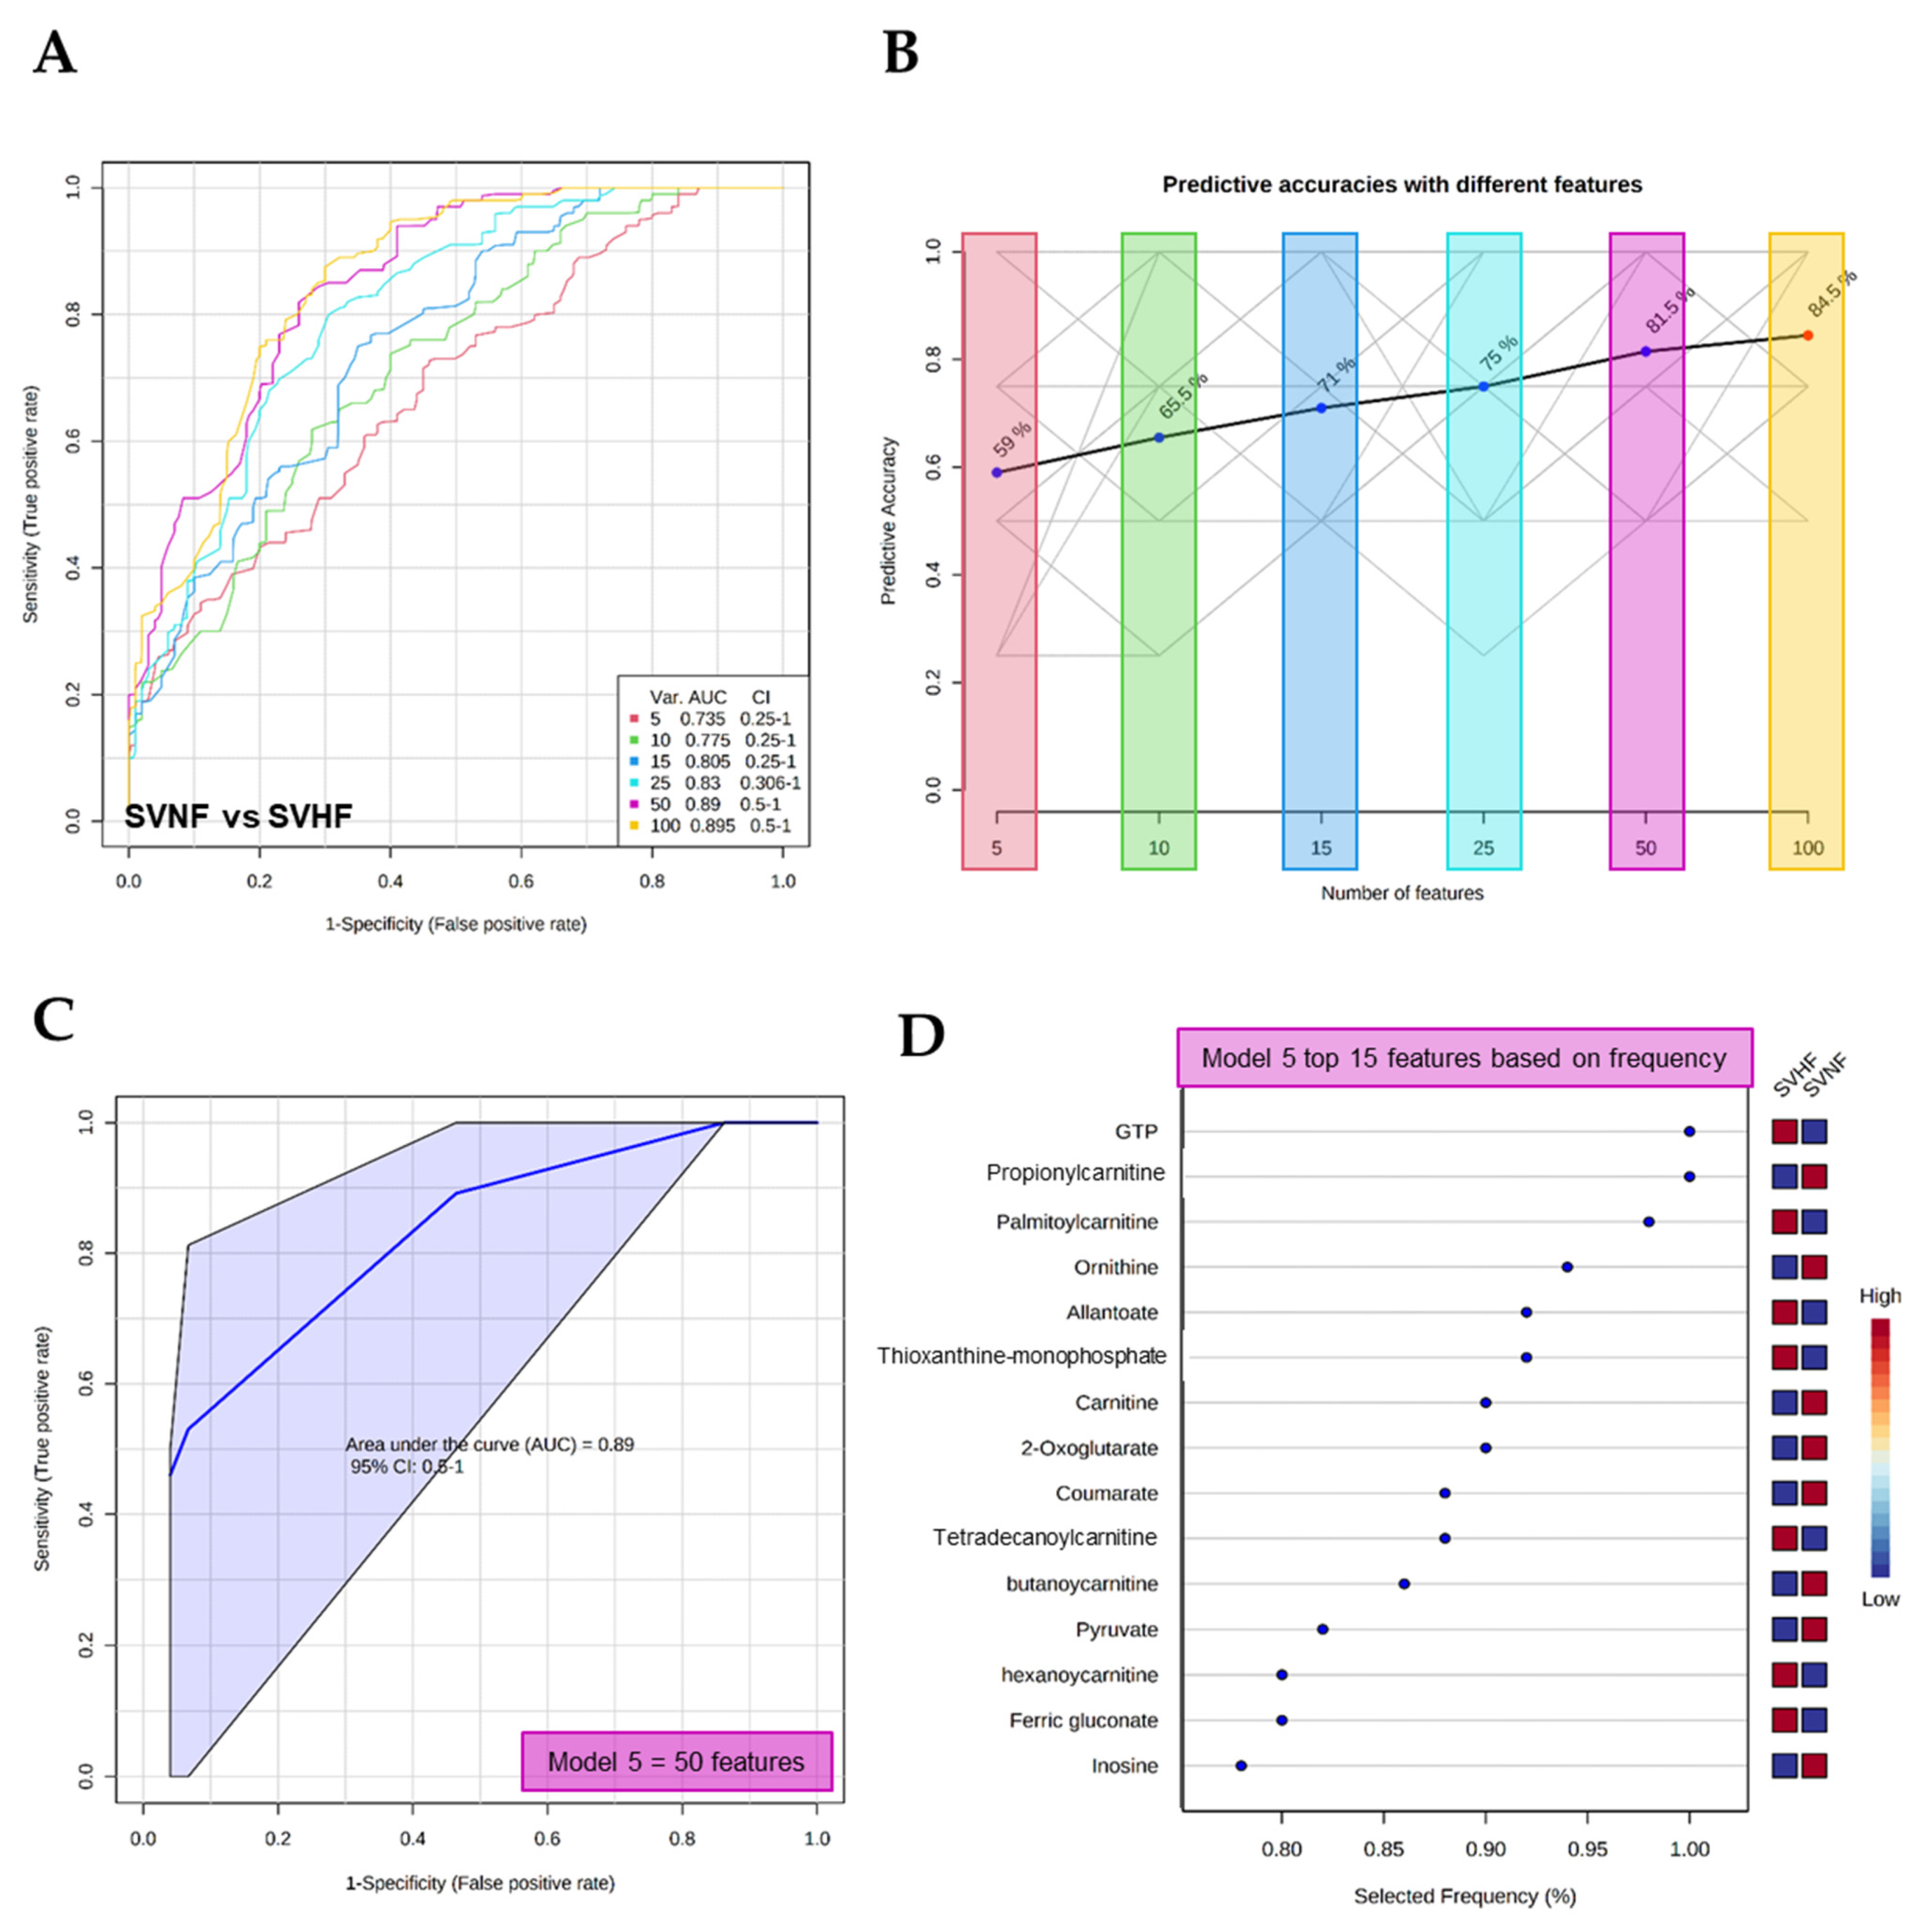
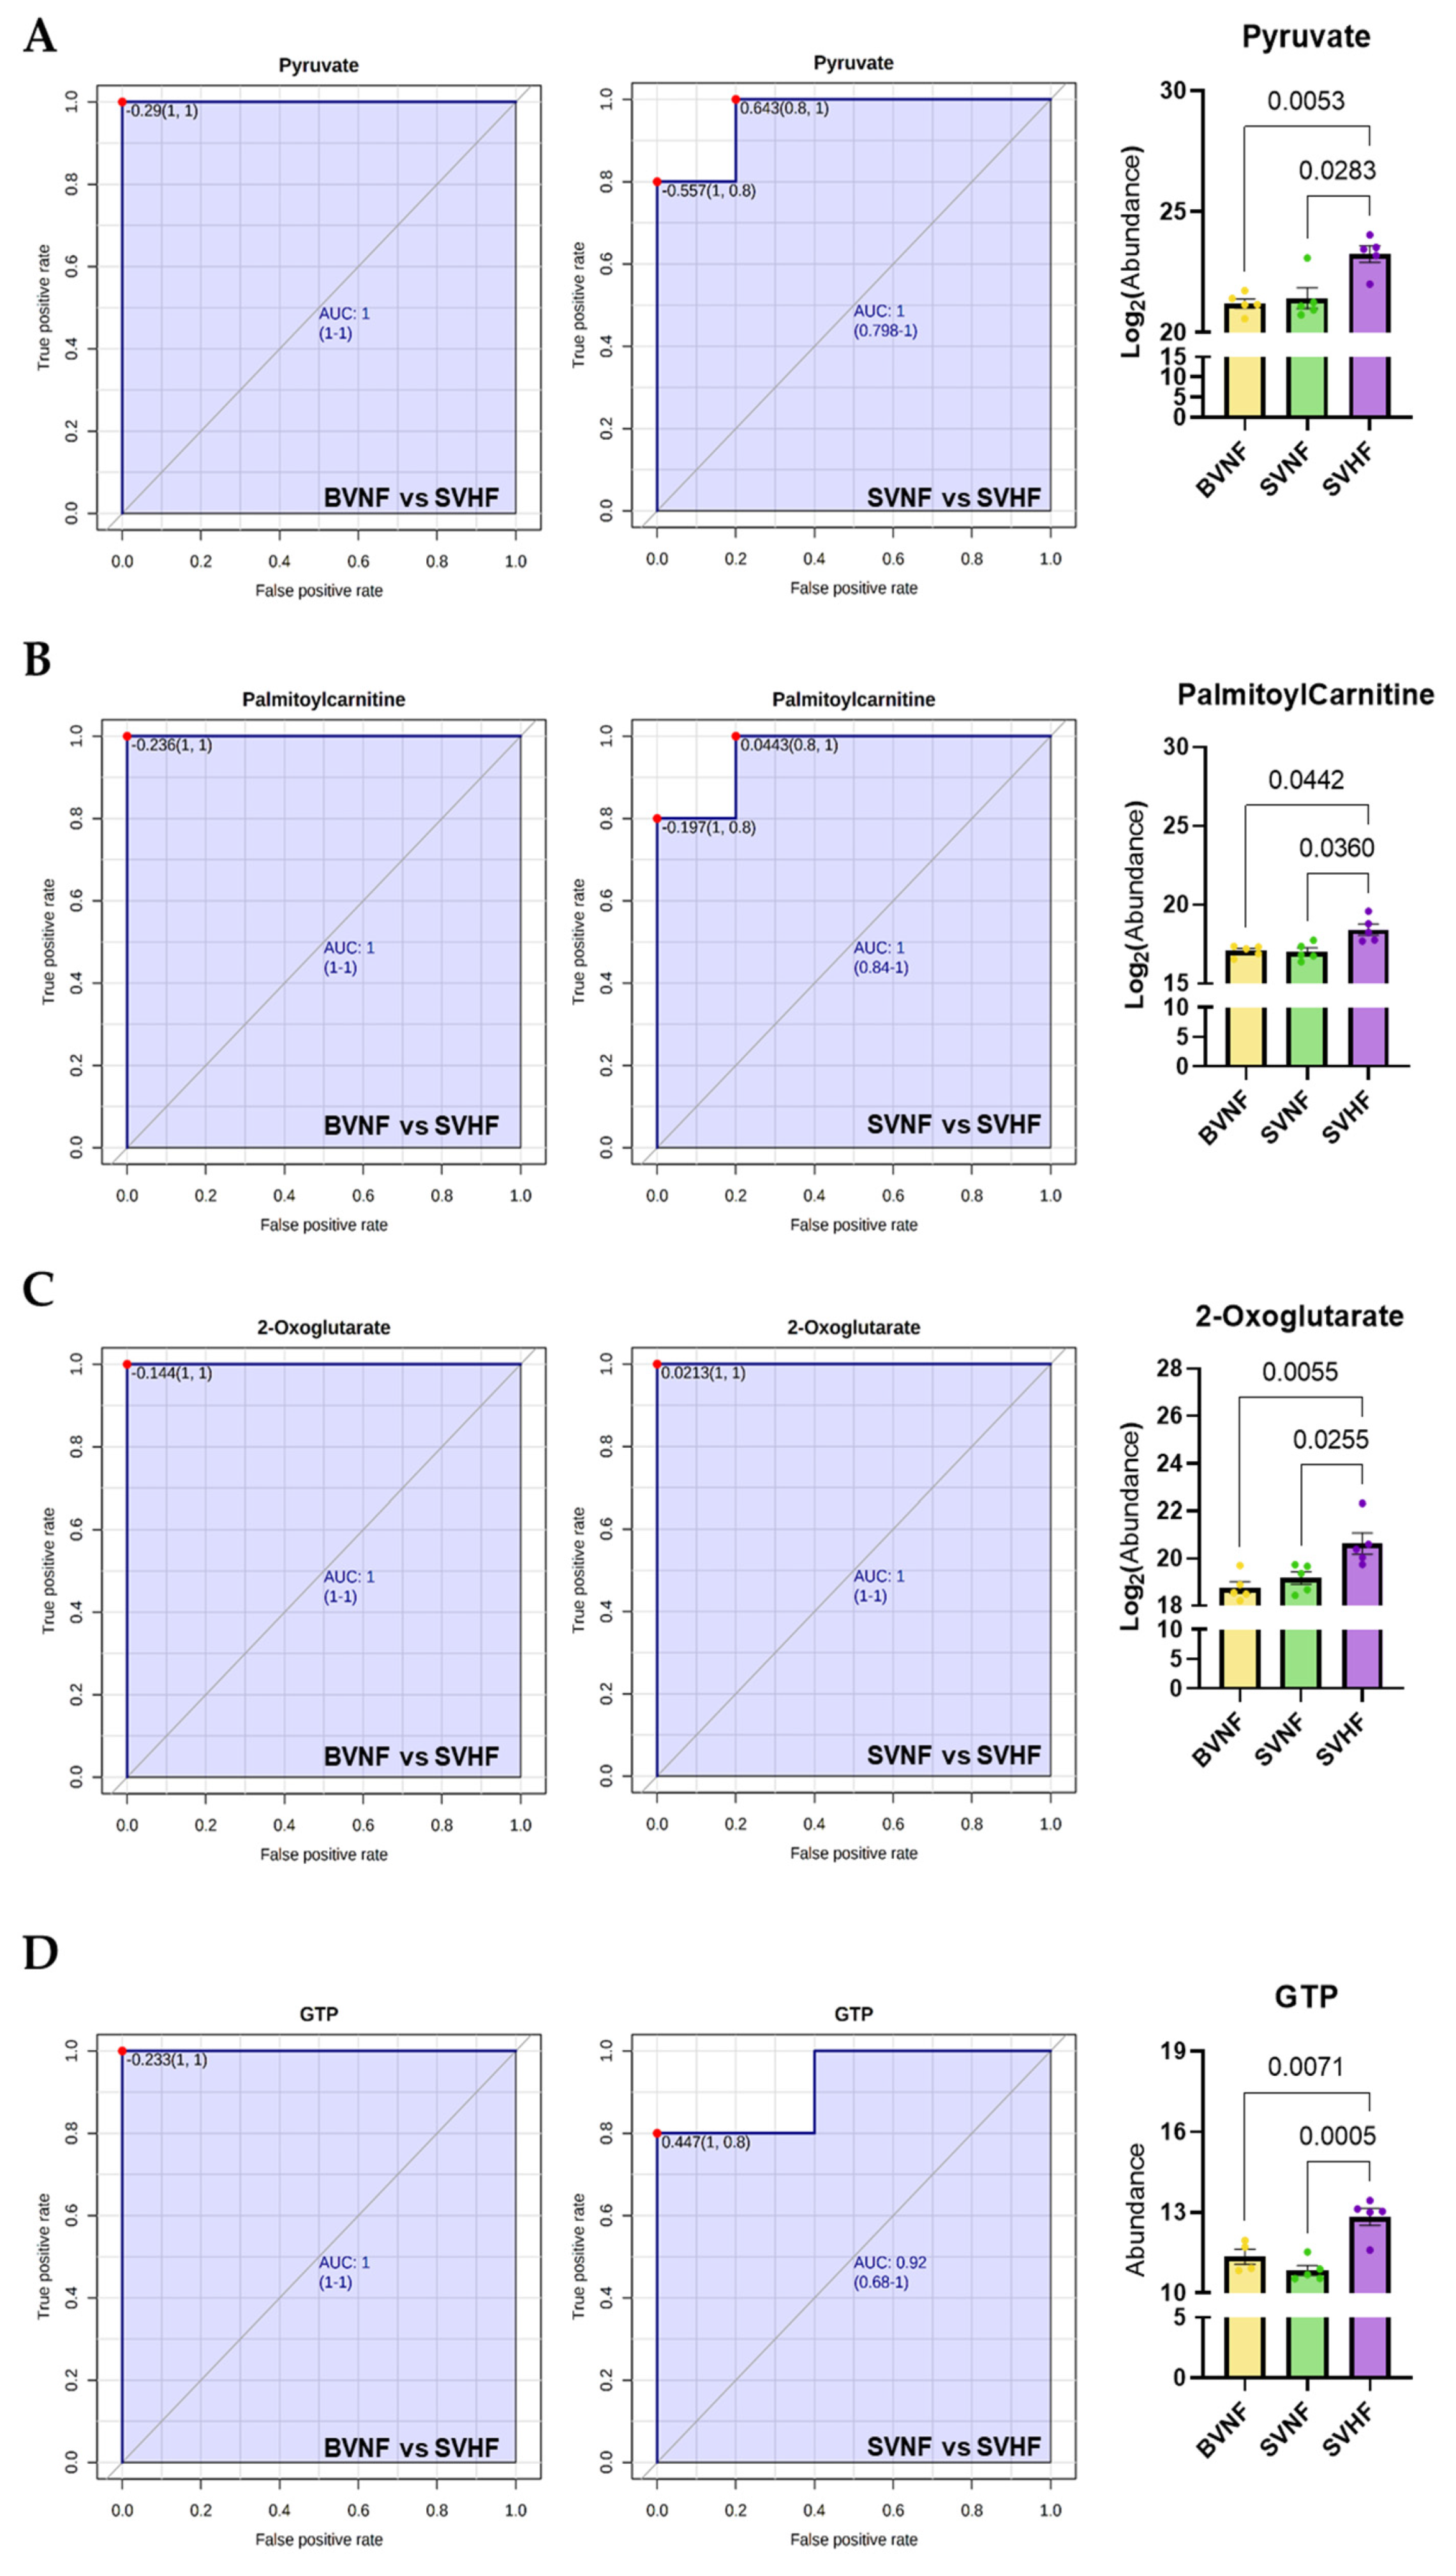
3.5. Metabolomics Profiling as a Diagnostic, Prognostic, or Monitoring Tool

The potential use of serum circulating metabolites as sensitive and specific biomarkers was evaluated by both multivariate exploratory receiver operating characteristic (ROC) analyses and classical univariate ROC analyses. The multivariate ROC analysis demonstrated the ability of metabolite panels to serve as potential diagnostic biomarkers (Figure 6A and Figure 7A). The ability to discriminate between controls and SVHF patients is shown in Figure 6A–C. Using as little as 10 features, the area under the curve (AUC) equals 0.99, suggesting an excellent ability of circulating metabolite panels to distinguish BVNF from SVHF subjects (Figure 6A,C). The top 10 features based on frequency using this model are shown in Figure 6D. Additionally, the multivariate ROC analysis demonstrated the ability to discriminate between SVNF and SVHF subjects based on metabolite panels (Figure 7A–C). Using between 15 and 50 features, AUC ≥ 0.8, suggesting an acceptable-to-excellent ability of circulating metabolite panels to distinguish SVNF from SVHF subjects (Figure 7A,C). The top 15 features based on frequency using this model with 50 features are shown in Figure 7D.
The classical univariate ROC curve analysis demonstrated the ability of single, specific circulating serum metabolites to serve as potential diagnostic biomarkers (Figure 8). The most significant individual metabolites to discriminate between either BVNF and SVHF or SVNF and SVHF groups were pyruvate, palmitoylcarnitine, 2-oxoglutarate and GTP, suggesting that these metabolites may be valuable prognostic and/or monitoring tools in the failing SV population.

4. Discussion

There is a significant and growing body of literature where metabolomic analyses have been performed in adult HF subjects [27,28,29,30]. To our knowledge, there exist only two reports of metabolomic analyses of the myocardium of SV subjects, including one in adult non-failing SV patients with a systemic LV [18,19] and one in young SVNF and SVHF patients with a systemic RV [20]. The lack of comprehensive studies evaluating metabolomic changes in the pediatric SV heart leads to a major gap in knowledge related to the potential use of specific metabolite changes that occur during the progression to HF in SV patients. Moreover, it remains a significant challenge to predict which SV patients will develop clinically significant HF and the prototypical established biomarkers of HF progression, such as brain natriuretic peptide (BNP), are not consistent in the SV population. In this current study, we performed a similar pilot study to O’Connell et al.’s, where we characterized circulating metabolites associated with HF in young SV subjects and corroborated some of the suggested potential metabolomic biomarkers of SV HF progression. Our metabolomic analysis revealed that serum circulating metabolite profiles and pathways differentiated SVHF subjects from BVNF subjects, as well as SVHF subjects from SVNF subjects, including pathways related to specific amino acids, energetic intermediates and nucleotides.
Amino acids (AAs) are important as substrates for signaling molecules regulating metabolism or protein synthesis, as well as a source of energy [31]. Alterations in the circulating levels of AAs could be indicative of alterations in protein synthesis and degradation, as well as altered amino acid catabolism. Studies of adult non-failing SV subjects [18,19] and SVHF subjects [20] found decreased circulating (plasma) concentrations of asparagine, histidine and threonine and an increase in glutamate compared with controls. Similar to what has been seen in prior SV metabolomic studies, we identified significant alterations in AA metabolism. Intriguingly, in our study, we observed a decrease in arginine and phenylalanine. These AAs can be important sources of energy production, as they induce fat catabolism and ketone body utilization [32]. Moreover, we observed that the inverse relationship between arginine and glutamate, specifically, is highly correlated with the progression of HF in SV, suggesting a potential role for these specific circulating AAs as novel prognostic biomarkers of disease progression and response to therapy. Together, these data also suggest that amino acid dysregulation in the setting of SV may be indicative of a unique vulnerability of SV patients to metabolic changes and increased energetic demand. In addition to their use as diagnostic tools, understanding the role of AAs in cellular energetics in the SV population could lead to novel therapeutic interventions.
Oxidative phosphorylation is the primary metabolic pathway used for energy generation and requires the input of reducing equivalents from fatty acid beta-oxidation, pyruvate oxidation and the tricarboxylic acid (TCA) cycle. Therefore, the integration of specific metabolic pathways is important for necessary and sufficient ATP synthesis. Consistent with the hypothesis that the SV heart is vulnerable to changes in myocardial energy supply and demand, a number of circulating metabolites associated with energy metabolism was significantly altered. Here, we show that both non-failing and failing SV subjects had significantly altered levels of circulating carnitine (L-carnitine). Interestingly, we observed a significant decrease in SVNF subjects and a significant increase in SVHF subjects relative to BVNF controls. Circulating palmitoylcarnitine (a long-chain acylcarnitine), on the other hand, was significantly elevated specifically in SVHF subjects. Previous studies have demonstrated that a worse New York Heart Association class was associated with elevated plasma palmitoylcarnitine levels in the setting of pulmonary hypertension and RV dysfunction [33]. These data further suggest the failing SV heart is typified by significant alterations in energy metabolism, which may serve as both a biomarker panel of HF progression and as a novel target of therapy. Moreover, pyruvate is an integral metabolite critical for a number of various metabolic functions. Pyruvate, for example, is the end product of glycolysis, is derived from several additional sources in cells and is ultimately destined for transport into the mitochondria, where it is the master fuel source supporting the TCA cycle flux [34]. Thus, disruptions in pyruvate metabolism can be related to disease progression, particularly in tissues with a high energetic demand. Here, we demonstrate that significantly elevated levels of circulating pyruvate were associated with SVHF, which may be indicative of greater mitochondrial metabolic perturbations in this population. Intriguingly, recent evidence hypothesized that pyruvate could be a potential therapeutic candidate (reviewed in [35]). Moreover, it has been previously demonstrated that increased serum 2-oxoglutarate was associated with high myocardial energy expenditure and poor prognosis in adult chronic heart failure patients [36]. Therefore, 2-oxoglutarate may serve as a valuable biomarker of dwindling myocardial energy supply and can reflect clinical severity and outcomes of both adult biventricular HF patients and in SVHF patients.

Study Limitations

It is important to note that this is a small-scale pilot study consisting of a total of 15 pediatric subjects (5 in each group). SV is a relatively rare disease; therefore, access to a homogenous age- and sex-matched pediatric study population can be difficult. Moreover, because of the relative rarity of SV, it is not possible for us to determine the influence of age, prior surgical procedures, duration of HF, degree of cyanosis, gestational age, current diet, or the role of specific medications in this study. Nevertheless, even in this small-scale metabolomics study, we address an important gap in knowledge, providing additional insight into the potential use of metabolomic panels and specific metabolites as diagnostic, prognostic, or monitoring tools in a population with few other options. Further, we corroborate the few global metabolomic studies that do exist in the SV population. Metabolomic profiling in SV patients deserves further study given the absence of evidence-based biomarkers in this growing population. Additional and larger studies would be necessary to further validate the use of specific metabolite panels as biomarkers in this population.

5. Conclusions

In summary, an unbiased metabolomic analysis suggests that the serum circulating metabolite milieu in SV patients varies depending on the presence of HF symptoms. The healthy and failing SV circulating metabolomes were typified by alterations in amino acid metabolism, while the failing SV circulating metabolome was further characterized by alterations in specific energetic-related metabolites. We specifically identified pyruvate, palmitoylcarnitine, 2-oxoglutarate and GTP as promising circulating biomarkers that could be used for SV risk stratification, to monitor response to therapy and even as novel therapeutic targets.

Supplementary Materials

The following are available online at https://0-www-mdpi-com.brum.beds.ac.uk/article/10.3390/ijtm2010008/s1, Table S1: List of all metabolites identified by mass spectrometry between BVNF and SVNF serum samples, Table S2: List of all metabolites identified by mass spectrometry between BVNF and SVHF serum samples.

Author Contributions

Conceptualization, J.P.d.S. and A.M.G.; methodology, A.M.G.; formal analysis, J.P.d.S. and A.M.G..; investigation, J.P.d.S., A.M.G., A.N.B.-G. and A.E.P.; resources, A.M.G.; data curation, J.P.d.S. and A.M.G.; writing—original draft preparation, J.P.d.S. and A.M.G.; writing—review and editing, A.M.G.; visualization, J.P.d.S. and A.M.G.; supervision, A.M.G.; funding acquisition, A.M.G. All authors have read and agreed to the published version of the manuscript.

Funding

This work was supported by the Colorado Clinical and Translational Sciences Institute (CCTSI) Child and Maternal Health Pilot Award and the CCTSI KL2 award (to A.M.G), supported by the Colorado Clinical and Translational Science Award grants UL1-TR002535, KL2-TR002534 and TL1-TR002533 from the National Center for Advancing Translational Sciences; the Additional Ventures Foundation Single Ventricle Research Fund Award (to A.M.G); and the CU Nutrition Obesity Research Center Pilot and Feasibility award (to A.M.G), supported by NIDDK grant number DK048520.

Institutional Review Board Statement

The study was conducted according to the guidelines of the Declaration of Helsinki and National Institutes of Health Guidelines and approved by the Institutional Review Board of the University of Colorado Anschutz Medical Campus Institutional Animal Care and Use Committee.

Informed Consent Statement

Subjects or guardians of subjects less than 18 years of age included in this study gave written informed consent prior to inclusion.

Data Availability Statement

The data presented in this study are available in this article and in Supplementary Materials.

Acknowledgments

We are deeply appreciative of all SV patients and their parents, seen at Children’s Hospital Colorado for their agreement to participate in this study. We would like to acknowledge the Heart Transplant Team at Children’s Hospital Colorado, as well as the study coordinators, Megyn Gordon and Emanuel Gebreab. Additionally, we wish to thank the University of Colorado School of Medicine Metabolomics Core (supported by the Cancer Center Support Grant P30CA046934) for their contributions to this manuscript.

Conflicts of Interest

The authors declare no conflict of interest.

References

  1. Coats, L.; O’Connor, S.; Wren, C.; O’Sullivan, J. The single-ventricle patient population: A current and future concern a population-based study in the North of England. Heart 2014, 100, 1348–1353. [Google Scholar] [CrossRef] [PubMed]
  2. Julsrud, P.R.; Weigel, T.J.; Van Son, J.A.; Edwards, W.D.; Mair, D.D.; Driscoll, D.J.; Danielson, G.K.; Puga, F.J.; Offord, K.P. Influence of ventricular morphology on outcome after the Fontan procedure. Am. J. Cardiol. 2000, 86, 319–323. [Google Scholar] [CrossRef]
  3. McGuirk, S.P.; Winlaw, D.S.; Langley, S.M.; Stumper, O.F.; De Giovanni, J.V.; Wright, J.G.; Brawn, W.J.; Barron, D.J. The impact of ventricular morphology on midterm outcome following completion total cavopulmonary connection. Eur. J. Cardio-Thoracic Surg. 2003, 24, 37–46. [Google Scholar] [CrossRef] [Green Version]
  4. Anderson, P.A.; Sleeper, L.A.; Mahony, L.; Colan, S.D.; Atz, A.M.; Breitbart, R.E.; Gersony, W.M.; Gallagher, D.; Geva, T.; Margossian, R.; et al. Contemporary Outcomes After the Fontan Procedure: A Pediatric Heart Network Multicenter Study. J. Am. Coll. Cardiol. 2008, 52, 85–98. [Google Scholar] [CrossRef] [Green Version]
  5. Alsoufi, B.; Manlhiot, C.; Awan, A.; Alfadley, F.; Al-Ahmadi, M.; Al-Wadei, A.; McCrindle, B.W.; Al-Halees, Z. Current outcomes of the Glenn bidirectional cavopulmonary connection for single ventricle palliation. Eur. J. Cardio-Thoracic Surg. 2012, 42, 42–49. [Google Scholar] [CrossRef] [Green Version]
  6. Backer, C.L. The functionally univentricular heart: Which is better--right or left ventricle? J. Am. Coll. Cardiol. 2012, 59, 1186–1187. [Google Scholar] [CrossRef]
  7. D’Udekem, Y.; Xu, M.Y.; Galati, J.C.; Lu, S.; Iyengar, A.J.; Konstantinov, I.E.; Wheaton, G.R.; Ramsay, J.M.; Grigg, L.E.; Millar, J.; et al. Predictors of Survival After Single-Ventricle Palliation: The Impact of Right Ventricular Dominance. J. Am. Coll. Cardiol. 2012, 59, 1178–1185. [Google Scholar] [CrossRef] [Green Version]
  8. Lotto, A.A.; Jones, T.J.; Brawn, W.J.; Hosein, R.; Barron, D.J. Outcome of the Norwood procedure in the setting of transposition of the great arteries and functional single left ventricle? Eur. J. Cardio-Thoracic Surg. 2009, 35, 149–155. [Google Scholar] [CrossRef]
  9. Kogon, B.E.; Plattner, C.; Leong, T.; Simsic, J.; Kirshbom, P.M.; Kanter, K.R. The bidirectional Glenn operation: A risk factor analysis for morbidity and mortality. J. Thorac. Cardiovasc. Surg. 2008, 136, 1237–1242. [Google Scholar] [CrossRef] [Green Version]
  10. Daebritz, S.H.; Nollert, G.D.; Zurakowski, D.; Khalil, P.N.; Lang, P.; Del Nido, P.J.; Mayer, J.E.; Jonas, R.A. Results of norwood stage I operation: Comparison of hypoplastic left heart syndrome with other malformations. J. Thorac. Cardiovasc. Surg. 2000, 119, 358–367. [Google Scholar] [CrossRef] [Green Version]
  11. Alsoufi, B.; Gillespie, S.; Kim, D.; Shashidharan, S.; Kanter, K.; Maher, K.; Kogon, B. The Impact of Dominant Ventricle Morphology on Palliation Outcomes of Single Ventricle Anomalies. Ann. Thorac. Surg. 2016, 102, 593–601. [Google Scholar] [CrossRef] [PubMed] [Green Version]
  12. Shaddy, R.E.; Boucek, M.M.; Hsu, D.T.; Boucek, R.J.; Canter, C.E.; Mahony, L.; Ross, D.R.; Pahl, E.; Blume, E.D.; Dodd, D.A.; et al. Carvedilol for children and adolescents with heart failure: A randomized controlled trial. JAMA 2007, 298, 1171–1179. [Google Scholar] [CrossRef] [PubMed]
  13. Hsu, D.T.; Zak, V.; Mahony, L.; Sleeper, L.A.; Atz, A.M.; Levine, J.C.; Barker, P.C.; Ravishankar, C.; McCrindle, B.W.; Williams, R.V.; et al. Enalapril in infants with single ventricle: Results of a multicenter randomized trial. Circulation 2010, 122, 333–340. [Google Scholar] [CrossRef] [PubMed]
  14. Oldenburger, N.J.; Mank, A.; Etnel, J.; Takkenberg, J.J.M.; Helbing, W.A. Drug therapy in the prevention of failure of the Fontan circulation: A systematic review. Cardiol. Young 2016, 26, 842–850. [Google Scholar] [CrossRef]
  15. Dzau, V.J. Clinical implications for therapy: Possible cardioprotective effects of ACE inhibition. Br. J. Clin. Pharmacol. 1989, 28, 183S–187S. [Google Scholar] [CrossRef] [Green Version]
  16. Kenny, L.A.; Derita, F.; Nassar, M.; Dark, J.H.; Coats, L.; Hasan, A. Transplantation in the single ventricle population. Ann. Cardiothorac. Surg. 2018, 7, 152–159. [Google Scholar] [CrossRef] [Green Version]
  17. Wishart, D.S. Emerging applications of metabolomics in drug discovery and precision medicine. Nat. Rev. Drug Discov. 2016, 15, 473–484. [Google Scholar] [CrossRef]
  18. Michel, M.; Dubowy, K.-O.; Entenmann, A.; Karall, D.; Adam, M.G.; Zlamy, M.; Komazec, I.O.; Geiger, R.; Niederwanger, C.; Salvador, C.; et al. Targeted metabolomic analysis of serum amino acids in the adult Fontan patient with a dominant left ventricle. Sci. Rep. 2020, 10, 8930. [Google Scholar] [CrossRef]
  19. Michel, M.; Dubowy, K.-O.; Zlamy, M.; Karall, D.; Adam, M.G.; Entenmann, A.; Keller, M.A.; Koch, J.; Komazec, I.O.; Geiger, R.; et al. Targeted metabolomic analysis of serum phospholipid and acylcarnitine in the adult Fontan patient with a dominant left ventricle. Ther. Adv. Chronic Dis. 2020, 11. [Google Scholar] [CrossRef]
  20. O’Connell, T.M.; Logsdon, D.L.; Mitscher, G.; Payne, R.M. Metabolic profiles identify circulating biomarkers associated with heart failure in young single ventricle patients. Metabolomics 2021, 17, 95. [Google Scholar] [CrossRef]
  21. Paridon, S.M.; Mitchell, P.D.; Colan, S.D.; Williams, R.V.; Blaufox, A.; Li, J.S.; Margossian, R.; Mital, S.; Russell, J.; Rhodes, J. A Cross-Sectional Study of Exercise Performance During the First 2 Decades of Life After the Fontan Operation. J. Am. Coll. Cardiol. 2008, 52, 99–107. [Google Scholar] [CrossRef] [PubMed] [Green Version]
  22. D’Alessandro, A.; Nemkov, T.; Kelher, M.; West, F.B.; Schwindt, R.K.; Banerjee, A.; Moore, E.E.; Silliman, C.C.; Hansen, K.C. Routine storage of red blood cell (RBC) units in additive solution-3: A comprehensive investigation of the RBC metabolome. Transfusion 2014, 55, 1155–1168. [Google Scholar] [CrossRef] [PubMed] [Green Version]
  23. D’Alessandro, A.; Moore, H.B.; Moore, E.E.; Wither, M.; Nemkov, T.; Gonzalez, E.; Slaughter, A.; Fragoso, M.; Hansen, K.C.; Silliman, C.C.; et al. Early hemorrhage triggers metabolic responses that build up during prolonged shock. Am. J. Physiol. Integr. Comp. Physiol. 2015, 308, R1034–R1044. [Google Scholar] [CrossRef] [PubMed] [Green Version]
  24. Xia, J.; Psychogios, N.; Young, N.; Wishart, D.S. MetaboAnalyst: A web server for metabolomic data analysis and interpretation. Nucl. Acids Res. 2009, 37, W652–W660. [Google Scholar] [CrossRef] [PubMed] [Green Version]
  25. Chong, J.; Soufan, O.; Li, C.; Caraus, I.; Li, S.; Bourque, G.; Wishart, D.S.; Xia, J. MetaboAnalyst 4.0: Towards more transparent and integrative metabolomics analysis. Nucleic Acids Res. 2018, 46, W486–W494. [Google Scholar] [CrossRef] [PubMed] [Green Version]
  26. Chong, J.; Xia, J. MetaboAnalystR: An R package for flexible and reproducible analysis of metabolomics data. Bioinformatics 2018, 34, 4313–4314. [Google Scholar] [CrossRef] [Green Version]
  27. Guo, S.; Kong, J.; Zhou, D.; Lai, M.; Chen, Y.; Xie, D.; Wang, X.; Wang, D. Serum metabolic characteristics and biomarkers of early-stage heart failure. Biomark. Med. 2020, 14, 119–130. [Google Scholar] [CrossRef]
  28. Zordoky, B.; Sung, M.M.; Ezekowitz, J.; Mandal, R.; Han, B.; Bjorndahl, T.C.; Bouatra, S.; Anderson, T.; Oudit, G.Y.; Wishart, D.S.; et al. Metabolomic Fingerprint of Heart Failure with Preserved Ejection Fraction. PLoS ONE 2015, 10, e0124844. [Google Scholar] [CrossRef]
  29. Hunter, W.; Kelly, J.P.; McGarrah, R.W.; Khouri, M.G.; Craig, D.; Haynes, C.; Ilkayeva, O.; Stevens, R.D.; Bain, J.R.; Muehlbauer, M.J.; et al. Metabolomic Profiling Identifies Novel Circulating Biomarkers of Mitochondrial Dysfunction Differentially Elevated in Heart Failure with Preserved Versus Reduced Ejection Fraction: Evidence for Shared Metabolic Impairments in Clinical Heart Failure. J. Am. Hear. Assoc. 2016, 5, e003190. [Google Scholar] [CrossRef] [Green Version]
  30. Hunter, W.G.; Kelly, J.P.; McGarrah, R.W.; Kraus, W.E.; Shah, S.H. Metabolic Dysfunction in Heart Failure: Diagnostic, Prognostic, and Pathophysiologic Insights from Metabolomic Profiling. Curr. Hear. Fail. Rep. 2016, 13, 119–131. [Google Scholar] [CrossRef] [Green Version]
  31. Nesterov, S.V.; Yaguzhinsky, L.S.; Podoprigora, G.I.; Nartsissov, Y.R. Amino Acids as Regulators of Cell Metabolism. Biochemistry (Mosc) [Internet]. Biochemistry 2020, 85, 393–408. [Google Scholar] [PubMed]
  32. Ueda, K.; Sanbongi, C.; Takai, S.; Ikegami, S.; Fujita, S. Combination of aerobic exercise and an arginine, alanine, and phenylalanine mixture increases fat mobilization and ketone body synthesis. Biosci. Biotechnol. Biochem. 2017, 81, 1417–1424. [Google Scholar] [CrossRef] [Green Version]
  33. Brittain, E.L.; Talati, M.; Fessel, J.P.; Zhu, H.; Penner, N.; Calcutt, M.W.; West, J.; Funke, M.; Lewis, G.D.; Gerszten, R.E.; et al. Fatty Acid Metabolic Defects and Right Ventricular Lipotoxicity in Human Pulmonary Arterial Hypertension. Circulation 2016, 133, 1936–1944. [Google Scholar] [CrossRef]
  34. Gray, L.R.; Tompkins, S.C.; Taylor, E.B. Regulation of pyruvate metabolism and human disease. Cell. Mol. Life Sci. 2014, 71, 2577–2604. [Google Scholar] [CrossRef] [PubMed] [Green Version]
  35. Li, M.; Zhou, S.; Chen, C.; Ma, L.; Luo, D.; Tian, X.; Dong, X.; Zhou, Y.; Yang, Y.; Cui, Y. Therapeutic potential of pyruvate therapy for patients with mitochondrial diseases: A systematic review. Ther. Adv. Endocrinol. Metab. 2020, 11. [Google Scholar] [CrossRef] [PubMed]
  36. Chen, P.-A.; Xu, Z.-H.; Huang, Y.-L.; Luo, Y.; Zhu, D.-J.; Wang, P.; Du, Z.-Y.; Yang, Y.; Wu, D.-H.; Lai, W.-Y.; et al. Increased serum 2-oxoglutarate associated with high myocardial energy expenditure and poor prognosis in chronic heart failure patients. Biochim. Biophys. Acta Mol. Basis Dis. 2014, 1842, 2120–2125. [Google Scholar] [CrossRef] [Green Version]
Figure 1. Serum metabolite profiling identified significant changes in non-failing SV subjects. (A) Principal component analysis of all identified metabolites segregated BVNF (n = 5) and SVNF (n = 5) serum samples. (B) Volcano plot representation of all the 196 metabolites detected by mass spectrometry as the log2 fold-change in expression (x-axis) and the log odds of a gene being differentially expressed (y-axis), highlighting the 16 metabolites that were significantly differentially expressed between BVNF and SVNF sera (above dotted line). (C) Significant and non-significant changes in serum metabolite expression in SVNF vs. BVNF. (D) Heatmap of the 16 significantly differentially expressed metabolites. Unsupervised hierarchical clustering separated BVNF (n = 5) and SVNF (n = 5) serum samples. Each sample is represented by a single column. The higher the intensity of the red color, the higher the abundance of the metabolite.
Ijtm 02 00008 g001
Figure 2. Primary affected metabolic pathways identified in SVNF serum samples. (A) The x-axis and size of circles represent impact of differential metabolites within the pathway. The y-axis and color of circles represent statistical significance of the overall metabolic changes within the pathway. (BD) Schematic representation of the top three dysregulated pathways between BVNF and SVNF serum samples. (B) Riboflavin metabolic pathway. (C) Arginine and proline metabolic pathway. (D) Phenylalanine metabolic pathway. Metabolites highlighted in red boxes are among the 16 metabolites differentially expressed between BVNF and SVNF serum samples.
Ijtm 02 00008 g002
Figure 3. SVHF serum elicited significant metabolite changes compared to BVNF serum. (A) Dendrogram of metabolites separated between BVNF (n = 5) and SVNF (n = 5) serum samples. (B) Volcano plot representation of all the 196 metabolites detected by mass spectrometry as the log2 fold-changes in expression (x-axis) and the log odds of a gene being differentially expressed (y-axis), highlighting the 34 metabolites that were significantly differentially expressed between BVNF versus SVHF sera (above dotted line). (C) Significant and non-significant changes in serum metabolite expression in SVHF vs. BVNF. (D) Heat map of the 34 significant metabolites. Unsupervised hierarchical clustering separated BVNF (n = 5) and SVHF (n = 5) serum samples. Each sample is represented by a single column. The higher the intensity of the red color, the higher the abundance of the metabolite.
Ijtm 02 00008 g003
Figure 4. Primary affected metabolic pathways identified in SVHF serum samples. (A) The x-axis and size of circles represent impact of differential metabolites within the pathway. The y-axis and color of circles represent statistical significance of the overall metabolic changes within the pathway. (BD) Schematic representation of the top three dysregulated pathways between BVNF and SVHF serum samples. (B) Glutathione metabolism pathway. (C) Pyruvate metabolic pathway. (D) Arginine and proline metabolic pathway. Metabolites mentioned in red boxes are among the 34 metabolites differentially expressed between BVNF and SVNF serum samples.
Ijtm 02 00008 g004
Figure 5. Common and unique metabolite profiles in SVNF and SVHF subjects. (A) Venn dendrogram of differentially expressed metabolites in each group. (B) Abundance of serum circulating arginine and glutamate in BVNF, SVNF and SVHF subjects. For all groups, bar equals mean ± SEM; each point represents individual patient values (n = 5 BVNF, n = 5 SVNF and n = 5 SVHF subjects); p-values as indicated based on a one-way ANOVA (Welch’s) and Tukey’s multiple comparison test. (C) Correlation analysis between circulating levels of glutamate and arginine for all groups; dotted line is the 95% confidence interval; R2 and p-value as indicated based on goodness of fit (solid line, R2) and simple linear regression (p-value).
Ijtm 02 00008 g005
Figure 6. Multivariate analysis-based diagnostic potential of metabolomic profiles to distinguish BVNF from SVHF subjects. (A) ROC curves based on the cross-validation (CV) performance (curves are from all models averaged from all CV runs). (B) The predictive accuracy of each model based on the total number of metabolite features included in the model, from 5 to 100. (C) A specific ROC curve (Model 2) demonstrating the AUC and 95% confidence interval (CI). (D) The top 10 metabolite features, based on frequency, used for the predictive model (Model 2).
Ijtm 02 00008 g006
Figure 7. Multivariate analysis-based diagnostic potential of metabolomic profiles to distinguish SVNF from SVHF subjects. (A) ROC curves based on cross-validation (CV) performance (curves are from all models averaged from all CV runs). (B) The predictive accuracy of each model based on the total number of metabolite features included in the model, from 5 to 100. (C) A specific ROC curve (Model 5) demonstrating the AUC and 95% confidence interval (CI). (D) The top 15 metabolite features, based on frequency, used for the predictive model (Model 5).
Ijtm 02 00008 g007
Figure 8. Univariate analysis-based diagnostic potential of individual metabolites to distinguish BVNF from SVHF or SVNF from SVHF. (AD) univariate ROC curves demonstrating the AUC and 95% confidence interval (CI) and bar graphs demonstrating metabolite abundance for each of the top scoring specific metabolites. (A) Pyruvate. (B) Palmitoylcarnitine. (C) 2-Oxoglutarate. (D) GTP. For all groups, bar equals mean ± SEM; each point represents individual patient values (n = 5 BVNF, n = 5 SVNF and n = 5 SVHF subjects); p-values as indicated based on a one-way ANOVA (Welch’s) and Tukey’s multiple comparison test.
Ijtm 02 00008 g008
Table 1. Patient characteristics.
Age (years)SexPDE3iPDE5iNon-PDEi
Inotrope
DigoxinACEiβ-BlockerDiureticLast Surgical PalliationIndication for Blood Draw
Biventricular Non-Failing Control Subjects (BVNF)
5.4MNNNNNNN-control
4.1MNNNNNNN-control
5.6FNNNNNNN-control
4.1MNNNNNNN-control
12.6MNNNNNNN-control
Non-Failing Single Ventricle Subjects (SVNF)
1.8FNNNNNNNGlenn/Hemi-FontanSVNF
0.011FNNNNNNNNorwoodSVNF
0.3MNNNNNNNNorwoodSVNF
2.9FNNNNNNYGlennSVNF
0.6MNNNYNNYNorwoodSVNF
Failing Single Ventricle Subjects (SVHF)
3.85FYYYYYNYFontanSV Systolic HF
0.99FYNNYYNYNorwoodSV Systolic HF
12.26MNNNYYNNGlenn/Hemi-FontanSV Systolic HF
2.84FYNNYYNYGlennSV Systolic HF
14.8MNYNYYNYFontanSV Systolic HF
PDEi, phosphodiesterase inhibitors; ACEi, Angiotensin-converting-enzyme inhibitors; M, male; F, female; N, no; Y, yes.
Table 2. List of all differentially expressed metabolites in BVNF versus SVNF sera, classified by each implicated pathway.
MetaboliteFold Changep-Value
Alcohols and polyols
Inositol 1-2-3-5-6-pentakisphosphate−1.7490.026
Amino acids
arginine−1.6770.002
5-Aminopentanoate−1.8020.002
phenylalanine−2.0530.025
Aminosugars
N-Acetylneuraminate2.1350.015
Arginine and proline metabolism
4-Acetamidobutanoate2.0090.023
Carbohydrates and carbohydrate conjugates
Ferric gluconate−17.7370.000
Carnitine and fatty acid metabolism
Carnitine−1.3730.031
Essential fatty acids
Docosapentaenoic acid−2.4550.014
GSH homeostasis
S-Glutathionycysteine−2.4630.022
Organosulfur compounds
Diallyl sulfide−1.4320.049
Panthothenate metabolism
Pantothenol4.5900.022
Phosphates
Phosphate1.5850.014
Pteridines and derivatives
Riboflavin4.0320.047
Serine biosynthesis and one-carbon metabolism
Dimethylglycine−2.0040.037
TCA cycle
Succinate2.5900.033
Table 3. List of all differentially expressed metabolites in BVNF versus SVHF sera, classified by each implicated pathway.
MetaboliteFold Changep-Value
Amino acids
arginine−5.0000.000
N-Acetycitrulline−1.5100.006
2′-3′-Cyclic CMP−1.6560.007
glutamate7.2320.008
2S-5S-Methionine sulfoximine14.3410.019
1-Pyrroline-3-hydroxy-5-carboxylate2.9270.020
Arginine and proline metabolism
4-Acetamidobutanoate1.9250.002
Azoles
(S)(+)-Allantoin1.8500.034
Carbohydrates and carbohydrate conjugates
Ferric gluconate−6.2640.001
Carnitine and fatty acid metabolism
butanoycarnitine3.8360.043
Palmitoylcarnitine2.0600.044
O-dodecanoycarnitine5.8950.047
Carnitine1.9630.050
Coumarins and derivatives
Triacanthine1.8840.030
Essential fatty acids
(5Z-8Z-11Z-14Z-17Z)-Icosapentaenoic acid−2.3780.040
Glycerophospholipid biosynthesis
Choline2.0720.006
Ethanolamine phosphate1.5870.041
Glycolysis
Pyruvate4.8720.004
Lactate4.3110.012
GSH homeostasis
Ascorbate−51.4190.011
5-Oxoproline2.9250.012
Indoles and derivatives
Indole-3-acetaldehyde−4.6360.032
Indole-3-acetate1.9820.037
Nucleotides
GTP4.3370.005
Allantoate3.5130.027
Panthothenate metabolism
Pantetheine−5.7270.050
Poly-unsaturated Fatty Acids
beta-D-Glucuronoside2.7640.018
Eicosapentaenoic acid−2.3780.040
Pteridines and derivatives
Riboflavin5.4920.035
Pyrimidines and pyrimidine derivatives
6-Thioxanthine 5--monophosphate4.4330.034
Saturated Fatty acids
Hexanoic acid (caproate)1.6560.001
Octanoic acid (caprylate)2.8090.036
Sulfur metabolism
Taurine1.8590.026
Urea cycle
Ornithine3.4590.049
Publisher’s Note: MDPI stays neutral with regard to jurisdictional claims in published maps and institutional affiliations.

