
Dyes from the Southern Lands: An Alternative or a Dream?

Laboratorio de Biomateriales, Instituto de Química Biológica, Facultad de Ciencias, Universidad de la República, Iguá 4225, Montevideo 11400, Uruguay
Solar 2022, 2(4), 519-539; https://0-doi-org.brum.beds.ac.uk/10.3390/solar2040031
Submission received: 13 September 2022
/
Revised: 3 November 2022
/
Accepted: 9 November 2022
/
Published: 15 November 2022
(This article belongs to the Special Issue The Forth-Coming Era of Photovoltaic Technologies: Hybrid Organic-Inorganic Solar Cells)
Abstract
:DSSC technology based on natural dyes still constitutes a tempting alternative to explore. Besides the ease of extraction, most natural dyes fulfill the characteristics to be applied as sensitizers. The presented results summarize the exploration of the features of several southern dyes, mostly coming from the Antarctic region. The explored pigments showed good absorption capacity within the visible region of the light spectra, and their molecules possess functional moieties to coordinate with the TiO2 semiconductor, oxidation potential value near 1 V and reduction potential near −0.8 V, adequate thermal stability, and low fluorescence emission.
1. Introduction
In many countries, solar energy utilization represents a tiny percentage of the removable. Why is this? Is the motive based on the prizes of the panels? Or is it mainly due to space reasons? Silicon-based solar panels need their own space to be placed and sometimes it is not possible to utilize this land for other purposes.
In this sense, dye-sensitized solar panels constitute an exciting alternative to explore. Being integrated into BIPV “greenhouses” buildings as curtains or inside the room offers a way to obtain energy from the Sun without special space requirements. DSSC can operate even under diffuse light. Besides, they are transparent; for this, they can be used as power-generating building blocks [1,2,3,4,5,6,7,8,9,10,11,12].
DSSC constitutes a subject still undergoing intense study. Efforts are searching for higher conversion efficiencies, where the modification of the mesoporous TiO2 electrodes using nanoparticles or nanocomposites [13,14,15,16], or the exploration of other materials rather than platinum for the counter electrode [17,18], are some strategies to follow.
Some remarkable examples of this technology are the large panels integrated into the buildings, such as those found at the Lausanne Swiss Convention Centre, Graz Science Tower, and the Danish Roskilde University. Applications of DSSC are not limited to the use of power-generating building blocks or windows. They are tested as textile DSSCs for wearable electronic devices, canopies, sunshades, or covers [19]. They can also be integrated with other power generator systems such as sun-driven water-splitting devices for H2 production [20], batteries for portable electronics [21], or thermoelectric generators and coolers [22].
Natural pigments are still the focus of research, despite the lower conversion efficiencies compared to those obtained with synthesized dyes [23,24,25,26,27,28,29,30]. Using natural dyes as sensitizers could provide an option to take advantage of large amounts of invasive species, discarded fruits or species without a commercial interest. For these cases, it is possible to extract the pigments using a single solvent. Moreover, assembling DSSC modules sensitized with natural dyes constitutes an undervalued but promising goal because it is cheap and environmental-friendly since pigment extraction is effortless and involves non-harmful reagents and methods [31,32,33]. Evaluating these devices’ stability and performance with time is still a question. Among photovoltaics, building-integrated DSSC could offer a technological solution for cold regions, protecting the dye-sensitized panels against climate inclemency [34]. Moreover, if panels are constructed using natural dyes as sensitizers, the low temperatures constitute an ally regarding thermal stability.
Which sources can be explored? Pigments can be extracted from fruits and flowers with a particular focus on native species, from seaweed, which mostly became a non-commercially exploited product, deposited on the coast, or can be produced by bacteria. With structure diversity, dyes such as anthocyanins, xanthophylls, carotenoids, violacein, and phycoerythrin are obtained from the mentioned sources.
They all have some characteristics in common: (a) a good absorption capacity, i.e., molar extinction coefficient as high as possible, within the visible region of the light spectra; (b) the existence of functional moieties to coordinate with the TiO2 semiconductor (mainly -OH and/or -COOH), assuring a strong anchorage onto the surface and, thus, optimize the electron injection pathway; (c) an oxidation potential value near 1 V, to ensure more effective dye regeneration and suppression of the recapture of the injected electrons by the dye cation; (d) LUMO values higher than the conduction band-edge energy level of the TiO2 electrode to assure that the electron injection process is energetically favorable; (e) adequate thermal and light stabilities; and (f) very low fluorescence emission [35,36,37,38].
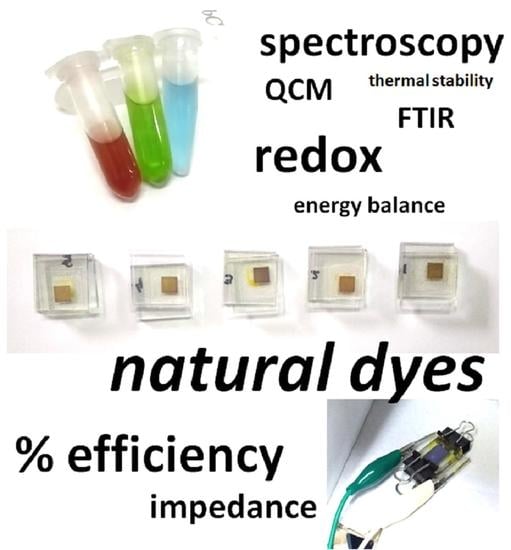
This work briefly presents the characteristics of pigments extracted from southern sources applied as sensitizers (Figure 1). Many of them were collected in Antarctica. This continent is particularly interested in using renewable energy to protect it from contamination. Solar is sub-used and DSSCs, as indoor devices, could be interesting to explore, mainly based on sensitizers from the region.
2. Materials and Methods
2.1. Dyes Obtaining
For all evaluated pigments, extraction steps are easy, low-cost, and effortless.
In particular, anthocyanins were extracted using ethanol after crushing the frozen flowers or fruits into a fine powder using a mortar [31,32,39,40]. The remaining solids were eliminated by filtration or centrifugation and, finally, solutions were concentrated by evaporation at room temperature or under vacuum (SpeedVac or lyophilization). After that, purification was followed using a C18 disposable column (BAKERBOND speTM, octadecyl C18) and a methanol-acetonitrile (30/70) mixture as elution solvent. In some cases, an extraction step with heptane was performed before using the C18 column. The eluted solution was concentrated, as explained above.
A similar procedure was followed for fucoxanthin extraction, where the brown Himantothallus grandifollius algae (collected in Antarctica) were mixed with liquid nitrogen and crushed in a mortar to get a finely divided powder. After that, the powder was mixed with ethanol and sonicated for 10 min. Purification was followed using a strongly acidic Dowex® 50 WX8 cationic exchange resin to eliminate chlorophyll, the main compound besides fucoxanthin. Extract solutions were concentrated and evaporated at low-temperature evaporation by lyophilization [41,42].
Xanthophylls pigments were extracted from the Antarctic Hymenobacter sp. UV1. Solutions of the orange dye were purified using disposable silica columns (SUPELCLEAN LC-Si, SUPELCO) with a mixture of acetonitrile/methanol 4/1 as the mobile phase. After that, samples were dried under nitrogen and re-dissolved in ethanol [43].
The violacein was produced by the Antarctic bacterium Janthinobacterium sp. UV13 and filtered using 0.45 µm pore size filters from Millipore to eliminate large high-molecular-weight compounds [44].
2.2. Photoanode Sensitization
Sensitization of the anode by soaking the FTO/TiO2 electrode overnight into the dye solution is the most typical procedure [25,32,48,49]. This step is crucial to assure the adsorption of the pigment molecules onto the TiO2 surface. A long immersion time is needed to adsorb the dyes, obtaining an ordered assembling of their molecules, as adsorption is difficult to the depth of the TiO2 thin film in a short time.
When using mixtures, the co-sensitization of TiO2 substrates was carried out by two approaches: (i) sequential attaching or (ii) using a cocktail of pigments [50]. For the sequential, the best results were obtained when the primary dye under study was used as a sensitizer in the first place. Twenty-four hours later, the co-adsorbent (mostly silver NPs) was added to the photoelectrode [44,46,47]. On the other side, the cocktail is a mix of both containing solutions.
2.3. Statistical Considerations
Some statistical considerations were followed to check the reproducibility of the measured results from the evaluated DSSC.
The displayed value measured or calculated from the density current vs. potential (J-V) profiles arises from five assembled cells using the same dyes or cocktails. Thus, the mean and the standard deviation (SD) were calculated from the individual DSSC efficiencies registered under each experimental condition. The results presented in the main text and table correspond to average values expressed as mean ± SD.
Once the J-V curves for the different DSSC were recorded, three assembled cells using the same dyes or cocktails were selected for evaluation by applying electrochemical impedance spectroscopy (EIS). From these measurements, resistance and capacitance values were obtained from the best fitting of the impedance plots using ZView Software for Windows, following Chi-Squared criteria lower than 0.001. In this case, the resistance ratios and times are expressed as mean values from the three independent measurements using relative standard deviations.
3. Results and Discussion
3.1. Spectroscopy Evaluation
As dyes were extracted from natural resources such as flowers, fruits, algae, or produced by bacteria, purification steps were necessary. Besides, a fast evaluation of the procedure was always required. However, reflection spectra of the deposited dyes and co-sensitizers onto the TiO2 photoanode were obtained to confirm the adsorption of the species.
In this regard, UV-visible characterization was a great tool to assess the presence or absence of chlorophyll (CH) in the extracted solutions, with the main compound present in most samples joining the dye under evaluation. For this reason, the disappearance of the peak at 510, the double peak at 545–575, and that at 600 nm (assigned to CH) was followed [42].
After purification, spectra of solutions containing anthocyanins showed a main peak at ca. 550 nm. Anthocyanins concentration could be calculated using the reported molar absorption coefficients 26,900 L mol−1 cm−1 for extracts from Erythrina crista-galli flowers (mainly cyanidin-3-glucoside, CYA3GLU) and 23,700 L mol−1 cm−1 for extracts coming from Eugenia uniflora L. or blueberries Southern Highbush type (both containing mainly delphinidin-3-glucoside, DEL3GLU) [39,40].
Fucoxanthin (FUCO) concentration was calculated (in mg L−1) considering the contribution arising from the presence of chlorophyll, a compound that remained even after purification steps [24]:
[fuco] = 6.39 × A445 − 5.18 × A663
Extracted samples from the Antarctic Hymenobacter sp. UV1 contained polysaccharides (mainly α-1,4-glucan) and xanthophylls (probably 2′-hydroxyflexixanthin). In this case, with a reported molar attenuation coefficient of 140 × 103 L mol−1 cm−1 at 453 nm in ethanol (the average reported value for carotenes and xanthophylls), it is possible to estimate the xanthophylls concentration in extracted samples [43,51].
Another compound also produced for an Antarctic bacterium was violacein. According to Beer–Lambert’s equation, the concentration of violacein was calculated using an absorption coefficient of 56.01 L g−1 cm−1 at 575 nm [44].
The last group of evaluated pigments were the red phycoerythrin (PE) and the blue phycocyanin (PC), extracted from southern algae and Spirulina spp., respectively. In these cases, molar concentrations were assessed using a molar absorption coefficient value of 1.96 × 10⁶ L g−1 cm−1 at 550 nm for phycoerythrin and 2.3 × 10⁵ L mol−1 cm−1 at 615 nm for phycocyanin [45,46,47].
The reflection spectra offered a piece of interesting and complementary information. The adsorption of the evaluated compounds onto TiO2 was measured using a SPELEC (DROPSENS) spectrometer equipped with a tungsten halogen lamp and an optic fiber connector. The system achieved reflection experiments within the 350 to 800 nm range. Then, the spectra for the FTO/TiO2 electrodes soaked overnight in the dye-containing solution were recorded.
Firstly, the adsorption of all the evaluated dyes was confirmed. Almost the same absorbance peaks detected in the dye containing solution (Figure 2, left side) were observed in the case of the adsorbed species onto the TiO2 electrodes (right side).
For anthocyanins, some common features were observed. After absorption, the main absorbance peak of the anthocyanins splits into two contributions, probably due to the equilibrium species involving these molecules [52,53]. The adsorption of chlorophyll (peaks within the 600 to 670 nm range) is detected, but clearly anthocyanins are the main compounds attached to the semiconductor. For studies involving delphinidin-3-glucoside, a slight displacement in the position of the absorbance maximum was also observed.
The presence of chlorophyll was also detected in the case of fucoxanthin. Still, in this case, and as expected, due to the structural characteristics of this molecule, the adsorption of chlorophyll to the electrode surface was of great importance.
The evaluation of the delphinidin-3-glucoside complexes with Cr (III) showed the instability of the compound after adsorption to the electrode surface. The spectra for the complex in the solution showed a main peak at 445 nm and some contribution coming from some remaining free delphinidin [40]. After soaking the electrode into this solution, the reflection spectra displayed the presence of the peak at 580 nm, attributed to the presence of free Cr (III); simultaneously, the peak arising from the metallic complex decreased. Then, as will be discussed later, the efficiency improvement of the assembled DSSC in the presence of the complexes would have an interesting contribution to the free metal and not only the complex.
What happened when silver-NPs were added? In all evaluated cases, they raised the efficiency of the DSSC. However, the reasons could be different.
After adsorption, a peak at 400–405 nm was detected. The existence of NP100 could explain this due to the quadrupole component of the plasmon resonance for silver nanoparticles of the selected diameter [54]. This peak was readily detected in the case of fucoxanthin, but the opposite occurred when anthocyanins were the molecules under evaluation. Therefore, when a long-chain molecule is adsorbed to the surface, it is difficult to get a compact film onto the semiconductor and naked zones remain, giving place to surface defects. The presence of impurities, such as chlorophyll, could take the opportunity to occupy these naked zones, but chlorophylls are also big-sized molecules. NPs could solve this situation, assuring the best surface coverage and therefore increasing the efficiency of assembled DSSC.
Anthocyanins are small molecules and can get excellent surface coverage, as demonstrated using the QCM technique. In this case, defects are scarce and NP (showing in the case of anthocyanins cocktails a low absorbance peak at around 400 nm) could find only a few spots to be located. The same observation can be applied to the violacein case; once again, the intensity of the absorbance peak assigned to the NP is very low, indicating a good surface coverage due to the small-sized molecule under evaluation.
3.2. FTIR
FTIR measurements help assess the adsorption of the evaluated dyes onto the FTO/TiO2 electrode surface. The spectra of a purified solution containing the dye under evaluation and the pigments after incubation for 24 h onto TiO2 electrodes were recorded (Figure 3). After immersion in the dye containing solution, the photoanode was rinsed profusely with ethanol. The electrode surface was then scraped and 1% KBr pellets were prepared to be analyzed. Then, detecting signals from the functional group of the pigment in the spectra confirmed their attachment to the semiconductor surface, especially when the position of signals for the groups involved in the bonding shifted to different frequencies. Blank experiments were achieved using KBr samples containing 1% TiO2 to assess its signals in the explored range. Signals within the 750–400 cm−1 range can be attributed to the TiO2 semiconductor [40,41,42,43,44].
The analysis for the anthocyanins containing systems, i.e., free compounds vs. TiO2 adsorbed compound, showed some essential features in the “fingerprint” zone 1542 cm−1 y 965 cm−1. Signals at 1454 cm−1 and 1421 cm−1 were assigned to the vibration of the C-C=C bonds belonging to phenolic groups and disappeared after adsorption to the semiconductor. The disappearance of the C-O vibration band (phenol groups) at 1250 cm−1 points to the union of the anthocyanins to TiO2 through this functional group. A similar fact is observed concerning the signal at 1060 cm−1, assigned to C-O stretching of primary alcohol as in the glucose or the stretching signal from the C-O-C. After union with the TiO2, the signal shifts and splits into two separated signals at 1130 and 1000 cm−1. Finally, signals within the 916 cm−1 and 779 cm−1 range related to C-H vibrations of an aromatic ring are affected after adsorption to TiO2 [40,55,56].
The ratio of the band intensity at 1065 cm−1 to those at 1400 cm−1 is modified after coordinating the anthocyanins to the semiconductor or to Cr (III) or Mg (II) to form the complexes. Additionally, the intensities ratio of the band at 1065 cm−1 to those within the range 800–830 cm−1 changed notoriously after the adsorption of the Cr o Mg species to the TiO2. Additionally, the signal at 800 moves to 830 cm−1 after adsorption of the chromium species and to 810 cm−1 in the case of magnesium ones. Then, the complexation with metals can also be confirmed using FTIR spectroscopy, as well as the adsorption of these metal compounds onto the TiO2 surface.
In the case of fucoxanthin and after incubation for 24 h onto TiO2 electrodes, bands within the range 950–1300 cm−1 are modified, indicating the establishment of bonds between FUCO and the nanostructured semiconductor. Then, signals from secondary and tertiary hydroxyl, ether, ester, and carbonyl and conjugated double bonds were present. The union to the semiconductor through the -OH group of the fucoxanthin influenced the signal at 1080 cm−1 (secondary alcohol C–O stretch). The ratio of the intensity of the 1080 cm−1 band to the signal at 1058 cm−1 (ether C–C(O)–C bending) changed after the adsorption of fucoxanthin onto TiO2. The band at 1038 cm−1 also moves to 1030 cm−1. Hence, the bound to the TiO2 is confirmed, and this union takes place through an -OH group of fucoxanthin [41,56,57,58].
In samples containing xanthophylls, the presence of bands at 1630 cm−1 were assessed to conjugated C=O and C=C groups, while the strong signals at 2920 cm−1 correspond to characteristic stretching frequencies of the C–H bond. The presence of carbonyl groups is also detected. Lastly, bands at 1220 and 1078 cm−1 at free samples can be assigned to the C–O stretching frequencies from polysaccharides and move towards 1130 and 1070 cm−1 after binding to the TiO2 [43].
3.3. Redox Behaviour
Cyclic voltammetry profiles were recorded to evaluate the redox behavior of pigments by using DROPSENS SPELEC1050 potentiostat with disposable electrodes (DROPSENS), where Au-pc was the working one and carbon was the counter one, respectively. Potential scan rate routines within the range of 0.01–0.05 Vs−1 were applied.
All potentials in the text are referred to the NHE.
For anthocyanins, profiles were obtained in a mixture of ethanol/NaClO4 0.1 M (50/50) as the supporting electrolyte. Firstly, profiles were evaluated for the Au-pc in the supporting electrolyte, showing the presence of the redox contributions arising from different stages of O-electro adsorption on Au, overlapped to the signals coming from the Cl−/ClO4−. The O-electro adsorption potential region occurs from 1.2 V, with a cathodic counter peak at ca. 0.7 V. Redox contributions due to the perchlorate presence occur at potential values lower than 0 V.
From the voltametric profiles for Au-pc in the cyanidin-3-glucoside solution in the supporting electrolyte, an anodic contribution arises at 1.3 V, with a cathodic counter peak within the range 0.6 to 0.9 V (depending on the potential scan rate v). According to previous reports, this could be assigned to the electron exchange involving the OH groups of the anthocyanins following a two-step path. At the first step, OH adsorption takes place, then, at higher redox potential, oxidation to ketene occurs. Complementary studies using EQCM techniques revealed that, in the anodic scan direction, adsorption of anthocyanin takes place from ca. 0 V, followed by the primary desorption process after OH oxidation at 1.3 V. Besides, at the cathodic scan, some mass deposition is detected in the range of 0 to 0.9 V. As reported, OH groups can adsorb, whereas ketene cannot.
An important cathodic contribution was detected in the potential subzero zone at −0.8 V, associated with reducing the flavylium ion [59,60,61,62].
Voltametric profiles for Au-pc in the delphinidin-3-glucoside solution in the supporting electrolyte showed an anodic contribution at 1.15 V, with the cathodic counter peak in the range 0.5–0.7 V depending on the applied v (Figure 4a). For Cr (III) and Mg (II) metal complexes, the anodic peak appeared at 1.08 V and the cathodic contribution was observed at 0.43 V.
In the case of fucoxanthin, the profiles recorded at v = 0.05 V s−1 for Au-pc in the supporting electrolyte (a mixture of 50/50 ethanol/0.1 M NaClO4 in Milli-Q water) showed an anodic contribution at 1.46 V, with a cathodic counter peak at 0.76 V. The linear adjustment between the intensity of the current peak vs. the potential scan rate v probed the adsorption of the evaluated species onto the electrode surface. The anodic peak at 1.46 V was assigned to oxidation processes involving fucoxanthin. As reported, p-electron conjugated chains of carotenoids are oxidized simultaneously to form cation radical and dication species. The two electrons are transferred in one step, raising an anodic peak. Besides, the cathodic contribution is generated by reducing the deprotonated radical or deprotonated carotenoid cation. The cation radical and dication of fucoxanthin are not stable at ambient temperature, therefore the cathodic peak is minimal [63,64]. Oxidation of -OH has also been previously reported and could be superimposed to the other processes discussed above [65,66]. The adsorption of hydroxyl groups to the gold surface occurs at potentials higher than 0.4 V and is followed by oxidation.
For profiles measured in the presence of xanthophylls a main anodic contribution at 1.4 V is detected at the first potential scan but not in the following cycles (Figure 4b). Here, the electroactive dye occupies the electrode surface in the first scan. On the other hand, the observed cathodic peak can be explained by the voltametric behavior of the supporting electrolyte. The cathodic peak at ca. 0.5 V emerges mainly from the O-desorption process ascribed to the oxide monolayer produced in the anodic scan. The current intensity of this peak depends on the upper scanning potential [67]. The electroactive groups for the main xanthophylls (2′-hydroxyflexixanthin) produced by Hymenobacter sp. UV11 are C=O or OH. The oxidation of the OH moieties could explain the anodic peak at 1.4 V in the first potential scan. The oxidation of the OH implicates the adsorption of this group onto the electrode surface, and additionally, xanthophyll molecules are big and diffuse slowly. Then, xanthophyll diffuses towards the electrode surface, adsorbs to the metal using the OH groups, and this group is oxidized at the first potential scan. As the OH oxidation is irreversible, the hydroxyl is no longer available in the electrode interface for further potential scans. New fresh molecules cannot reach the electrode interface in the following scans. For this, an anodic peak ascribed to OH oxidation is not detected.
Another analyzed molecule was the violacein produced by Janthinobacterium sp. UV13. In this case, voltametric profiles recorded in tetra-methylammonium perchlorate (0.05 M dissolved in acetonitrile) showed two redox couples (Figure 4c). The first wave has an Eanodic = 1.16 V vs. Ag/Ag+ (peak #1) and an Ecathodic = 0.86 V (peak #1′). The second has an Eanodic = 1.46 V (peak #2) and an Ecathodic = 1.33 V (peak #2′). Violacein contains –OH (alcohol) and –NH (cyclic secondary amine) groups able to be oxidized. The first peak #1 arose from the oxidation of the –NH group and implied the oxidation of secondary amines to imides [68,69]. On the other side, the second peak (#2) could be assigned to the oxidation of –OH groups to a carbonyl, taking place through the group adsorption onto the electrode surface [43]. The cathodic counter peaks are detected because the adsorption of high-sized molecules to the gold-electrode surface does not occur.
Additionally, profiles for naked FTO electrodes in a phycoerythrin solution in the supporting electrolyte (NaClO4 0.1 M in Milli-Q water) were recorded at v = 0.01 V s−1. The voltametric profiles exhibit an anodic peak at 1.4 V with a cathodic counter peak at 0.6–0.7 V. The anodic contribution is explained by the oxidation of the carboxylic groups of the protein. The cathodic contribution is the sum of the O-desorption processes coming from the electrochemical behavior of the supporting electrolyte and the reduction of the oxidized -CO2 moiety. Adsorption of the protein onto the TiO2 electrode surface takes place from 0.6 V through the carboxylic group and affects O-sorption [70]. Therefore, it also affects the location of the related cathodic peak. Once adsorbed, when the potential scan reaches the 1.4 V value, oxidation to CO2 takes place and it is desorbed.
Finally, the redox behavior of the phycocyanin was evaluated. In this case, the oxidation potential was observed at 1.38 V, measured under the same experimental conditions as in the case of phycoerythrin. The related cathodic counter peak was detected at 0.5 V. Using FTO electrodes instead of Au-pc, results showed the presence of an anodic peak at 1.35 V vs. NHE with a cathodic contribution at −0.6 V (Figure 4d). In this electrode surface, adsorption is impossible; therefore, fewer redox contributions are detected.
3.4. QCM and EQCM Evaluation
A CHI 440 potentiostat/galvanostat time-resolved quartz crystal microbalance was utilized for QCM and EQCM measurements. The working electrode was a circularly shaped Ti/Au/TiO2 layer with a real surface exposed to the electrolyte of 0.215 cm2 (from RenLux Crystal). The system was completed with a Pt wire counter electrode and an Ag/AgCl reference electrode (E = 0.195 V vs. NHE). Potentials for the EQCM measurements were referred to the NHE reference. Measurements for QCM were made in time-resolved mode, measuring the frequency difference between the working and the reference crystals. The reference crystal had an oscillation frequency of 8.000 MHz. Adsorption measurements were performed at open circuit potential.
The adsorbed amount of dye onto the TiO2 electrode was calculated with QCM measurements using the Sauerbrey equation. This expression relates the measured change in the frequency, Δf, produced by the adsorption of a foreign substance with mass Δm (g). The absolute mass sensitivity was 6.74 × 10⁸ Hz g−1. This equation is valid for sufficiently thin and rigid ad-layers. Still, it is accepted as a good approximation for applying QCM studies to calculate an estimation of the mass of deposited dyes for comparison purposes.
Figure 5 shows some representative examples of the performed studies. The calculated adsorbed number of anthocyanins (mostly cyanidin-3-glucoside) onto the Ti/Au/TiO2 electrodes was about 6 nmol cm−2 (assuming that the deposited mass is exclusively due to anthocyanins’ presence) [39]. This value leads us to conclude that TiO2 coverage by the extracted dyes was complete if compared with the reported value of around 0.9 nmol cm−2 for a flavonoid monolayer. Additionally, phycoerythrin solutions were evaluated. The analyzed results correspond to the observed changes in frequency after incubation of the Ti/Au/TiO2 electrodes in phycoerythrin solutions overnight (Figure 5, right side), helping the adsorption of the protein onto the electrode surface. Then, the electrodes were washed with Milli-Q water, and EQCM profiles were recorded in the supporting electrolyte. After overnight incubation, phycoerythrin adsorbs onto the TiO2 surface and the frequency increase detected on the anodic scan can be explained by protein desorption. Further CO2 evolution in the anodic scan allows desorption of the macromolecule and measured frequency changes. Notably, frequency changes are more noticeable for experiments using phycoerythrin extracted from Palmaria decipiens, denoting a higher amount of adsorbed protein. According to our previous results, phycoerythrin extracted from Palmaria decipiens and Delesseria lancifolia is R-type in both cases, but slightly different [47,70]. This protein contains α, β, and γ subunits, and the amount of γ is different for Palmaria than for Delesseria [71,72]. This could affect the ability to interact with the electrode surface and the adsorption to the TiO2. EQCM results align with measured conversion efficiency values obtained with the R-phycoerythrin extracted from the evaluated algae. DSSC containing phycoerythrin extracted from Palmaria reached 0.12% efficiency values, whereas those containing the protein extracted from Delesseria showed 0.08% efficiency.
Similar evaluations were applied for phycocyanin solutions. Here, two separated oxidation peaks, at 1.295 V (ascribed to oxidation of COOH groups from the protein) and at 1.495 V, were detected for the recorded profiles in the supporting electrolyte when leaving the electrode overnight in the phycocyanin-containing solution. QCM results also confirmed the adsorption of the blue protein onto the electrode, because desorption of the molecule takes place at potentials higher than 1.195 V (coincident with a significant increase in the vibration frequency after reaching this value). On the contrary, the increase was seven times lower in the supporting electrolyte. EQCM profiles for phycocyanin solutions pH 7.5 in the supporting electrolyte (0.1 M NaNO3) are mainly determined by phycocyanin adsorption to TiO2, with a significant decrease in the redox peaks observed when evaluating the supporting electrolyte [45]. During the potential scan, adsorption of phycocyanin through the carboxylic group takes place, as reported for gold surfaces from ca. 0.5 V [73,74,75,76]. This adsorption process is reversible; whatever amount of adsorbate is formed at lower potentials, it tends to desorb from the surface at utmost positive potentials. This adsorption is undetectable for negative electrode potentials, and an increase in the adsorption is observed along with the rise in the potential. This increase reaches its maximum value in the region where the electroxidation of the metallic surfaces commences.
Interesting results confirm something expected: the competition between molecules for the electrode surface has a size-dependence component. For QCM experiments carried out in the presence of chlorophyll, this small-sized compound adsorbs onto TiO2, limiting protein access, and does not allow further adsorption of the protein to the surface.
3.5. Energy Balance
The dye must follow specific characteristics to be chosen as a suitable pigment for a DSSC. The electron transfer processes between the excited state of the dye and the conduction band of the TiO2 must be possible. Additionally, the oxidized dye must be regenerated at the counter electrode due to the presence of the redox couple in the electrolyte.
The Rehm–Weller equation estimates the free energy change between an electron donor (D) and an acceptor (A). According to the Rehm–Weller equation [77,78,79]:
where e corresponds to the number of exchanged electrons, E0D represents the redox potential for the donor oxidized form, E0A corresponds to the acceptor reduced form, and E0-0 is the energy gap between the excited and the ground levels for the energy states of the light-absorbing species. In all cases, the involved exchanged electrons are assumed as one.
∆G0 = e [E0D − E0A] − E0-0
Using TiO2 as a semiconductor of the DSSC, the corresponding value of E0A considers −0.53 V vs. NHE. Besides, E0D is the measured oxidation redox potential expressed versus the NHE and is related to the HOMO orbital. Then, using this expression, it is possible to predict whether the electron transference between the dye and the semiconductor occurs or not.
There are two ways to obtain the E0-0 value: spectroscopic measurements or electrochemical experiments.
Considering the measured reduction redox potential (E0red, related to the LUMO orbital) that arose from cyclic voltammetry results, the Rehm–Weller expression becomes:
∆G0 = E0red − E0A
Additionally, comparing the E0D with the E of the couple contained in the electrolyte of the DSSC, it is possible to predict if regeneration of the oxidized dye could occur. The I−/I3− is the most used redox couple working with natural dyes. Dye regeneration involves the formation of the intermediate radical species I2−• (with a 0.9 V redox potential for the couple I2−•/I−), which exhibits a more negative redox potential than the corresponding standard redox potential of I−/I3− (0.35 V vs. NHE in acetonitrile) [80,81,82].
For anthocyanins from ethanolic extracts of ceibo flowers (mostly cyanidin-3-glucoside), the maximum absorbance peak lies at 530 nm, whereas the emission peak is located at 630 nm (for a sample excited at 525 nm). The intersection point of both spectra (Figure 6a) occurs at 590 nm and, applying the Planck equation, it is possible to calculate an E0-0 value of 2.10 eV.
The measured redox potentials allow the calculation of the exact value for the energy gap. The difference between the Eanodic = 1.3 V and the Ecathodic = −0.8 V also gives an E0-0 value of 2.10 eV.
With these values in mind, and applying the Rehm–Weller equation, ΔG° gives a negative value of −0.28 eV at room temperature for a process that will proceed spontaneously. Besides, the oxidation potential of 1.3 V is far more positive than that of the I2−•/I− redox couple of the electrolyte (ca. + 0.9 V vs. NHE), ensuring a significant driving force for dye regeneration in the operative DSSCs (ΔG° = −0.4 V). Thus, we would expect high dye-regeneration efficiency for these dyes.
A similar argumentation can be applied to the analysis of phycoerythrin data. The red protein was extracted from two sources: the Antarctic Delesseria lancifolia and Palmaria decipiens. Absorbance spectra showed a contribution centered at 565 and 540 nm, respectively, with a fluorescence emission peak at 570 nm in both cases. Then, the absorbance and emission spectra intersected at 580 nm and 577 nm for Palmaria decipiens and Delesseria lancifolia, respectively. Calculation through the Planck’s equation gives E0-0 values of 2.17 eV for the red phycoerythrin extracted from Palmaria decipiens and 2.15 eV when it is extracted from Delesseria lancifolia.
Cyclic voltametric measurements showed an anodic peak at 1.4 V and a cathodic peak in the region of the sub-zero potentials at −0.75 V; then, the calculated E0-0 value is 2.15 eV.
Applying the Rehm–Weller equation, the Gibbs energy values are ∆G° = −0.44 eV for Palmaria decipiens and ∆G° = −0.42 eV for Delesseria lancifolia at room temperature. Thus, the driven electron energies are also thermodynamically favorable in both cases (ca. −0.5 V).
Finally, for the phycocyanin case and using FTO electrodes instead of Au-pc, results showed the presence of an anodic peak at 1.35 V vs. NHE with a cathodic contribution at −0.6 V (Figure 4). The difference between both peaks gives an E0-0 = 1.95 eV. As shown in Figure 6b, absorbance and emission normalized spectra intersect at 634 nm; from calculations using Planck’s equation, the energy gap has a value equal to 1.96 eV.
Once again, and for the exchange of only one electron, the calculated standard Gibbs energy ∆G° has a negative value of −0.23 eV. Additionally, dye regeneration is predicted considering the redox potential for the electrolyte couple with a ΔG° = −0.45 V.
3.6. Thermal Stability
Thermal stability is important because solar cells exposed to the sunlight would experiment with a warning, reaching temperatures near 60–80 °C in the summertime.
The stability of the dyes containing solutions against the increasing temperature was evaluated within the 25 to 90 °C range. Changes in the values of the maxima for the absorption spectra were followed. For this reason, solutions were heated at the selected temperature for 15 min before the spectroscopic evaluation.
For anthocyanins, absorbance values at 530–535 nm were recorded. The main degradation products for anthocyanins are the colorless chalcones, so if thermal decomposition occurs, absorbance measured at the maxima should be decreased [52,53]. Graphical representation of the absorbance values vs. temperature showed an increase in the absorbance values until 60 °C due to the co-pigmentation phenomena. For temperatures above 60 °C, the absorbance maintained its values, reaching a plateau (cyanidin-3-glucoside) or even decreasing slightly (as for delphinidin-3-glucoside) (Figure 7a).
Evaluation of the thermal stability of delphinidin-3-glucoside was also followed by TGA/DSC, confirming that decomposition started over 100 °C when loss of glucose occurred.
Additionally, fucoxanthin was evaluated using TGA and DSC techniques with stable profiles until 100 °C, where a ca. 7 % mass loss is detected due to the liberation of acetic acid [41].
The effect of temperature and the exposition to daylight on the Antarctic violacein was evaluated by recording the visible spectrum [44]. According to the results, violacein remains stable after 100 days of storage at room temperature and exposure to natural light, and the absorbance at 575 nm decreased by 10%. Moreover, the spectrum of the dye remains unchanged after heating for 20 min at temperatures ranging between 25 and 90 °C.
Only the evaluated colored proteins showed some trouble if selected as sensitizers. Based on a thermodynamic model with only two species involved in the denaturalization equilibrium, the transition temperature Tm is defined as the point where the native form of the protein equals the denaturalized form. For phycocyanin, the experimental Tm was 60 °C, a problem to consider for a pigment to be applied in solar devices supporting higher temperatures [45].
Phycoerythrin showed Tm values of 47 and 60 °C, depending on the source where the protein was extracted (giving different sub-units composition) (Figure 7b,c). For Delesseria, the first transition at 47 °C could explain the equilibrium between hexamer and γ subunits plus αβ monomers. The second transition at 60 °C arises from denaturation [46].
With these data in mind, phycobiliproteins are not the best option to be applied as sensitizers for devices supporting temperatures above 60 °C. It would have a sense when used indoors and far from windows.
3.7. Electrochemical Characterization of the Assembled DSSC
The assembled DSSC contained the iodine/tri-iodine redox couple. Using this couple was found to be the better choice when working with natural dyes. A cobalt-based couple was also evaluated, but PCE results were the worst.
3.7.1. Efficiencies from J vs. E Profiles
Interesting observations arise from the current density versus applied potential profiles. Table 1 summarizes the main results that arise from the performed evaluations. As explained previously in Section 2.3, and regarding some statistical considerations, the results displayed in Table 1 arise from five independent experiments performed for each dye or cocktail with an SD = 3 × 10⁻³. For measurements performed under standard conditions with a sunlight intensity of 100 mW cm−2, AM 1.5 G, some characteristics parameters were obtained: Jsc, the short-circuit current density; Voc, the open circuit potential; FF, the fill factor and η, the power conversion efficiency (PCE). Table 1 shows the main features of the evaluated sensitizers.
In most cases, using a purified sample increased the PCE, particularly for those molecules extracted from flowers, fruits, or seaweeds. In these, chlorophylls are the main components accompanying the dyes under evaluation. Chlorophyll exhibits a relatively high fluorescence quantum yield (ΦF of 0.32 in ethanol). In contrast, anthocyanins show the opposite behavior (i.e., ΦF ~0.001 in water and ethanol solutions). Highly fluorescent chromophores such as chlorophylls experiment radiative deactivation processes that might compete with the photochemical charge separation processes occurring in DSSC. Therefore, the performance of cells sensitized with dyes free from chlorophylls would be improved. A big-sized molecule of chlorophyll competes from the electrode surface with the colored dyes, giving place to an FTO/TiO2 electrode covered with a mixture of compounds: the desired pigment and chlorophyll. Then, the PCE decreases because molecules suffer another photochemical process, different from that involving electron transference, between the excited state of the colored molecules and the TiO2 occurring.
The opposite effect was observed when using raw extracts produced by Antarctic bacteria, in this case chlorophyll free, but composed of a mixture of the dye and OH-containing compounds as polysaccharides. In particular, the chemical structure of xanthophylls is not suitable to establish bonds with Ti. Still, the colorless polysaccharide might improve xanthophylls bonding to Ti, probably favoring the anchorage of xanthophylls to the photoelectrode surface.
In general lines, and by comparing the different used dyes, DSSC containing small-sized molecules gives higher PCE values in line with a better surface coverage. As previously discussed, the coverage extent was evaluated through spectroscopic and QCM measurements.
DSSC sensitized with anthocyanins showed PCE values depending on the main extracted compound: cyaniding-3-glucoside reached efficiencies at least two times higher than those measured in delphinidin-3-glucoside-containing cells. The only difference in the molecules structures is the presence of an additional -OH group in the anthocyanidin structure (in delphinidin 3-glucoside compared to cyanidin 3-glucoside). A weak dependence of electronic properties on the number of hydroxyls was reported (i.e., a slight increase of the energy gap between the HOMO orbital and the LUMO orbital) [83]. Besides, anthocyanins molecules are involved in several deprotonation equilibria, and energy levels for the HOMO and LUMO orbitals are affected. The energy level alignment of the excited state with the conduction band of the semiconductor and/or even the ground state alignment with the electrolyte redox level could change with deprotonation. As a consequence, PCE would also change.
Being co-sensitized with the addition of silver NPs or Cr (III) complexes increased the cells’ efficiencies. The main reason is the disappearance of surface defects due to the adsorption of metallic compounds to bare spots. Spectroscopic measurements assessed the adsorbed NPs or Cr (III). A higher efficiency increase using cocktails with NPs (near 30% increase) was found for two of the smaller tested molecules: violacein and delphinidin-3-glucoside. DSSC efficiencies with the long-chain fucoxanthin increased by 17% in the presence of NPs. When the pigment under evaluation was the protein phycoerythrin, PCE increased only 7% with the co-addition of NPs. Considering the reflected spectra, some points are clear: small molecules can get an excellent surface coverage, defects are scarce, and NPs could only find a few spots in which to be located. The main result seems to be a semiconductor surface that is fully covered, raising efficiency.
For big-sized molecules, naked zones at the electrode surfaces are more significant and, where NPs are added, these defects are covered. Silver NPs are colorless and, when these molecules cover a great extent of the surface, cells efficiencies increase to a limit.
The relationship between the size and concentration of the sensitizer with the surface coverage is also noticeable. DSSC sensitized with small molecules, such as anthocyanins or violacein, showed no dependence of PCE on the dye solution concentration; during overnight immersion time, molecules can reach and bond the TiO2, generating an ordered and compacted film. When using rigid molecules, such as carotenoids or big-sized molecules like proteins, obtaining fully covered surfaces is hard and PCE depends on the pigment solution concentration.
Data displayed in Table 1 deserve a deeper evaluation. In general lines, the addition of silver NPs or Cr (III) species causes a diminution in Voc values. The Voc of the DSSC can be estimated by the energy separation of the Fermi level of the semiconductor and the potential of the redox couple contained in the electrolyte. Changes in the adsorption mode of the dyes, changes in the electronic properties of the pigment due to adsorption, and the presence of protons, among others, were reported to cause a shift of the Fermi level of the TiO2 that modifies the gap with the electrolyte redox couple and, as a consequence, Voc changes. The influence of different amounts of silver NPs on the structure and performance of the DSSCs has also been reported. Studies indicate that the Jsc and Voc of DSSCs containing Ag-NPs are significantly affected [84].
Additionally, in the presence of NPs, the increase of Jsc may be attributed to enhanced dye light absorption due to surface plasmon resonance of Ag.
Finally, co-adsorbents such as NPs, chromium species, polysaccharides, or chlorophylls increased the FF fill factor. The FF is related to the interface junction quality between the surface of the dye and the electrolyte and the type of recombination mechanisms occurring in a solar cell. Therefore, the energy level of the involved species and their concentration affect the cell series resistance and, consequently, the FF.
3.7.2. Electrochemical Impedance Measurements
The interpretation of the measured data was carried out based on the application of different equivalent circuits. In particular, the transmission line model was applied for intermediate applied potentials (Figure 8) [85]. The resistance and capacitance values were obtained by fitting the impedance plots using Chi-Squared criteria lower than 0.001. The resistances ratios (recombination to electron transport) are reported as the mean values calculated from three individual cells manufactured with each sensitizer or cocktail and using a standard deviation of 0.07. The recombination and transport times are expressed as mean values using a relative SD = 5 × 10⁻³.
From this, some relevant values were obtained to understand the electronic processes occurring inside the DSSC. These are:
Rce, the resistance for regenerating I3− into I− at the counter electrode;
Rct, the charge transport resistance related to the recombination of electrons from the TiO2 to the triiodide in the electrolyte at the TiO2/dye/electrolyte interface;
Rt, the electron transport resistance in the photoanode;
Γt, the time constant for the transport of the injected electrons that diffuses through the nanoparticle network;
Γrec, the recombination time that reflects the lifetime of an electron in the photoanode.
Recombination implies a process where the promoted electrons recombine the triiodide couple of the electrolyte after photoexcitation of the dye. Then, photogenerated electrons follow an undesired path through the mesoporous TiO2 towards the FTO/TiO2 interface. High recombination times are mainly responsible for better efficiency performance. Besides, a relationship between a decrease in the recombination rate and an increase in Voc has been reported [86,87].
From the data displayed in Table 2, it is possible to arrive at some conclusions. Firstly, an increase in the ratio Rct/Rt is due to the addition of silver NPs, chromium species, or by changing the pH to give PCE an increase. In cases where exactly the opposite occurs, the increase in the ratio is accompanied by a decrease in the counter electrode resistance (Rce).
In general, using NPs or chromium compounds as co-adsorbents is associated with a Rce increase, probably due to desorption from the photoanode surface and further contamination of the counter electrode. This effect is particularly noticeable after some hours of assembling the DSSC.
Another interesting observation concerns Γt values; among the lowest measured PCE values, using a phycocyanin pH = 7.5 solution as a sensitizer showed a very high transport constant time value for the injected electrons.
4. Conclusions
Natural pigments are still the focus of research, despite the lower conversion efficiencies compared to those obtained with synthesized dyes. The assembly of DSSCs based on natural resources as sensitizers is based on simple and low-cost fabrication steps and constitutes an exciting choice to evaluate. They can also provide a fascinating alternative to profit from large amounts of natural waste by extracting natural dyes from fallen flowers, fruit, and leaves from cut-down trees for paper pulp production or even from invasive algae.
DSSC technology based on natural dyes constitutes an attractive option to evaluate, particularly for cold regions with possible energy production from modules located inside buildings, and are protected from snow and rough climatic conditions. Here, low temperatures could also be helpful to protect the pigments from degradation, with the main concern relating to those extracted from natural sources.
Besides the ease of extraction, most dyes coming from nature fulfill the characteristics to be applied as sensitizers, i.e., good absorption capacity within the visible region of the light spectra, the existence of functional moieties able to coordinate with the titanium of the TiO2 semiconductor, oxidation potential value near to 1 V and reduction potential near −0.8 V, adequate thermal stability, and low fluorescence emission.
Good surface coverage of the FTO/TiO2 electrode is also essential; in this sense, using co-adsorbents as polysaccharides, silver NP, or metal species could be a great solution to increase the cell efficiencies. They can also contribute to light adsorption in other ranges of the light spectra.
Funding
This research received no external funding.
Institutional Review Board Statement
The study did not require ethical approval.
Informed Consent Statement
Not applicable.
Data Availability Statement
No new data were created in this study. Data sharing is not applicable to this article.
Acknowledgments
The author is an ANII and PEDECIBA (Uruguay) researcher.
Conflicts of Interest
The author declare no conflict of interest.
References
- Barraud, E. Stained Glass Solar Windows for the Swiss Tech Convention Center. Chimia 2013, 67, 181–182. [Google Scholar] [CrossRef] [PubMed]
- Muñoz-Garcia, A.B.; Benesperi, I.; Boschloo, G.; Concepcion, J.J.; Delcamp, J.H.; Gibson, E.A.; Meyer, G.J.; Pavone, M.; Pettersson, H.; Hagfeldt, A.; et al. Dye-sensitized solar cells strike back. Chem. Soc. Rev. 2021, 50, 12450–12550. [Google Scholar] [CrossRef] [PubMed]
- Roy, A.; Ghosh, A.; Bhandari, S.; Selvaraj, P.; Sundaram, S.; Mallick, T.K. Color Comfort Evaluation of Dye-Sensitized Solar Cell (DSSC) Based Building-Integrated Photovoltaic (BIPV) Glazing after 2 Years of Ambient Exposure. J. Phys. Chem. C 2019, 123, 23834–23837. [Google Scholar] [CrossRef] [Green Version]
- Roslan, N.; Ya’acob, M.E.; Jamaludin, D.; Hashimoto, Y.; Othman, M.H.; Noor Iskandar, A.; Ariffin, M.R.; Ibrahim, M.H.; Mailan, J.; Jamaluddin, A.H.; et al. Dye-Sensitized Solar Cell (DSSC): Effects on Light Quality, Microclimate, and Growth of Orthosiphon stamineus in Tropical Climatic Condition. Agronomy 2021, 11, 631. [Google Scholar] [CrossRef]
- Lu, L.; Ya’acob, M.E.; Anuar, M.S.; Chen, G.; Othman, M.H.; Noor Iskandar, A.; Roslan, N. Thermal analysis of a portable DSSC mini greenhouse for botanical drugs cultivation. Energy Rep. 2020, 6, 238–253. [Google Scholar] [CrossRef]
- Mariotti, N.; Bonomo, M.; Fagiolari, L.; Barbero, N.; Gerbaldi, C.; Bella, F.; Barolo, C. Recent advances in eco-friendly and cost-effective materials towards sustainable dye-sensitized solar cells. Green Chem. 2020, 22, 7168–7218. [Google Scholar] [CrossRef]
- Parisi, M.L.; Maranghi, S.; Basosi, R. The evolution of the dye sensitized solar cells from Grätzel prototype to up-scaled solar applications: A life cycle assessment approach. Renew. Sustain. Energy Rev. 2014, 39, 124–138. [Google Scholar] [CrossRef]
- Cannavale, A.; Martellotta, F.; Fiorito, F.; Ayr, U. The Challenge for Building Integration of Highly Transparent Photovoltaics and Photoelectrochromic Devices. Energies 2020, 13, 1929. [Google Scholar] [CrossRef] [Green Version]
- Ursu, D.; Vajda, M.; Miclau, M. Highly efficient dye-sensitized solar cells for wavelength-selective greenhouse: A promising agrivoltaic system. Int. J. Energy Res. 2022, 46, 18550–18561. [Google Scholar] [CrossRef]
- Hyun, J.Y.; Park, B.R.; Kim, N.H.; Moon, J.W. Building energy performance of DSSC BIPV windows in accordance with the lighting control methods and climate zones. Sol. Energy 2022, 244, 279–288. [Google Scholar] [CrossRef]
- Su, X.; Zhang, L.; Luo, Y.; Liu, Z. Energy performance of a reversible window integrated with photovoltaic blinds in Harbin. Build. Environ. 2022, 213, 108861–108876. [Google Scholar] [CrossRef]
- Vesce, L.; Mariani, P.; Calamante, M.; Dessì, A.; Mordini, A.; Zani, L.; Di Carlo, A. Process Engineering of Semitransparent DSSC Modules and Panel Incorporating an Organic Sensitizer. Sol. RRL 2022, 6, 2200403. [Google Scholar] [CrossRef]
- Venkatesan, S.; Chien, T.Y.; Teng, H.; Lee, Y.L. High performance photoelectrodes prepared using Au@P3HT composite nanoparticles for dye-sensitized solar cells. J. Alloys Compd. 2022, 926, 166822–166833. [Google Scholar] [CrossRef]
- Laxmi, T.; Piyush, B.; Rahul, D.; Bishwajit, C. Enhanced Efficiency of Dye Sensitized Solar Cell Using Eu Doped TiO2-ZrO2 Nanocomposite. Recent Pat. Nanotechnol. 2022, 16, 333–338. [Google Scholar]
- Uğur, A.; Imer, A.G.; Gülcan, M. Enhancement in the photovoltaic efficiency of dye-sensitized solar cell by doping TiO2 with MIL-101 MOF structure. Mater. Sci. Semicond. Process 2022, 150, 106951–106960. [Google Scholar] [CrossRef]
- Ramakrishnan, V.M.; Rajesh, G.; Selvakumar, P.; Flores, M.; Muthukumarasamy, N.; Velauthapillai, D.; Lan Chi, N.T.; Pugazhendhi, A. TiO2/AgO composites by one step photo reduction technique as electron transport layers (ETL) for dye-sensitized solar cells. Chemosphere 2022, 305, 134953–134963. [Google Scholar] [CrossRef]
- Yang, A.N.; Lin, J.T.; Li, C.T. Electroactive and Sustainable Cu-MOF/PEDOT Composite Electrocatalysts for Multiple Redox Mediators and for High-Performance Dye-Sensitized Solar Cells. ACS Appl. Mater. Interfaces 2021, 13, 8435–8444. [Google Scholar] [CrossRef]
- Fagiolari, L.; Varaia, E.; Mariotti, N.; Bonomo, M.; Barolo, C.; Bella, F. Poly(3,4-ethylenedioxythiophene) in Dye-Sensitized Solar Cells: Toward Solid-State and Platinum-Free Photovoltaics. Adv. Sustain. Syst. 2021, 5, 2100025–2100057. [Google Scholar] [CrossRef]
- Bandara, T.; Hansadi, J.; Bella, F. A review of textile dye-sensitized solar cells for wearable electronics. Ionics 2022, 28, 2563–2583. [Google Scholar] [CrossRef]
- Pirrone, N.; Bella, F.; Hernández, S. Solar H2 production systems: Current status and prospective applications. Green Chem. 2022, 24, 5379–5402. [Google Scholar] [CrossRef]
- Fagiolari, L.; Sampò, M.; Lamberti, A.; Amici, J.; Francia, C.; Bodoardo, S.; Bella, F. Integrated energy conversion and storage devices: Interfacing solar cells, batteries and supercapacitors. Energy Storage Mater. 2022, 51, 400–434. [Google Scholar] [CrossRef]
- Li, D.; Huang, Y.; Chen, Z. Performance investigation of a system hybridizing dye-sensitized solar cell with thermoelectric devices for power and cooling. Int. J. Energy Res. 2022, 46, 16679–16692. [Google Scholar] [CrossRef]
- Pinto, A.L.; Cruz, H.; Oliveira, J.; Araújo, P.; Cruz, L.; Gomes, V.; Silva, C.P.; Silva, G.T.M.; Mateus, T.; Calogero, G.; et al. Dye-sensitized solar cells based on dimethylamino-π-bridgepyrano anthocyanin dyes. Sol. Energy 2020, 206, 188–199. [Google Scholar] [CrossRef]
- Barichello, J.; Mariani, P.; Matteocci, F.; Vesce, L.; Reale, A.; Di Carlo, A.; Lanza, M.; Di Marco, G.; Polizzi, S.; Calogero, G. The Golden Fig: A Plasmonic Effect Study of Organic-Based Solar Cells. Nanomaterials 2022, 12, 267. [Google Scholar] [CrossRef]
- Golshan, M.; Osfouri, S.; Azin, R.; Jalali, T.; Moheimani, N.R. Co-sensitization of natural and low-cost dyes for efficient panchromatic light-harvesting using dye-sensitized solar cells. J. Photochem. Photobiol. A Chem. 2021, 417, 113345–113356. [Google Scholar] [CrossRef]
- Orona-Navar, A.; Aguilar-Hernandez, I.; Nigam, K.D.P.; Cerdan-Pasar, A.; Ornelas-Soto, N. Alternative sources of natural pigments for dye-sensitized solar cells: Algae, cyanobacteria, bacteria, archaea and fungi. J. Biotechnol. 2021, 332, 29–53. [Google Scholar] [CrossRef]
- Amogne, N.Y.; Ayele, D.W.; Tsigie, Y.A. Recent advances in anthocyanin dyes extracted from plants for dye sensitized solar cell. Mater. Renew. Sustain. Energy 2020, 9, 23–39. [Google Scholar] [CrossRef]
- Leite, A.M.B.; da Cunha, H.O.; Rodrigues, J.A.F.C.R.R.; Babu, S.; de Barros, A.L.F. Construction and characterization of organic photovoltaic cells sensitized by Chrysanthemum based natural dye. Spectrochim. Acta A Mol. Biomol. Spectrosc. 2023, 284, 121780–121788. [Google Scholar] [CrossRef]
- Prakash, P.; Balasundaram, J.; Al-Enizi, A.M.; Ubaidullah, M.; Pandit, B. Effect of photovoltaic performance of plant-based cocktail DSSCs and adsorption of nano TiO2 onto the solvent-influenced dye sensitizers. Opt. Mater. 2022, 133, 113031–113040. [Google Scholar] [CrossRef]
- Bist, A.; Chatterjee, S. Review on Efficiency Enhancement Using Natural Extract Mediated Dye-Sensitized Solar Cell for Sustainable Photovoltaics. Energy Technol. 2021, 9, 2001058–2001077. [Google Scholar] [CrossRef]
- Zhou, H.; Wu, L.; Gao, Y.; Ma, T. Dye-sensitized solar cells using 20 natural dyes as sensitizers. J. Photochem. Photobiol. A Chem. 2011, 219, 188–194. [Google Scholar] [CrossRef]
- Hao, S.; Wu, S.; Huang, Y.; Lin, Y. Natural dyes as photosensitizers for dye-sensitized solar cell. Sol. Energy 2006, 80, 209–214. [Google Scholar] [CrossRef]
- Marcati, A.; Ursu, A.V.; Laroche, C.; Soanen, N.; Marchal, L.; Jubeau, S.; Djelveh, G.; Michaud, P. Extraction and fractionation of polysaccharides and B-phycoerythrin from the microalga Porphyridium cruentum by membrane technology. Algal Res. 2014, 5, 258–263. [Google Scholar] [CrossRef]
- Cerdá, M.F. A small-sized DSSC panel based on the Uruguayan national flower dye tested at the Antarctic Artigas Base. EPJ Photovolt. 2022, 13, 2–11. [Google Scholar] [CrossRef]
- Barea, E.M.; Bisquert, J. Properties of chromophores determining recombination at TiO2-dye-electrolyte interface. Langmuir 2013, 29, 8773–8781. [Google Scholar] [CrossRef]
- Narayan, M.R. Review: Dye sensitized solar cells based on natural photosensitizers. Renew. Sustain. Energy Rev. 2012, 16, 208–215. [Google Scholar] [CrossRef]
- Al-Alwani, M.A.M.; Mohamad, A.B.; Ludin, N.A.; Kadhum, A.A.H.; Sopian, K. Dye-sensitised solar cells: Development, structure, operation principles, electron kinetics, characterisation, synthesis materials and natural photosensitisers. Renew. Sustain. Energy Rev. 2016, 65, 183–213. [Google Scholar] [CrossRef]
- Calogero, G.; Bartolotta, A.; Di Marco, G.; Di Carlo, A.; Bonaccorso, F. Vegetable-based dye-sensitized solar cells. Chem. Soc. Rev. 2015, 44, 3244–3495. [Google Scholar] [CrossRef] [PubMed]
- Enciso, P.; Decoppet, J.D.; Grätzel, M.; Wörner, M.; Cabrerizo, F.M.; Cerdá, M.F. A cockspur for the DSS cells: Erythrina crista-galli sensitizers. Spectrochim. Acta A Mol. Biomol. Spectrosc. 2017, 176, 91–98. [Google Scholar] [CrossRef]
- González Steffano, M.; Alvarez, E.; Sosa, P.; Vázquez, C.; Cerdá, M.F. Pitanga anthocyanins as sensitizers for DSSC. INNOTEC 2022, 23, e584. [Google Scholar] [CrossRef]
- De Bon, M.; Rodríguez Chialanza, M.; Cerdá, M.F. Fucoxanthin from the Antarctic Himantothallus grandifollius as a sensitizer in DSSC. J. Iran. Chem. Soc. 2022, 19, 3627–3636. [Google Scholar] [CrossRef]
- Wang, L.J.; Fan, Y.; Parsons, R.L.; Hu, J.R.; Zhang, P.Y.; Li, F.L. A Rapid Method for the Determination of Fucoxanthin in Diatom. Mar. Drugs 2018, 16, 33. [Google Scholar] [CrossRef] [Green Version]
- Montagni, M.; Enciso, P.; Marizcurrena, J.J.; Castro-Sowinski, S.; Fontana, C.; Davyt, D.; Cerdá, M.F. Dye sensitized solar cells based on Antarctic Hymenobacter sp. UV11 dyes. Environ. Sustain. 2018, 1, 89–97. [Google Scholar] [CrossRef]
- Marizcurrena, J.J.; Castro-Sowinski, S.; Cerdá, M.F. Improving the performance of dye-sensitized solar cells using nanoparticles and a dye produced by an Antarctic bacterium. Environ. Sustain. 2021, 4, 881–882. [Google Scholar] [CrossRef]
- Enciso, P.; Decoppet, J.J.; Moehl, T.; Grätzel, M.; Wörner, M.; Cerdá, M.F. Influence of the Adsorption of Phycocyanin on the Performance in DSS Cells: And Electrochemical and QCM Evaluation. Int. J. Electrochem. Sci. 2016, 11, 3604–3614. [Google Scholar] [CrossRef]
- Cerdá, M.F.; Botasini, S. Co-sensitized cells from Antarctic resources using Ag nanoparticles. Surf. Interface Anal. 2020, 52, 980–984. [Google Scholar] [CrossRef]
- Yañuk, J.G.; Cabrerizo, F.M.; Dellatorre, F.G.; Cerdá, M.F. Photosensitizing role of R-phycoerythrin red protein and β-carboline alkaloids in Dye sensitized solar cell. Electrochemical and spectroscopic characterization. Energy Rep. 2020, 6, 25–36. [Google Scholar] [CrossRef]
- Lim, A.; Ekanayake, P.; Lim, L.B.L.; Bandara, J.M.R.S. Co-dominant effect of selected natural dye sensitizers in DSSC performance. Spectrochim. Acta A Mol. Biomol. Spectrosc. 2016, 167, 26–31. [Google Scholar] [CrossRef]
- Shanmugam, V.; Manoharan, S.; Anandan, S.; Murugan, R. Performance of dye-sensitized solar cells fabricated with extracts from fruits of ivy gourd and flowers of red frangipani as sensitizers. Spectrochim. Acta A Mol. Biomol. Spectrosc. 2013, 104, 35–40. [Google Scholar] [CrossRef]
- Cole, J.M.; Pepe, G.; Al Bahri, O.K.; Cooper, C.B. Cosensitization in Dye-Sensitized Solar Cells. Chem. Rev. 2019, 119, 7279–7327. [Google Scholar] [CrossRef]
- Miller, N.J.; Sampson, J.; Candeias, L.P.; Bramley, P.M.; Rice-Evans, C.A. Antioxidant activities of carotenes and xanthophylls. FEBS Lett. 1996, 384, 240–242. [Google Scholar] [CrossRef]
- Pinto, A.L.; Oliveira, J.; Araújo, P.; Calogero, G.; de Freitas, V.; Pina, F.; Parola, A.J.; Lima, J.C. Study of the multi-equilibria of red wine colorants pyranoanthocyanins and evaluation of their potential in dye-sensitized solar cells. Sol. Energy 2019, 191, 100–108. [Google Scholar] [CrossRef]
- Gadioli Tarone, A.; Betim Cazarin, C.B.; Marostica Junior, M.R. Anthocyanins: New techniques and challenges in microencapsulation. Food Res. Int. 2020, 133, 109092–109105. [Google Scholar] [CrossRef] [PubMed]
- Bastús, N.G.; Merkoçi, F.; Piella, J.; Puntes, V. Synthesis of Highly Monodisperse Citrate-Stabilized Silver Nanoparticles of up to 200 nm: Kinetic Control and Catalytic Properties. Chem. Mater. 2014, 26, 2836–2846. [Google Scholar] [CrossRef]
- Ghareaghajlou, N.; Hallaj-Nezhadi, S.; Ghasempour, Z. Nano-liposomal system based on lyophilization of monophase solution technique for encapsulating anthocyanin-rich extract from red cabbage. Dyes Pigm. 2022, 202, 110263–110272. [Google Scholar] [CrossRef]
- Stuart, B.H. Infrared Spectroscopy: Fundamentals and Applications, 1st ed.; John Wiley & Sons Ltd.: Chichester, UK, 2004; p. 224. [Google Scholar]
- Noviendri, D.; Jaswir, I.; Taher, M.; Mohamed, F.; Salleh, H.M.; Noorbatcha, I.A.; Octaviant, F.; Lestari, W.; Hendri, R.; Ahmad, H.; et al. Fabrication of Fucoxanthin-Loaded Microsphere(F-LM) By Two Steps Double-Emulsion Solvent Evaporation Method and Characterization of Fucoxanthin before and after Microencapsulation. J. Oleo Sci. 2016, 65, 641–653. [Google Scholar] [CrossRef] [Green Version]
- Solehah Din, N.A.; Mohd Alayudin, A.S.; Sofian-Seng, N.S.; Abdul Rahman, H.; Mohd Razali, N.S.; Joe Lim, S.; Wan Mustapha, W.A. Brown Algae as Functional Food Source of Fucoxanthin: A Review. Foods 2022, 11, 2235–2270. [Google Scholar]
- Harper, K.A.; Chandler, B.V. Structural changes of flavylium salts. Aust. J. Chem. 1967, 20, 731–744. [Google Scholar] [CrossRef]
- Harper, K.A.; Chandler, B.V. Structural changes of flavylium salts. Part II. Aust. J. Chem. 1967, 20, 745–756. [Google Scholar] [CrossRef]
- Bowie, W.T.; Feldman, M.R. Stabilities of Trivalent Carbon Species. 3. Reduction of Organic Cations by Chromous Ion. J. Am. Chem. Soc. 1977, 99, 4721–4726. [Google Scholar] [CrossRef]
- Freitas, A.A.; Shimizu, K.; Dias, L.G.; Quin, F.H. A Computational Study of Substituted Flavylium Salts and their Quinonoidal Conjugate Bases: S0→S1 Electronic Transition, Absolute pKa and Reduction Potential Calculations by DFT and Semiempirical Methods. J. Braz. Chem. Soc. 2007, 18, 1537–1546. [Google Scholar] [CrossRef] [Green Version]
- Liu, D.; Gao, Y.; Kispert, L.D. Electrochemical properties of natural carotenoids. J. Electroanal. Chem. 2000, 488, 140–150. [Google Scholar] [CrossRef]
- Niedzwiedzki, D.; Rusling, J.F.; Frank, H.A. Voltammetric redox potentials of carotenoids associated with the xanthophyll cycle in photosynthesis. Chem. Phys. Lett. 2005, 415, 308–312. [Google Scholar] [CrossRef]
- Gao, P.; Lin, C.L.; Shannon, C.; Salaita, G.N.; White, J.H.; Chaffins, S.A.; Hubbard, A.T. Studies of adsorbed saturated alcohols at platinum(111) electrodes by vibrational spectroscopy (EELS), Auger spectroscopy, and electrochemistry. Langmuir 1991, 7, 1515–1524. [Google Scholar] [CrossRef]
- Tremiliosi-Filho, G.; Gonzalez, E.R.; Motheo, A.J.; Belgsir, E.M.; Léger, J.M.; Lamy, C. Electro-oxidation of ethanol on gold: Analysis of the reaction products and mechanism. J. Electroanal. Chem. 1998, 444, 31–39. [Google Scholar] [CrossRef]
- Trasatti, S.; Petrii, O.A. Real surface area measurements in electrochemistry. J. Electroanal. Chem. 1992, 321, 353–376. [Google Scholar] [CrossRef]
- Adenier, A.; Chehimi, M.M.; Gallardo, I.; Pinson, J.; Vila, N. Electrochemical oxidation of aliphatic amines and their attachment to carbon and metal surfaces. Langmuir 2004, 20, 8243–8253. [Google Scholar] [CrossRef]
- Garrido, E.M.; Garrido, J.; Calheiros, R.; Marques, M.P.M.; Borges, F. Fluoxetine and norfluoxetine revisited: New insights into the electrochemical and spectroscopic properties. J. Phys. Chem. A 2009, 113, 9934–9944. [Google Scholar] [CrossRef] [Green Version]
- Enciso, P.; Woerner, M.; Cerdá, M.F. Photovoltaic cells based on the use of natural pigments: Phycoerythrin from red-antarctic algae as sensitizers for DSSC. MRS Adv. 2018, 3, 3557–3562. [Google Scholar] [CrossRef]
- Ficner, R.; Huber, R. Refined crystal structure of phycoerythrin from Porphyridium cruentum at 0.23-nm resolution and localization of the subunit. Eur. J. Biochem. 1993, 218, 103–106. [Google Scholar] [CrossRef]
- Isailovic, D.; Li, H.W.; Yeunget, E.S. Isolation and characterization of R-phycoerythrin subunits and enzymatic digests. J. Chromat. A 2004, 1051, 119–130. [Google Scholar] [CrossRef]
- Ogura, K.; Kobayashi, M.; Nakayama, M.; Miho, Y. In-situ FTIR studies on the electrochemical oxidation of histidine and tyrosine. J. Electroanal. Chem. 1999, 463, 218–223. [Google Scholar] [CrossRef]
- Ogura, K.; Kobayashi, M.; Nakayama, M.; Miho, Y. Electrochemical and in situ FTIR studies on the adsorption and oxidation of glycine and lysine in alkaline medium. J. Electroanal. Chem. 1998, 449, 101–109. [Google Scholar] [CrossRef]
- Wieckowski, A.; Sobkowski, J.; Zelenay, P.; Franaszczuk, K. Adsorption of acetic acid on platinum, gold and rhodium electrodes. Electrochim. Acta 1981, 26, 1111–1119. [Google Scholar] [CrossRef]
- Xiao, X.Y.; Sun, S.G. Electrosorption of p-nitrobenzoic acid at a gold electrode in perchloric acid solutions studied by using cyclic voltammetry, EQCM, in situ FTIRS and Raman spectroscopy. Electrochim. Acta 2000, 45, 2897–2902. [Google Scholar] [CrossRef]
- Urbani, M.; Sarı, F.A.; Graetzel, M.; Nazeeruddin, M.; Torres, T.; Ince, M. Effect of Peripheral Substitution on the Performance of Subphthalocyanines in DSSCs. Chem. Asian J. 2016, 11, 1223–1231. [Google Scholar] [CrossRef]
- Kathiravan, A.; Chandramohan, M.; Renganathan, R.; Sekar, S. Cyanobacterial chlorophyll as a sensitizer for colloidal TiO2. Spectrochim. Acta A 2009, 71, 1783–1787. [Google Scholar] [CrossRef]
- Hagberg, D.P.; Marinado, T.; Karlsson, K.M.; Nonomura, K.; Qin, P.; Boschloo, G.; Brinck, T.; Hagfeldt, A.; Sun, L. Tuning the HOMO and LUMO Energy Levels of Organic Chromophores for Dye Sensitized Solar Cells. J. Org. Chem. 2007, 72, 9550–9556. [Google Scholar] [CrossRef]
- Daeneke, T.; Kwon, T.H.; Holmes, A.B.; Duffy, N.W.; Bach, U.; Spiccia, L. High-efficiency dye-sensitized solar cells with ferrocene-based electrolytes. Nat. Chem. 2011, 3, 211–215. [Google Scholar] [CrossRef]
- Boschloo, G.; Hagfeldt, A. Characteristics of the Iodide/Triiodide Redox Mediator in Dye-Sensitized Solar Cells. Acc. Chem. Res. 2009, 42, 1819–1826. [Google Scholar] [CrossRef]
- DeVries, M.J.; Pellin, M.; Hupp, J.T. Dye-Sensitized Solar Cells: Driving-Force Effects on Electron Recombination Dynamics with Cobalt-Based Shuttles. Langmuir 2010, 26, 9082–9087. [Google Scholar] [CrossRef] [PubMed]
- Ndiaye, A.; Dioum, A.; Oprea, C.I.; Dumbrava, A.; Lungu, J.; Georgescu, A.; Moscalu, F.; Gîrtu, M.A.; Beye, A.C.; Youm, I. A Combined Experimental and Computational Study of Chrysanthemin as a Pigment for Dye-Sensitized Solar Cells. Molecules 2021, 26, 225. [Google Scholar] [CrossRef] [PubMed]
- Guo, K.; Li, M.; Fang, X.; Liu, X.; Sebo, B.; Zhu, Y.; Hu, Z.; Zhao, X. Preparation and enhanced properties of dye-sensitized solar cells by surface plasmon resonance of Ag nanoparticles in nanocomposite photoanode. J. Power Sources 2013, 230, 155–160. [Google Scholar] [CrossRef]
- Bisquert, J. Theory of the impedance of electron diffusion and recombination in a thin layer. J. Phys. Chem. B 2002, 106, 325–333. [Google Scholar] [CrossRef]
- Hagfeldt, A.; Boschloo, G.; Sun, L.; Kloo, L.; Pettersson, H. Dye-sensitized solar cells. Chem. Rev. 2010, 110, 6595–6663. [Google Scholar] [CrossRef] [PubMed]
- Hardin, B.E.; Snaith, H.J.; McGehee, M.D. The renaissance of dye-sensitized solar cells. Nat. Photonics 2012, 6, 162–169. [Google Scholar] [CrossRef]
- Kharkwal, D.; Sharma, N.; Gupta, S.K.; Singh Negi, C.M. Enhanced performance of dye-sensitized solar cells by co-sensitization of metal-complex and organic dye. Sol. Energy 2021, 230, 1133–1140. [Google Scholar] [CrossRef]
- Koops, S.E.; O’Regan, B.C.; Barnes, P.R.F.; Durrant, J.R. Parameters Influencing the Efficiency of Electron Injection in Dye-Sensitized Solar Cells. J. Am. Chem. Soc. 2009, 131, 4808–4818. [Google Scholar] [CrossRef]
Figure 1.
Chemical structures of the compounds mentioned in the text.

Figure 2.
UV-visible spectra for the pigments containing solutions (left side) and adsorbed dyes onto the TiO2 surface (right side). (a) Cyanidin-3-glucoside solution and (b) co-adsorbed cyanidin-3-glucoside in the presence of silver NPs. (c) Delphinidin-3-glucoside solution and (d) co-adsorbed delphinidin-3-glucoside in the presence of silver NPs. (e) Delphinidin-3-glucoside (red line) and Cr (III) complex (black line) solutions and (f) both species co-adsorbed onto the TiO2 surface. (g) Fucoxanthin solution and (h) co-adsorbed fucoxanthin in the presence of silver NPs.

Figure 3.
FTIR spectra for the purified solution containing the dye under evaluation and the pigments after incubation for 24 h onto TiO2 electrodes. 1% KBr pellets. (a) Delphinidin-3-glucoside extracted from blueberries (black line) and the adsorbed pigment (red line). (b) Delphinidin-3-glucoside extracted from Eugenia uniflora L. (purple line) and the adsorbed pigment (black line); the metallic complex obtained from Cr and Delphinidin-3-glucoside adsorbed onto TiO2 (blue line) or the metallic complex obtained with Mg adsorbed onto TiO2 (red line). (c) Fucoxanthin (black line) and the adsorbed pigment (red line).

Figure 4.
Voltametric profiles recorded for different electrodes/solution systems. (a) For Au-pc in a delphinidin-3-glucoside-containing solution in the supporting electrolyte (black line); for Cr (III) (blue line) and Mg (II) (red line) metal complexes. Measured at v = 0.01 V s−1. (b) For Au-pc in xanthophylls containing solution in the supporting electrolyte, at v = 0.05 V s−1. Reference electrode Ag/AgCl (0.195 V vs. NHE). (c) For Au-pc in a violacein-containing solution in the supporting electrolyte, at v = 0.05 V s−1. The potential of the reference electrode Ag/Ag+ = 0.48 V vs. NHE. (d) For FTO electrodes in a phycocyanin-containing solution in the supporting electrolyte, at v = 0.01 V s−1.

Figure 5.
Left: EQCM profiles for Ti/Au/TiO2 electrodes in the ethanol extract, recorded in 0.1 M NaNO3, v = 0.01 V s−1. The black line is the profile for the Erythrina crista-galli extract, and the red line is for the supporting electrolyte. Right: Voltametric and frequency profiles for phycoerythrin solutions in the supporting electrolyte, for samples extracted from Delesseria lancifolia (black line), and for the supporting electrolyte 0.1 M NaNO3 (red line). Reference electrode Ag/AgCl (0.195 V vs. NHE).

Figure 6.
Normalized UV–visible absorption (black line) and emission spectra (red line) of (a) an ethanolic anthocyanins purified solution (mostly cyanidin-3-glucoside) and (b) of phycocyanin aqueous solution.
Figure 6.
Normalized UV–visible absorption (black line) and emission spectra (red line) of (a) an ethanolic anthocyanins purified solution (mostly cyanidin-3-glucoside) and (b) of phycocyanin aqueous solution.

Figure 7.
Graphical representation of the absorbance values vs. temperature for (a) an anthocyanins solution; (b) for R-phycoerythrin extracted from Delesseria lancifolia; (c) for R-phycoerythrin extracted from Palmaria decipiens.
Figure 7.
Graphical representation of the absorbance values vs. temperature for (a) an anthocyanins solution; (b) for R-phycoerythrin extracted from Delesseria lancifolia; (c) for R-phycoerythrin extracted from Palmaria decipiens.

Figure 8.
Transmission line model used for the interpretation of the measured data at 0.4 or 0.5 V, depending on the selected sensitizer.
Figure 8.
Transmission line model used for the interpretation of the measured data at 0.4 or 0.5 V, depending on the selected sensitizer.


Table 1.
Photovoltaic properties for cells assembled using different sensitizers. All measurements were performed under a light intensity of 1 sun, 100 mW cm−2, AM 1.5 G, and the active areas were 0.7 cm2 for all the cells. Jsc is the current density, Voc is the open circuit potential, FF is the fill factor, and η is the conversion efficiency. Results arise from 5 independent experiments performed for each dye, with SD = 3 10−3.
| Dye | Voc/V | Jsc/mA cm−2 | FF | η/% | |
|---|---|---|---|---|---|
| 1 | CYA3GLU purified Raw | 0.50 | 2.63 | 0.58 | 0.73 |
| 0.60 | 1.24 | 0.66 | 0.4 | ||
| +NPs | 0.58 | 1.35 | 0.62 | 0.43 | |
| 2 | DEL3GLU | 0.55 V | 1.11 | 0.61 | 0.19 |
| +Cr complex | 0.535 V | 1.39 | 0.64 | 0.24 | |
| +NPs | 0.51 | 0.71 | 0.66 | 0.24 | |
| 3 | FUCO | 0.53 | 0.38 | 0.60 | 0.12 |
| +NPs | 0.55 | 0.4 | 0.65 | 0.14 | |
| 4 | Xantophyll | 0.46 | 0.127 | 0.51 | 0.03 |
| 5 | Violacein | 0.55 | 0.52 | 0.57 | 0.17 |
| +NPs | 0.58 | 0.57 | 0.62 | 0.23 | |
| 6 | PE | 0.61 | 0.38 | 0.54 | 0.13 |
| +NPs | 0.59 | 0.39 | 0.58 | 0.14 | |
| 7 | PC pH 8.5 pH 7.5 | 0.57 | 0.21 | 0.36 | 0.044 |
| 0.49 | 0.13 | 0.53 | 0.033 |
Table 2.
Values obtained from fitted values at V = 0.5 V, in darkness, using a transmission line-based model (except those with * measured at 0.4 V). The resistances ratios are reported as the mean values calculated from three individual cells and using a standard deviation of 0.07. Times are expressed as mean values using relative SD = 5 × 10⁻³.
| Dye | Rce/Ω | Ratio Rct/Rt | Γt/s | Γrec/s | η/% | |
|---|---|---|---|---|---|---|
| 1 | CYA3GLU purified raw | 32 | 35 | 0.0018 | 0.072 | 0.73 |
| 4 | 24 | 0.0007 | 0.0160 | 0.4 | ||
| +NPs | 2 | 25 | 0.0005 | 0.0125 | 0.43 | |
| 2 | DEL3GLU | 35 | 25 | 0.001 | 0.024 | 0.19 |
| +Cr complex | 161 | 105 | 0.0009 | 0.092 | 0.24 | |
| +NPs | 45 | 20 | 0.001 | 0.022 | 0.24 | |
| 3 | FUCO | 1.5 | 25 | 0.0014 | 0.037 | 0.12 |
| +NPs | 33 | 61 | 0.0008 | 0.049 | 0.14 | |
| 4 * | Xantophyll | 4 | 340 | 0.001 | 0.330 | 0.03 |
| 5 | violacein | 1.6 | 49 | 0.004 | 0.170 | 0.17 |
| +NPs | 6.3 | 6 | 0.011 | 0.071 | 0.23 | |
| 6 | PE | 42.0 | 32 | 0.003 | 0.09 | 0.13 |
| +NPs | 80.0 | 32 | 0.003 | 0.09 | 0.14 | |
| 7 * | PC pH 8.5 pH 7.5 | 22 | 3 | 0.010 | 0.032 | 0.044 |
| 45 | 17 | 0.017 | 0.287 | 0.033 |
Publisher’s Note: MDPI stays neutral with regard to jurisdictional claims in published maps and institutional affiliations. |
© 2022 by the author. Licensee MDPI, Basel, Switzerland. This article is an open access article distributed under the terms and conditions of the Creative Commons Attribution (CC BY) license (https://creativecommons.org/licenses/by/4.0/).
Share and Cite
MDPI and ACS Style
Cerdá, M.F. Dyes from the Southern Lands: An Alternative or a Dream? Solar 2022, 2, 519-539. https://0-doi-org.brum.beds.ac.uk/10.3390/solar2040031
AMA Style
Cerdá MF. Dyes from the Southern Lands: An Alternative or a Dream? Solar. 2022; 2(4):519-539. https://0-doi-org.brum.beds.ac.uk/10.3390/solar2040031
Chicago/Turabian StyleCerdá, María Fernanda. 2022. "Dyes from the Southern Lands: An Alternative or a Dream?" Solar 2, no. 4: 519-539. https://0-doi-org.brum.beds.ac.uk/10.3390/solar2040031