
Potential Induced Degradation in Photovoltaic Modules: A Review of the Latest Research and Developments
Laboratory of Photovoltaics, School of Physics, Engineering and Technology, University of York, York YO195DD, UK
*
Author to whom correspondence should be addressed.
Solar 2023, 3(2), 322-346; https://0-doi-org.brum.beds.ac.uk/10.3390/solar3020019
Submission received: 27 March 2023
/
Revised: 24 May 2023
/
Accepted: 29 May 2023
/
Published: 7 June 2023
Abstract
:Photovoltaic (PV) technology plays a crucial role in the transition towards a low-carbon energy system, but the potential-induced degradation (PID) phenomenon can significantly impact the performance and lifespan of PV modules. PID occurs when a high voltage potential difference exists between the module and ground, leading to ion migration and the formation of conductive paths. This results in reduced power output and poses a challenge for PV systems. Research and development efforts have focused on the use of new materials, designs, and mitigation strategies to prevent or mitigate PID. Materials such as conductive polymers, anti-reflective coatings, and specialized coatings have been developed, along with mitigation strategies such as bypass diodes and DC-DC converters. Understanding the various factors that contribute to PID, such as temperature and humidity, is critical for the development of effective approaches to prevent and mitigate this issue. This review aims to provide an overview of the latest research and developments in the field of PID in PV modules, highlighting the materials, designs, and strategies that have been developed to address this issue. We emphasize the importance of PID research and development in the context of the global effort to combat climate change. By improving the performance and reliability of PV systems, we can increase their contribution to the transition towards a low-carbon energy system.
1. Introduction
The photovoltaic (PV) industry faces a significant challenge in the form of potential-induced degradation (PID) [1,2,3], which can cause a reduction in the performance of PV modules over time. PID is caused by an electrical potential difference between the front and back electrodes of the PV module and can be triggered by various factors such as humidity, high temperatures, and certain chemicals. PID can have a major impact on the overall performance and efficiency of PV systems, with some studies estimating that it can reduce power output by 30% or more [4,5].
To address this challenge, researchers and manufacturers are continually developing strategies and technologies to prevent or mitigate the effects of PID. This includes the development of new materials and designs for PV modules that are more resistant to PID, as well as improved testing methods and PID prevention strategies.
In this review, we aim to provide a comprehensive overview of the latest research and developments in the field of PID in PV modules. Our focus is on highlighting the advantages and disadvantages of current PID mitigation strategies and exploring the importance of ongoing research efforts to overcome the challenge of PID in the PV industry. We will also examine the mechanisms behind PID and its impact on PV module performance.
Section 2 of this review will explore the mechanisms behind PID, while Section 3 will cover the latest research and developments in materials and designs specifically designed to prevent PID. Section 4 will introduce improved testing methods for detecting PID, and Section 5 will cover new PID-resistant materials and designs. Section 6 will detail the various causes of PV module PID, and Section 7 will describe three mitigation strategies for PV module PID. Finally, in Section 8 and Section 9, the review’s discussions and conclusions are presented.
2. PID Mechanism
PV systems can experience PID, which leads to decreased performance of PV modules due to an electrical potential difference between their front and back electrodes [6,7,8]. PID can be caused by multiple factors, including moisture ingress, elevated temperatures, and the presence of certain chemicals. The presence of an electrical potential difference between the module’s front and back electrodes is a primary mechanism responsible for PID [9]. Additionally, high temperatures can exacerbate PID by elevating the electrical resistance within the PV module.
The voltage required for PID to occur can vary depending on the contributing factors and the severity of the PID. Typically, PID can be triggered by a voltage of a few hundred volts [10] or higher between the front and back electrodes of the PV module. However, the effect of this voltage on the module’s performance can differ based on the extent of PID. As explained in [11], a small voltage (<500 V) may have a negligible impact on the module’s performance, while a higher voltage (e.g., 1000 V) can significantly decrease the power output of the module.
The specific voltage that is needed for PID to occur can vary depending on the specific factors that are contributing to PID and the severity of the PID. In general, PID can be caused by a voltage of a few hundred millivolts [10] or more between the front and back electrodes of the PV module. However, the impact of this voltage on the performance of the PV module can vary depending on the severity of the PID. In some cases, as described in [11], a small voltage may have minimal impact on the module’s performance, while in other cases, a larger voltage may significantly reduce the module’s power output.
There are several methods that can be used to conduct a photovoltaic potential-induced degradation (PID) test on a photovoltaic (PV) module. One common method is to use a PID tester [12], which is a specialized piece of equipment that is designed specifically for testing for PID in PV modules. To conduct a PID test using a PID tester, the PV module is typically connected to the tester in a reverse bias, with the front and back electrodes of the module connected to the tester in opposite polarity. The tester then applies a voltage and current to the PV module, typically at a level that is higher than the maximum voltage and current that the module is expected to encounter under normal operating conditions.
The specific voltage and current that are required to connect with a PV module in a reverse bias for a PID test will depend on the specific tester being used and the characteristics of the PV module. In general, the tester will apply a voltage and current that are high enough to stress the module and simulate the conditions that could lead to PID, but not so high as to damage the module [13,14]. Once the PID test is complete, the tester will typically provide data on the performance of the PV module during the test, including any changes in power output or other parameters that may be indicative of PID. This data can be used to assess the risk of PID in the PV module and identify any potential issues that may need to be addressed.
Electroluminescence (EL) imaging is a technique that is used to evaluate the performance of photovoltaic (PV) modules by measuring the light emission that occurs when an electrical current is applied to the module [15]. EL imaging is typically used to identify defects or issues in PV modules that may be affecting their performance, such as cracks, damaged electrodes, or other issues [16]. This information can be used to identify and address any issues that may be contributing to the durability and reliability issues of the PV modules.
One of the ways in which EL imaging can be used to detect photovoltaic PID in PV modules is by looking for changes in the light emission patterns of the module [17,18]. PID is a phenomenon that can reduce the performance of PV modules due to the presence of an electrical potential difference between the front and back electrodes of the module. This potential difference can cause an electrical current to flow between the electrodes, which can result in changes in the light emission patterns of the module. By analyzing the EL images of a PV module, it is possible to identify any changes in the light emission patterns that may be indicative of PID. This can be useful for identifying PID in PV modules and for determining the severity of the PID [19].
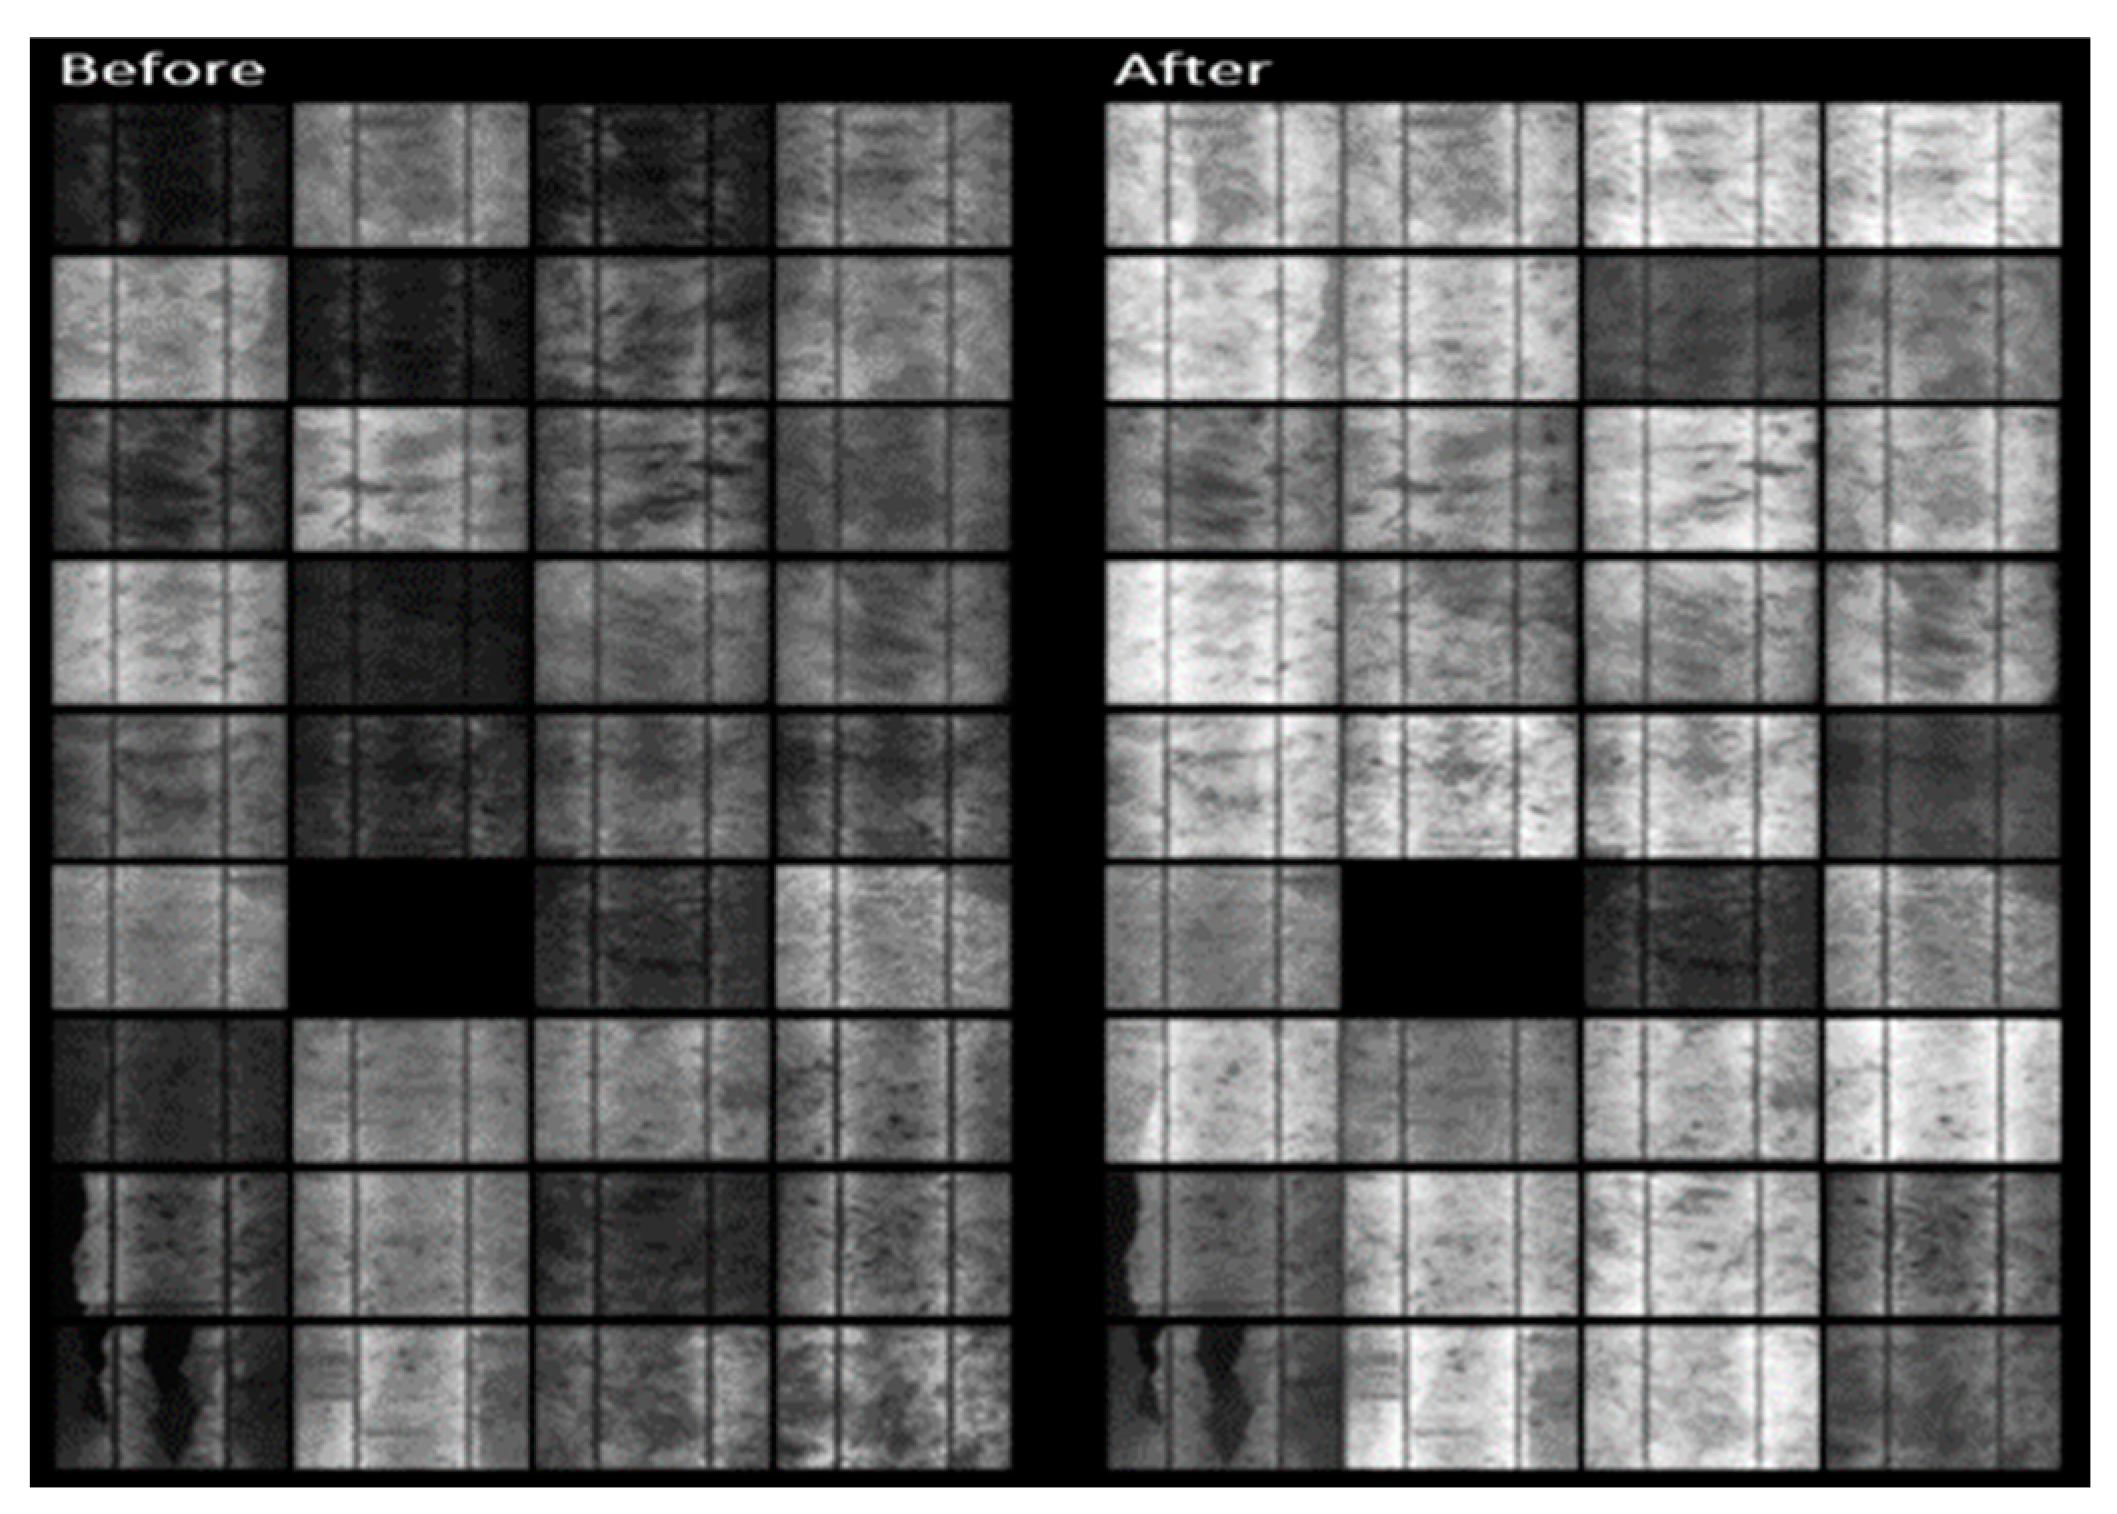
The PID test is done to ensure that manufactured modules will perform over a long period of time under different conditions. For PID testing of solar modules, as shown in Figure 1a, the module is subjected to a temperature of 60 °C with around 85% humidity and under 1000 V load for a period of 96 h. For example, in Figure 1b,c, a polycrystalline silicon PV module was connected in a reverse bias to 1000 V, which is significantly higher than the module’s open circuit voltage of 24 V. The test was completed for a duration of 96 h. EL images of the module were taken before and after the PID test was completed. As can be seen in Figure 1b, in comparison with Figure 1c, the PID test significantly reduced the light emissions of the solar cells, indicating a severe case of PID occurring in the module. The reduction in light emissions is a clear indication that the PID has impacted the performance of the module and reduced its ability to generate electricity.
Ionic migration is one of the mechanisms associated with PID in PV modules. In certain conditions, particularly when subjected to high voltage and high temperature, the migration of sodium ions (Na+) through the front glass and encapsulant of conventional crystalline silicon PV modules can contribute to PID, as shown in Figure 2. Sodium ions are naturally present in many materials used in PV module construction, such as glass and encapsulant materials. Under normal operating conditions, these ions remain relatively immobile [20]. However, when the module is exposed to elevated voltages, Na+ ions can drift through the module structure due to the presence of an electric field. This drift is accelerated by the high-temperature conditions often encountered in PV systems. Leakage currents can flow from the module frame to the solar cells along several different pathways: (1) along the surface of the front glass, and through the bulk of front glass and the encapsulant; (2) through the bulk of front glass (laterally) and through the bulk of the encapsulant; (3) along the interface between the front glass and the encapsulant, and through the bulk of the encapsulant; (4) through the bulk of the encapsulant; (5) along the interface between the encapsulant and the backsheet, and through the bulk of the encapsulant; and (6) along the surface of the backsheet, and through the bulk of the backsheet and encapsulant.
As Na+ ions migrate towards the negatively biased cell, they accumulate near the surface and create a localized electric field. This electric field can lead to a charge imbalance within the cell, affecting its electrical performance. The accumulation of positive charges near the surface can induce a reverse bias in the p-n junction, reducing the cell’s output voltage and ultimately its power output. The migration of sodium ions is facilitated by the presence of moisture within the module. Water molecules can provide a pathway for the movement of ions and increase the ionic conductivity of the encapsulant material. As a result, humid environments can exacerbate the ionic migration and enhance the occurrence of PID.
To mitigate PID related to ionic migration, various strategies have been developed. One approach involves the selection of low-sodium-content materials for the encapsulant and front glass to minimize the initial concentration of Na+ ions. Additionally, the use of anti-reflective coatings on the front glass can help reduce the intensity of the electric field at the surface and minimize the migration of sodium ions.
Interface charge is another mechanism that can contribute to PID in PV modules. In certain situations, the formation of a charged interface between the silicon wafer and the encapsulant or backsheet material can occur [21], leading to performance degradation. The interface charge phenomenon arises from charge separation at the interface between different materials within the PV module. This charge separation can be caused by either ionic conduction or electronic conduction processes. In some cases, impurities or contaminants present in the encapsulant or backsheet materials can facilitate the formation of charged species at the interface [22].
When a charged interface is formed, it creates an electric field within the module structure. This electric field can lead to various effects on the PV cell’s performance. One significant consequence is the reduction in the cell’s output voltage. The presence of the electric field can induce a reverse bias across the p-n junction, reducing the effective voltage available for the photovoltaic conversion process. As a result, the power output of the cell decreases, leading to a decline in the module’s overall performance.
3. Areas of PID Research and Development
In recent years, there has been a significant amount of research focused on understanding and mitigating PID. Some of the key findings and developments in this area are presented in Figure 2, described as follows:
Improved PID testing methods: Researchers have also developed new methods for testing the susceptibility of PV modules to PID, which can help manufacturers and installers identify and mitigate potential issues before they occur. New materials and designs for PV modules: Researchers have been exploring the use of new materials and designs for PV modules that are more resistant to PID. For example, some studies have found that using materials with a higher resistance to moisture ingress, such as fluorine-doped tin oxide (FTO) or metal-plated glass, can help to reduce the risk of PID. Finally, PID prevention strategies: Researchers have identified several strategies that can be used to prevent PID, such as sealing the edges of PV modules to prevent moisture ingress, using appropriate ventilation to reduce temperatures, and avoiding the use of certain chemicals that can contribute to PID.
4. Improved PID Testing Methods
Improved PID testing methods refer to methods that have been developed specifically to test the susceptibility of PV modules to photovoltaic PID. There are several different testing methods that have been developed for this purpose. Some examples are discussed next.
4.1. Temperature and Humidity Cycling
In this method, the PV module is subjected to temperature and humidity cycles, simulating field conditions. This test aims to replicate the conditions PV modules encounter in the field, including temperature and humidity changes, to identify potential PID issues. The module is placed in a controlled environment, typically a chamber [23], where temperature and humidity levels can be precisely controlled. Multiple cycles of varying temperature and humidity levels are applied to the module over a set duration, often several days. This ensures an adequate number of cycles. Following the test, the PV module is assessed for any performance changes or issues indicative of PID. Evaluation techniques include measuring power output, analyzing electrical characteristics, or examining EL images.
In a recent study [24], metal halide perovskite solar cells (PSCs) were subjected to rapid thermal and damp heating tests to assess their stability under different conditions. The results, shown in Figure 3, indicate that under all thermal cycles (ranging from 0 to 200) and under damp heat (ranging from 0 to 600 h), the normalized power conversion efficiency (PCE) remained stable at around 1 to 1.2, representing significant progress in the verification of PSC technology.
4.2. Direct Current Bias Test
A direct current (DC) voltage is applied to the PV module to simulate conditions that could lead to PID by stressing the module. To conduct a DC bias test, the PV module is typically connected to a DC power source, with the front and back electrodes of the module being connected to the power source in opposite polarity [25]. A DC voltage is then applied to the module, typically at a level that is higher than the maximum voltage that the module is expected to encounter under normal operating conditions. The DC bias test is typically conducted for a set duration of time, often several days or more, to ensure that the module has been subjected to sufficient stress. A recent study [26] examined the impact of a direct current bias test on the performance of PID modules. As shown in Figure 4, the authors demonstrated that when a direct current bias was applied to a PID-affected module for 10 days, the EL showed improved light emissions, indicating an improvement in the performance of the solar cells. Overall, the DC bias test is a useful method for testing for PID in PV modules and for identifying any issues or defects that may be contributing to PID. It can be used in combination with other testing methods to provide a more complete understanding of the performance and reliability of PV modules.
4.3. Accelerated Aging Test
This method involves subjecting the PV module to extreme conditions, such as high temperatures, humidity, or ultraviolet (UV) radiation, in order to accelerate the aging process and simulate the conditions that the module may encounter over its lifetime [27,28]. To conduct an accelerated aging test, the PV module is typically placed in a chamber or other controlled environment, where the temperature, humidity, and UV radiation levels can be precisely controlled. The module is then subjected to a series of extreme conditions, with the temperature, humidity, and UV radiation levels being varied over a range of values. The module is typically tested for a set duration of time [29], often several days or more, to ensure that it has been subjected to a sufficient number of temperature and humidity cycles.
5. New Materials and Designs for PV Modules, Especially Designed to Prevent PID
There have been several new materials and designs for photovoltaic (PV) modules developed in recent years, with the goal of improving their performance and reducing the risk of issues such as photovoltaic PIV. Some examples of new materials and designs that have been developed include those summarized in Figure 5.
Fluorine-doped tin oxide (FTO): FTO is a type of transparent conductive oxide [30] that has a high resistance to moisture ingress and has been shown to be effective at preventing PID. It is often used as a front electrode material in PV modules. FTO is a doped version of tin oxide (SnO2) [31], in which a small amount of fluorine is introduced into the crystal structure of the tin oxide. This helps to improve the electrical conductivity of the material, making it more suitable for use as an electrode in PV modules. FTO has several properties that make it well-suited for use in PV modules. One of the main advantages of FTO is its transparency, which allows it to transmit light effectively and enables it to be used as an electrode in transparent PV modules. FTO also has a relatively low resistivity, which helps to reduce losses due to electrical resistance in the module.
Metal-plated glass: Metal-plated glass is another material that has been shown to be effective at preventing PID. It is typically used as the front sheet of the PV module, and the metal coating helps to prevent moisture ingress and reduce the risk of PID. Metal-plated glass is a type of glass that is coated with a thin layer of metal [32], typically using a process known as sputtering. This process involves bombarding the surface of the glass with a stream of high-energy ions, which causes the metal atoms to become dislodged from their source material and to be deposited onto the surface of the glass. The thickness of the metal layer can be precisely controlled by adjusting the sputtering process, and the metal layer can be made as thin as a few nanometers or less.
Passivated emitters and rear cells (PERCs): PERCs are a type of PV cell design that involves adding a layer of passivation material to the back surface of the cell [33,34], which helps to reduce the recombination of electrons and improve the cell’s efficiency. It has been found to be effective at reducing the risk of PID. PERC technology is based on the principle of passivation, which refers to the process of reducing the electrical activity at the surface of a material. By adding a layer of passivation material to the back surface of the PV cell, it is possible to reduce the recombination of electrons and holes at the surface of the cell, which helps to improve the efficiency of the cell. There are other benefits to using PERC technology in PV modules other than preventing PID. One of the main benefits is that it can significantly improve the efficiency of the PV cells [35], which can translate into higher power output and increased energy production from the PV system. In addition, as described by [36,37], PERC technology can help to improve the reliability and long-term performance of PV modules, as it helps to reduce the risk of defects or issues that may impact the performance of the cells.
Interdigitated back contact (IBC) cells: IBC cells are a type of PV cell design that involves arranging the electrical contacts on the back surface of the cell in an interdigitated pattern [38,39,40]. This can help to reduce the electrical resistance of the cell and improve its efficiency and has also been found to be effective at reducing the risk of PID. There are several steps involved in creating an interdigitated back contact (IBC) for a photovoltaic (PV) cell:
- Start by preparing the substrate material for the IBC. This typically involves cleaning and etching the surface of the substrate to create a rough texture that will help to promote adhesion between the substrate and the IBC layers.
- Next, apply a layer of metal to the substrate using a process such as sputtering or evaporation. This layer will form the bottom electrode of the IBC.
- Apply a layer of passivation material to the substrate, using a process such as plasma-enhanced chemical vapor deposition (PECVD) [41]. This layer helps to reduce the recombination of electrons and holes at the surface of the cell, which improves the efficiency of the cell.
- Repeat steps 2 and 3 to create additional layers of metal and passivation material, building up the IBC structure as desired. The thickness and number of layers can be varied to suit the specific requirements of the PV cell.
- Once the IBC has been built up to the desired thickness, the PV cell is typically passivated and sealed to protect it from the environment. This typically involves applying a layer of encapsulant material to the cell to seal it and prevent moisture or other contaminants from entering the cell.
6. PID Mitigating Strategies
To prevent and mitigate PID, it is important to identify and address the underlying causes of the phenomenon. This may involve designing PV modules to be more resistant to PID, using materials and construction techniques that are less prone to PID, and implementing proper installation and maintenance procedures to reduce the risk of PID.
6.1. Sealing the Edges of PV Modules to Prevent Moisture Ingress
A main cause of PID is moisture ingress, which occurs when water enters the PV module through gaps or seams in the module. To prevent moisture ingress, it is important to seal the edges of the PV module to prevent water from entering the module [42]. To seal the edges of PV modules, the following steps can be taken:
- Clean the edges of the PV module to remove any dirt, debris, or other contaminants that may interfere with the sealing process.
- Inspect the edges to identify any gaps or seams that may allow moisture to enter the module.
- Apply a sealant material to the edges of the PV module, using a sealant gun or other suitable applicator. The sealant should be applied in a continuous bead around the edges of the module, taking care to fill in any gaps or seams that may allow moisture to enter the module.
- Allow the sealant to cure according to the manufacturer’s instructions. This may involve waiting for a specified amount of time or exposing the sealant to heat or other conditions to accelerate the curing process.
- Inspect the sealed edges of the PV module to ensure that the sealant has been applied correctly and that there are no gaps or seams that may allow moisture to enter the module.
According to a recent paper [43], the degradation of glass/glass (G/G) mini modules begins at the edges after 500 h of testing (as shown in Figure 6a). This degradation gradually expands the inactive area. In contrast, the use of an edge sealant configuration in G/G modules prevents degradation due to PID, as illustrated in Figure 6b.
6.2. PV Installation Grounding Techniques
Another way to prevent and mitigate PID is to use proper grounding techniques that are important in the installation of PV modules to ensure the safety of the system and minimize the risk of PID. Proper grounding techniques involve properly grounding the PV module and other components of the PV system to ensure that they are connected to the earth and are at the same electrical potential as the earth. There are several steps involved in using proper grounding techniques when installing a PV system, and these are presented in Figure 7, including key steps: identify the grounding requirement for the PV system, select appropriate grounding materials and equipment, install the grounding system, and finally test and validate the utilized grounding system.
6.3. PV Maintenance and Faul Detection Strategy
It is possible to prevent and mitigate PID by implementing proper installation and maintenance procedures. Performing regular maintenance to identify and address any issues contributing to PID may involve the use of proper installation techniques and performing regular maintenance to ensure that the PV system is installed correctly.
There are several algorithms that have been developed for detecting faults in PV systems. These algorithms can be trained to recognize specific types of faults based on historical data and analyze the electrical behavior of PV systems to identify deviations from normal operating conditions that may indicate the presence of a fault. Some examples of algorithms used for PV fault detection include the followings:
- Current and voltage waveform analysis: techniques such as fast Fourier transforms (FFTs) [49] can be used to analyze the waveforms of current and voltage in PV inverters and identify deviations that may be caused by a fault.
In addition to the above-mentioned PV fault detection techniques, there are several statistical-based methods that can be used to detect PV faults. The first method is descriptive statistics, which involves calculating summary statistics such as mean, median, and standard deviation for a set of PV system data and using these statistics to identify patterns or anomalies that may indicate the presence of a fault [50]. The second method is data visualization, such as the work presented by [51]. This method involves using plots and charts to visually represent PV system data and using these visualizations to identify patterns or anomalies that may indicate the presence of a fault. The last method is called hypothesis testing. It involves formulating a hypothesis about the cause of a fault and using statistical tests to determine whether the data support or refute the hypothesis.
In comparison with mathematical-based models, statistical methods are generally less complex and easier to understand, but they may not be as accurate or efficient at detecting PV faults. Mathematical-based models, such as machine learning (ML) algorithms, can often analyze data more accurately and quickly, but they may be more complex and require more data to be effective. Ultimately, the choice between statistical and mathematical-based methods will depend on the specific needs and constraints of the PV system. The five most common ML-based PV fault detection techniques are presented below, and summarized in Figure 8:
Artificial Neural Networks (ANNs) are modeled after the human brain and are particularly good at analyzing patterns in data and making decisions based on this information. ANNs can analyze data from PV systems to identify deviations from expected behavior indicating the presence of a fault [52]. However, ANNs require a large amount of data to be effective and may not perform well if the data are noisy or of poor quality.
Support Vector Machines (SVMs) classify data points based on their characteristics [53]. They can handle high-dimensional data [54] and perform well even when the number of data points is relatively small.
Decision Trees build a tree-like model of decisions based on certain features of the data [55]. Random Forests, based on the idea of building multiple decision trees and aggregating their predictions, are powerful and widely used tools for PV system fault detection and diagnosis [56,57,58]. They can handle high-dimensional data and perform well even when the data are noisy or have a complex structure. However, they can be computationally intensive to train, so they may not be the best choice in situations where speed is a critical factor.
K-nearest neighbors (KNNs) classify data points based on the characteristics of their nearest neighbors. It is easy to implement and understand [59,60,61] and can handle high-dimensional data. However, it can be computationally intensive to find the K nearest neighbors for each data point [62].
The complexity and speed of PV fault detection can vary among different ML algorithms. ANNs have been shown to be more effective for PV fault detection in some cases. One reason for this is that ANNs can process and analyze large amounts of data more efficiently than KNNs or SVMs. Another reason for the effectiveness of ANNs for PV fault detection is their ability to learn and adapt to new data.
One of the main concerns with ANNs is their susceptibility to overfitting. Techniques such as regularization and cross-validation can mitigate this, but it is important to monitor the performance of the model to ensure that it is not overfitting. ANNs can be computationally intensive, particularly for large and complex datasets, and they may require specialized hardware or cloud resources to train and deploy effectively. SVMs and KNNs are generally less computationally demanding and can be trained and deployed on more modest hardware.
Finally, the interpretability of the algorithm may be important for some applications. ANNs are often considered to be “black box” models, meaning that it can be difficult to understand how the model is making its predictions.
There are several steps that can be taken to practically utilize a PV fault detection algorithm in a PV installation, and the step-by-step instructions are described in Figure 9. To practically utilize a PV fault detection algorithm in a PV installation, there are several steps that need to be taken, including collecting data, preprocessing the data, training the algorithm, implementing the algorithm, monitoring the algorithm, and maintaining the algorithm. Collecting data involves gathering information from the PV system while preprocessing the data involves filtering and cleaning the collected data. Training the algorithm involves teaching the algorithm how to recognize normal and abnormal operating conditions of the PV system. Implementing the algorithm involves integrating it into the control system of the PV installation. Monitoring and maintaining the algorithm involve regularly checking the algorithm’s performance and updating it with new data to improve its accuracy over time.
7. Factors That Contribute to PID in PV Modules
While PID can have a number of causes, two of the most common are PV hot spots and PV shading, and these factors will be described in this section.
7.1. PV Hotspots
A hot spot in a solar cell is an area on the cell where the temperature is significantly higher than the surrounding areas. Hot spots can be caused by a variety of factors, including high levels of sunlight, high electrical current, and poor ventilation. Hot spots can lead to several problems in solar cells, including reduced power output, shortened lifespan, and permanent damage [63,64,65]. In some cases, hot spots can even cause the cell to catch fire. Hot spots are a particular concern in PV modules because they can lead to potential-induced degradation (PID).
Hot spots in solar cells can lead to PID when the temperature of the hot spot becomes high enough to cause a voltage difference between the solar cell and the module’s frame. This voltage difference can cause an electrical current to flow through the module [66], leading to the formation of hot spots on the cells. As an example, Figure 10 illustrates the impact of a single hotspot on a PV module, where the temperature of the hotspot reaches 66.2 °C, compared to the temperature of an adjacent free hotspot PV module, which is 30.9 °C. The hot spots can then cause further degradation, leading to a decrease in the power output of the module and potentially causing permanent damage to the cells. Hot spot PID is typically caused by a combination of factors, including high temperatures, high humidity, and high electrical current. It can be prevented or mitigated through the use of proper design techniques and materials that are resistant to PID.
There are several approaches that can be taken to mitigate hot spots in PV modules, including (i) design for proper ventilation: ensuring that there is sufficient airflow around the PV module can help to dissipate heat and reduce the likelihood of hot spots [67], (ii) use materials with high thermal conductivity: materials with high thermal conductivity, such as aluminum [68], can help to dissipate heat more effectively and reduce the likelihood of hot spots, (iii) use solar cells with low thermal resistance: solar cells with low thermal resistance will be less prone to hot spots because they are better able to dissipate heat, (iv) install shading devices: installing shading devices, such as louvers or reflective panels, can help to reduce the amount of direct sunlight that reaches the PV module and reduce the risk of hot spots [69,70], and (v) implement active cooling systems: in some cases, it may be necessary to use active cooling systems, such as fans or water cooling [71], to dissipate heat and prevent hot spots.
7.2. PV Shading
Shading is a common problem in PV systems, and it can have a significant impact on the performance of PV modules. When a PV module is partially or fully shaded, the cells in the shaded area are unable to generate electricity as efficiently as unshaded cells [72,73,74,75]. This can lead to a voltage difference between the shaded cells and the unshaded cells, which can cause PID in the module. PID caused by shading can be particularly problematic because it is often difficult to detect. Shading may not be consistently present, and it may be difficult to identify the specific cells that are affected. As a result, the effects of shading on PID may not be immediately apparent, and the degradation may not be detected until it has already caused a significant reduction in the power output of the module.
There have been several studies that have investigated the impact of shading on PID in PV modules [76,77,78]. One study found that shading can significantly increase the likelihood of PID [76], particularly when the shading is severe or occurs over a long period of time. Another study found that shading can cause both hot spot PID and light-induced degradation (LID) in PV modules [77,78], with LID being more likely to occur in cells that are shaded for extended periods.
When a PV module is permanently shaded, meaning that it consistently receives less sunlight than it is designed for, it can lead to several problems. One problem is that the module may have an inactive bypass diode [79]. Bypass diodes are used to prevent a PV module from overheating when it is shaded. If a PV module is permanently shaded, the bypass diode may not activate, resulting in a short circuit in the sub-string. This can cause the sub-string to heat up, reducing the output power generation of the module by one third. As shown in Figure 11, a PV module has a heated sub-string due to its being affected by permanent shade on one of its sub-strings. During an EL test, the inactive bypass diode caused the module to lose one third of its power. The images shown in Figure 11 were taken at night at a PV test facility located at the University of York in the United Kingdom.
7.3. PV Cracks
Solar cell cracks are cracks or fractures that can occur in PV modules, as shown in the example of a solar cell in Figure 12a. They can be caused by a variety of factors, including mechanical stress, thermal expansion and contraction, and environmental factors such as extreme temperature fluctuations or moisture [80,81,82]. PV cracks can lead to several problems, including reduced power output, decreased efficiency, and shortened lifespan. In some cases, PV cracks can even cause the module to fail completely (Figure 12b).
PV cracks can develop in several different ways, depending on the specific cause. For example, mechanical stress can cause PV modules to crack when they are subjected to external forces, such as bending [83]. Thermal expansion and contraction can cause PV modules to crack when the temperature changes significantly, such as when the module is exposed to extreme heat or cold [84]. Environmental factors such as extreme temperature fluctuations or moisture can also cause PV modules to crack, particularly if the module is not properly sealed or protected from the elements [85].
The cracks in solar cells can lead to the development of PV hotspots for several reasons. First, PV cracks can allow moisture to enter the module, which can lead to the formation of hot spots when the moisture is trapped within the module. Second, PV cracks can create an electrical short circuit, which can cause an increase in electrical current and the formation of hot spots. Finally, PV cracks can cause a reduction in power output, which can lead to an increase in temperature and the formation of hot spots. According to a recent study [86], the larger the crack size, the more likely it is for a solar cell to develop a hotspot, as illustrated in Figure 13. In addition, cracks in solar cells can cause hotspots to develop because they can allow electrical current to bypass the normal resistance of the cell, resulting in a concentration of current in a small area. This concentration of current can cause the temperature of the cell to increase, leading to a hotspot. Hotspots can be damaging to solar cells because they can reduce the overall efficiency of the cell and may even cause the cell to fail.
There are several ways to prevent cracks from occurring in solar cells and to mitigate the potential damage caused by cracks that do occur. One important factor is to design the PV system with crack resistance in mind. This may involve using materials and design approaches that are less prone to cracking, such as using flexible solar cells or using reinforcement to increase the strength of the cell [87,88]. Proper sealing and protection can also help to prevent damage from environmental factors such as extreme temperatures, moisture, and UV radiation [89]. Regular inspection and maintenance are other important factors in preventing PV cracks. Inspecting the PV system on a regular basis can help to identify potential problems before they become serious, and addressing these problems early can help to prevent cracks from occurring or from causing significant damage. In addition, proper handling and transportation techniques can also help to prevent PV cracks from occurring. This may involve using protective packaging to prevent damage during transportation and handling the modules carefully to avoid mechanical damage [90].
8. Discussion
This section discusses several areas related to PID in PV modules that require further investigation. These areas include but are not limited to improved diagnosis and testing methods, an improved understanding of the causes of PID, the development of new materials and techniques for preventing PID, and long-term testing and performance evaluation.
8.1. More Accurate Diagnosis and Testing Methods
There is a need for more reliable and accurate methods for detecting and diagnosing PID in PV modules. Current methods are not always effective at identifying the extent of PID damage, which makes it difficult to determine the best approach for mitigating the damage. Currently, there are a few methods available for detecting and diagnosing PID in PV modules. These methods include electrical testing methods, such as IV curve measurement and power output testing, as well as visual inspection methods, such as the use of imaging technologies or other non-destructive testing methods. However, current methods for diagnosing PID are not always effective at accurately identifying the extent of PID damage, particularly in cases where the damage is subtle or not easily visible. This can make it difficult to determine the best approach for mitigating PID, and it can also lead to the use of inappropriate or ineffective remedies.
8.2. Improved Understanding of the Causes of PID
The basic mechanisms of PID are understood, but there is still much to learn about the specific factors that contribute to PID in PV modules. These factors may include the type of PV cells used, the materials and design of the PV module, the environment in which the module is installed, and other factors. Further research is needed to better understand the interactions between these factors and how they lead to PID. This could involve studying the effects of different materials and design approaches on the likelihood of PID occurring, as well as the effects of different environmental conditions on PID.
8.3. Development of New Materials and Techniques for Preventing PID
There is a need for new materials and techniques that are more resistant to PID. These could include new types of cells, new encapsulation material (i.e., Ethylene vinyl acetate (EVA), Polyvinyl butyral (PVB), and Polyethylene terephthalate (PET)), and new design approaches that reduce the likelihood of PID occurring. These approaches could involve changes to the materials or layout of the PV module, or the use of different techniques for mounting or installing the module.
8.4. Long-Term Testing and Performance Evaluation
Long-term testing and performance evaluation: Many of the current studies on PID in PV modules have focused on short-term performance, but there is a need for more long-term data on the effects of PID on the lifespan and overall performance of PV modules. Understanding the long-term effects of PID on PV modules is important for a few reasons. First, PID can have a significant impact on the power output and efficiency of PV modules, and this impact may change over time. By studying the long-term effects of PID, it is possible to better understand how PID affects the performance of PV modules and to develop more accurate models for predicting and mitigating the effects of PID. Second, PID can have a significant impact on the lifespan of PV modules. By studying the long-term effects of PID on PV modules, it is possible to better understand how PID affects the lifespan of PV modules and to identify ways to extend the lifespan of PV modules by preventing or mitigating PID. Overall, long-term testing and performance evaluation are important areas of research in the field of PID in PV modules, and there is a need for more data on the long-term effects of PID on the performance and lifespan of PV modules.
8.5. Standardisation of Testing Methods and Performance Metricsroved Understanding of the Causes of PID
Three is currently a lack of standardization in the methods used to test for and evaluate the performance of PV modules in the context of PID. Standardization would help to ensure that results from different studies are comparable and could facilitate the development of more accurate models for predicting PID in PV modules. For example, if all studies used the same testing methods and performance metrics, it would be easier to compare the results and to identify trends or patterns that may not be apparent when using different methods. Standardization would also help to ensure that the methods used to test for and evaluate PID are reliable and consistent, which is important for ensuring the accuracy of the results. There are several ways that standardization could be achieved in the field of PID in PV modules. One approach would be to develop and adopt a set of standardized testing methods and performance metrics that are widely accepted within the industry. Another approach would be to establish a certification or accreditation program for PID testing laboratories, which would ensure that the methods used by these laboratories meet certain standards of quality and reliability.
8.6. PV Hotspots and Cracks Preventions
PV hotspots and cracks are two types of problems that can lead to potential-induced degradation (PID) in photovoltaic (PV) modules. Hot spots occur when the temperature of a PV module exceeds a certain threshold, and they can be caused by a variety of factors, including electrical shorts, moisture, or other problems. Cracks in PV modules can also lead to PID, and they can be caused by mechanical stress, thermal expansion and contraction, and other factors. There are currently key gaps in our knowledge about how to prevent hot spots and cracks in PV modules. To address these gaps, there are several key areas of research and development that could be pursued, as shown in Figure 14, including (i) improved materials and design approaches, (ii) a better understanding of the underlying causes, (iii) improved diagnostic techniques, and (iv) long-term performance evaluation.
8.7. Overall Assessment of Power Loss Caused by PID
In Table 1, the reviewed papers mostly report on the power losses resulting from PID on PV modules and the conditions under which they were tested. The reported power losses after PID testing varies greatly, from 6.3% to 35%. The conditions that were used to test PID also vary from paper to paper; some papers use environmental chambers to simulate conditions that are similar to those experienced during actual field operations [91,92], such as high temperatures and humidity, and others investigate PID in operating PV plants. Some papers also reported different methods, such as EL, IR, and I-V curve measurements, which were used to assess the impact of PID on PV modules [93,94,95].
The conditions that have the greater impact on the PID test can be the humidity, temperature, and duration of exposure to the voltage bias. Moreover, as an example, Ref. [96] reported that the power losses are found to be higher when the PID test is done under light illumination, which is closer to the actual conditions that PV modules are subjected to when they’re in the field. In general, this comparative assessment suggests that PID can have a significant impact on the performance of PV modules and that the losses can vary depending on factors such as the weather, the type of PV technology used, and the conditions the module is under.
9. Conclusions
PID is a complex phenomenon that can significantly impact the performance and lifespan of PV modules. While progress has been made in understanding and mitigating PID, there are still several areas that require further investigation and action. Our recommendations to address PID in PV modules are as follows:
- Standardized Testing Methods: Develop standardized testing methods and performance metrics for PID to enable accurate diagnosis and evaluation of PID in PV modules.
- Research and Development: Increase research efforts to improve our understanding of the causes of PID and to develop new materials and techniques for preventing PID.
- Long-term Testing: Conduct long-term testing and performance evaluation of PV modules to better understand the impact of PID on their lifespan and reliability.
- Industry Partnerships: Promote partnerships and collaborations between researchers and industry to accelerate the development and deployment of PID-resistant PV technologies.
- Funding: Provide funding for research and development projects related to PID in PV modules to support the development of new solutions and innovations.
By focusing on these specific recommendations, we can make progress towards addressing PID in PV modules and improving the performance and reliability of PV systems. It is important for governments and industries to support these efforts through funding, partnerships, and collaborations, to ensure that PV technology can make the greatest possible contribution to the global effort to combat climate change. We encourage continued investment in research and development efforts to better understand and address PID in future PV deployment.
Author Contributions
Conceptualization, G.B. and M.D.; methodology, G.B.; validation, M.D.; formal analysis, G.B.; resources, M.D.; writing—original draft preparation, G.B.; writing—review and editing, M.D.; funding acquisition, M.D. All authors have read and agreed to the published version of the manuscript.
Funding
This research was funded by EPSRC IAA project, “Next-Generation Vertically Mounted Bifacial Solar Panels: Conceptualization, Field Testing, and Energy Performance Monitoring”.
Institutional Review Board Statement
Not applicable.
Informed Consent Statement
Not applicable.
Data Availability Statement
Not applicable.
Conflicts of Interest
The authors declare no conflict of interest.
References
- López-Escalante, M.C.; Caballero, L.J.; Martín, F.; Gabás, M.; Cuevas, A.; Ramos-Barrado, J.R. Polyolefin as PID-resistant encapsulant material in PV modules. Sol. Energy Mater. Sol. Cells 2016, 144, 691–699. [Google Scholar] [CrossRef]
- Hara, K.; Jonai, S.; Masuda, A. Potential-induced degradation in photovoltaic modules based on n-type single crystalline Si solar cells. Sol. Energy Mater. Sol. Cells 2015, 140, 361–365. [Google Scholar] [CrossRef]
- Hacke, P.; Spataru, S.; Terwilliger, K.; Perrin, G.; Glick, S.; Kurtz, S.; Wohlgemuth, J. Accelerated testing and modeling of potential-induced degradation as a function of temperature and relative humidity. IEEE J. Photovolt. 2015, 5, 1549–1553. [Google Scholar] [CrossRef]
- Hacke, P.; Terwilliger, K.; Smith, R.; Glick, S.; Pankow, J.; Kempe, M.; Kloos, M. System voltage potential-induced degradation mechanisms in PV modules and methods for test. In Proceedings of the 2011 37th IEEE Photovoltaic Specialists Conference, Seattle, WA, USA, 19–24 June 2011; pp. 814–820. [Google Scholar]
- Oh, J.; Bowden, S.; TamizhMani, G. Potential-induced degradation (PID): Incomplete recovery of shunt resistance and quantum efficiency losses. IEEE J. Photovolt. 2015, 5, 1540–1548. [Google Scholar] [CrossRef]
- Pingel, S.; Frank, O.; Winkler, M.; Daryan, S.; Geipel, T.; Hoehne, H.; Berghold, J. Potential induced degradation of solar cells and panels. In Proceedings of the 2010 35th IEEE Photovoltaic Specialists Conference, Honolulu, HI, USA, 20–25 June 2010; pp. 2817–2822. [Google Scholar]
- Razzaq, A.; Allen, T.G.; Liu, W.; Liu, Z.; De Wolf, S. Silicon heterojunction solar cells: Techno-economic assessment and opportunities. Joule 2022, 6, 514–542. [Google Scholar] [CrossRef]
- Xu, L.; Liu, J.; Luo, W.; Wehbe, N.; Seitkhan, A.; Babics, M.; Kang, J.; De Bastiani, M.; Aydin, E.; Allen, T.G.; et al. Potential-induced degradation in perovskite/silicon tandem photovoltaic modules. Cell Rep. Phys. Sci. 2022, 3, 101026. [Google Scholar] [CrossRef]
- Yamaguchi, S.; Jonai, S.; Hara, K.; Komaki, H.; Shimizu-Kamikawa, Y.; Shibata, H.; Niki, S.; Kawakami, Y.; Masuda, A. Potential-induced degradation of Cu (In, Ga) Se2 photovoltaic modules. Jpn. J. Appl. Phys. 2015, 54, 08KC13. [Google Scholar] [CrossRef]
- Luo, W.; Hacke, P.; Hsian, S.M.; Wang, Y.; Aberle, A.G.; Ramakrishna, S.; Khoo, Y.S. Investigation of the impact of illumination on the polarization-type potential-induced degradation of crystalline silicon photovoltaic modules. IEEE J. Photovolt. 2018, 8, 1168–1173. [Google Scholar] [CrossRef]
- Luo, W.; Hacke, P.; Terwilliger, K.; Liang, T.S.; Wang, Y.; Ramakrishna, S.; Aberle, A.G.; Khoo, Y.S. Elucidating potential-induced degradation in bifacial PERC silicon photovoltaic modules. Prog. Photovolt. Res. Appl. 2018, 26, 859–867. [Google Scholar] [CrossRef]
- Lausch, D.; Naumann, V.; Breitenstein, O.; Bauer, J.; Graff, A.; Bagdahn, J.; Hagendorf, C. Potential-induced degradation (PID): Introduction of a novel test approach and explanation of increased depletion region recombination. IEEE J. Photovolt. 2014, 4, 516–523. [Google Scholar] [CrossRef]
- Dhimish, M.; Hu, Y.; Schofield, N.; Vieira, R.G. Mitigating potential-induced degradation (PID) using SiO2 ARC layer. Energies 2020, 13, 5139. [Google Scholar] [CrossRef]
- Lausch, D.; Naumann, V.; Graff, A.; Hähnel, A.; Breitenstein, O.; Hagendorf, C.; Bagdahn, J. Sodium outdiffusion from stacking faults as root cause for the recovery process of potential-induced degradation (PID). Energy Procedia 2014, 55, 486–493. [Google Scholar] [CrossRef]
- Dhimish, M.; Holmes, V. Solar cells micro crack detection technique using state-of-the-art electroluminescence imaging. J. Sci. Adv. Mater. Dev. 2019, 4, 499–508. [Google Scholar] [CrossRef]
- Dhimish, M.; Badran, G. Investigating defects and annual degradation in UK solar PV installations through thermographic and electroluminescent surveys. npj Mater. Degrad. 2023, 7, 14. [Google Scholar] [CrossRef]
- Dhimish, M.; Holmes, V.; Mather, P.; Aissa, C.; Sibley, M. Development of 3D graph-based model to examine photovoltaic micro cracks. J. Sci. Adv. Mater. Dev. 2018, 3, 380–388. [Google Scholar] [CrossRef]
- Dhimish, M.; Holmes, V.; Mather, P. Novel photovoltaic micro crack detection technique. IEEE Trans. Device Mater. Reliab. 2019, 19, 304–312. [Google Scholar] [CrossRef] [Green Version]
- Kumar, V.; Maheshwari, P. Advanced analytics on IV curves and electroluminescence images of photovoltaic modules using machine learning algorithms. Prog. Photovolt. Res. Appl. 2022, 30, 880–888. [Google Scholar] [CrossRef]
- Dhere, N.G.; Shiradkar, N.S.; Schneller, E. Evolution of leakage current paths in MC-Si PV modules from leading manufacturers undergoing high-voltage bias testing. IEEE J. Photovolt. 2014, 4, 654–658. [Google Scholar] [CrossRef]
- Yamaguchi, S.; Van Aken, B.B.; Stodolny, M.K.; Löffler, J.; Masuda, A.; Ohdaira, K. Effects of passivation configuration and emitter surface doping concentration on polarization-type potential-induced degradation in n-type crystalline-silicon photovoltaic modules. Sol. Energy Mater. Sol. Cells 2021, 226, 111074. [Google Scholar] [CrossRef]
- Yamaguchi, S.; Van Aken, B.B.; Masuda, A.; Ohdaira, K. Potential-Induced Degradation in High-Efficiency n-Type Crystalline-Silicon Photovoltaic Modules: A Literature Review. Solar RRL 2021, 5, 2100708. [Google Scholar] [CrossRef]
- Karg, F.; Calwer, H.; Rimmasch, J.; Probst, V.; Riedl, W.; Stetter, W.N.; Vogt, H.; Lampert, M. Development of stable thin film solar modules based on CuInSe2. In Ternary and Multinary Compounds; CRC Press: Boca Raton, FL, USA, 2020; pp. 909–913. [Google Scholar]
- Shi, L.; Young, T.L.; Kim, J.; Sheng, Y.; Wang, L.; Chen, Y.; Feng, Z.; Keevers, M.J.; Hao, X.; Verlinden, P.J.; et al. Accelerated lifetime testing of organic–inorganic perovskite solar cells encapsulated by polyisobutylene. ACS Appl. Mater. Interfaces 2017, 9, 25073–25081. [Google Scholar] [CrossRef] [PubMed]
- Dhimish, M.; Tyrrell, A.M. Monocrystalline silicon photovoltaic mitigation of potential-induced degradation using SiO2 thin film and+ 1000 V biasing. Optik 2022, 255, 168732. [Google Scholar] [CrossRef]
- Dhimish, M.; Badran, G. Recovery of photovoltaic potential-induced degradation utilizing automatic indirect voltage source. IEEE Trans. Instrum. Meas. 2022, 71, 2000209. [Google Scholar] [CrossRef]
- Mansour, D.E.; Barretta, C.; Pitta Bauermann, L.; Oreski, G.; Schueler, A.; Philipp, D.; Gebhardt, P. Effect of backsheet properties on PV encapsulant degradation during combined accelerated aging tests. Sustainability 2020, 12, 5208. [Google Scholar] [CrossRef]
- Oreski, G.; Omazic, A.; Eder, G.C.; Voronko, Y.; Neumaier, L.; Mühleisen, W.; Hirschl, C.; Újvári, G.; Ebner, R.; Edler, M. Properties and degradation behaviour of polyolefin encapsulants for photovoltaic modules. Prog. Photovolt. Res. Appl. 2020, 28, 1277–1288. [Google Scholar] [CrossRef]
- Eder, G.C.; Voronko, Y.; Dimitriadis, S.; Knöbl, K.; Újvári, G.; Berger, K.A.; Halwachs, M.; Neumaier, L.; Hirschl, C. Climate specific accelerated ageing tests and evaluation of ageing induced electrical, physical, and chemical changes. Prog. Photovolt. Res. Appl. 2019, 27, 934–949. [Google Scholar] [CrossRef] [Green Version]
- Koo, B.R.; Bae, J.W.; Ahn, H.J. Optoelectronic multifunctionality of combustion-activated fluorine-doped tin oxide films with high optical transparency. Ceram. Int. 2019, 45, 10260–10268. [Google Scholar] [CrossRef]
- Krýsová, H.; Neumann-Spallart, M.; Tarabkova, H.; Paušová, Š.; Janda, P.; Maixner, J.; Kavan, L.; Krýsa, J. Reconstruction of SnO2 after cathodic polarization of FTO films-A simple way of fabricating orthorhombic SnO2. Mater. Chem. Phys. 2021, 273, 125038. [Google Scholar] [CrossRef]
- Yu, J.; Li, J.; Zhao, Y.; Lambertz, A.; Chen, T.; Duan, W.; Liu, W.; Yang, X.; Huang, Y.; Ding, K. Copper metallization of electrodes for silicon heterojunction solar cells: Process, reliability and challenges. Sol. Energy Mater. Sol. Cells 2021, 224, 110993. [Google Scholar] [CrossRef]
- Blakers, A. Development of the PERC solar cell. IEEE J. Photovolt. 2019, 9, 629–635. [Google Scholar] [CrossRef]
- Wang, H.; Cheng, X.; Yang, H. Temperature coefficients and operating temperature verification for passivated emitter and rear cell bifacial silicon solar module. IEEE J. Photovolt. 2020, 10, 729–739. [Google Scholar] [CrossRef]
- Luo, W.; Chen, N.; Shanmugam, V.; Yan, X.; Duttagupta, S.; Wang, Y.; Aberle, A.G.; Khoo, Y.S. Investigation of Potential-Induced Degradation in Bifacial n-PERL Modules. IEEE J. Photovolt. 2020, 10, 935–939. [Google Scholar] [CrossRef]
- Oh, K.S.; Cho, S.H.; Choi, J.Y.; Lee, K.J.; Chan, S.I. Improved reliability PERC PV modules with moth-eye nanostructured optical films using nano imprint lithography. Microelectron. Reliab. 2021, 126, 114320. [Google Scholar] [CrossRef]
- Gao, B.; Shao, Y.; Liu, W.; Xiang, H.; Yu, Y.; Liu, Z. Out-door reliability and degradation of HIT, CIGS, n-type multi-busbar, PERC, and CdTe modules in Shanghai, China. Sol. Energy Mater. Sol. Cells 2022, 236, 111490. [Google Scholar] [CrossRef]
- Haase, F.; Hollemann, C.; Wehmeier, N.; Bothe, K.; Min, B.; Schulte-Huxel, H.; Brendel, R.; Peibst, R. Design of Large Poly-Si on Oxide Interdigitated Back Contact (POLO IBC) Silicon Solar Cells with Local Al-p+ Contacts in the Constraints of Measurement and Module Integration. Solar RRL 2022, 6, 2200583. [Google Scholar] [CrossRef]
- Chen, N.; Buchholz, F.; Tune, D.D.; Isabella, O.; Mihailetchi, V.D. Mitigating cut losses in interdigitated back contact solar cells. IEEE J. Photovolt. 2022, 12, 1386–1392. [Google Scholar] [CrossRef]
- Ma, J.; Song, Y.; Qiao, S.; Liu, D.; Ding, Z.; Kopecek, R.; Chen, J.; Zhang, C.; Chen, M. Design, realization and loss analysis of efficient low-cost large-area bifacial interdigitated-back-contact solar cells with front floating emitter. Sol. Energy Mater. Sol. Cells 2022, 235, 111466. [Google Scholar] [CrossRef]
- Miyajima, S.; Irikawa, J.; Yamada, A.; Konagai, M. High quality aluminum oxide passivation layer for crystalline silicon solar cells deposited by parallel-plate plasma-enhanced chemical vapor deposition. Appl. Express 2009, 3, 12301. [Google Scholar] [CrossRef]
- Virtuani, A.; Annigoni, E.; Ballif, C. One-type-fits-all-systems: Strategies for preventing potential-induced degradation in crystalline silicon solar photovoltaic modules. Prog. Photovolt. Res. Appl. 2019, 27, 13–21. [Google Scholar] [CrossRef] [Green Version]
- Arruti, O.A.; Gnocchi, L.; Lisco, F.; Virtuani, A.; Ballif, C. Optimized module packaging for silicon heterojunction solar cells and increased PID resistance. EUPVSEC 2020, 789–791. [Google Scholar] [CrossRef]
- Pervez, I.; Antoniadis, C.; Massoud, Y. A reduced search space exploration metaheuristic algorithm for MPPT. IEEE Access 2022, 10, 26090–26100. [Google Scholar] [CrossRef]
- Millah, I.S.; Chang, P.C.; Teshome, D.F.; Subroto, R.K.; Lian, K.L.; Lin, J.F. An enhanced grey wolf optimization algorithm for photovoltaic maximum power point tracking control under partial shading conditions. IEEE Open J. Ind. Electron. Soc. 2022, 3, 392–408. [Google Scholar] [CrossRef]
- Seo, H.C. Development of New Protection Scheme in DC Microgrid Using Wavelet Transform. Energies 2022, 15, 283. [Google Scholar] [CrossRef]
- Nsaif, Y.M.; Hossain Lipu, M.S.; Hussain, A.; Ayob, A.; Yusof, Y.; Zainuri, M.A.A. A New Voltage Based Fault Detection Technique for Distribution Network Connected to Photovoltaic Sources Using Variational Mode Decomposition Integrated Ensemble Bagged Trees Approach. Energies 2022, 15, 7762. [Google Scholar] [CrossRef]
- Nsaif, Y.M.; Hossain Lipu, M.S.; Hussain, A.; Ayob, A.; Yusof, Y.; Zainuri, M.A.A. A Novel Fault Detection and Classification Strategy for Photovoltaic Distribution Network Using Improved Hilbert-Huang Transform and Ensemble Learning Technique. Sustainability 2022, 14, 11749. [Google Scholar] [CrossRef]
- Et-taleby, A.; Chaibi, Y.; Boussetta, M.; Allouhi, A.; Benslimane, M. A Novel Fault Detection Technique for PV Systems Based on the K-means Algorithm, Coded Wireless Orthogonal Frequency Division Multiplexing and Thermal Image Processing Techniques. Solar Energy 2022, 237, 365–376. [Google Scholar] [CrossRef]
- Vieira, R.G.; Dhimish, M.; de Araújo, F.M.U.; da Silva Guerra, M.I. Comparing Multilayer Perceptron and Probabilistic Neural Network for PV Systems Fault Detection. Expert Syst. Appl. 2022, 201, 117248. [Google Scholar] [CrossRef]
- Hong, Y.Y.; Pula, R.A. Methods of photovoltaic fault detection and classification: A review. Energy Rep. 2022, 8, 100276. [Google Scholar] [CrossRef]
- Jaen-Cuellar, A.Y.; Elvira-Ortiz, D.A.; Osornio-Rios, R.A.; Antonino-Daviu, J.A. Advances in fault condition monitoring for solar photovoltaic and wind turbine energy generation: A review. Energies 2022, 15, 5404. [Google Scholar] [CrossRef]
- Essam, Y.; Huang, Y.F.; Ng, J.L.; Birima, A.H.; Ahmed, A.N.; El-Shafie, A. Predicting streamflow in Peninsular Malaysia using support vector machine and deep learning algorithms. Sci. Rep. 2022, 12, 1248. [Google Scholar] [CrossRef]
- Yang, N.C.; Ismail, H. Voting-based ensemble learning algorithm for fault detection in photovoltaic systems under different weather conditions. Mathematics 2022, 10, 285. [Google Scholar] [CrossRef]
- Gaviria, J.F.; Narváez, G.; Guillen, C.; Giraldo, L.F.; Bressan, M. Machine learning in photovoltaic systems: A review. Renew. Energy 2022, 179, 1282–1301. [Google Scholar] [CrossRef]
- Yang, N.C.; Ismail, H. Robust Intelligent Learning Algorithm Using Random Forest and Modified-Independent Component Analysis for PV Fault Detection: In Case of Imbalanced Data. IEEE Access 2022, 10, 41119–41130. [Google Scholar] [CrossRef]
- Upadhyaya, S.; Bhende, C.N.; Mohanty, S.; Pati, R. Evaluation of Power Quality Disturbance in PV-Connected IEEE-14 Bus System Using Lifting-Based Wavelet Transform and Random Forest. Electr. Eng. 2022, 10, 2345–2354. [Google Scholar] [CrossRef]
- El Mrabet, Z.; Sugunaraj, N.; Ranganathan, P.; Abhyankar, S. Random Forest Regressor-Based Approach for Detecting Fault Location and Duration in Power Systems. Sensors 2022, 22, 458. [Google Scholar] [CrossRef]
- Swarna, K.S.V.; Vinayagam, A.; Ananth, M.B.J.; Kumar, P.V.; Veerasamy, V.; Radhakrishnan, P. A KNN Based Random Subspace Ensemble Classifier for Detection and Discrimination of High Impedance Fault in PV Integrated Power Network. Measurement 2022, 187, 110333. [Google Scholar] [CrossRef]
- Behzadi, M.; Amirahmadi, M.; Tolou Askari, M.; Babaeinik, M. Identification of Combined Power Quality Disturbances in the Presence of Distributed Generations Using Variational Mode Decomposition and K-Nearest Neighbors Classifier. Int. J. Eng. 2022, 35, 657–674. [Google Scholar]
- Tripathy, D.S.; Prusty, B.R.; Bingi, K. A k-Nearest Neighbor-Based Averaging Model for Probabilistic PV Generation Forecasting. Int. J. Numer. Modell. Electron. Netw. Devices Fields 2022, 35, e2983. [Google Scholar]
- Chahboun, S.; Maaroufi, M. Performance Comparison of K-Nearest Neighbor, Random Forest, and Multiple Linear Regression to Predict Photovoltaic Panels’ Power Output. In Advances on Smart and Soft Computing; Springer: Singapore, 2022; pp. 301–311. [Google Scholar]
- Goudelis, G.; Lazaridis, P.I.; Dhimish, M. A Review of Models for Photovoltaic Crack and Hotspot Prediction. Energies 2022, 15, 4303. [Google Scholar] [CrossRef]
- Ge, Q.; Li, Z.; Sun, Z.; Xu, J.; Long, H.; Sun, T. Low Resistance Hot-Spot Diagnosis and Suppression of Photovoltaic Module Based on IU Characteristic Analysis. Energies 2022, 15, 3950. [Google Scholar] [CrossRef]
- Dhimish, M.; Hu, Y. Rapid testing on the effect of cracks on solar cells output power performance and thermal operation. Sci. Rep. 2022, 12, 12168. [Google Scholar] [CrossRef] [PubMed]
- Afridi, M.; Kumar, A.; ibne Mahmood, F.; Tamizhmani, G. Hotspot testing of glass/backsheet and glass/glass PV modules pre-stressed in extended thermal cycling. Solar Energy 2023, 249, 467–475. [Google Scholar] [CrossRef]
- Abdelrazik, A.S.; Shboul, B.; Elwardany, M.; Zohny, R.N.; Osama, A. The recent advancements in the building integrated photovoltaic/thermal (BIPV/T) systems: An updated review. Renew. Sustain. Energy Rev. 2022, 170, 112988. [Google Scholar] [CrossRef]
- Stalin, P.M.J.; Prasad, K.S.; Kumar, K.P.; Hemadri, G.; Rajesh, M.; Kumar, K.P. Performance improvement of solar PV through the thermal management using a nano-PCM. Mater. Today Proc. 2022, 50, 1553–1558. [Google Scholar] [CrossRef]
- Kolamroudi, M.K.; Ilkan, M.; Egelioglu, F.; Safaei, B. Maximization of the output power of low concentrating photovoltaic systems by the application of reflecting mirrors. Renew. Energy 2022, 189, 822–835. [Google Scholar] [CrossRef]
- Dhimish, M.; Badran, G. Field Study of Photovoltaic Systems with Anti-Potential-Induced-Degradation Mechanism: UVF, EL, and Performance Ratio Investigations. Photonics 2023, 10, 225. [Google Scholar] [CrossRef]
- Zhao, Y.; Gong, S.; Zhang, C.; Ge, M.; Xie, L. Performance analysis of a solar photovoltaic power generation system with spray cooling. Case Stud. Therm. Eng. 2022, 29, 101723. [Google Scholar] [CrossRef]
- Li, C.; Yang, Y.; Fan, F.; Xia, L.; Peng, P.; Wang, Y.; Wei, H. A Novel Methodology for Partial Shading Diagnosis Using the Electrical Parameters of Photovoltaic Strings. IEEE J. Photovolt. 2022, 12, 1027–1035. [Google Scholar] [CrossRef]
- Murtaza, A.F.; Sher, H.A.; Khan, F.U.; Nasir, A.; Spertino, F. Efficient mpp tracking of photovoltaic (pv) array through modified boost converter with simple smc voltage regulator. IEEE Trans. Sustain. Energy 2022, 13, 1790–1801. [Google Scholar] [CrossRef]
- Zhang, Y.; Yu, Y.; Meng, F.; Liu, Z. Experimental investigation of the shading and mismatch effects on the performance of bifacial photovoltaic modules. IEEE J. Photovolt. 2019, 10, 296–305. [Google Scholar] [CrossRef]
- Pachauri, R.K.; Mahela, O.P.; Sharma, A.; Bai, J.; Chauhan, Y.K.; Khan, B.; Alhelou, H.H. Impact of partial shading on various PV array configurations and different modeling approaches: A comprehensive review. IEEE Access 2022, 8, 181375–181403. [Google Scholar] [CrossRef]
- Arekar, K.; Puranik, V.E.; Gupta, R. Performance Analysis of PID Affected Crystalline Silicon PV Module under Partial Shading Condition. In Proceedings of the 2021 IEEE 48th Photovoltaic Specialists Conference (PVSC), Fort Lauderdale, FL, USA, 20–25 June 2021; pp. 2415–2420. [Google Scholar]
- Sporleder, K.; Naumann, V.; Bauer, J.; Richter, S.; Hähnel, A.; Großer, S.; Turek, M.; Hagendorf, C. Root cause analysis on corrosive potential-induced degradation effects at the rear side of bifacial silicon PERC solar cells. Sol. Energy Mater. Sol. Cells 2019, 201, 110062. [Google Scholar] [CrossRef]
- Seok, M.G.; Kim, J.; Lee, Y.; Kim, Y.; Kim, Y.; Kim, S.M. Treatment of Light-Induced Degradation for Solar Cells in a p-PERC Solar Module via Induction Heating. Energies 2021, 14, 6352. [Google Scholar] [CrossRef]
- Dhimish, M.; Chen, Z. Novel open-circuit photovoltaic bypass diode fault detection algorithm. IEEE J. Photovolt. 2019, 9, 1819–1827. [Google Scholar] [CrossRef] [Green Version]
- Premchander, A.; Amin, I.; Oterkus, S.; Oterkus, E.; Elminshawy, N.A.S. Peridynamic modelling of propagation of cracks in photovoltaic panels. Procedia Struct. Integr. 2022, 41, 305–316. [Google Scholar] [CrossRef]
- Jiang, Y.; Zhao, C. Attention classification-and-segmentation network for micro-crack anomaly detection of photovoltaic module cells. Solar Energy 2022, 238, 291–304. [Google Scholar] [CrossRef]
- Dhimish, M.; Ahmad, A.; Tyrrell, A.M. Inequalities in photovoltaics modules reliability: From packaging to PV installation site. Renew. Energy 2022, 192, 805–814. [Google Scholar] [CrossRef]
- Abdellatif, B.; Chakir, E.; Abdellatif, G.; Elminor, H.; Messaoudi, C. Propagation of Cracks in Standard Cell and Half-Cell Photovoltaic Technology. In Proceedings of the 2020 2nd International Conference on Photovoltaic Science and Technologies (PVCon), Ankara, Turkey, 30 November–2 December 2020; pp. 1–4. [Google Scholar]
- Aghaei, M.; Fairbrother, A.; Gok, A.; Ahmad, S.; Kazim, S.; Lobato, K.; Oreski, G.; Reinders, A.; Schmitz, J.; Theelen, M.; et al. Review of degradation and failure phenomena in photovoltaic modules. Renew. Sustain. Energy Rev. 2022, 159, 112160. [Google Scholar] [CrossRef]
- Tao, W.; Bao, G.; Liu, J.; Zhang, M.; Wang, L.; Dai, J.; Huang, Y.; Du, Y.; Zhang, Z.; Jin, H. Thermo-mechanical stress modeling and experimental investigation on micro-cracks in tilling ribbon photovoltaic modules during lamination and mechanical load test. Solar Energy 2023, 249, 521–531. [Google Scholar] [CrossRef]
- Dhimish, M.; Kettle, J. Impact of Solar Cell Cracks Caused During Potential-Induced Degradation (PID) Tests. IEEE Trans. Electron Devices 2022, 69, 604–612. [Google Scholar] [CrossRef]
- Naikwadi, A.T.; Samui, A.B.; Mahanwar, P.A. Melamine-formaldehyde microencapsulated n-Tetracosane phase change material for solar thermal energy storage in coating. Sol. Energy Mater. Sol. Cells 2020, 215, 110676. [Google Scholar] [CrossRef]
- Dong, Q.; Chen, M.; Liu, Y.; Eickemeyer, F.T.; Zhao, W.; Dai, Z.; Yin, Y.; Jiang, C.; Feng, J.; Jin, S.; et al. Flexible perovskite solar cells with simultaneously improved efficiency, operational stability, and mechanical reliability. Joule 2021, 5, 1587–1601. [Google Scholar] [CrossRef]
- Sutherland, L.J.; Weerasinghe, H.C.; Simon, G.P. A Review on Emerging Barrier Materials and Encapsulation Strategies for Flexible Perovskite and Organic Photovoltaics. Adv. Energy Mater. 2021, 11, 2101383. [Google Scholar] [CrossRef]
- Vasudevan, D.P.; Bhatt, P.; Kottantharayil, A. Impact of transportation on Indian roads, on PV modules. In Proceedings of the 2019 IEEE 46th Photovoltaic Specialists Conference (PVSC), Chicago, IL, USA, 16–21 June 2019; pp. 1529–1532. [Google Scholar]
- Boulhidja, S.; Mellit, A.; Voswinckel, S.; Lughi, V.; Ciocia, A.; Spertino, F.; Massi Pavan, A. Experimental evidence of PID effect on CIGS photovoltaic modules. Energies 2020, 13, 537. [Google Scholar] [CrossRef] [Green Version]
- Sporleder, K.; Turek, M.; Schüler, N.; Naumann, V.; Hevisov, D.; Pöblau, C.; Großer, S.; Schulte-Huxel, H.; Bauer, J.; Hagendorf, C. Quick test for reversible and irreversible PID of bifacial perc solar cells. Sol. Energy Mater. Sol. Cells 2021, 219, 110755. [Google Scholar] [CrossRef]
- Bouaichi, A.; Merrouni, A.A.; El Amrani, A.; Jaeckel, B.; Hajjaj, C.; Naimi, Z.; Messaoudi, C. Long-term experiment on P-type crystalline PV module with potential induced degradation: Impact on power performance and evaluation of Recovery Mode. Renew. Energy 2022, 183, 472–479. [Google Scholar] [CrossRef]
- Dhimish, M.; Tyrrell, A.M. Power loss and hotspot analysis for photovoltaic modules affected by potential induced degradation. Npj Mater. Degrad. 2022, 6, 11. [Google Scholar] [CrossRef]
- Badran, G.; Dhimish, M. Field study on the severity of photovoltaic potential induced degradation. Sci. Rep. 2022, 12, 22094. [Google Scholar] [CrossRef]
- Ohdaira, K.; Akitomi, M.; Chiba, Y.; Masuda, A. Potential-induced degradation of N-type front-emitter crystalline silicon photovoltaic modules—Comparison between indoor and outdoor test results. Sol. Energy Mater. Sol. Cells 2023, 249, 112038. [Google Scholar] [CrossRef]
Figure 1.
(a) Procedure for PID testing. A high-voltage power supply is used to power the PV module, and the leakage current of the module can also be measured. (b) Before the PID test. (c) After 96 h of the PID test.
Figure 1.
(a) Procedure for PID testing. A high-voltage power supply is used to power the PV module, and the leakage current of the module can also be measured. (b) Before the PID test. (c) After 96 h of the PID test.

Figure 2.
The diagram illustrates the internal structure of a typical c-Si PV module, which consists of a glass-encapsulant-cell-encapsulant-backsheet arrangement. It also presents a model showcasing the potential paths for leakage currents. In this setup, the solar cells are maintained at a negative bias, while the module frame is grounded. The arrow depicted in the diagram indicates the direction of these leakage currents. Specifically, during negative voltage potential, such as through path 1, positive ions like sodium ions (Na+) migrate towards the cells [20].

Figure 3.
Damp heat and thermal cycling test results for method 3-encapsulated PSCs [24].
Figure 3.
Damp heat and thermal cycling test results for method 3-encapsulated PSCs [24].

Figure 4.
EL images before the PID recovery and after 10 days of the PID recovery, when a direct current bias test was applied [26].
Figure 4.
EL images before the PID recovery and after 10 days of the PID recovery, when a direct current bias test was applied [26].

Figure 5.
New materials and designs for PV modules, especially designed to prevent PID.

Figure 6.
EL images of mini-PV modules before and after 1000 h of PID test at 85 °C/85% RH/−1000 V [43]. (a) G/G, and (b) G/G with edge sealant.
Figure 6.
EL images of mini-PV modules before and after 1000 h of PID test at 85 °C/85% RH/−1000 V [43]. (a) G/G, and (b) G/G with edge sealant.

Figure 7.
Grounding techniques/strategy when installing a PV system to prevent potential PID.

Figure 8.
Comparison between the five most common ML-based algorithms used for PV fault detection.

Figure 9.
Step-by-step guide on how to implement PV fault detection algorithm in a PV installation.

Figure 10.
PV module with hotspot. This image is taken using a thermal drone, EVO II Dual 640T. A thermal camera has a sensitivity of 3 °C or 3% of the reading (whichever is greater). The image was taken when the solar irradiance was 733 W/m2.
Figure 10.
PV module with hotspot. This image is taken using a thermal drone, EVO II Dual 640T. A thermal camera has a sensitivity of 3 °C or 3% of the reading (whichever is greater). The image was taken when the solar irradiance was 733 W/m2.

Figure 11.
PV module with an inactive bypass diode due to permanent shade affecting the module.

Figure 12.
EL image of solar cells affected by cracks. (a) Minor crack in the middle of the solar cell, (b) major crack formation resulting in the solar cell failing to produce any output current.
Figure 12.
EL image of solar cells affected by cracks. (a) Minor crack in the middle of the solar cell, (b) major crack formation resulting in the solar cell failing to produce any output current.

Figure 13.
Solar cell temperature vs crack size in (%) [86]. Red squares indicate that the crack size has a significant impact on the temperature of the solar cell (>30 degrees), whereas blue circles indicate that the crack size has no significant impact.
Figure 13.
Solar cell temperature vs crack size in (%) [86]. Red squares indicate that the crack size has a significant impact on the temperature of the solar cell (>30 degrees), whereas blue circles indicate that the crack size has no significant impact.

Figure 14.
Future research area (gap of knowledge) to prevent PV hotspots and cracks.


Table 1.
An overview of key research papers on PV system power and PID.
| Year of Publication | Reported PV Power Losses | Comments/Observations/PID-Test | |
|---|---|---|---|
| [91] | 2020 | 35% after 120 h of PID test (or described as PID stress time) | The PV modules were tested in an environmental chamber at 85 °C and 85% humidity with a −1000 V negative voltage bias. After 20 h, the modules were evaluated using a flash tester to record I-V curves and calculate electrical parameters. |
| [92] | 2021 | Rear-side PID in the dark and under rear illumination cause power losses of 6.3% and 8.8%, respectively | A PID testing setup, including a high voltage source, temperature-controlled sample holder, light source, and measurement electronics, was used to evaluate the rear side of a bifacial solar cell. The testing lasted two hours, replicating real field conditions and considering light absorption in passivating layers. |
| [93] | 2022 | In the three PV modules examined, PID accounts for nearly 10% of the power loss | Researchers assessed PID in a 22.2 kW PV plant with monocrystalline silicon technology located in a hot semi-arid climate. Inspection techniques such as electroluminescence (EL), thermography (IR), and I-V curves were used to evaluate the impact on affected modules. |
| [94] | 2022 | The average power loss is 25% for the 28 tested PV modules | A total of 28 PV modules were subjected to damp heat conditions in a test chamber at 85% humidity and 85 °C. A −1000 V negative voltage was applied, and aluminum foil was placed on the front surface. EL images and I-V curves were measured at 0, 48, and 96 h following the IEC62804 standard. |
| [95] | 2022 | PID-affected PV modules lose more than 35% of their power | A 1.2 MW installation in Barcelona, Spain, was tested to investigate the development and impact of PIDs on module performance. Data were monitored and logged using the ICONICA inverter at a sampling rate of 1 sample/10 min. |
| [96] | 2023 | Depending on the weather, it can range from 10% to 40% outside, and from 10% to 40% indoors | The study compared indoor and outdoor tests on n-type front emitter (n-FE) crystalline silicon PV modules for potential-induced degradation. The indoor temperature of 85 °C showed a higher acceleration factor for polarization-type PIDs (PID-p) compared to outdoor conditions. PID-p declined on rainy days and recovered on sunny days. |
Disclaimer/Publisher’s Note: The statements, opinions and data contained in all publications are solely those of the individual author(s) and contributor(s) and not of MDPI and/or the editor(s). MDPI and/or the editor(s) disclaim responsibility for any injury to people or property resulting from any ideas, methods, instructions or products referred to in the content. |
© 2023 by the authors. Licensee MDPI, Basel, Switzerland. This article is an open access article distributed under the terms and conditions of the Creative Commons Attribution (CC BY) license (https://creativecommons.org/licenses/by/4.0/).
Share and Cite
MDPI and ACS Style
Badran, G.; Dhimish, M. Potential Induced Degradation in Photovoltaic Modules: A Review of the Latest Research and Developments. Solar 2023, 3, 322-346. https://0-doi-org.brum.beds.ac.uk/10.3390/solar3020019
AMA Style
Badran G, Dhimish M. Potential Induced Degradation in Photovoltaic Modules: A Review of the Latest Research and Developments. Solar. 2023; 3(2):322-346. https://0-doi-org.brum.beds.ac.uk/10.3390/solar3020019
Chicago/Turabian StyleBadran, Ghadeer, and Mahmoud Dhimish. 2023. "Potential Induced Degradation in Photovoltaic Modules: A Review of the Latest Research and Developments" Solar 3, no. 2: 322-346. https://0-doi-org.brum.beds.ac.uk/10.3390/solar3020019