
Relationships between Dietary Chemical Components and Enteric Methane Production and Application to Diet Formulation in Beef Cattle

1
Department of Veterinary Sciences, Texas Tech University, Lubbock, TX 79409, USA
2
Department of Animal and Food Sciences, Texas Tech University, Lubbock, TX 79409, USA
*
Author to whom correspondence should be addressed.
Methane 2024, 3(1), 1-11; https://0-doi-org.brum.beds.ac.uk/10.3390/methane3010001
Submission received: 5 December 2023
/
Revised: 28 December 2023
/
Accepted: 4 January 2024
/
Published: 9 January 2024
Abstract
:We used published data consisting of 263 treatment mean observations from beef cattle and dairy steers and heifers, in which CH4 was measured via chambers or head boxes, to evaluate relationships between enteric CH4 production and dry matter intake (DMI) and dietary components. Daily DMI was positively related (slope = 15.371, p < 0.001) to total daily production (g/d) of CH4 (r2 = 0.821). Among chemical components, dietary neutral detergent fiber (NDF) concentration was the most highly related (r2 = 0.696; slope = 0.2001; p < 0.001) to CH4 yield (g/kg of DMI), with strong relationships also noted for dietary starch:NDF ratio (r2 = 0.662; slope = −2.4587; p < 0.001), starch (r2 = 0.495; slope = −0.106; p < 0.001), and the proportion of metabolizable energy relative to gross energy (r2 = 0.561; slope = −23.663; p < 0.001). The slope (−0.5871) and intercept (22.2295) for the dietary ether extract vs. CH4 yield were significant (p < 0.001), but the relationship was highly variable (r2 = 0.150). For dietary crude protein concentration, the slope for CH4 yield was not significant (−0.0344; p < 0.381) with an r2 value near zero. Decreasing DMI by programming body weight gain or restricting feed intake could decrease CH4 production in confined cattle, but these approaches might negatively affect growth performance and product quality, potentially negating positive effects on CH4 production. Feeding higher-quality forages or using grazing management systems that decrease dietary NDF concentrations or substituting grain (starch) for forage should decrease both CH4 yield from enteric production and manure CH4 production via increased digestibility. Effects of feeding management and diet formulation strategies should be additive with other mitigation approaches such as feed additives, allowing the cattle industry to achieve maximal decreases in enteric CH4 production, while concurrently maintaining optimal beef production.
1. Introduction
Beef cattle production is the single largest agricultural commodity area in the United States, contributing over USD 66 billion in receipts in 2019 [1]. Although cattle can convert low-quality feeds into high-quality protein for human consumption, they are a source of agricultural greenhouse gas emissions to the atmosphere. The agriculture sector in the United States contributes approximately 10% of total greenhouse gas emissions, and livestock contributes 3.8% [2]. Nonetheless, enteric CH4 emissions are responsible for 30% of the anthropogenic methane budget, highlighting the need for a clear understanding of factors that affect CH4 production and development of practical mitigation strategies.
Methanogenesis is critical in cattle because it prevents accumulation of metabolic hydrogen in the rumen by serving as a reducing equivalent sink [3]. Alternative hydrogen sinks exist, however, and these alternative sinks are affected by the ingredient and chemical composition of the diet, such that the quantity of CH4 produced by cattle varies based on dietary constituents that are fed. Diets that produce acetate liberate hydrogen to be used by methanogenic archaea to produce CH4. Conversely, propionate serves as a net hydrogen sink, and diets that increase propionate and decrease acetate result in decreased ruminal CH4 production, reflecting decreased availability of metabolic hydrogen for methanogens to reduce CO2 to CH4.
Understanding relationships between various dietary constituents and CH4 production in cattle will allow for development of strategies to mitigate CH4 emissions by the cattle industry. Our objective was to evaluate the relationships between enteric CH4 production and dietary chemical constituents and feed intake using published databases and to relate the findings to diet formulation and management practices that could be used to decrease CH4 production.
2. Materials and Methods
Mixed model regression methods were used to evaluate the relationship between CH4 production and DMI and various dietary components using previously published data. The focus of this effort was not to develop prediction equations, but to examine relationships that could then be applied to feeding management strategies and diet formulation practices, thereby providing practical, cost-effective methods for decreasing enteric CH4 production.
2.1. Description of the Database
The database used to evaluate relationships between enteric CH4 production and DMI and dietary chemical components was derived from the development and evaluation datasets described by [4,5]. The development dataset consisted of 134 treatment means from 34 respiration calorimetry studies that involved growing and finishing beef cattle and dairy steers and heifers, whereas the evaluation dataset consisted of 129 treatment means from 29 respiration calorimetry studies with beef and dairy steers and heifers. Across the two datasets, measurements of daily CH4 production were obtained by using chambers 208 studies) or head boxes (55 studies). Dry matter intake and measured CH4 and energy concentrations (i.e., digestible [DE] and metabolizable [ME] energy) were available for all studies in these two datasets. The average body weight of animals in the combined dataset was 381 kg (range of 134 to 730 kg), with an average DMI of 6.3 kg/d (range of 2.3 to 12.2 kg). Daily CH4 production averaged 124.7 g/d (range of 25 to 268 g/d), with an average CH4 yield of 20.1 g/kg of DMI (range of 6.5 to 34.7). The complete development and evaluation datasets are available in spreadsheet format as supplementary material in [4]. As noted previously, the goal of the present analyses was to evaluate relationships, not to produce prediction equations. Thus, to provide the maximum number of observations to achieve this goal, the two datasets were combined to yield 263 observations from 63 studies. Dietary chemical components evaluated (expressed as a percentage of dietary dry matter [DM]) included crude protein (CP), ether extract (EE), neutral detergent fiber (NDF), and starch. Chemical components were calculated from tabular feed composition values for dietary feed ingredients [6] when not reported in the study. For the development dataset, all studies reported CP concentrations, but calculated values for EE, NDF, and starch were used for 46, 7, and 72% of the observations, respectively. For the evaluation dataset, calculated values for CP, EE, NDF, and starch were used for 19, 27, 57, and 64% of the observations, respectively. Because energy concentrations were available for all studies in the database, the relationship between metabolizability (ME concentration divided by gross energy [GE] concentration) and CH4 production was also evaluated.
2.2. Relationship of Methane Production to Dry Matter Intake and Dietary Components
Because DMI is a major factor affecting enteric CH4 production [6], initial analyses considered the relationship between DMI (kg/d) and CH4 production (g/d). Subsequent analyses involving dietary components and metabolizability focused on CH4 production per unit of DMI (g of CH4/kg of DMI), often referred to as CH4 yield. Mixed model methods described by [7] were used to evaluate the relationship between CH4 production as the dependent variable and DMI and the selected dietary composition variables. Random intercept and slope effects associated with the 63 studies were included for all models. The covariance structure used for these analyses was unstructured, and the estimation method was restricted maximum likelihood. Study-adjusted data were created for each data point from the linear models as described previously [8]. The coefficient of determination (r2) and root mean square error (RMSE) were determined for the model using the study-adjusted values and PROC MIXED and PROC REG of SAS (SAS Inst. Inc., Cary, NC, USA, version 9.3).
3. Results and Discussion
3.1. Relationships of Methane Production to Dry Matter Intake and Dietary Chemical Components
Results of the mixed model regression analyses are shown in Table 1, with graphical representations of the relationships shown in Figure 1. As mentioned previously, because of the importance of DMI as a driver of enteric CH4 production, initial analyses involved regression of daily CH4 production on DMI. As expected, the relationship between these two variables was strong, with DMI accounting for 82.1% of the variation in daily CH4 production (Table 1; Figure 1A). Dry matter intake has consistently been identified as a key component of equations to predict CH4 production in cattle [9,10,11,12], with DMI alone often yielding prediction equations that are equivalent in accuracy and precision to more complex equations.
Given the importance of DMI as a driver of enteric CH4 production, analyses of the effects of various dietary components focused on CH4 production relative to DMI (i.e., CH4, g/kg of DMI), which, as noted previously, is typically referred to as CH4 yield [10]. Across the wide range of dietary CP concentrations in the dataset (average of 14.6% of dietary DM, with a range of 2.4 to 28%), there was essentially no relationship to CH4 yield, with CP concentration accounting for only 0.3% of the variation in CH4 yield, with a non-significant (p = 0.381) slope of the regression equation (Table 1; Figure 1B). Jennings et al. [13] reported no difference in CH4 production as a percentage of GE or DE in beef steers fed diets with 13.8 vs. 19.5% CP. Likewise, increasing the level of fishmeal supplementation in dairy heifers fed straw-based diets did not affect CH4 production [14].
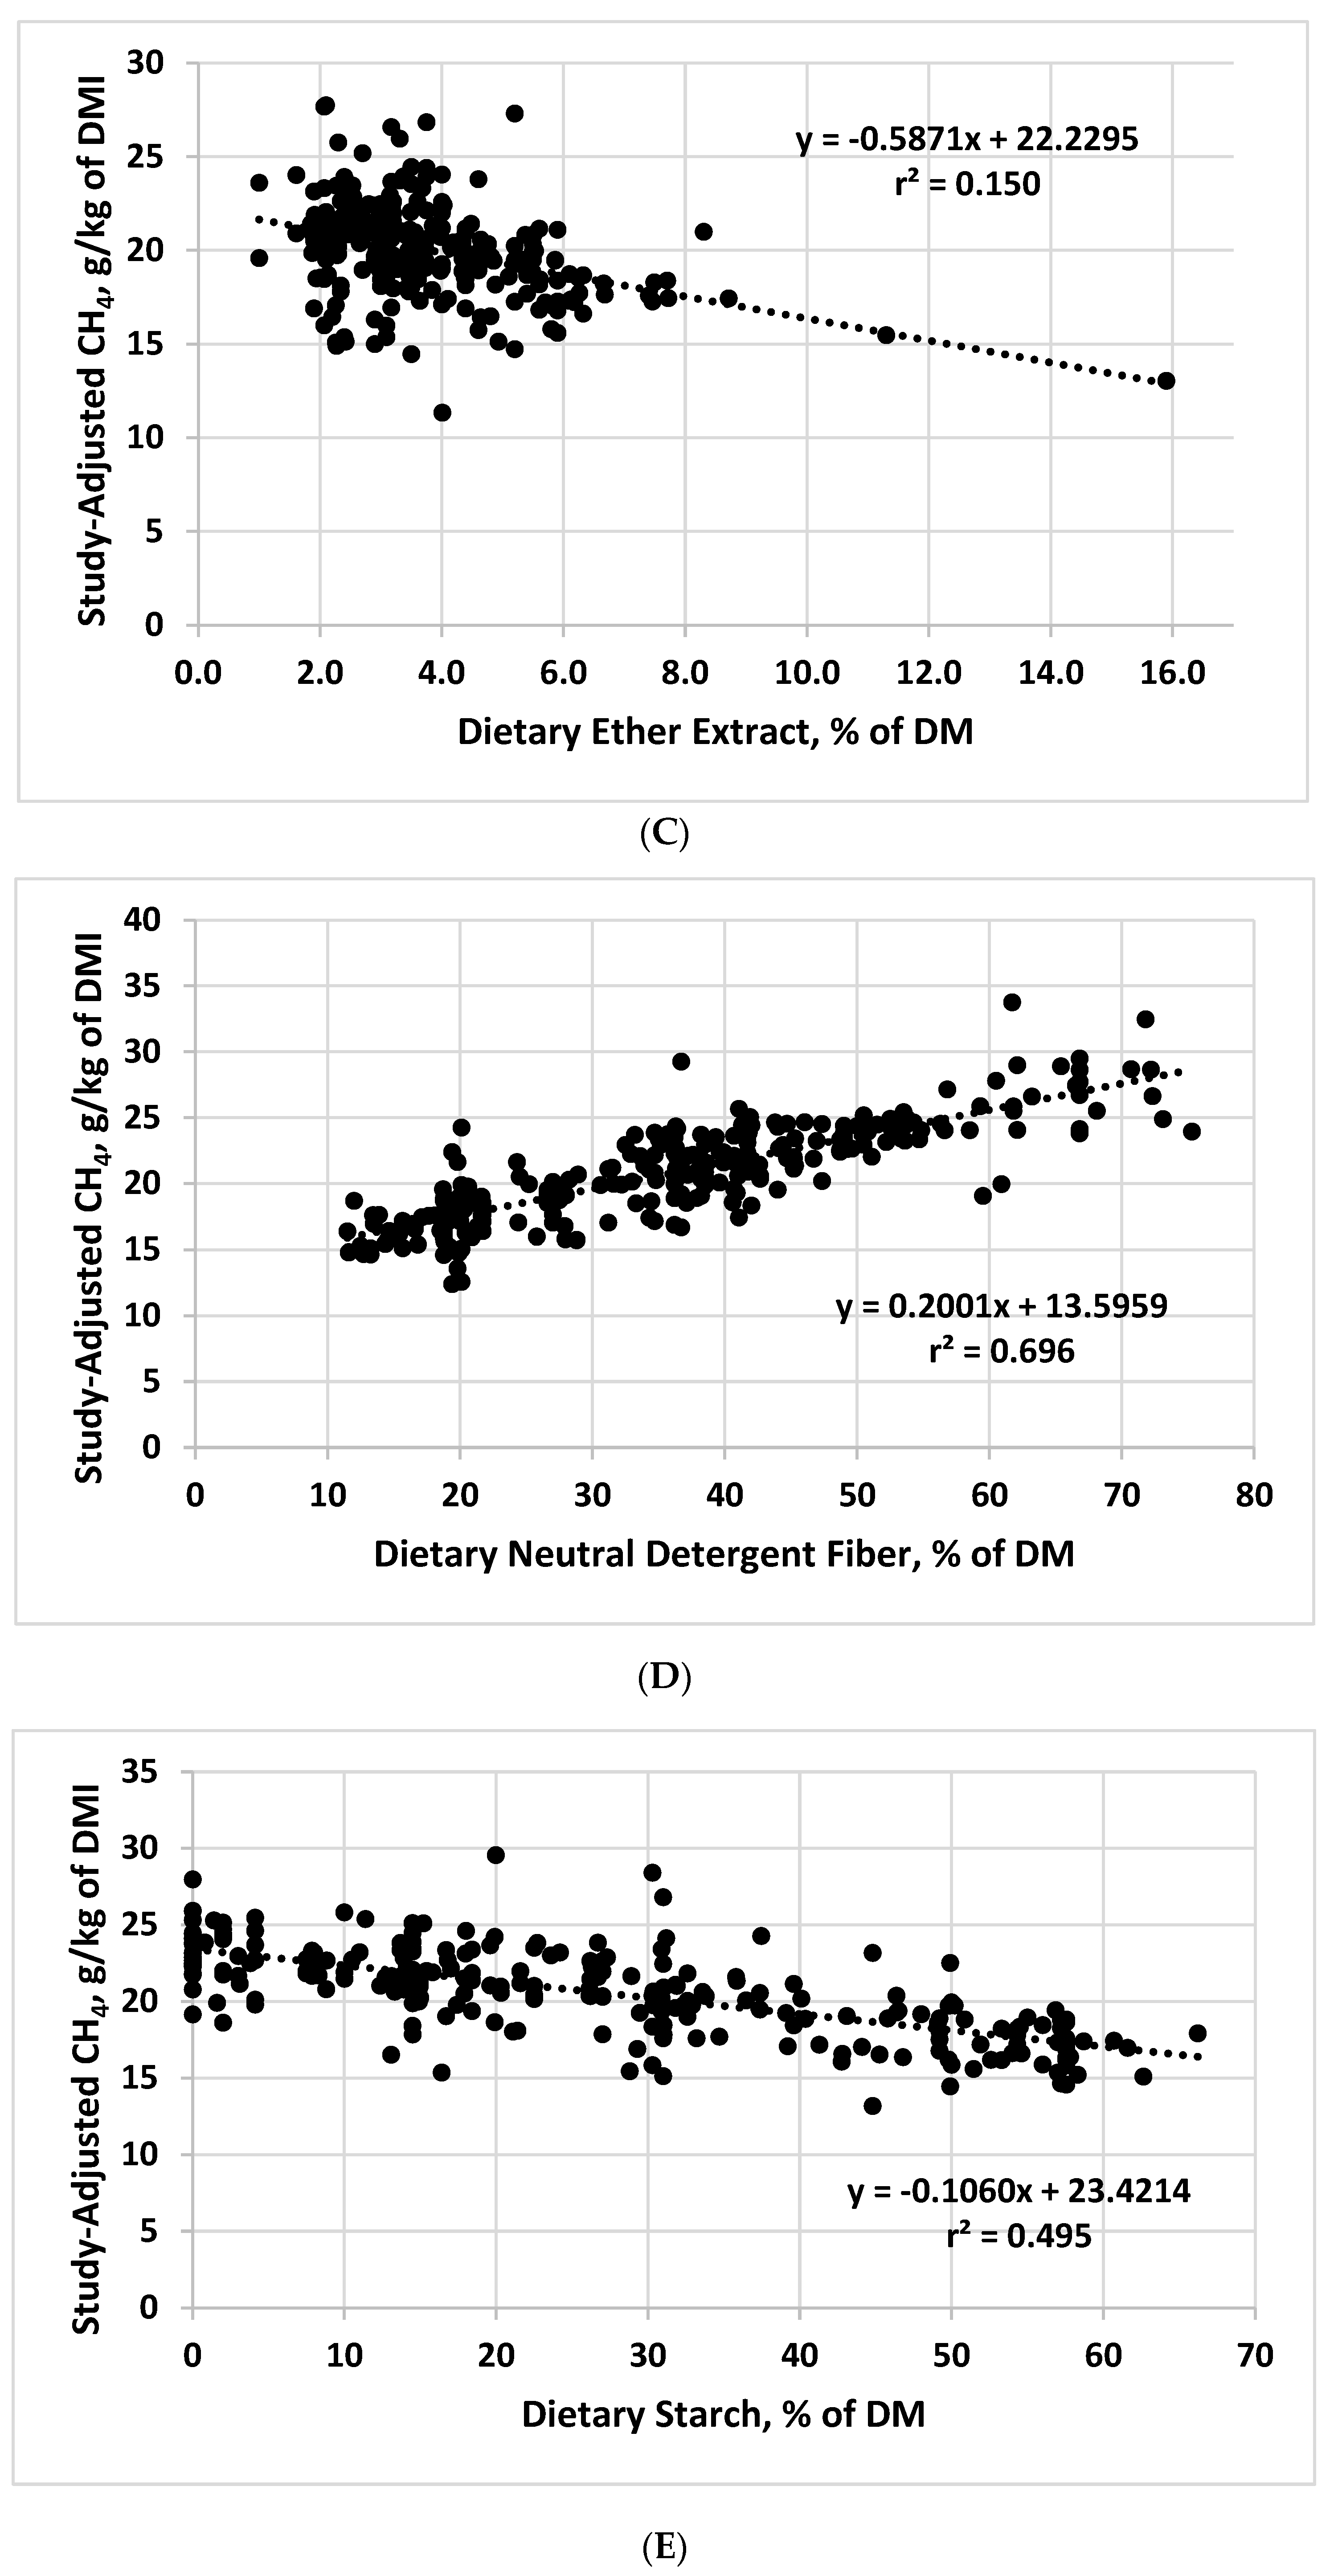
The EE concentration in the combined dataset averaged 3.82% of the dietary DM, with a range of 1 to 15.9%. The slope of the relationship between dietary EE concentration and CH4 yield was significant (p < 0.001), but the r2 was only 0.15 (Table 1). As is evident from the graphical relationship between CH4 yield and EE (Figure 1C), the negative slope associated with EE seemed to be strongly influenced by a small number of datapoints from diets with very high ether extract concentrations, which are known to decrease DMI and NDF digestibility [6]. Nonetheless, removal of the three datapoints from the study associated with these high values did not appreciably change the intercept or slope of the study-adjusted data and only slightly decreased the r2 (0.105)). Thus, within dietary EE concentrations ranging from approximately 2 to 6%, one would expect CH4 yield to generally decrease with increasing dietary EE concentrations, but responses would likely be highly variable. Using studies conducted with beef and dairy cattle and lambs, Beauchemin et al. [15] reported that each 1% increase in dietary EE decreased CH4 yield by 5.6%. Based on the observed slope and the overall mean for CH4 yield in our database, CH4 yield was decreased by 2.9% for each 1% increase in dietary EE concentration. Using specific fat sources could elicit more consistent responses, as adding 3.4 g of fat/kg of dietary DM from tallow, sunflower oil, and sunflower seeds to high-forage diets deceased CH4 production at equal DE intake by approximately 15% in beef heifers [16]. Because of the negative effects of added fat on ruminal fiber digestion, the potential to mitigate CH4 via added fat has limits, with the practical viability of this approach depending on whether the added energy from fat offsets negative effects on fiber digestion [15].
The average dietary NDF concentration in the combined dataset was 36.6%, with a range of 11.5 to 75.3% of the dietary DM. As dietary NDF concentration increased, CH4 yield increased, with the strongest relationship to CH4 yield (r2 = 0.696) of any of the dietary composition variables we evaluated (Table 1; Figure 1D). The effect of dietary NDF concentration is related to its negative relationship with dietary concentrate level—as grains replace forages in the diet, NDF decreases and starch increases, with a resulting decrease in CH4 production [17,18]. Although this relationship is straightforward for grains and traditional forages/coarse roughages, many grain byproducts have a relatively high NDF concentration, which might complicate the relationship between dietary NDF and CH4 production. Nonetheless, many of the datapoints in our combined database included diets with high levels of grain byproducts, suggesting that these feed sources might respond similarly to traditional roughage sources in terms of the relationship between NDF and CH4 yield.
Starch concentration in the combined dataset averaged 26.6% of the dietary DM, with a range of 0 to 66.2%. As expected from the inverse association between dietary concentrations of NDF and starch, CH4 yield decreased as starch concentration increased (Figure 1E). The relationship was not, however, as strong as the relationship between CH4 yield and dietary NDF concentration (r2 = 0.495 vs. 0.696). Increasing dietary starch is associated with decreased CH4 because of shifts in volatile fatty acids, particularly propionate, which competes with CH4 as sink for metabolic hydrogen [19]. In addition, increasing the proportion of grain and thereby starch content in diets increases microbial lipid synthesis by ruminal microbes [20], providing another potential sink for ruminal metabolic hydrogen [21].
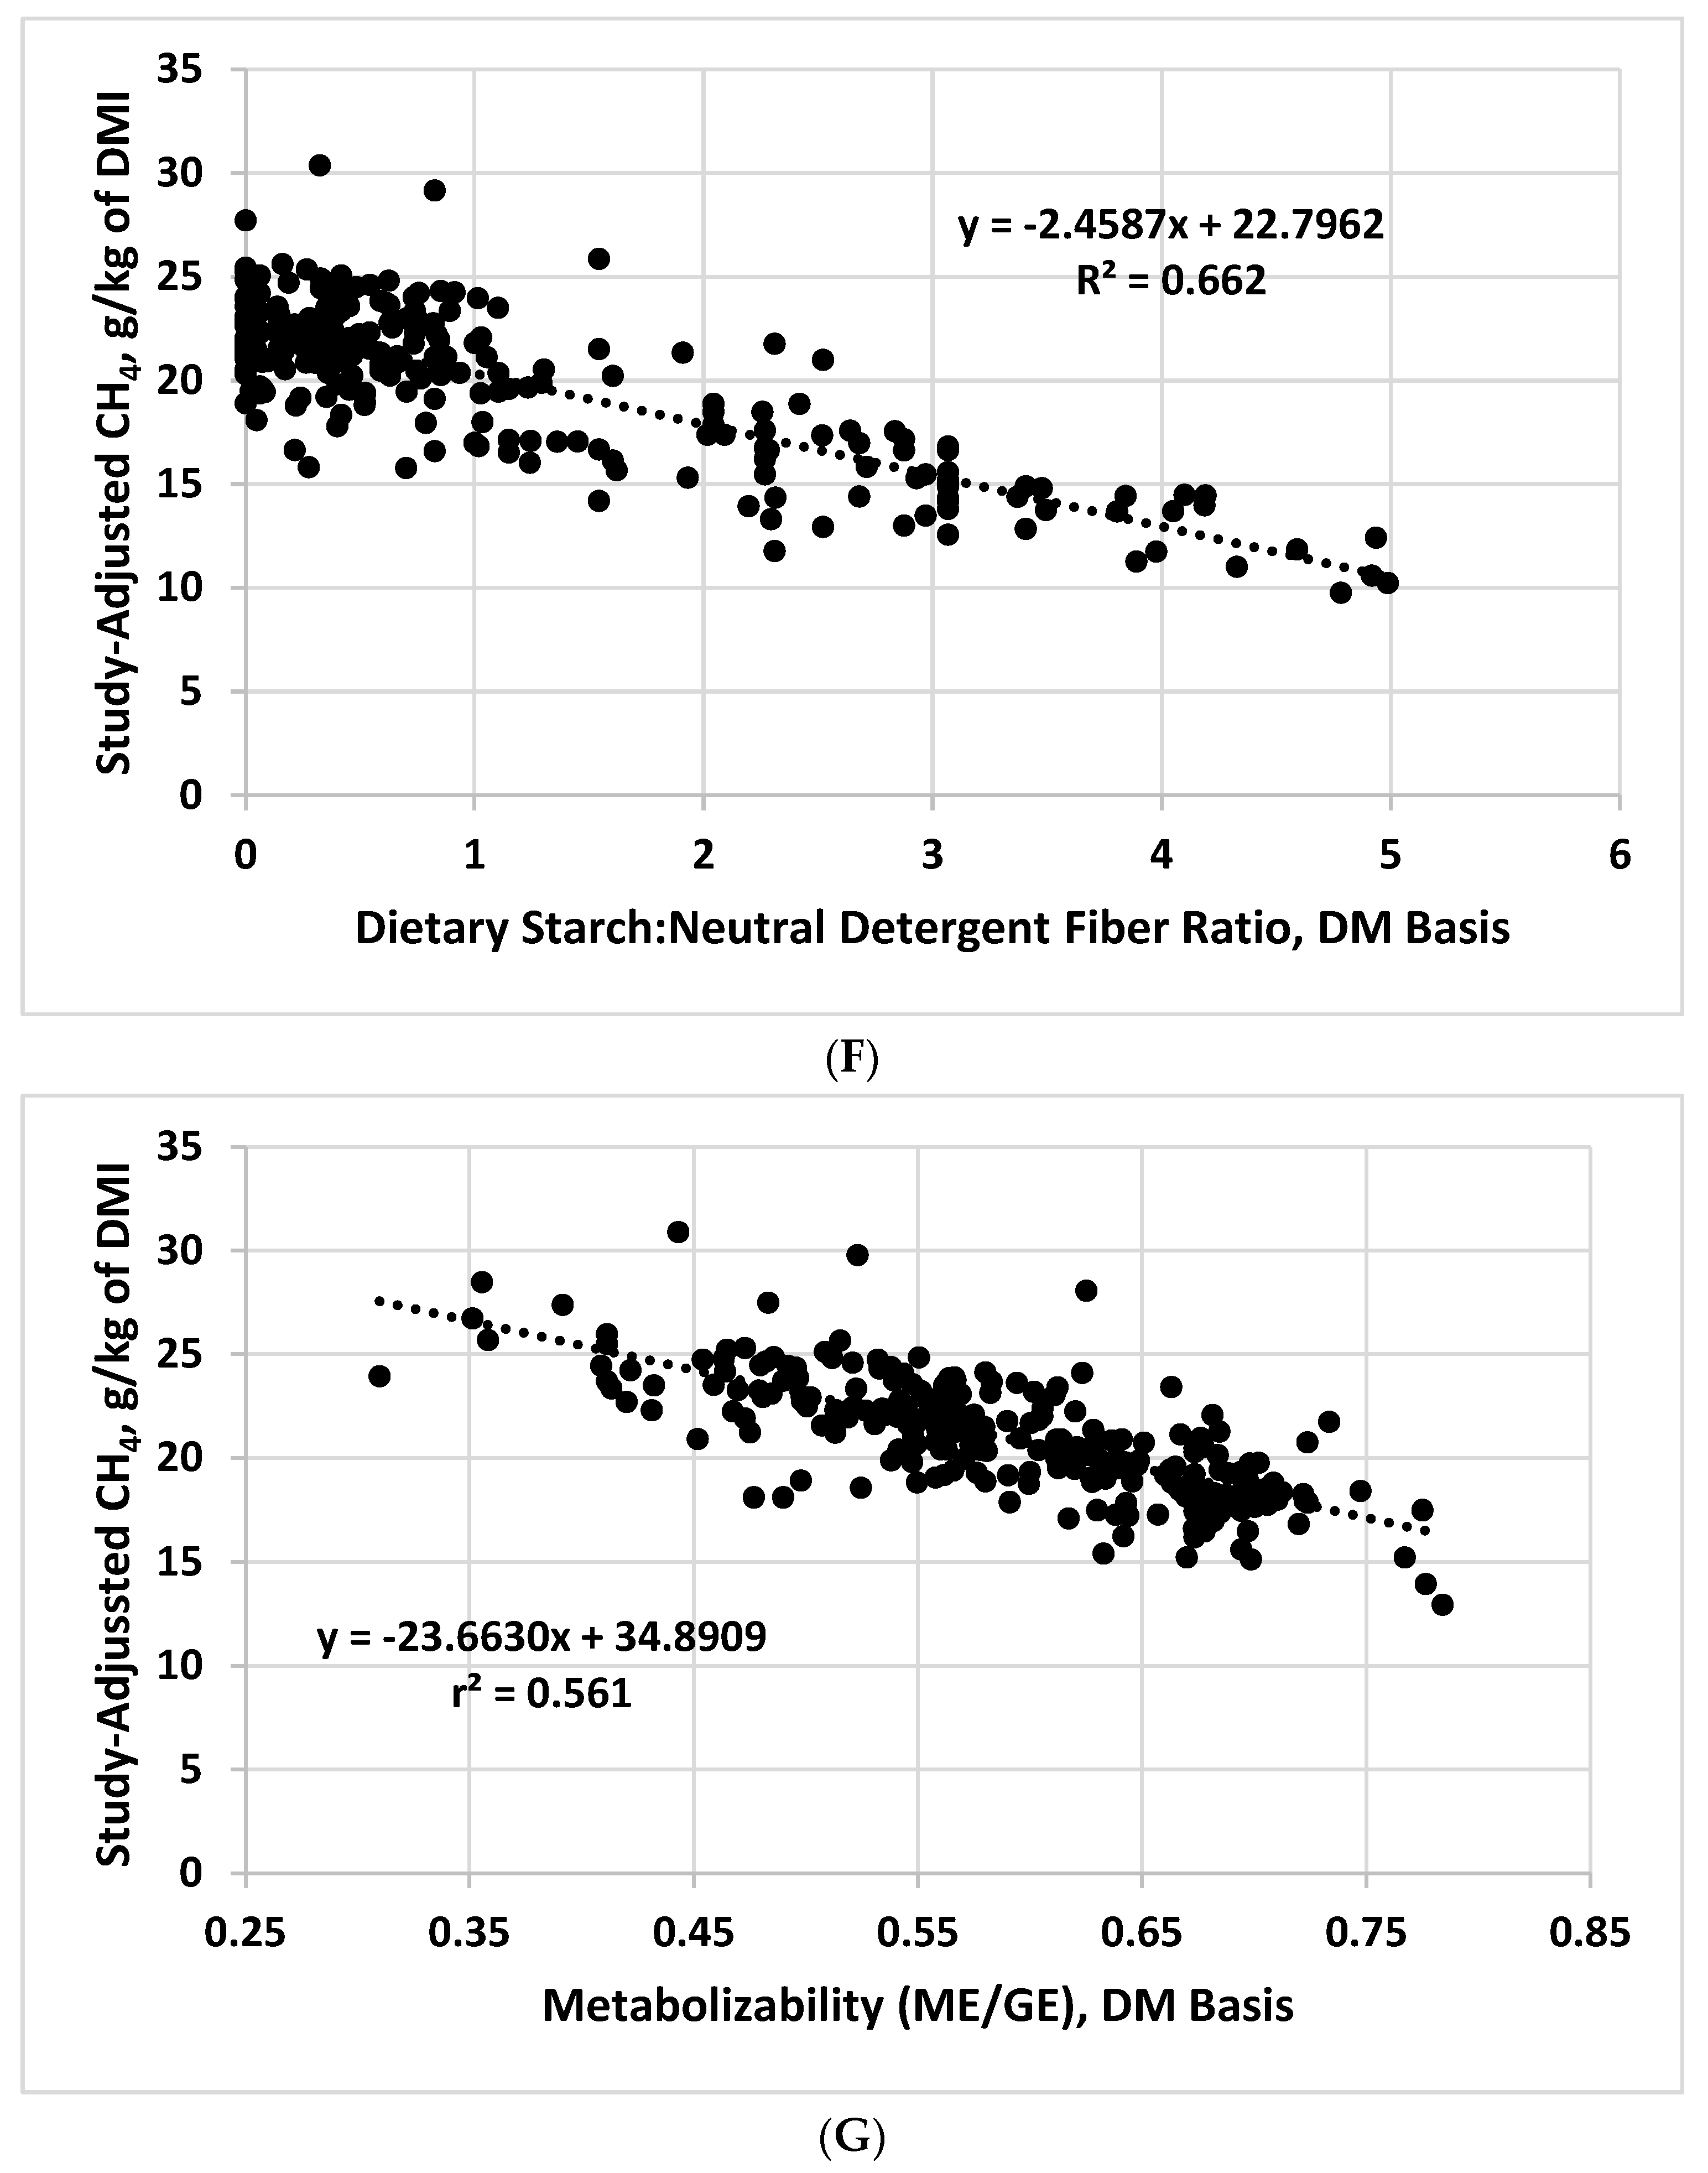
Using the development dataset and testing derived prediction equations with the evaluation dataset, Galyean and Hales [5] reported that the starch:NDF ratio was selected in a stepwise regression to predict CH4 yield over the individual values of starch and NDF. Use of the ratio, with or without dietary EE concentration, resulted in r2 values when applied to the evaluation dataset that ranged from 0.73 to 0.77. Thus, we expected that when evaluated in the combined dataset, the starch:NDF ratio would be among dietary variables that are the most highly related to CH4 yield. The average starch:NDF ratio in the combined dataset was 1.14, with a range of 0 to 4.99. Although the relationship was relatively strong (Figure 1F), the r2 for the regression of CH4 yield on the starch:NDF ratio was less (0.662) than the r2 for dietary NDF concentration alone (0.696; Table 1). These results suggest that the dietary starch:NDF ratio might not offer major advantages in predicting CH4 yield compared with dietary NDF concentration, but current analyses do not consider associations among dietary constituents that might affect their predictive ability.
As noted previously, direct measures of GE and ME were available for all values in the combined dataset. The resulting metabolizabililty values in the combined dataset averaged 0.59, with a range 0.31 to 0.78. Yan et al. [22] had previously demonstrated a significant relationship between metabolizability and CH4 yield; thus, we also evaluated this relationship (Table 1; Figure 1G). Indeed, the r2 value of 0.561 for the regression of CH4 yield on metabolizabity was indicative of a strong relationship, suggesting that it could be a useful component of prediction equations for CH4 yield. Whether tabular values of metabolizability for feedstuffs would have a similar relationship as the directly measured values in our dataset will need to be evaluated.
3.2. Managing Methane through Feeding Intake Management Strategies
Energy requirements of ruminant livestock are sufficiently well defined to allow “programming” of DMI to meet the needs for a given level of production. Because of the importance of DMI as a driver of enteric CH4 production, the use of restricted feeding to limit over consumption or programmed feeding to achieve a particular rate of body weight gain for feedlot beef cattle might offer a potential avenue for the feedlot industry to decrease CH4 production [23]. In addition to decreasing enteric CH4, feeding management approaches that decrease DMI would be expected to decrease fecal output, thereby also decreasing CH4 losses via manure [23]. Moreover, effects of decreasing DMI through feeding management should be additive with other CH4 mitigation approaches such as feed additives that inhibit methanogenesis. Nonetheless, for feedlot cattle, decreasing DMI also carries a risk of extending the days on feed to reach a particular carcass weight and composition endpoint or negatively affecting meat quality indices like marbling. Such increases in the length of the feeding period or decreased product quality could affect the economics of production and potentially negate decreases in enteric and manure CH4 production associated with management of feed intake, requiring careful evaluation of this approach as a CH4 mitigation strategy. An alternative to managing DMI as a mitigation strategy would be the selection of more efficient animals (e.g., cattle with low residual feed intake) [24]. Unfortunately, in the commercial feedlot industry the genetic background of growing and finishing cattle is rarely known, and there is no practical tool for quickly determining residual feed intake. Thus, an approach based on genetic selection for greater efficiency to decrease CH4 will require a long-term commitment by the seedstock industry to include measures such as residual feed intake and CH4 yield in selection indices.
Opportunities to modify CH4 through management of DMI in lactating dairy cattle are likely more limited than for feedlot cattle. Feeding higher concentrate diets could decrease CH4 production in lactating dairy cows, both through altered ruminal fermentation shifting metabolic hydrogen away from CH4 and through decreased DMI needed to maintain desired production levels. Nonetheless, decreasing the level of NDF from roughage to allow for lower DMI would likely have a negative effect on milk quality, specifically milk fat content and would possibly have negative effects on animal health through an increased risk of acidosis, rumenitis, and systemic inflammation [24,25,26]. Thus, although management of DMI to lower CH4 production offers possibilities in lactating dairy cows, it would need to be combined with other dietary formulation and feed additive strategies for successful application in practice.
3.3. Applications to Diet Formulation for Mitigation of Methane Emissions
Based on the results of our regression analyses discussed previously, the key dietary factors to consider in formulation strategies to decrease enteric CH4 production would be concentrations of NDF, starch, and diet metabolizability, with dietary EE concentration being of lesser importance and dietary CP concentration having virtually no effect. Practically, these key factors are often interrelated in terms of diet formulation. Mixed diets with decreased NDF concentration often have increased starch concentration (i.e., a decreased forage and increased grain), which also results in an increased ME concentration and thereby increased metabolizability. For confined cattle fed mixed diets, changing the forage:concentrate ratio is widely recognized as a feasible CH4 mitigation strategy [24]. Nonetheless, changes in these key factors can occur in all types of ruminant diets and production situations and are not always a function of the forage-to-concentrate ratio.
With all-forage diets for example, a variety of factors affect NDF concentration, including forage type and maturity. More digestible forages decreased CH4 yield in dairy cattle and sheep, but effects were less clear for beef cattle [27]. Nonetheless, increased forage quality generally decreases CH4 production per unit of animal product because DMI and animal production typically increase as forage quality increases [24]. Increased digestibility of higher-quality forages also would be expected to decrease manure CH4 losses. Type of forage can be important, as greater CH4 yield was reported for C4 vs. C3 grasses and warm-season legumes [28]. Accordingly, any approach that increases forage quality, including type of forage, grazing management, harvesting forage at earlier maturities, and forage processing that increases digestibility would be expected to affect CH4 yield, but more data are needed to accurately predict responses.
As noted previously, feeding diets with a greater concentration of starch is a repeatable approach to decrease CH4 yield and should also decrease CH4 associated with manure. Starch generally decreases enteric CH4 because methanogens are sensitive to low ruminal pH [29] and feeding starch results in a lower ruminal pH than feeding all-forage diets [15]. Even so, Beauchemin et al. [24] observed that the global capacity to increase grain feeding to ruminants is limited, so using increased dietary starch as a mitigation tool is limited to production systems in which grains are normally fed at high levels. Grain type (e.g., horny vs. floury endosperm) also can affect starch digestion [30], with lesser starch digestion with a greater proportion of horny endosperm, although steam flaking can offset the negative effects of endosperm type [30]. Heat and moisture processing methods like steam flaking increase gelatinization of starch and increase the ruminal proportion of propionate and decrease ruminal pH, thereby decreasing CH4 yield [30,31].
Although adding dietary fat sources has been extensively studied as a tool for decreasing CH4 yield [24], and our regression analyses showed a negative relationship between dietary EE concentration and CH4 yield, the relationship was highly variable and of low predictive value. With potential negative effects of fat on fiber digestion noted previously, as well as relatively high cost of fat sources, careful consideration should be given to the total concentration of fat in the diet, as well as to the sources of fat added to the diet.
It should be noted that for practical implementation of any dietary formulation approach to mitigate CH4 yield, feed mixing and delivery, as well as potential sorting of feed by animals are issues of concern. If diets are inadequately mixed, thereby resulting in the consumption of feed with variable concentrations of particular nutrients, benefits of dietary mitigation strategies would be decreased. Similarly, diets or feeding practices that promote sorting of feed ingredients by groups of cattle could negate the effects of dietary management strategies. For example, based on our results, cattle that sort out ingredients with a greater NDF concentration would likely have increased CH4 yield compared with cattle that do not sort ingredients and consume something closer to the formulated diet.
4. Summary and Recommendations for Further Research
Our results support the important role of DMI as a driver of enteric CH4 production in cattle and other ruminant livestock. Among the dietary components we evaluated, concentrations of NDF and starch, as well as metabolizability of the diet were most strongly related to CH4 production per unit of DMI. To the extent possible within a particular production system, formulating diets to lower concentrations of NDF and increasing starch and metabolizablity of the diet would be expected to decrease CH4 yield. Careful attention to feed mixing and delivery practices to ensure consumption of diets with uniform nutrient concentrations is necessary for diet formulation strategies to be effective. Managing DMI by programmed feeding to achieve a particular body weight gain or small restrictions in feed intake to prevent over consumption also could offer opportunities to decrease enteric CH4 production, but care must be taken not to negatively affect animal growth and product quality. Overall, formulation approaches combined with practices that manage DMI could yield practically relevant decreases in CH4 production when applied to intensive cattle production systems. Moreover, these practices should be additive to other mitigation strategies such as feed additives that decrease CH4 production.
Author Contributions
Conceptualization, M.L.G. and K.E.H.; Writing, review, and editing, M.L.G. and K.E.H.; Statistical analyses, M.L.G. All authors have read and agreed to the published version of the manuscript.
Funding
This contribution received no external funding.
Institutional Review Board Statement
Not applicable. The study did not involve the use of live animals.
Informed Consent Statement
Not applicable.
Data Availability Statement
The data used for analyses reported in this article have been previously published online as noted in the text.
Conflicts of Interest
The authors declare no conflicts of interest.
References
- United States Department of Agriculture—Economic Research Service (USDA-ERS). Sector at a Glance. 2021. Available online: https://www.ers.usda.gov/topics/animal-products/cattle-beef/sector-at-a-glance/ (accessed on 19 October 2023).
- Environmental Protection Agency (EPA). Draft Inventory of U.S. Greenhouse Gas Emissions and Sinks: 1990–2016; U.S. Environmental Protection Agency: Durham, NC, USA, 2018. Available online: https://www.epa.gov/sites/production/files/2018-01/documents/2018_complete_report.pdf (accessed on 15 March 2022).
- McAllister, T.A.; Newbold, C.J. Redirecting rumen fermentation to reduce methanogenesis. Aust. J. Exp. Agric. 2008, 48, 7–13. [Google Scholar] [CrossRef]
- Hales, K.E.; Coppin, C.A.; Smith, Z.K.; McDaniel, Z.S.; Tedeschi, L.O.; Cole, N.A.; Galyean, M.L. Predicting metabolizable energy from digestible energy for growing and finishing beef cattle and relationships to the prediction of methane. J. Anim. Sci. 2022, 100, skac013. [Google Scholar] [CrossRef] [PubMed]
- Galyean, M.L.; Hales, K.E. Prediction of methane per unit of dry matter intake in growing and finishing cattle from the ratio of dietary concentrations of starch to neutral detergent fiber alone or in combination with dietary concentration of ether extract. J. Anim. Sci. 2022, 100, skac243. [Google Scholar] [CrossRef] [PubMed]
- National Academies of Sciences, Engineering, and Medicine (NASEM). Nutrient Requirements of Beef Cattle, 8th rev. ed.; National Academies Press: Washington, DC, USA, 2016. [Google Scholar]
- Littell, R.C.; Milliken, G.A.; Stroup, W.W.; Wolfinger, R.D.; Schabenberger, O. SAS for Mixed Models, 2nd ed.; SAS Institute Inc.: Cary, NC, USA, 2006. [Google Scholar]
- Galyean, M.L.; Tedeschi, L.O. Predicting microbial protein synthesis in beef cattle: Relationship to intakes of total digestible nutrients and crude protein. J. Anim. Sci. 2014, 92, 5099–5111. [Google Scholar] [CrossRef]
- Ellis, J.L.; Kebreab, E.; Odongo, N.E.; McBride, B.W.; Okine, E.K.; France, J. Prediction of methane production from dairy and beef cattle. J. Dairy Sci. 2007, 90, 3456–3467. [Google Scholar] [CrossRef]
- van Lingen, H.J.; Niu, M.; Kebreab, E.; Valadares Filho, S.C.; Rooke, J.A.; Duthie, C.-A.; Schwarm, A.; Kreuzer, M.; Hynd, P.I.; Caetano, M.; et al. Prediction of enteric methane production, yield and intensity of beef cattle using an intercontinental database. Agric. Ecosyst. Environ. 2019, 283, 106575. [Google Scholar] [CrossRef]
- Ribeiro, R.S.; Rodrigues, J.P.P.; Maurício, R.M.; Borges, A.L.C.C.; Reis e Silva, R.; Berchielli, T.T.; Valadares Filho, S.C.; Machado, F.S.; Campos, M.M.; Ferreira, A.L.; et al. Predicting enteric methane production from cattle in the tropics. Animal 2020, 14, s438–s452. [Google Scholar] [CrossRef]
- Marumo, J.L.; Laierre, P.A.; Van Amburgh, M.E. Enteric methane emissions prediction in dairy cattle and effects of monensin on methane emissions: A meta-analysis. Animals 2023, 13, 1392. [Google Scholar] [CrossRef]
- Jennings, J.S.; Meyer, B.E.; Guiroy, P.J.; Cole, N.A. Energy costs of feeding excess protein from corn-based by-products to finishing cattle. J. Anim. Sci. 2018, 96, 653–669. [Google Scholar] [CrossRef]
- Ortigues, I.; Smith, T.; Gill, M.; Cammell, S.B.; Yarrow, N.W. The effect of fishmeal supplementation of a straw-based diet on growth and calorimetric efficiency of growth in heifers. Br. J. Nutr. 1990, 64, 639–651. [Google Scholar] [CrossRef]
- Beauchemin, K.A.; Kreuzer, M.; O’Mara, F.; McAllister, T.A. Nutritional management for enteric methane abatement: A review. Aust. J. Exp. Agric. 2008, 48, 21–27. [Google Scholar] [CrossRef]
- Beauchemin, K.A.; McGinn, S.M.; Petit, H.V. Methane abatement strategies for cattle: Lipid supplementation of diets. Can. J. Anim. Sci. 2007, 87, 431–440. [Google Scholar] [CrossRef]
- Reynolds, C.K.; Tyrrell, H.F.; Reynolds, P.J. Effects of diet forage-to-concentrate ratio and intake on energy metabolism in growing beef heifers: Whole body energy and nitrogen balance and visceral heat production. J. Nutr. 1991, 121, 994–1003. [Google Scholar] [CrossRef] [PubMed]
- Fuller, A.L.; Wickersham, T.A.; Sawyer, J.E.; Freetly, H.C.; Brown-Brandl, T.M.; Hales, K.E. The effects of the forage-to-concentrate ratio on the conversion of digestible energy to metabolizable energy in growing beef steers. J. Anim. Sci. 2020, 98, skaa231. [Google Scholar] [CrossRef] [PubMed]
- Ungerfeld, E.M. Metabolic hydrogen flows in rumen fermentation: Principles and possibilities of interventions. Front. Micrbiol. 2020, 11, 589. [Google Scholar] [CrossRef] [PubMed]
- Bas, P.; Archimede, H.; Rouzeau, A.; Sauvant, D. Fatty acid composition of mixed-rumen bacteria: Effect of concentration and forage type. J. Dairy Sci. 2003, 86, 2940–2948. [Google Scholar] [CrossRef]
- Hackman, T.J.; Firkins, J.L. Maximizing efficiency of rumen microbial protein production. Front. Microbiol. 2015, 6, 465. [Google Scholar] [CrossRef] [PubMed]
- Yan, T.; Porter, M.G.; Mayne, C.S. Prediction of methane emission from beef cattle using data measured in indirect open-circuit respiration calorimeters. Animal 2009, 3, 1455–1462. [Google Scholar] [CrossRef]
- Galyean, M.L.; Hales, K.E. Feeding management strategies to mitigate methane and improve production efficiency of feedlot cattle. Animals 2023, 13, 758. [Google Scholar] [CrossRef]
- Beauchemin, K.A.; Ungerfeld, E.M.; Eckard, R.J.; Wang, M. Review: Fifty years of research on rumen methanogenesis: Lessons learned and future challenges for mitigation. Animal 2020, 14, s2–s16. [Google Scholar] [CrossRef] [PubMed]
- Haque, M.N. Dietary manipulation: A sustainable way to mitigate methane emissions from ruminants. J. Anim. Sci. Technol. 2018, 60, 15. [Google Scholar] [CrossRef] [PubMed]
- Krogstad, K.C.; Bradford, B.J. Does feeding starch contribute to the risk of systemic inflammation in dairy cattle? JDS Comm. 2023, 4, 14–18. [Google Scholar] [CrossRef] [PubMed]
- Eugene, M.; Klumpp, K.; Sauvant, D. Methane mitigating options with forages fed to ruminants. Grass Forage Sci. 2021, 76, 196–204. [Google Scholar] [CrossRef]
- Archimède, H.; Eugène, M.; Marie Magdeleine, C.; Boval, M.; Martin, C.; Morgavi, D.P.; Lecomtec, P.; Doreau, M. Comparison of methane production between C3 and C4 grasses and legumes. Anim. Feed Sci. Technol. 2011, 166–167, 59–64. [Google Scholar] [CrossRef]
- Van Kessel, J.A.S.; Russell, J.B. The effect of pH on ruminal methanogens. FEMS Microbiol. Ecol. 1996, 20, 205–210. [Google Scholar] [CrossRef]
- Corona, L.; Owens, F.N.; Zinn, R.A. Impact of corn vitreousness and processing on site and extent of digestion by feedlot cattle. J. Anim. Sci. 2006, 84, 3020–3031. [Google Scholar] [CrossRef]
- Hales, K.E.; Cole, N.A.; McDonald, J.C. Effects of corn processing method and dietary inclusion of wet distillers grains with solubles on energy metabolism, carbon-nitrogen balance, and methane emissions of cattle. J. Anim. Sci. 2012, 90, 3174–3185. [Google Scholar] [CrossRef]
Figure 1.
Relationships between study-adjusted enteric methane production (g/d or g/kg of dry matter intake) and dry matter intake DMI; (A), dietary crude protein (B), ether extract (C), neutral detergent fiber (D), starch (E), starch:neutral detergent fiber ratio (F), and diet metabolizability (metabolizable energy/gross energy; (G) developed from a literature database.


Table 1.
Relationships between study-adjusted enteric methane production (g/d) and dry matter intake (DMI) and methane production expressed as g/kg of DMI and various dietary chemical components and diet metabolizability developed from a literature database 1.
Table 1.
Relationships between study-adjusted enteric methane production (g/d) and dry matter intake (DMI) and methane production expressed as g/kg of DMI and various dietary chemical components and diet metabolizability developed from a literature database 1.
| Regression Coefficients | Regression Statistics | |||
|---|---|---|---|---|
| Item 2 | Intercept | Slope | RMSE | r2 |
| ---- CH4, g/d ---- | ||||
| Dry matter intake, kg/d | 26.0477 | 15.3710 | 13.96 | 0.821 |
| p-values 3 | <0.001 | <0.001 | CV = 11.39% | |
| Lower 95% CI | 20.2892 | 14.4950 | ||
| Upper 95% CI | 31.8062 | 16.2470 | ||
| ---- CH4, g/kg of DMI ---- | ||||
| Crude protein, % | 20.2005 | −0.0344 | 2.53 | 0.003 |
| p-values 3 | <0.001 | 0.381 | CV = 12.82% | |
| Lower 95% CI | 19.0317 | −0.1115 | ||
| Upper 95% CI | 21.3694 | 0.0428 | ||
| Ether extract, % | 22.2295 | −0.5871 | 2.31 | 0.150 |
| p-values 3 | <0.001 | <0.001 | CV = 11.57 | |
| Lower 95% CI | 21.5201 | −0.7577 | ||
| Upper 95% CI | 22.9390 | −0.4165 | ||
| Neutral detergent fiber, % | 13.5959 | 0.2001 | 2.02 | 0.696 |
| p-values 3 | <0.001 | <0.001 | CV = 9.65 | |
| Lower 95% CI | 12.9563 | 0.1840 | ||
| Upper 95% CI | 14.2355 | 0.2162 | ||
| Starch, % | 23.4214 | −0.1060 | 2.04 | 0.495 |
| p-values 3 | <0.001 | <0.001 | CV = 9.89 | |
| Lower 95% CI | 22.9950 | −0.1191 | ||
| Upper 95% CI | 23.8478 | −0.0929 | ||
| Starch:neutral detergent fiber ratio | 22.7962 | −2.4587 | 2.18 | 0.662 |
| p-values 3 | <0.001 | <0.001 | CV = 10.91 | |
| Lower 95% CI | 22.4363 | −2.6730 | ||
| Upper 95% CI | 23.1561 | −2.2444 | ||
| Metabolizability | 34.8909 | −23.6630 | 1.84 | 0.561 |
| p-values 3 | <0.001 | <0.001 | CV = 8.80 | |
| Lower 95% CI | 33.3687 | −26.2140 | ||
| Upper 95% CI | 36.4131 | −21.1120 | ||
1 Data were adjusted for random intercepts and slopes associated with the 63 studies in the database. 2 Dietary chemical composition data were expressed on a dry matter basis. Metabolizability = metabolizable energy divided by gross energy. 3 Probability that the intercept and slopes differ from zero; CV = RMSE divided by the overall mean of dry matter intake, dietary chemical components, and metabolizability, expressed as a percent; r2 is not adjusted for the number of parameters in the model.
Disclaimer/Publisher’s Note: The statements, opinions and data contained in all publications are solely those of the individual author(s) and contributor(s) and not of MDPI and/or the editor(s). MDPI and/or the editor(s) disclaim responsibility for any injury to people or property resulting from any ideas, methods, instructions or products referred to in the content. |
© 2024 by the authors. Licensee MDPI, Basel, Switzerland. This article is an open access article distributed under the terms and conditions of the Creative Commons Attribution (CC BY) license (https://creativecommons.org/licenses/by/4.0/).
Share and Cite
MDPI and ACS Style
Galyean, M.L.; Hales, K.E. Relationships between Dietary Chemical Components and Enteric Methane Production and Application to Diet Formulation in Beef Cattle. Methane 2024, 3, 1-11. https://0-doi-org.brum.beds.ac.uk/10.3390/methane3010001
AMA Style
Galyean ML, Hales KE. Relationships between Dietary Chemical Components and Enteric Methane Production and Application to Diet Formulation in Beef Cattle. Methane. 2024; 3(1):1-11. https://0-doi-org.brum.beds.ac.uk/10.3390/methane3010001
Chicago/Turabian StyleGalyean, Michael L., and Kristin E. Hales. 2024. "Relationships between Dietary Chemical Components and Enteric Methane Production and Application to Diet Formulation in Beef Cattle" Methane 3, no. 1: 1-11. https://0-doi-org.brum.beds.ac.uk/10.3390/methane3010001