Project Report

Dielectrophoretic Particle Chromatography: From Batch Processing to Semi-Continuous High-Throughput Separation

1
Chemical Process Engineering, Faculty of Production Engineering, University of Bremen, 28359 Bremen, Germany
2
Center for Environmental Research and Sustainable Technology (UFT), University of Bremen, 28359 Bremen, Germany
3
School of Chemical and Bioprocess Engineering, University College Dublin, D04 V1W8 Dublin, Ireland
*
Author to whom correspondence should be addressed.
Submission received: 14 December 2023 / Revised: 25 January 2024 / Accepted: 30 January 2024 / Published: 6 February 2024

Abstract

:
The development of highly selective separation processes is a focus of current research. In 2016, the German Science Foundation funded a priority program SPP 2045 “MehrDimPart—highly specific multidimensional fractionation of fine particles with technical relevance” that aims to develop new or enhance existing approaches for the separation of nano- and micrometer-sized particles. Dielectrophoretic separators achieve highly selective separations of (bio-)particles in microfluidic devices or can handle large quantities when non-selective separation is sufficient. Recently, separator designs were developed that aim to combine a high throughput and high selectivity. Here, we summarize the development from a microfluidic fast chromatographic separation via frequency modulated dielectrophoretic particle chromatography (DPC) toward a macrofluidic high throughput separation. Further, we provide a starting point for future work by providing new experimental data demonstrating for the first time the trapping of 200 nm polystyrene particles in a dielectrophoretic high-throughput separator that uses printed circuit boards as alternatives for expensive electrode arrays.

1. Introduction

The selective separation of particles with respect to distinct properties can be performed by various methods, such as sieving, electrophoresis [1,2], filtration [3] or flotation [4,5]. However, particles can have multiple distributed properties such as size, electrical conductivity and/or shape, which can make separation challenging. The separation becomes even more difficult when it is to be conducted not with respect to only one property but several. This is a focus of current research, visible, for example, in the priority program SPP 2045 MehrDimPart—highly specific multidimensional fractionation of fine particles with technical relevance of the German Science Foundation.
Here, we summarize the development of one of its projects (Grant Numbers BA 1893/2-1, PE 3015/3-2). The introduction starts with the description of frequency-modulated particle chromatography, continues with the description of a high-throughput DEP separator based on printed circuit boards and closes with the presentation of a semi-continuous process for trapping DEP. Thus, the introduction provides an overview of the progress that has been achieved in this project. Additionally, as a starting point for future research, new experimental data are provided in the Results section of this report that evaluate the lower size limit of this specific printed circuit board (PCB) approach.
This manuscript focuses on techniques that utilize the dielectrophoretic force to manipulate microparticles. When a polarizable particle is subjected to an inhomogeneous electric field, a movement can be observed, which is called dielectrophoresis (DEP) [6]. Dielectrophoresis is currently mostly used to manipulate or analyze biological particles [7] such as cells [8,9,10], DNA [11] or proteins [12,13]. Here, microfluidic setups are mostly used as high electric field gradients required to generate sufficient DEP force. The magnitude of this force on a homogeneous and spherical particle can be calculated with the dipole approximation [6]
F DEP = 2 π r p 3 ε m Re ( C M ) | E rms | 2 .
The force is proportional to the radius of the particle r p to the power of three and thus depends on the volume of a particle. However, the direction of the movement due to DEP is the result of the gradient of the electric field E rms squared and the real part of the Clausius–Mossotti factor Re ( C M ) . This factor can be calculated as [6]
Re ( C M ) = Re ε ˜ p ε ˜ m ε ˜ p + 2 ε ˜ m
and can also be referred to as the effective polarizability. It reflects the direction of the dipole that forms when a particle in the medium is subjected to an electric field. It depends on the complex permittivity ε ˜ of the particle (index p) and the surrounding medium (index m). The complex permittivity can be calculated by the conductivity of a material σ , the permittivity ε and the angular frequency ω = 2 π f of the applied electric field by [6]
ε ˜ = ε 0 ε r i σ ω
with ε 0 being the permittivity of the vacuum and ε r the relative permittivity of the material ( ε = ε 0 ε r ). The dielectrophoretic force is an attractive force when the Re ( C M ) is positive. This is called positive dielectrophoresis (pDEP) and particles are directed toward local field maxima. In contrast, when Re ( C M ) is negative, the particles are repulsed from the local maxima of the electric field. This is termed negative dielectrophoresis (nDEP). The DEP force can change its sign when changing the frequency because the complex permittivity is frequency-dependent (Equation (3)). By selecting a suitable frequency, this can enable a separation of mixtures.
Frequency-modulated dielectrophoretic particle chromatography (DPC) was developed and investigated first on the microfluidic scale [14,15]. A photograph of a DPC channel is shown in Figure 1 (small chip). DPC takes advantage of the transition from pDEP to nDEP of particles by periodically changing the frequency between two values in a continuous manner. In our experiments, these cycles had a period of around 3 s. Details on the procedure can be found in References [14,15]. Briefly, DPC works by injecting a mixture of particles into a laminar carrier flow in microchannels and then applying a periodic frequency sweep. When a particle changes from pDEP to nDEP, or vice versa, in the applied frequency range, it can show three different patterns of movement. First, when the particle shows pDEP and nDEP for a similar amount of time, the particle will oscillate around its initial position and experiences only a slight retardation with respect to experiments without an electric field applied (Figure 2A, orange particle). However, if either pDEP or nDEP are dominating the movement of the particle, the particle will be directed toward the electrodes (pDEP-dominated, Figure 2A, blue particle) or the ceiling (nDEP-dominated, Figure 2A, purple particle). The laminar flow profile and trapping of the particles lead to a retardation of the particles with respect to the fluid. The aim of this procedure is to achieve a rapid chromatographic separation of the particles.
DPC requires that particles have a transition from pDEP to nDEP within the applied frequency range. A transition from nDEP to pDEP can be observed, for example, for cells [17], semi-conducting carbon nanotubes [18] or polystyrene (PS) particles [15]. Proof-of-principle experiments with PS particles showed that DPC is capable of achieving rapid (below 100 s) separation of micrometer-sized particles depending on their polarizability as shown in Figure 3A [14]. Here, 3 µm particles showed a pDEP-dominated migration pattern, whereas the 6 µm particles showed a balanced pDEP/nDEP movement when the frequency-modulated electric field was applied, which allowed chromatographic separation [14]. In a subsequent study [15], the separation of 2 µm and 3 µm PS particles with DPC was demonstrated. However, more importantly, it was shown by systematic variation in the frequency range that the different migration patterns (balanced, pDEP- and nDEP-dominated) actually exist and that they can be simulated and matched with experiments. It was also shown that even without a significant size difference, PS particles can be separated due to their surface modification alone (Figure 3B). Surface modifications lead to diverging surface conductance of the two particles, which directly influences the crossover frequency.
The DPC setup is microfluidic and has similarities to the well-established (dielectrophoretic) field-flow fractionation [19,20,21] and other frequency sweep-based DEP separations [22,23]. DPC also inherits drawbacks of these techniques such as the low sample volume/throughput, expensive channels and electrodes, and the missing concepts for further scaling aside from numbering up. To be more specific, the throughput of DPC is limited as the flow rates are only a few mL/h and particles are not continuously entering the channel but are injected into the carrier flow. The electrodes are manufactured by using standard clean-room techniques, which allow low electrode dimensions but are expensive to manufacture or buy. Additionally, we observed during our experiments that the microfluidic device is easily clogged by dust or PDMS residues due to the low height of the channel (80 µm).
Figure 3. (A) Proof-of-principle experiments of the dielectrophoretic particle chromatography (DPC). Without applied voltage (A1), 3 and 6 µm polystyrene (PS) particles elute at the same time. When a frequency-modulated sinusoidal signal is applied (A2), the residence time of the 3 µm particles is significantly enlarged resulting in a chromatographic separation. (B) Chromatographic separation of two equally sized PS particles according to their surface functionalization by using DPC. (C) Size-dependent collection rate (“signal reduction”) of two types of graphite (Actilion, KS6) and lithium iron phosphate particles in the PCB setup at various frequencies at 6 mL/min and 30 Vpp. This figure is remixed and modified based on figures previously published in Ref. [14] (panel (A1,A2)), Ref. [15] (panel (B)) and Ref. [24] (panel (C)).
Powders 03 00005 g003
To address these drawbacks of DPC, a modification of the setup and the operational procedure was necessary. The electric field generated over electrode arrays, as they are used in many DEP separators, decreases drastically with distance to the electrodes. This limits the channel dimension orthogonal to the electrodes (height). We successfully tested in a series of publications [16,24,25] low-cost custom-designed PCBs as an approach to scale up DEP separators based on electrode arrays. In the current configuration, the device features two PCBs with dimensions of 45 × 150 mm that face each other (Figure 1). The PCBs have electrodes patterned on them with a width and spacing of 250 µm. The channel is formed by using a manually cut 0.5 mm thick silicone gasket and placing it in between the PCBs. This channel can handle significantly higher volume flows and was successfully tested for micrometer-sized particles up to 10 mL/min. However, it was not possible to maintain the frequency-modulated DPC as an operating principle in this setup because DPC requires high voltages. The high voltages would result in high currents drawn from the amplifier that is used to generate the electric field. As the electrode arrays are significantly bigger in the PCB setup, which can be clearly seen in Figure 1, the current becomes a limiting factor. At the low medium conductivity used here, no substantial Joule heating is expected or observed. At a higher conductivity, however, Joule heating can lead to bubble formation inside the channel. Consequently, the operational procedure was changed to a fixed frequency approach, which also allows addressing particles that show no crossover from pDEP to nDEP as conductors or isolating particles. At a fixed frequency, particles have more time to migrate toward the electrodes and thus lower voltages are sufficient. The migration patterns of particles in the PCB approach are visible in Figure 2B.
In a first study [16], the performance of the PCB-based device was evaluated. Particles ranging from 500 nm to 6 µm were successfully trapped inside the channel. Further, selective trapping was shown by using two differently sized PS particles at a frequency of 100 kHz where one 3 µm PS particles showed pDEP and 6 µm particles showed nDEP. In a subsequent study, a step toward real-world application was undertaken. Therein [24], electrode materials from lithium-ion batteries, namely lithium-ion phosphate and graphite particles, were sorted according to their size. We demonstrated the size selectivity of the device and its applicability for conductive particles as shown in Figure 3C. In a recent publication [25], the influence of the particle concentration was investigated for graphite particles. It was shown that, depending on the particle size, it is possible to process concentrations of up to 800 mg/L.
Furthermore, a concept was presented and tested that allows semi-continuous processes [25]. This concept is based on the parallelization of two identical PCB setups (e.g., Figure 1) by using two four-way valves that are actuated by stepper motors and relays that switch the voltage off and on. The device is controlled by an Arduino Uno. Details on the semi-continuous setup can be found in Ref. [
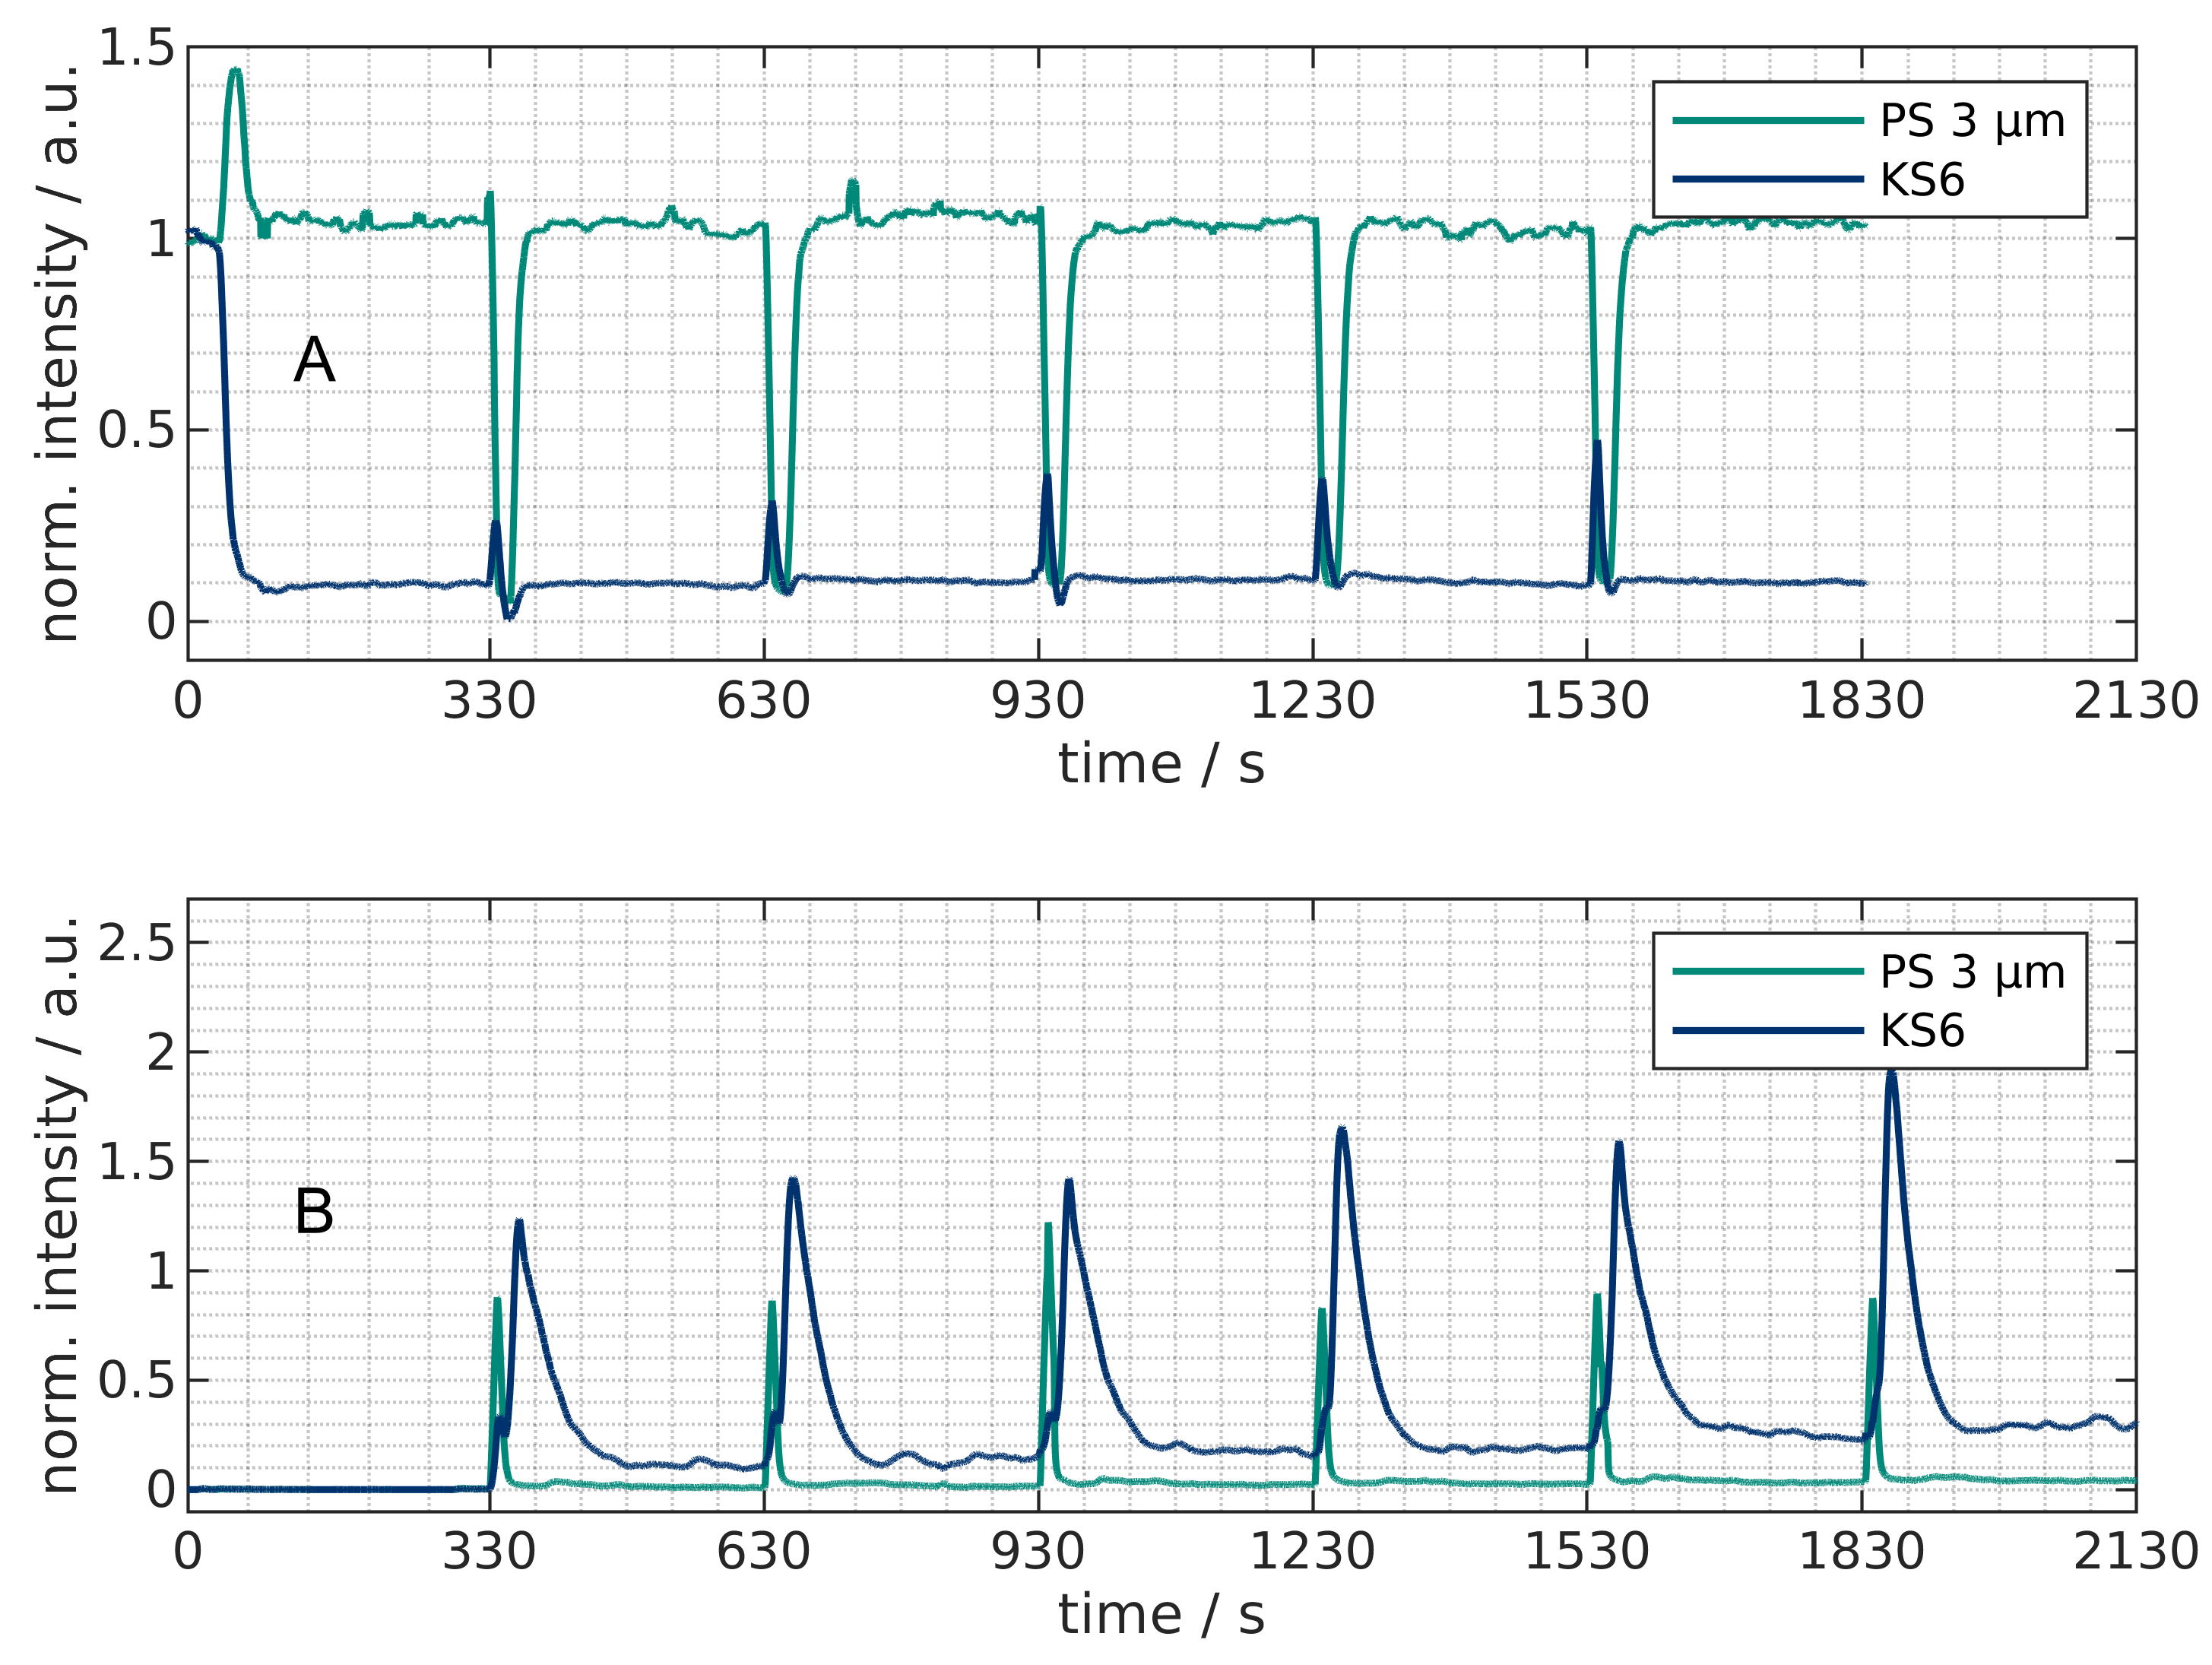
25]. This setup contains two outlets, one for nDEP particles and one for pDEP particles. The key result is reprinted in Figure 4. Here, the reflection intensities over time at the two outlets for two particles are displayed: 3 µm PS particles, which show nDEP at the selected process parameters, and KS6 graphite particles, which are highly conductive and show pDEP. The nDEP outlet (Figure 4A), as expected, is dominantly reached by PS particles. In contrast, at the pDEP outlet (Figure 4B), the peaks for the KS6 graphite particles are much more pronounced. In contrast to previous experiments, in the semi-continuous operation mode, two fractions are obtained and collected. Additionally, less human interaction is required, as a microcontroller now regulates the applied voltage and volume flow. Again, details on the results and the origin of the spikes are provided in Ref. [25]. Summarizing, this semi-continuous process allows particles to be processed at a volume flow about a hundred times higher than in the microfluidic setup used for DPC (5 mL/h compared to up to 600 mL/h).
To pave the way for future projects, we want to provide further insights into the capabilities of the PCB-based setup. In previous studies, voltages up to 75 V pp and particles with sizes as low as 500 nm were tested in a PCB-based setup [16]. Using an amplifier capable of supplying higher voltages at the required currents should allow smaller particles to be addressed. In our previous work [16], 500 nm PS particles were removed to about 80% at 1 mL/min in a PCB-based setup. In this study, 500 nm PS particles are tested again for comparison along with 200 nm and 100 nm particles at flow rates of 1 mL/min, 2 mL/min and 4 mL/min. The aim of this study is to investigate the lower size limit of this PCB-based setup.

2. Materials and Methods

The setup and operational procedure are published elsewhere in detail [16,24]. In the following, a brief overview is provided to guide the reader through the study.

2.1. PCB Channel

The PCB-based setup is shown in Figure 1 and consists of two PCBs with outer dimensions of 45 × 150 mm. Electrode arrays are manufactured on these PCBs with an electrode width and spacing of 250 µm. The PCBs were designed by the authors and manufactured by JLCPCB JiaLIChing (Hong Kong) Co., Ltd., Hong Kong, China. The inlet of the separator is connected to a piston pump (MFLX78018-60, VWR International GmbH, Darmstadt, Germany). The channel is created by adding a 0.5 mm thick silicone gasket in between the two PCBs.

2.2. Particles and Medium

The PS particles (Fluoresbrite YG, Polysciences Europe GmbH, Hirschberg, Germany) are fluorescently labeled but do not have a surface functionalization. The diameters of the particles are 500 nm, 200 nm and 100 nm. All particles were suspended in a low conductive medium ( σ m = 1.1 µS/cm) containing 0.01 % Tween 20 and 4 µM KOH to reduce particle adhesion. The conductivity was adjusted by adding KCl. For all particles, 40 µL of particle stock suspension (particle content 2.5 vol.%) per 500 mL of medium were added.

2.3. Measurement and Data Processing

The outlet of the separator is connected to a flow cuvette (176-765-14485-40, Hellma GmbH & Co. KG, Müllheim, Germany) to which a white light source (XCite 120 PC, Excelitas Technologies Corp., Waltham, MA, USA) is linked via a liquid light guide (LLG). At 90 with respect to the LLG, a light guide leads to a UV-VIS-NIR spectrometer (Silver nova, StellarNet, Inc., Tampa, FL, USA). Prior to the light guide, a triple-bandpass filter (DAPI/FITC/TRITC) is placed.
The spectrometer data are recorded by a LabVIEW program and further evaluated by in-house developed Matlab scripts. The background signal is subtracted from all obtained data and the data are smoothed using moving average algorithms for evaluation. The trapping efficiency was calculated as mean signal reduction between t = 250 s and t = 300 s. All measurement data from these experiments were uploaded to an online repository for public access [26].

2.4. Experimental Procedure

Before the experiments with particles present, the background signal of a blank solution was evaluated for 60 s. In the first 30 s of the experiment, the inlet concentration was recorded to determine the trapping efficiency later on. For all experiments, a signal of 170 Vpp at 300 kHz was applied starting at 30 s until 300 s. The nominal flow rates of 1 mL/min, 2 mL/min or 4 mL/min were applied during the first 300 s of the experiment. After 300 s, the flow rate was changed to 10 mL/min to enhance particle remobilization. Higher flow rates lead to a higher shear rate and drag force on the particle and thus facilitate particle release from the electrodes. Without an increased flow rate, the release can take as long as the trapping duration itself or even longer. All experiments were repeated three times, and the provided values are mean values of three experiments and their standard deviation.
The electrical signal to generate the voltage at the electrodes is produced by a signal generator (Rigol DG4062, Rigol Technologies EU GmbH, Gilching, Germany), increased by an amplifier (A1020-75-400, Dr. Hubert GmbH, Gilching, Germany) and monitored with a power analyzer (PPA1510, Newtons4th Ltd., Leicester, UK).

3. Results and Discussion

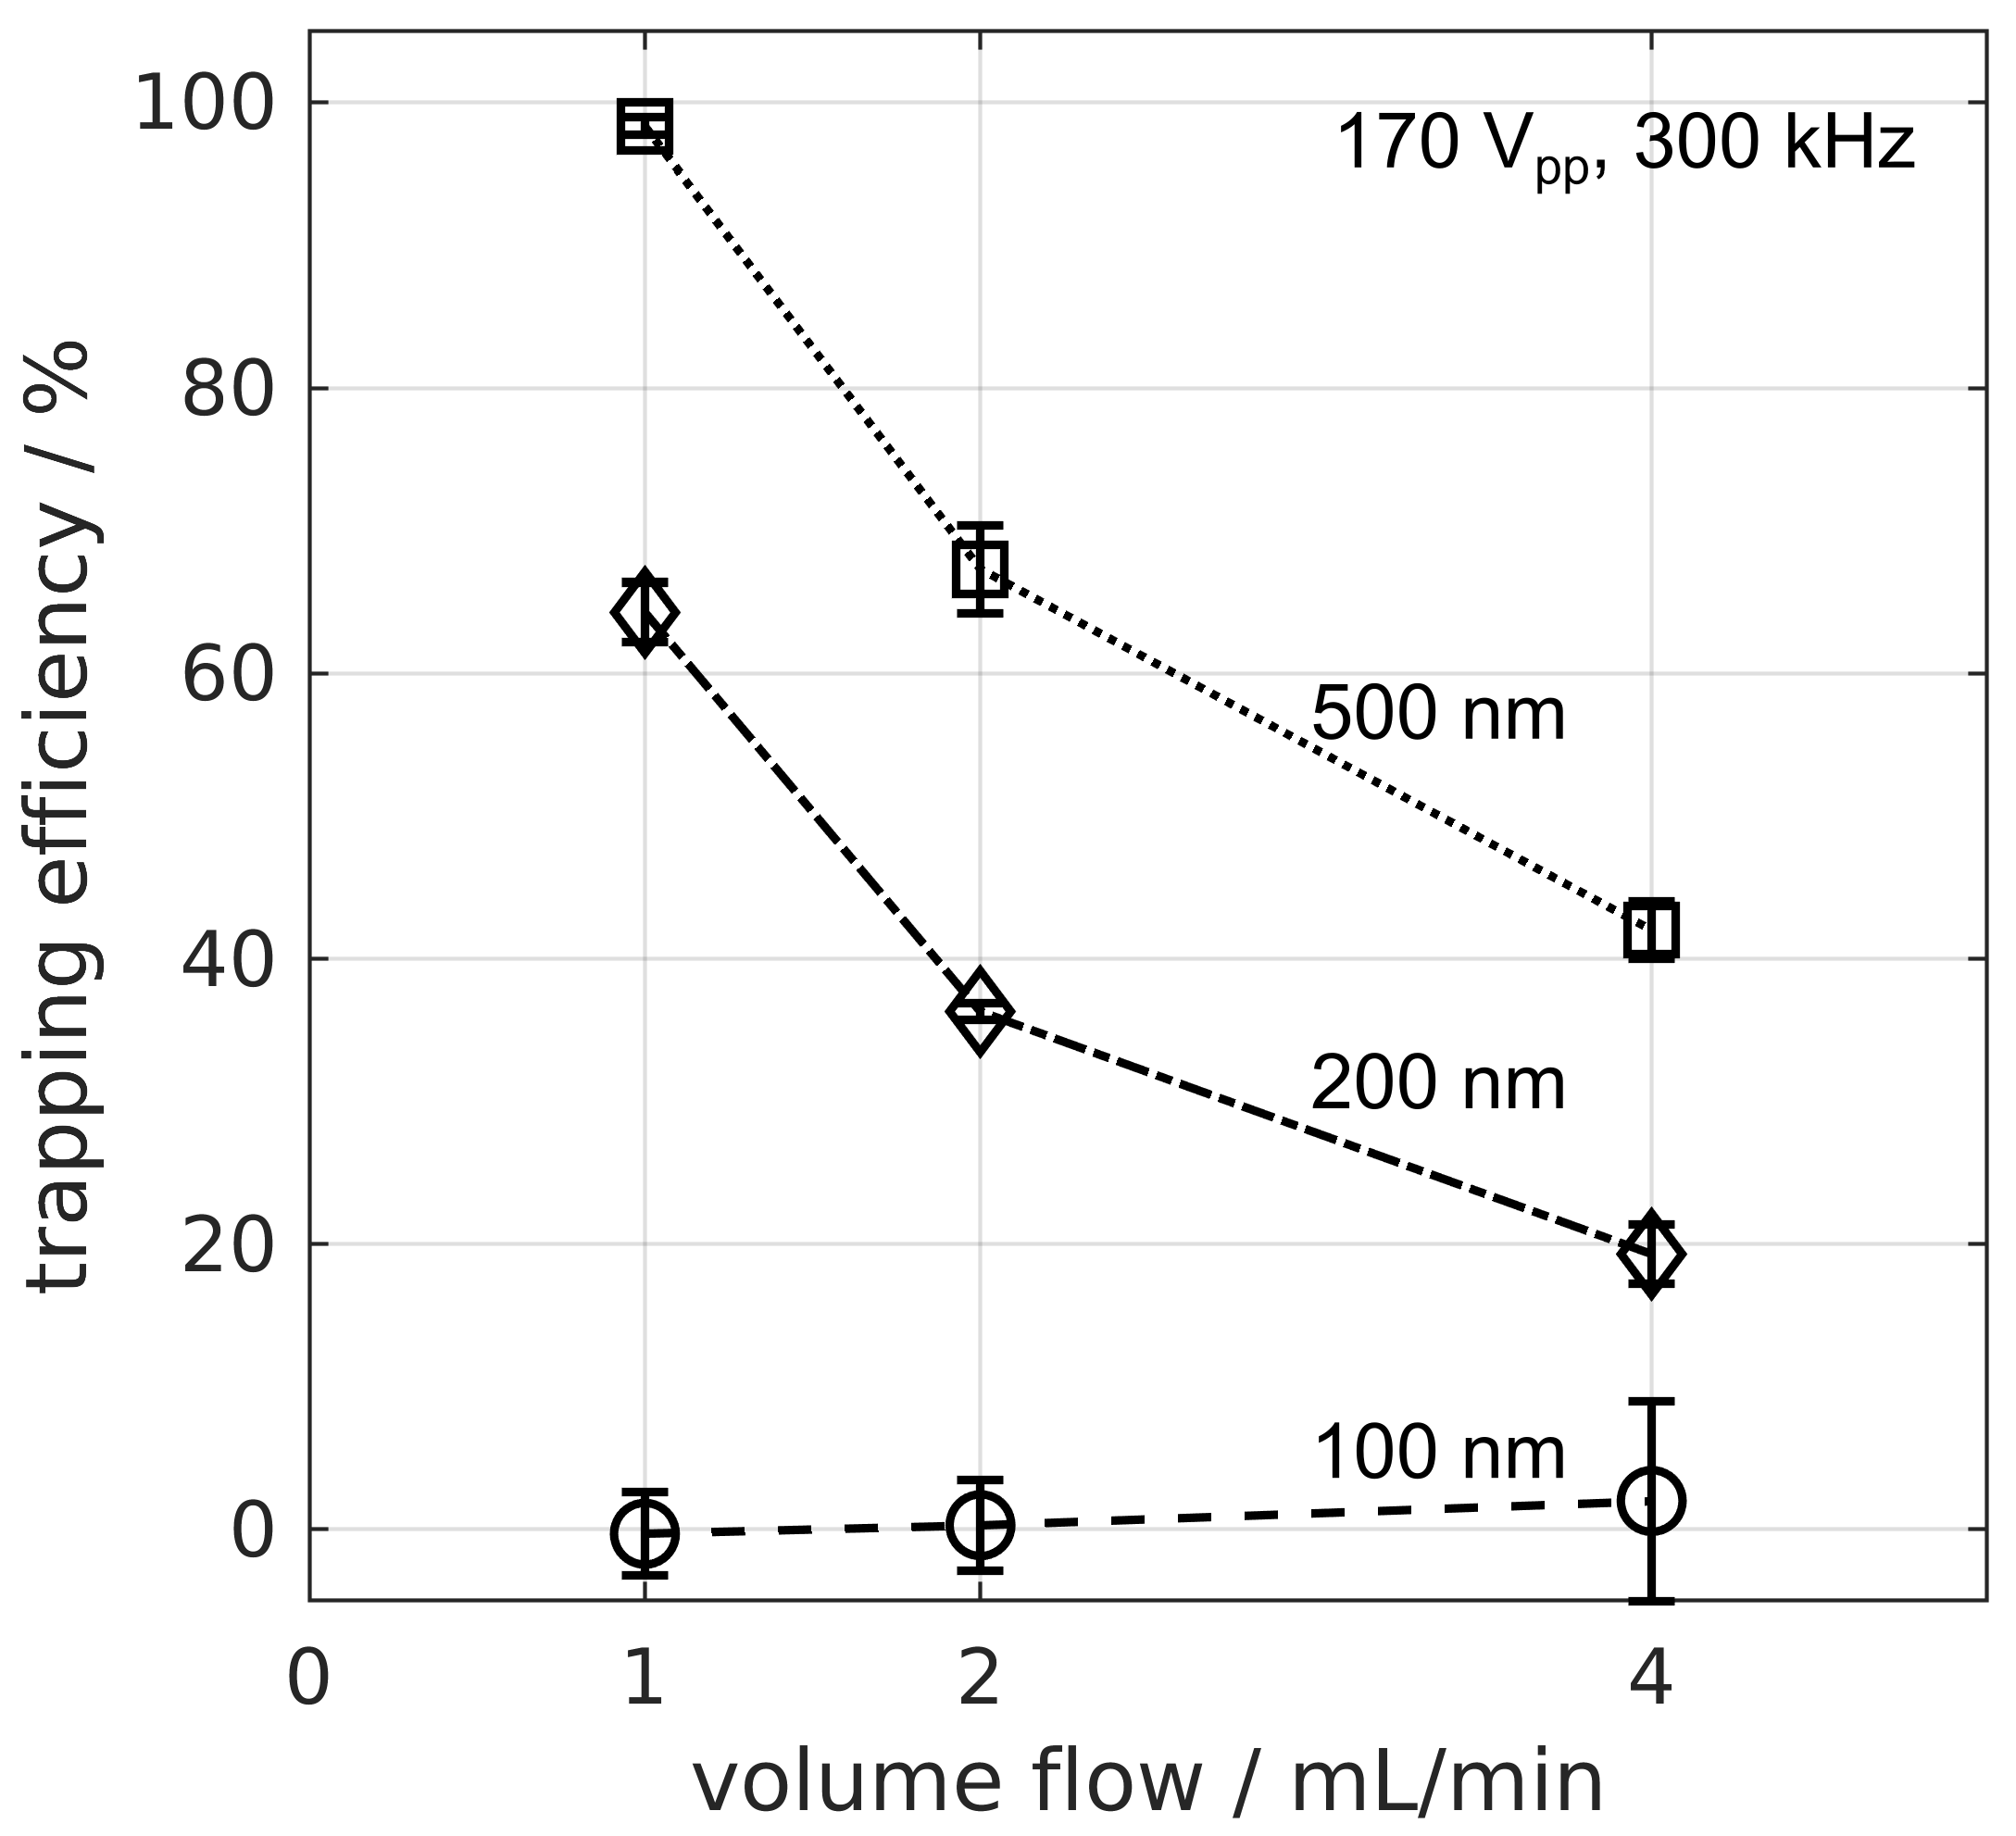
The results are displayed in Figure 5. For the 500 nm particles, a complete removal was measured for a volume flow of 1 mL/min ( 98.3 ± 0.6 % ). With an increasing flow rate, the trapping reduced to 67.3 ± 3.1 % at 2 mL/min and 42 ± 2 % at 4 mL/min.
In comparison to the results published in Ref. [16], increasing the voltage (here, 170 Vpp vs. there, 75 Vpp) led to a higher trapping rate of the 500 nm particles of roughly 20% at all flow rates. Following Equation (1), the DEP force increases with electric field magnitude and thus the higher trapping rate is not surprising. The 20% increase is lower than expected, at least for 2 mL/min and 4 mL/min, as the applied voltage is more than doubled. However, the results in Ref. [16] were obtained at a different frequency (15 kHz vs. 300 kHz in this study). A frequency of 300 kHz was selected in this study because of two reasons. First, the selected amplifier is built to amplify signals with a frequency of 100 kHz to 400 MHz, and thus, 15 kHz is out of specification. Second, we observed in our previous study that higher frequencies [24] are beneficial for trapping. The reason behind this is currently not fully understood but reproducible. Frequencies even higher than the selected 300 kHz can lead to a crossover from pDEP to nDEP of the 500 nm particles and thus are not suitable for trapping experiments. Thus, 300 kHz was selected as a compromise. However, 300 kHz could already lead to a decreased Re ( C M ) of the 500 nm particles. Another reason for the lower than expected trapping might be due to the increasing current flowing at higher voltages and thus higher thermal movement that can reduce trapping. In our experiments, we measured a current of about 1 A. Nonetheless, the recorded trapping is higher than before and complete removal of these 500 nm particles could be observed for 1 mL/min.
The 200 nm particles were tested in the PCB separator for the first time. As their volume is approx. 15 times smaller compared to the 500 nm particles, a much more reduced trapping is expected. However, the recorded values for 200 nm are 64.3 ± 2.1 % (1 mL/min), 36.3 ± 0.6 (2 mL/min) and 19.3 ± 2.1 % (4 mL/min). These are lower compared to the trapping of the 500 nm particles but higher than could be expected. The nominal radii of the particles are increased by the thickness of the double layer, which likely decreases the net size difference and leads to the increased trapping. For our suspension, we calculated a Debye length of around 133 nm for the particles, which is already in the size range of the nanoparticles (see Appendix A), supporting our statement. In total, it is possible to retain the majority of the 200 nm particles inside the channel at 1 mL/min and at a reduced efficiency at higher flow rates. For the PCB setup, this is the lowest recorded particle size that could be trapped.
Finally, 100 nm particles were tested in the channel. As can be seen from Figure 5, we could not trap the particles at the selected process parameters. Here, hindering effects such as Brownian motion, fluid drag or thermal movement likely outweigh DEP. As the electrical conductivity is low in these experiments, significant Joule heating is not expected in the bulk; however, close to the electrodes where high field strength is generated, local temperature gradients could arise and lead to additional fluid movement.
To finally determine the lower size limit of particles that can be trapped in this setup, future investigations are required. There, the influence of the particle size, particle material, electric field frequency and voltage should be investigated in detail. This, however, is beyond the scope of this project and this study.

4. Conclusions

Within this project, the novel approach of frequency-modulated dielectrophoretic particle chromatography was developed and used to separate particles according to their effective polarizability [14]. Further, the process could be simulated and the proposed migration patters of the particles validated [15]. Subsequently, a setup was developed that could not only drastically increase the volumetric throughput but also reduce the costs by using custom-designed PCBs as electrode arrays [16]. This setup was then successfully tested with battery grade graphite and lithium iron phosphate particles [24]. By implementing a semi-continuous approach and investigating the effect of particle concentration, the throughput could be further increased in a follow-up study [25].
As a starting point for future studies, the PCB-based setup was evaluated with regard to the trapping capabilities of 100 nm, 200 nm and 500 nm sized PS particles to provide a starting point for future projects. The 100 nm particles could not be retained in the channel at the selected process parameters, but the majority of 200 nm and 500 nm particles were trapped inside the channel when applying an electric field and a flow rate of 1 mL/min. At 1 mL/min, a trapping rate of 64.3 ± 2.1 % for the 200 nm and an almost complete removal of the 500 nm PS particles were observed. Summarizing, the results of these two projects (Grant Numbers BA 1893/2-1, PE 3015/3-2) contribute to the overall aim of the priority program SPP 2045 to develop new and enhance existing approaches for highly selective multidimensional particle separation.

Author Contributions

Conceptualization: G.R.P., M.B., J.T. and J.G.; methodology, all authors; software, L.W. and J.G.; data curation, J.G.; writing—original draft preparation, J.G.; writing—review and editing, all authors.; visualization, J.G.; supervision, G.R.P., M.B. and J.T.; project administration, G.R.P. and M.B.; funding acquisition, J.T., G.R.P. and M.B. All authors have read and agreed to the published version of the manuscript.

Funding

The authors thank the German Research Foundation (DFG) within the priority program, “MehrDimPart—Highly specific and multidimensional fractionation of fine particle systems with technical relevance” (SPP2045, Grant Numbers BA 1893/2-1, PE 3015/3-2, TH 893/20-2) for funding.

Institutional Review Board Statement

Not applicable.

Informed Consent Statement

Not applicable.

Data Availability Statement

All new measurement data that are included in this publication have been uploaded to an online repository [26] along with MATLAB scripts to evaluate the data and generate the plots of this study.

Acknowledgments

The authors would like to thank Rafael Reusz (University Bremen) for his assistance in the laboratory.

Conflicts of Interest

The authors declare no conflicts of interest.

Abbreviations

The following abbreviations are used in this manuscript:
DEPDielectrophoresis
DPCDielectrophoretic particle chromatography
LLGLiquid light guide
nDEPNegative dielectrophoresis
PCBPrinted circuit board
pDEPPositive dielectrophoresis
PSPolystyrene

Appendix A. Calculation of the Debye length

The Debye length κ 1 of a medium can be calculated using ([27], p. 114)
κ 1 = ε k B T 2 e 2 z 2 n 1 2
where k B is the Boltzmann constant, T the temperature, e the elementary charge, z the valence of the ions and n their number concentration in the bulk of the medium. Assuming a 5.3 µM concentration of ions (4 µM KOH and 1.3 µM KCl) of a monovalent salt ( z = 1 ), this yields a Debye length of 133 nm.

References

  1. Barasinski, M.; Garnweitner, G. Restricted and Unrestricted Migration Mechanisms of Silica Nanoparticles in Agarose Gels and Their Utilization for the Separation of Binary Mixtures. J. Phys. Chem. 2020, 124, 5157–5166. [Google Scholar] [CrossRef]
  2. Ashrafizadeh, S.N.; Seifollahi, Z.; Ganjizade, A.; Sadeghi, A. Electrophoresis of Spherical Soft Particles in Electrolyte Solutions: A Review. Electrophoresis 2020, 41, 81–103. [Google Scholar] [CrossRef]
  3. Liu, R.; Wang, L.; Yang, L.; Liu, Q.; Gao, Y.; Ye, J.; Xiao, J.; Hu, Q.; Zhang, X. Ultrafiltration and Microfiltration Membrane Performance, Cleaning, and Flux Recovery for Microalgal Harvesting. J. Appl. Phycol. 2020, 32, 3101–3112. [Google Scholar] [CrossRef]
  4. Vanderbruggen, A.; Hayagan, N.; Bachmann, K.; Ferreira, A.; Werner, D.; Horn, D.; Peuker, U.; Serna-Guerrero, R.; Rudolph, M. Lithium-Ion Battery Recycling-Influence of Recycling Processes on Component Liberation and Flotation Separation Efficiency. ACS ES&T Eng. 2022, 2, 2130–2141. [Google Scholar] [CrossRef]
  5. Vanderbruggen, A.; Salces, A.; Ferreira, A.; Rudolph, M.; Serna-Guerrero, R. Improving Separation Efficiency in End-of-Life Lithium-Ion Batteries Flotation Using Attrition Pre-Treatment. Minerals 2022, 12, 72. [Google Scholar] [CrossRef]
  6. Pethig, R. Review Article—Dielectrophoresis: Status of the Theory, Technology, and Applications. Biomicrofluidics 2010, 4, 022811. [Google Scholar] [CrossRef]
  7. Pesch, G.R.; Du, F. A Review of Dielectrophoretic Separation and Classification of Non-biological Particles. Electrophoresis 2021, 42, 134–152. [Google Scholar] [CrossRef] [PubMed]
  8. Liu, N.; Lin, Y.; Peng, Y.; Xin, L.; Yue, T.; Liu, Y.; Ru, C.; Xie, S.; Dong, L.; Pu, H.; et al. Automated Parallel Electrical Characterization of Cells Using Optically-Induced Dielectrophoresis. IEEE Trans. Autom. Sci. Eng. 2020, 17, 1084–1092. [Google Scholar] [CrossRef]
  9. Schor, A.R.; Buie, C.R. Rapid Fabrication of Three-Dimensional Structures for Dielectrophoretic Sorting of Lipid-Containing Organisms. J. Micromech. Microeng. 2016, 26, 105010. [Google Scholar] [CrossRef]
  10. Faraghat, S.A.; Fatoyinbo, H.O.; Hoettges, K.F.; Hughes, M.P. Low-Cost, High-Throughput and Rapid-Prototyped 3D-integrated Dielectrophoretic Channels for Continuous Cell Enrichment and Separation. Electrophoresis 2023, 44, 947–955. [Google Scholar] [CrossRef]
  11. Washizu, M.; Suzuki, S.; Kurosawa, O.; Nishizaka, T.; Shinohara, T. Molecular Dielectrophoresis of Biopolymers. IEEE Trans. Ind. Appl. 1994, 30, 835–843. [Google Scholar] [CrossRef]
  12. Pethig, R. Protein Dielectrophoresis: A Tale of Two Clausius-Mossottis—Or Something Else? Micromachines 2022, 13, 261. [Google Scholar] [CrossRef]
  13. Liu, Y.; Hayes, M.A. Orders-of-Magnitude Larger Force Demonstrated for Dielectrophoresis of Proteins Enabling High-Resolution Separations Based on New Mechanisms. Anal. Chem. 2021, 93, 1352–1359. [Google Scholar] [CrossRef] [PubMed]
  14. Giesler, J.; Pesch, G.R.; Weirauch, L.; Schmidt, M.P.; Thöming, J.; Baune, M. Polarizability-Dependent Sorting of Microparticles Using Continuous-Flow Dielectrophoretic Chromatography with a Frequency Modulation Method. Micromachines 2019, 11, 38. [Google Scholar] [CrossRef] [PubMed]
  15. Giesler, J.; Weirauch, L.; Thöming, J.; Baune, M.; Pesch, G.R. Separating Microparticles by Material and Size Using Dielectrophoretic Chromatography with Frequency Modulation. Sci. Rep. 2021, 11, 16861. [Google Scholar] [CrossRef] [PubMed]
  16. Giesler, J.; Weirauch, L.; Thöming, J.; Baune, M.; Pesch, G.R. High-Throughput Dielectrophoretic Separator Based on Printed Circuit Boards. Electrophoresis 2023, 44, 72–81. [Google Scholar] [CrossRef] [PubMed]
  17. Hoettges, K.F.; Henslee, E.A.; Torcal Serrano, R.M.; Jabr, R.I.; Abdallat, R.G.; Beale, A.D.; Waheed, A.; Camelliti, P.; Fry, C.H.; van der Veen, D.R.; et al. Ten–Second Electrophysiology: Evaluation of the 3DEP Platform for High-Speed, High-Accuracy Cell Analysis. Sci. Rep. 2019, 9, 19153. [Google Scholar] [CrossRef] [PubMed]
  18. Rabbani, M.T.; Sonker, M.; Ros, A. Carbon Nanotube Dielectrophoresis: Theory and Applications. Electrophoresis 2020, 41, 1893–1914. [Google Scholar] [CrossRef] [PubMed]
  19. Wang, X.B.; Yang, J.; Huang, Y.; Vykoukal, J.; Becker, F.F.; Gascoyne, P.R.C. Cell Separation by Dielectrophoretic Field-flow-fractionation. Anal. Chem. 2000, 72, 832–839. [Google Scholar] [CrossRef]
  20. Huang, Y.; Yang, J.; Wang, X.B.; Becker, F.F.; Gascoyne, P.R. The Removal of Human Breast Cancer Cells from Hematopoietic CD34+ Stem Cells by Dielectrophoretic Field-Flow-Fractionation. J. Hematother. Stem Cell Res. 1999, 8, 481–490. [Google Scholar] [CrossRef]
  21. Wang, X.B.; Vykoukal, J.; Becker, F.F.; Gascoyne, P.R. Separation of Polystyrene Microbeads Using Dielectrophoretic/Gravitational Field-Flow-Fractionation. Biophys. J. 1998, 74, 2689–2701. [Google Scholar] [CrossRef]
  22. Yang, J.; Huang, Y.; Wang, X.B.; Becker, F.F.; Gascoyne, P.R. Differential Analysis of Human Leukocytes by Dielectrophoretic Field-Flow-Fractionation. Biophys. J. 2000, 78, 2680–2689. [Google Scholar] [CrossRef] [PubMed]
  23. Modarres, P.; Tabrizian, M. Frequency Hopping Dielectrophoresis as a New Approach for Microscale Particle and Cell Enrichment. Sens. Actuators Chem. 2019, 286, 493–500. [Google Scholar] [CrossRef]
  24. Giesler, J.; Weirauch, L.; Rother, A.; Thöming, J.; Pesch, G.R.; Baune, M. Sorting Lithium-Ion Battery Electrode Materials Using Dielectrophoresis. ACS Omega 2023, 8, 26635–26643. [Google Scholar] [CrossRef] [PubMed]
  25. Giesler, J.; Weirauch, L.; Pesch, G.R.; Baune, M.; Thöming, J. Semi-Continuous Dielectrophoretic Separation at High Throughput Using Printed Circuit Boards. Sci. Rep. 2023, 13, 20696. [Google Scholar] [CrossRef]
  26. Giesler, J. Online Repository for: “Dielectrophoretic Particle Chromatography: From Batch Processing to Semi-Continuous High Throughput Separation”. 2023. [Google Scholar] [CrossRef]
  27. Masliyah, J.H.; Bhattacharjee, S. Electrokinetic and Colloid Transport Phenomena; Wiley-Interscience: Hoboken, NJ, USA, 2006. [Google Scholar]
Figure 1. (A) Photography of the two setups. At the bottom, the channel used for dielectrophoretic particle chromatography (DPC) experiments is shown. Here, electrodes are only present at the bottom and a polydimethylsiloxane (PDMS) channel is placed on the electrode array. The flow path of the medium is meandering and has a total length of 170 mm, a width of 2 mm and a height of 80 µm. In the upscaled setup, custom-designed printed circuit boards (PCBs) are used as electrodes at top and bottom of the channel. The PCBs have dimensions of 150 mm × 45 mm. A gasket (not shown) with a thickness of 0.5 mm is used as spacer to create the channel. (B) Photos obtained by digital microscopy of the electrode arrays of both setups. The electrodes on the PCBs are corrosion protected by hot air solder leveling (HASL). The width and spacing of the electrodes of the PCBs are 250 µm, whereas for DPC, 100 µm is used.
Powders 03 00005 g001
Figure 2. (A) Operating principle of dielectrophoretic particle chromatography (DPC). Particles are injected in a carrier flow, which allows a chromatographic separation. The frequency of the electric field is modulated and periodically changed between two values. This results in different migration patterns of microparticles depending on their polarizability. Particles within the carrier flow can be retarded due to showing either predominantly positive dielectrophoresis (pDEP) or negative dielectrophoresis (nDEP) within the applied frequency range. (B) The PCB approach features electrodes at top and bottom that repel particles that show nDEP from the electrodes. The particles continuously enter and leave the channel if they are not trapped by pDEP. This figure is remixed and modified based on figures previously published in Ref. [14] (panel (A)) and Ref. [16] (panel (B)).
Powders 03 00005 g002
Figure 4. Proof-of-principle experiment of the semi-continuous separation of KS6 graphite and 3 µm PS particles. Here, the setup features two outlets. One where mainly PS particles can be collected that show nDEP (A), whereas particles that show pDEP (KS6, graphite) accumulate in the other one (B). This figure was previously published in Ref. [25].
Powders 03 00005 g004
Figure 5. Evaluation of the lower size limit of the current configuration of the PCB-based separator. Fluorescent polystyrene particles (diameter 100 nm, 200 nm and 500 nm) in water with a conductivity of 1.1 µS/cm at three volume flows were investigated. Sinusoidal voltage of 170 Vpp at 300 kHz was applied to the electrode array. The error bars indicate the standard deviation calculated from three experiments.
Powders 03 00005 g005
Disclaimer/Publisher’s Note: The statements, opinions and data contained in all publications are solely those of the individual author(s) and contributor(s) and not of MDPI and/or the editor(s). MDPI and/or the editor(s) disclaim responsibility for any injury to people or property resulting from any ideas, methods, instructions or products referred to in the content.

