
Monitoring Aggregation Processes in Multiphase Systems: A Review


1
CERES, Chemical Engineering and Renewable Resources for Sustainability Research Center, Department of Chemical Engineering, University of Coimbra, Pólo II, R. Silvio Lima, 3030-790 Coimbra, Portugal
2
VTT Technical Research Centre of Finland Ltd., Koivurannantie 1, 40400 Jyväskylä, Finland
*
Author to whom correspondence should be addressed.
Powders 2024, 3(1), 77-110; https://0-doi-org.brum.beds.ac.uk/10.3390/powders3010007
Submission received: 4 December 2023
/
Revised: 6 March 2024
/
Accepted: 8 March 2024
/
Published: 14 March 2024
Abstract
:Particle aggregation is essential in many industrial processes, spanning the pharmaceutical and food industries, polymer production, and the environment, among others. However, aggregation can also occur, in some processes, as a non-desired side effect. Thus, to be able to monitor aggregation in industrial processes is of high importance to guarantee that the final, required product characteristics are obtained. In this paper, we present an extensive review of the different techniques available for monitoring particle characteristics in industrial processes involving particulate materials, with special emphasis on aggregation processes. These methods include both off-line and on-line techniques, based either on image acquisition techniques or different radiation scattering techniques (light-scattering and ultrasound spectroscopy). The principles behind each technique are addressed, together with their relevant applications, advantages, and disadvantages.
1. Introduction
Particle aggregation is a chemical–physical process present in many industrial sectors and procedures. Aggregation is an essential mechanism in processes such as spray drying, granulation, and flocculation, among others [1,2,3,4].
In the case of spray drying or granulation, one can find these processes in production sectors from the pharmaceutical industry [5], the food and detergent industries [6,7], polymer production [7], etc.
Flocculation, on the other hand, is an essential stage in papermaking production to guarantee the adequate retention of the filler and the adequate properties of the final product [8,9]. It is also relevant in the textile industry in the production of technical textiles [10], among others. In mineral processing in the mining industry, flocculation is also an essential stage [11]. Additionally, it is also a crucial stage in effluent treatments [12,13,14] in the primary treatment stage. Here, tuning the flocculation level is essential to guaranteeing the adequate efficiency of the effluent’s primary treatment.
However, aggregation can also occur as a non-desired side effect. This can be the case in crystallization processes [15,16] and in different particle production processes, such as nanoparticle and microparticle production processes, including grinding, coating, and encapsulation, among others [2,3]. Too strong flocculation may deteriorate the quality of the end product; this is the case, e.g., for paper that is made of cellulosic fibers [17], even when foam forming is used [18], and films made of cellulose microfibrils or nanofibrils (CMFs or CNFs) [19,20].
Thus, to be able to monitor the presence or development of aggregates in industrial processes is of high importance to guarantee that the required final product characteristics are obtained and, eventually, to be able to tune process conditions to guarantee that the objectives/characteristics previously defined are reached. Additionally, the pre-evaluation of aggregation in certain processes, based on preliminary lab tests, may be aimed at optimizing the dosage of additives, evaluating the rate of aggregation, or evaluating the properties of the aggregates obtained (size, strength, and structure), as has already been performed, for instance in flocculation processes [21,22,23]. Usually, aggregation can be described based on two parameters: the collision frequency and the collision efficiency [24], and preliminary tests may allow us to obtain information about those parameters [24,25,26].
In general, when speaking about monitoring aggregation processes, we are referring to both off-line and on-line techniques since both can be of high importance to guarantee the adequate performance of the process and that suitable final product characteristics are obtained. In the first case, off-line monitoring helps in pre-tuning the most favorable process operation conditions, while on-line monitoring contributes to adequate process control.
The monitoring of aggregation processes is a relatively new field that has been assuming increasing importance in recent years, with an increasing number of publications appearing in the literature either adapting already existing techniques or even presenting new ones.
Levente et al. (2015) [27] present a comprehensive review of the current trends in the field of process analytical technology (PAT), including PAT-based process monitoring and control strategies, stressing their importance and applications in industrial manufacturing, with a special focus on the pharmaceutical industry, but not exclusively.
Different techniques can be identified to monitor the kinetics of particle aggregation, which are based on different measuring principles. Those techniques can be classified into two groups: direct and indirect techniques. In the first group, we can include, essentially, techniques based on image acquisition. This is the case for in-line microscopy [28,29,30] and optical coherence tomography—OCT [31,32,33].
In the second group, we can mainly include techniques based on radiation scattering, such as laser diffraction spectroscopy—LDS [21,23,34]; focused beam reflectance measurement—FBRM [34,35,36], which has been widely used for flocculation monitoring [36,37]; and ultrasound doppler spectroscopy [38], all of which are the ones that have been most used.
In this review paper, we will describe the principles behind the different techniques discussed above, their advantages and disadvantages, and their relevant applications concerning aggregation monitoring as presented in the existing literature.
Mechanisms behind Aggregation Processes
Aggregation usually occurs as the result of orthokinetic aggregation caused by shear-induced collisions.
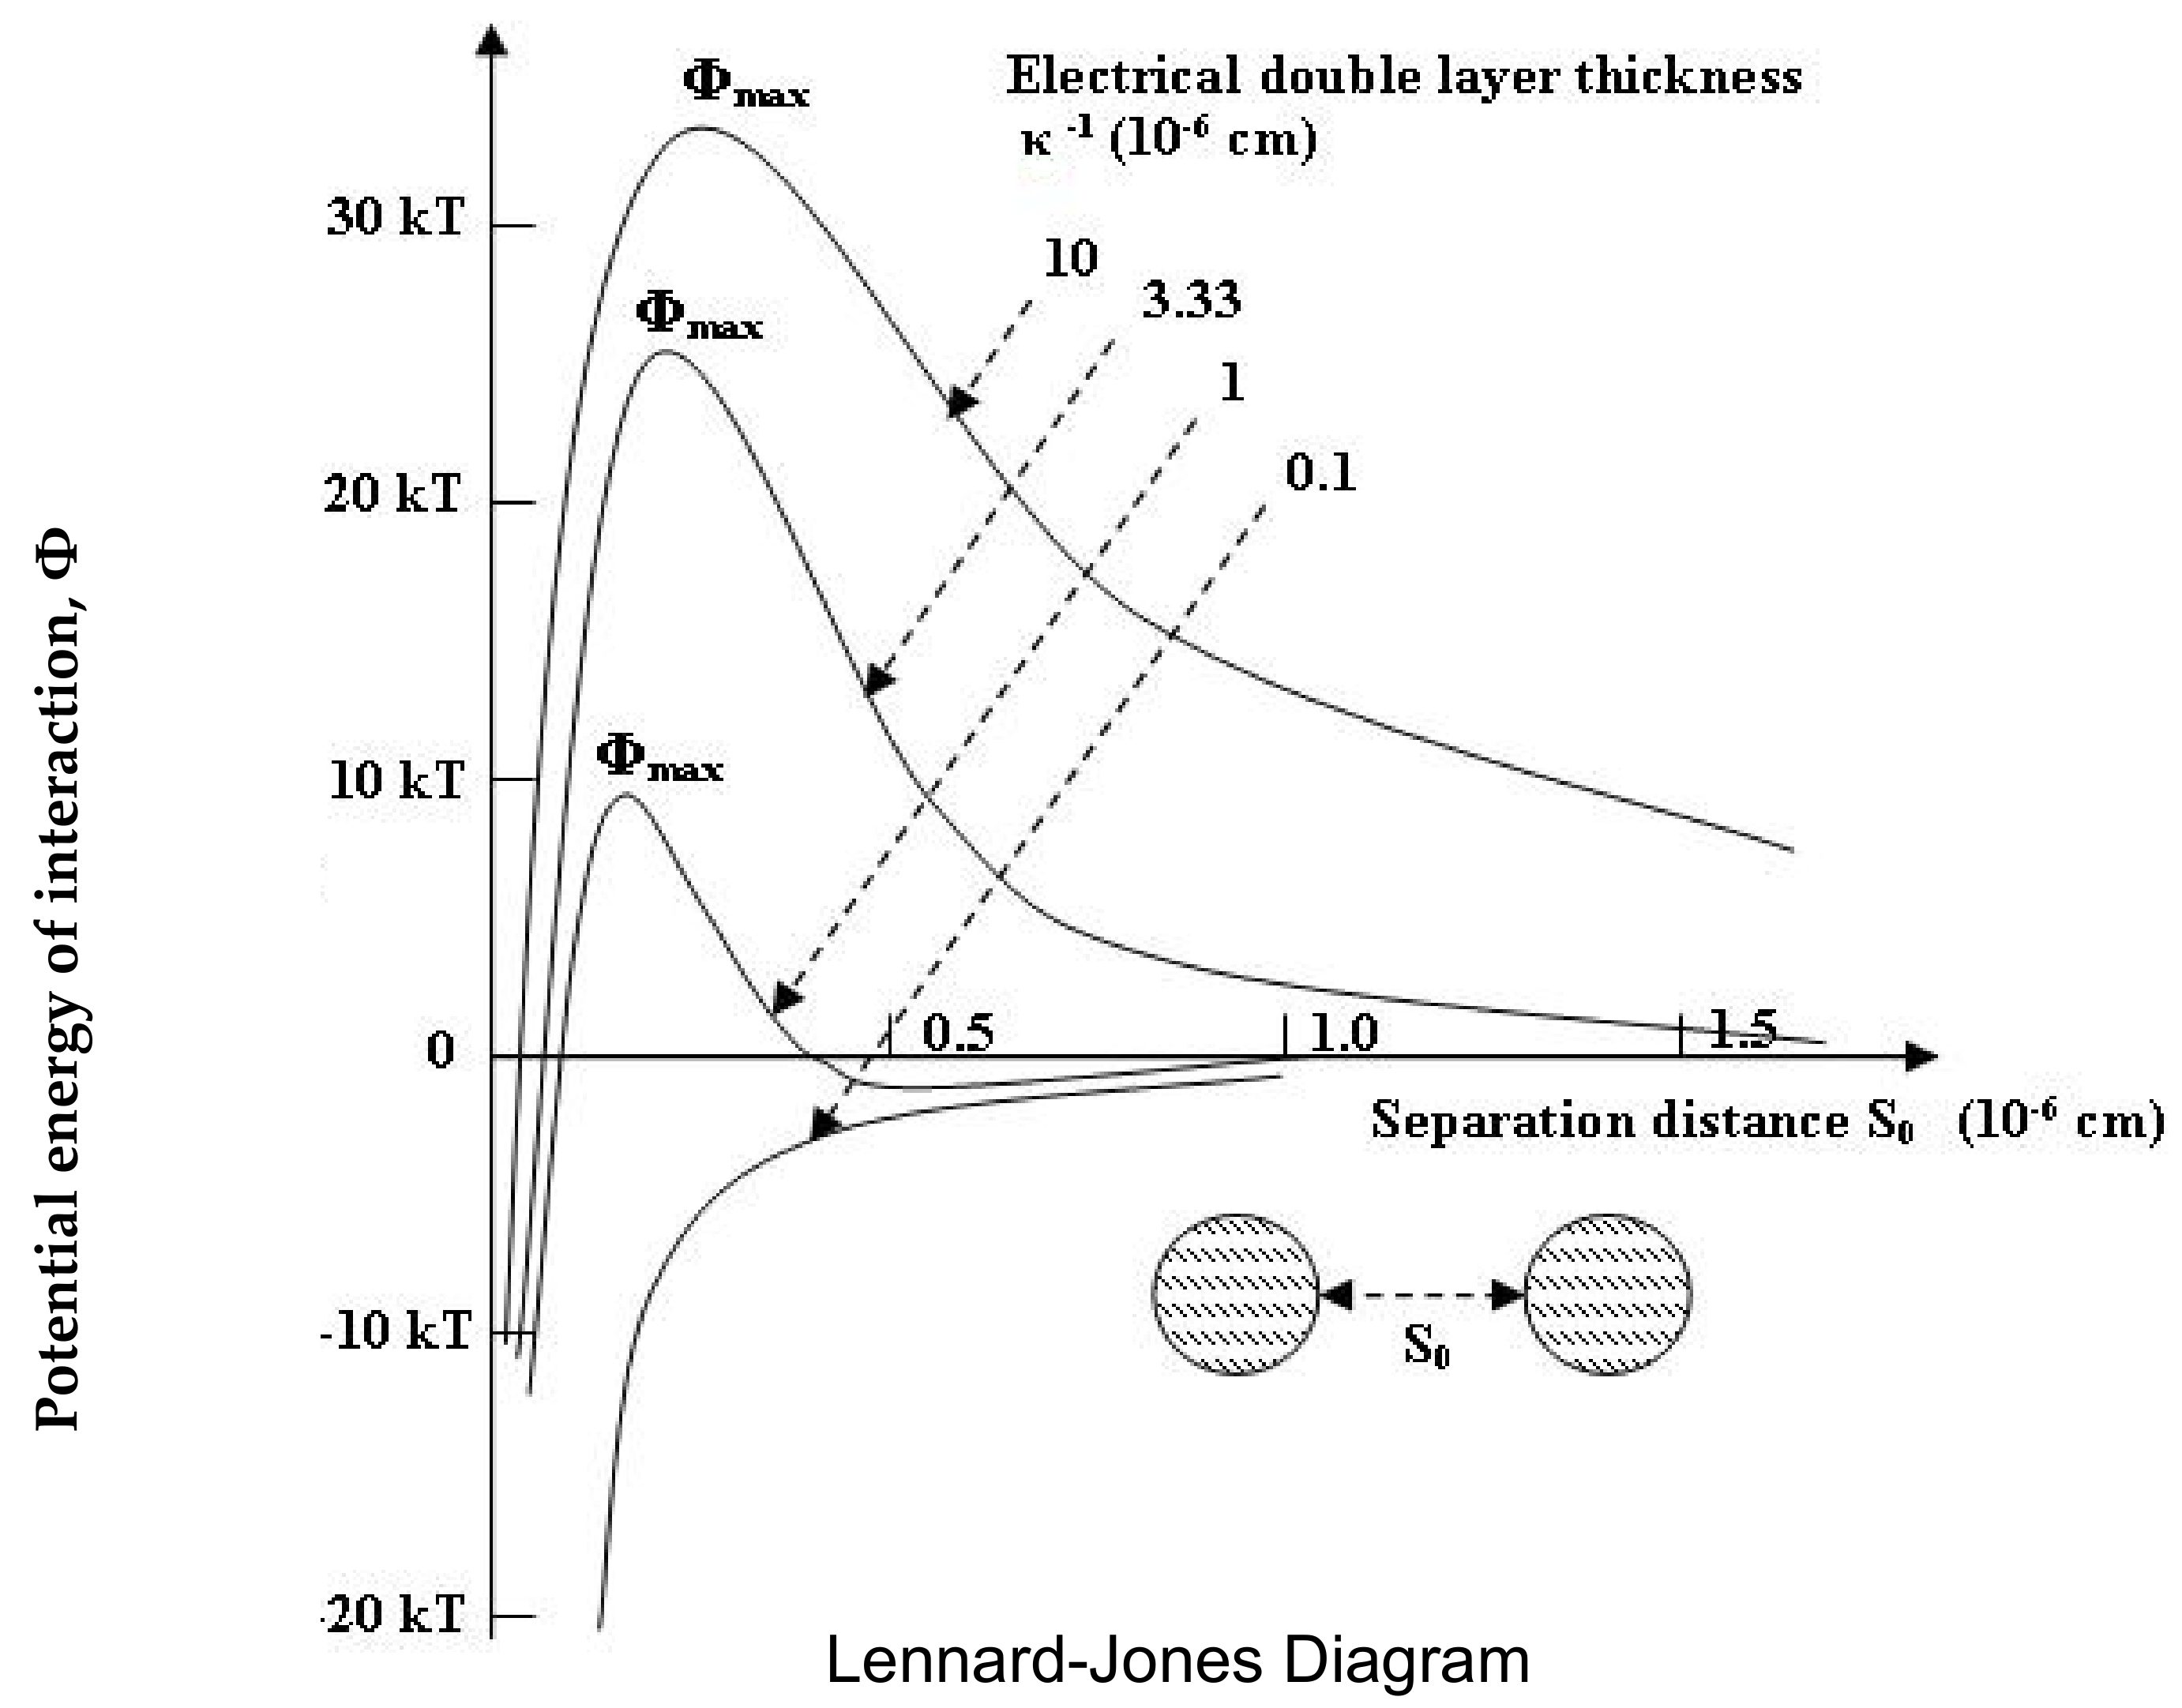
After particle collision, different mechanisms can be responsible for particle aggregation, which also influence the characteristics of the aggregates obtained (size and structure). These mechanisms are mainly based on the predominance of van der Waals interactions or electrostatic interactions [4].
One of the factors that influences particle aggregation is the thickness of the electric double layer around the particle surface. Any parameter favoring a decrease in the electric double-layer thickness—for instance, pH or ionic strength [4]—will augment particle aggregation. A lower electric double-layer thickness leads to a decrease in the energy barrier in the Lennard–Jones diagram (Figure 1) and, thus, makes it easier for particles to aggregate after collision [4].
Charge neutralization is, in general, a mechanism leading to particle suspension instability and, thus, to aggregation [4].
On the other hand, electrostatic interaction between particles of opposite charges leads, naturally, to particle aggregation [4]. This interaction can be the result of opposite charges in a particle’s surface or regions of it, as observed in crystalline systems and clays [16]. Alternatively, it may arise from the creation of zones with an opposite charge in the same particle surface because of additives adsorbing on the particle surface without completely neutralizing it. This can happen, for instance, after using highly charged polymers to induce aggregation, which act based on the “patching” mechanism [4,14] (see Figure 2).
Hydrodynamic interactions can also induce aggregation. Using high-molecular-weight polymers of low to medium charge density, which adsorb on the particle surface, can lead to interactions between the polymer chains. This gives rise to particle aggregation, driven by the so-called “bridging” mechanism (see Figure 3) [38].
In some situations, depending on the system’s operation conditions and additives used, different mechanisms can coexist simultaneously.
Another mechanism that can cause particle aggregation, especially in dry systems, results from the presence of capillary forces [40]. This mechanism can be due to the presence of a binder or simply result from the evaporation of the solvent in the feeding suspension. Evaporation causes aggregation, e.g., in spray drying processes used in different industrial sectors, such as pharmaceuticals, food, detergents, etc. [3,5,6].
The different aggregation mechanisms, discussed above, usually lead to aggregates with different structures. For instance, aggregates produced through electrostatic interactions are usually smaller, more compact, and more resistant to shear [4]. The same happens if “patching” is the underlying mechanism [4]. On the other hand, if “bridging” is the main mechanism, looser and larger aggregates will be obtained [4,22]. So, depending on the final characteristics desired for the aggregates to be produced, different aggregation mechanisms should be promoted in the process.
It is also important to stress that, in some processes, aggregate breakage can occur in parallel with aggregate formation. This is, for instance, the case in papermaking, where aggregation occurs in high shearing conditions, and as a consequence, the final characteristics of the aggregates obtained are the result of the balance between aggregation and breakage [8,41]. During breakage and re-aggregation, aggregate restructuring can occur, for instance, because of the re-arrangement of polymer chains, and this usually leads, in the end, to slightly smaller and more compact aggregates [34].
In many processes, it is important to evaluate the aggregates’ resistance to breakage, which is also co-related to the prevailing aggregation mechanism and dependent on the process’s operating conditions.
In this review, the focus will be on the discussion of available techniques/strategies used to monitor aggregation processes, including imaging techniques, radiation scattering techniques, and ultrasonic techniques. In the next sections, different techniques will be presented in more detail, including the underlying principles, developments over the years, and applications.
2. In-Line Microscopy
Imaging techniques can provide information about the evolution of particle characteristics (size and morphology) in the process. Video-based microscopy is preferred for process control since it allows for a quick analysis of the images to provide shape and size characteristics.
One of the first on-line imaging systems to be developed was used for the on-line monitoring of granule size distribution and shape in a fluidized bed granulation process [42]. The particle imaging probe included a CCD camera and an imaging processing system. Continuous image acquisitions by the imaging probe were digitalized and processed by the algorithm for image processing development, which involved filtering, binarization, noise reduction, labeling, and pattern recognition using parallel processing. In total, 4096 granules can be processed in a few seconds [41]. The application of this system to the dynamic control of granule size and shape has been demonstrated [41].
There are several tools that are commercially available in this field: the Particle Image System (Dupont); PVM (Particle Vision and Measurement—Mettler Toledo) [42]; the In Situ Particle Viewer (IPSV—Perdix Analytical Systems) [43]; and photo-optical probes (such as SOPAT) [44]. The last one is among the most recent, with high versatility and allowing for a very high image processing speed because of the software developed.
The SOPAT probe is a photo-optical probe with integrated image analysis. It involves an endoscope connected to a CCD high-speed camera as a microscope lens. A strobe flashlight is guided by a fiber optic cable to ensure sharp images with an exposure of 1–10 µs, which allows for pseudo-static images (stroboscopy effectively stops the flow during a measurement), as shown in Figure 4. Illumination plays an important role in the settings; illumination intensity can be controlled to obtain clear and sharp images. This is a high-speed probe that, depending on the system, can acquire up to 2500 images per second.
The photo-optical probe from SOPAT can be used for low to relatively high particle concentrations and is manufactured for use in extreme process conditions (up to 320 bar and 450 °C). Also, it covers a particle size range from 0.5 to 10,000 µm. Moreover, it can deal with different types of particles, including droplets and aggregates [46].
A specific configuration of the SOPAT probe must be selected depending on the application. The most relevant properties to consider are the number and size of the particles to be measured and the transparency of the continuous and disperse phases. These properties determine the angle and eventual overlapping of single-particle interfaces and condition the way the illumination is guided. This system is designed with a narrow depth of field to analyze higher particle concentrations [45]. It provides quantitative information about the particles in the process regarding size, shape (circularity), and morphology. One of the main features of this on-line photo-optical probe is the proprietary image recognition algorithm (based on MATLAB) associated with this probe. This software is based on two complementary methodologies: the pattern-matching methodology and segmentation-based imaging processing. In the first case, a set of particles with similar characteristics, representative of the system, is chosen, and typical features are extracted and correlated during particle matching to identify similar objects in a series of images. A normalized cross-correlation procedure is used. This methodology is highly effective when objects appear in high contrast to the background and have a reasonable concentration in the images (not too low; not too high). The user can define thresholds that decide how close a match for the object is acceptable to the user-defined pattern [44]. Irregular particles make the generation of a generic pattern more difficult.
The alternative procedure is segmentation-based image processing (flexible boundary detection) [44]. This procedure is used to identify structures in an image. It allows structures with complex boundaries to be detected. After initial image pre-processing, segmentation is performed to identify structures in the images. The algorithm starts with pre-filtering to enhance certain features of the images and remove irrelevant and misleading information. Conversion into binary images is then performed with adaptive imaging thresholding, overlaying of the resulting images, and double thresholding with morphological reconstruction. The identified segments are captured for a precise shape analysis. The particles detected are classified, and after this training procedure, segmented particles are compared, and particles possessing accepted features are retained. The segmentation algorithm is better at identifying irregular particles. Figure 5 schematizes the two image analysis procedures.
Image processing can supply different information about the particles analyzed: the mean Feret or maximum Feret diameters, the Sauter mean diameter, the Martin diameter, the particle circularity, and the aspect ratio [44]. Number distributions are usually supplied as raw information, even if conversion into volume distribution can be performed.
Different applications of photo-optical probes (the on-line video microscope) in different processes have already been reported in the literature, namely the following:
The present version of this on-line video microscope for in-line particle monitoring in the process benefits from a very fast image acquisition and treatment system. This renders it a very useful tool for in-line process monitoring. In the future, the possibility of using it for control purposes coupled with other PAT tools can be considered. One of the limitations of this technique is the concentration that can be treated, even if, nowadays, with the stroboscopic system and the adequate location of the probe, relatively high concentrations can already be handled. Still, for instance, in the case of gas–liquid systems, the projection of bubbles through other bubbles onto a camera sensor can lead to incorrect size measurements. The optical properties of the system can also constitute a problem, as it is difficult to handle systems with similar optical properties for the dispersed and continuous phases. Also, by selecting the adequate image treatment algorithm, as described above, it is already possible to handle irregular particles. Moreover, the quality and variability in the quality of the images obtained greatly influence the success of the automated interpretation.
The main advantage of this technique is the possibility of directly observing the particles, which facilitates the introduction of modifications into the acquisition (the probe position, illumination, etc.) to easily solve eventual drawbacks, for instance, particle overlap.
Monitoring Flocculation with In-Line Microscopy
Studies on the application of in-line microscopy for the monitoring of particle aggregation, specifically in industrial processes, are very limited, despite being a quite promising technique for this field, considering the characteristics of the existing commercial equipment. In a recent study [30], the possibility of using photo-optical measurement (a SOPAT measurement system) to capture, in-line, the complex morphology of a clay system undergoing flocculation induced by a cationic polyacrylamide was evaluated. This study was performed in a lab-scale stirred tank equipped with different types of impellers. The image-based analysis used a Convolutional Neural Network (CNN) trained for particle detection. The camera used in the photo-optical probe captures a three-dimensional cylindrical measuring volume of 2.7 mm in diameter, which can reliably photograph particles in a size range of 9–1200 μm. Keeping in mind dynamic changes in the system, one data point corresponds to 300 acquired images at a frame rate of 12 images per second, which corresponds to 6000–50,000 particles being analyzed per data point [30].
The image analysis algorithm by Panckow et al. (2021) [30] represents an advanced methodology used to meet the requirements of floc detection. This study demonstrates the detection of particles at various depths inside the bulk flow region [30]. As referenced, a CNN architecture (U-Net) was employed in the image-processing chain [30] involving different steps. One of the steps involved different training rounds (8), which enabled an increase in the contour precision of the images. The authors mention that particle detection with this neural network is very robust over a broad variety of operating conditions without needing re-parametrization [30], which provides high-quality particle recognition for the evaluation of the flocculation process based on the evolution of the size and shape of the particles under different experimental conditions. The drawback of this methodology is the very high amount of labor required.
The results presented in that study [30] show that, by using an in-line microscopy system, the size distribution of morphologically complex clay flocs could be successfully detected. By applying this measuring technique, the different phases of the flocculation process could be identified. Also, the influence of the impeller characteristics (resulting in different induced particle stress levels) on the flocculation process could be evaluated.
The maximum Feret diameter was chosen as a reliable parameter to characterize the flocs to allow for a systematic analysis of the flocculation process, even if other parameters were also calculated and tested to characterize floc sizes [30]. Additionally, the shape of the flocs was also characterized based on the flocs’ circularity and aspect ratios. It was also possible to assess how these parameters evolved with time and their dependence on the impeller characteristics. Using the methodology described, it was possible to obtain further insight into breakage mechanisms during the flocculation process.
Some studies have appeared recently in the field of biology aiming at the use of in-line microscopy to monitor and study cell aggregation. This is the case, for instance, of the work of Stuber et al. (2022) [51], which uses an in-house-developed in-line microscopy system to detect cell aggregation in real time. The cells are cultivated and allowed to aggregate in a hanging droplet using a Teflon hanging drop device (THDD) developed by the authors, and images are collected, on-line, every 30 min using an on-line video microscope system, which is computer-controlled [51]. Image deconvolution was performed using the Huygens Essential software [51]. Combining the THDD with on-line monitoring enables the study of the kinetics and dynamics of characteristic changes in different cell types aggregation.
Also in the field of microorganism aggregation control, some recent studies mention the use of in-site microscopy for that purpose, for instance, in biological wastewater treatment processes, namely, by using laser scanning microscopy [52]. These new techniques enable an in situ analysis of the structure, composition, and dynamics of the microbial community [53]. The major challenges are related to the sampling procedure adopted, which cannot damage the biomass integrity while allowing for the acquisition of sharp, representative, and useful images. Further issues are related to the limited depth of focus and the resolution at which the samples can be imaged, which depends on the wavelength of the laser light used.
3. Optical Coherence Tomography—OCT
Optical coherence tomography (OCT) is a rather new optical measurement technique that utilizes low-coherence, near-infrared light to obtain 1D reflectivity depth profiles (A-scans) of the studied sample [32]. An extension of OCT, doppler optical coherence tomography (DOCT) also enables the measurement of the depth profiles of local velocities in a sample in the direction of the measurement beam [54]. Thus, 2D images (B scans) or 3D volumes can be constructed from a series of A-scans at different lateral positions.
The resolution and scanning speed of state-of-the-art laboratory OCT devices are below one micrometer and hundreds of kilohertz, respectively. Although the performance of commercial devices is lower, they are a more practical option for most researchers. Currently, the most important manufacturer of generic OCT devices is Thorlabs (www.thorlabs.com, accessed on 23 November 2023). Their devices enable the measurement of structures and velocity fields simultaneously (see Figure 6a). There are many different OCT devices available, and the optimal choice depends on the application. The maximum scanning rates vary between 20 and 248 kHz; maximum imaging depths vary in the air between 1.9 and 20 mm; and minimum axial resolutions in air vary between 3 and 14 μm. Lateral resolution depends on the used optics and varies between 4 and 26 μm. Note that in water, the maximum resolution and maximum imaging depth are 26% smaller.
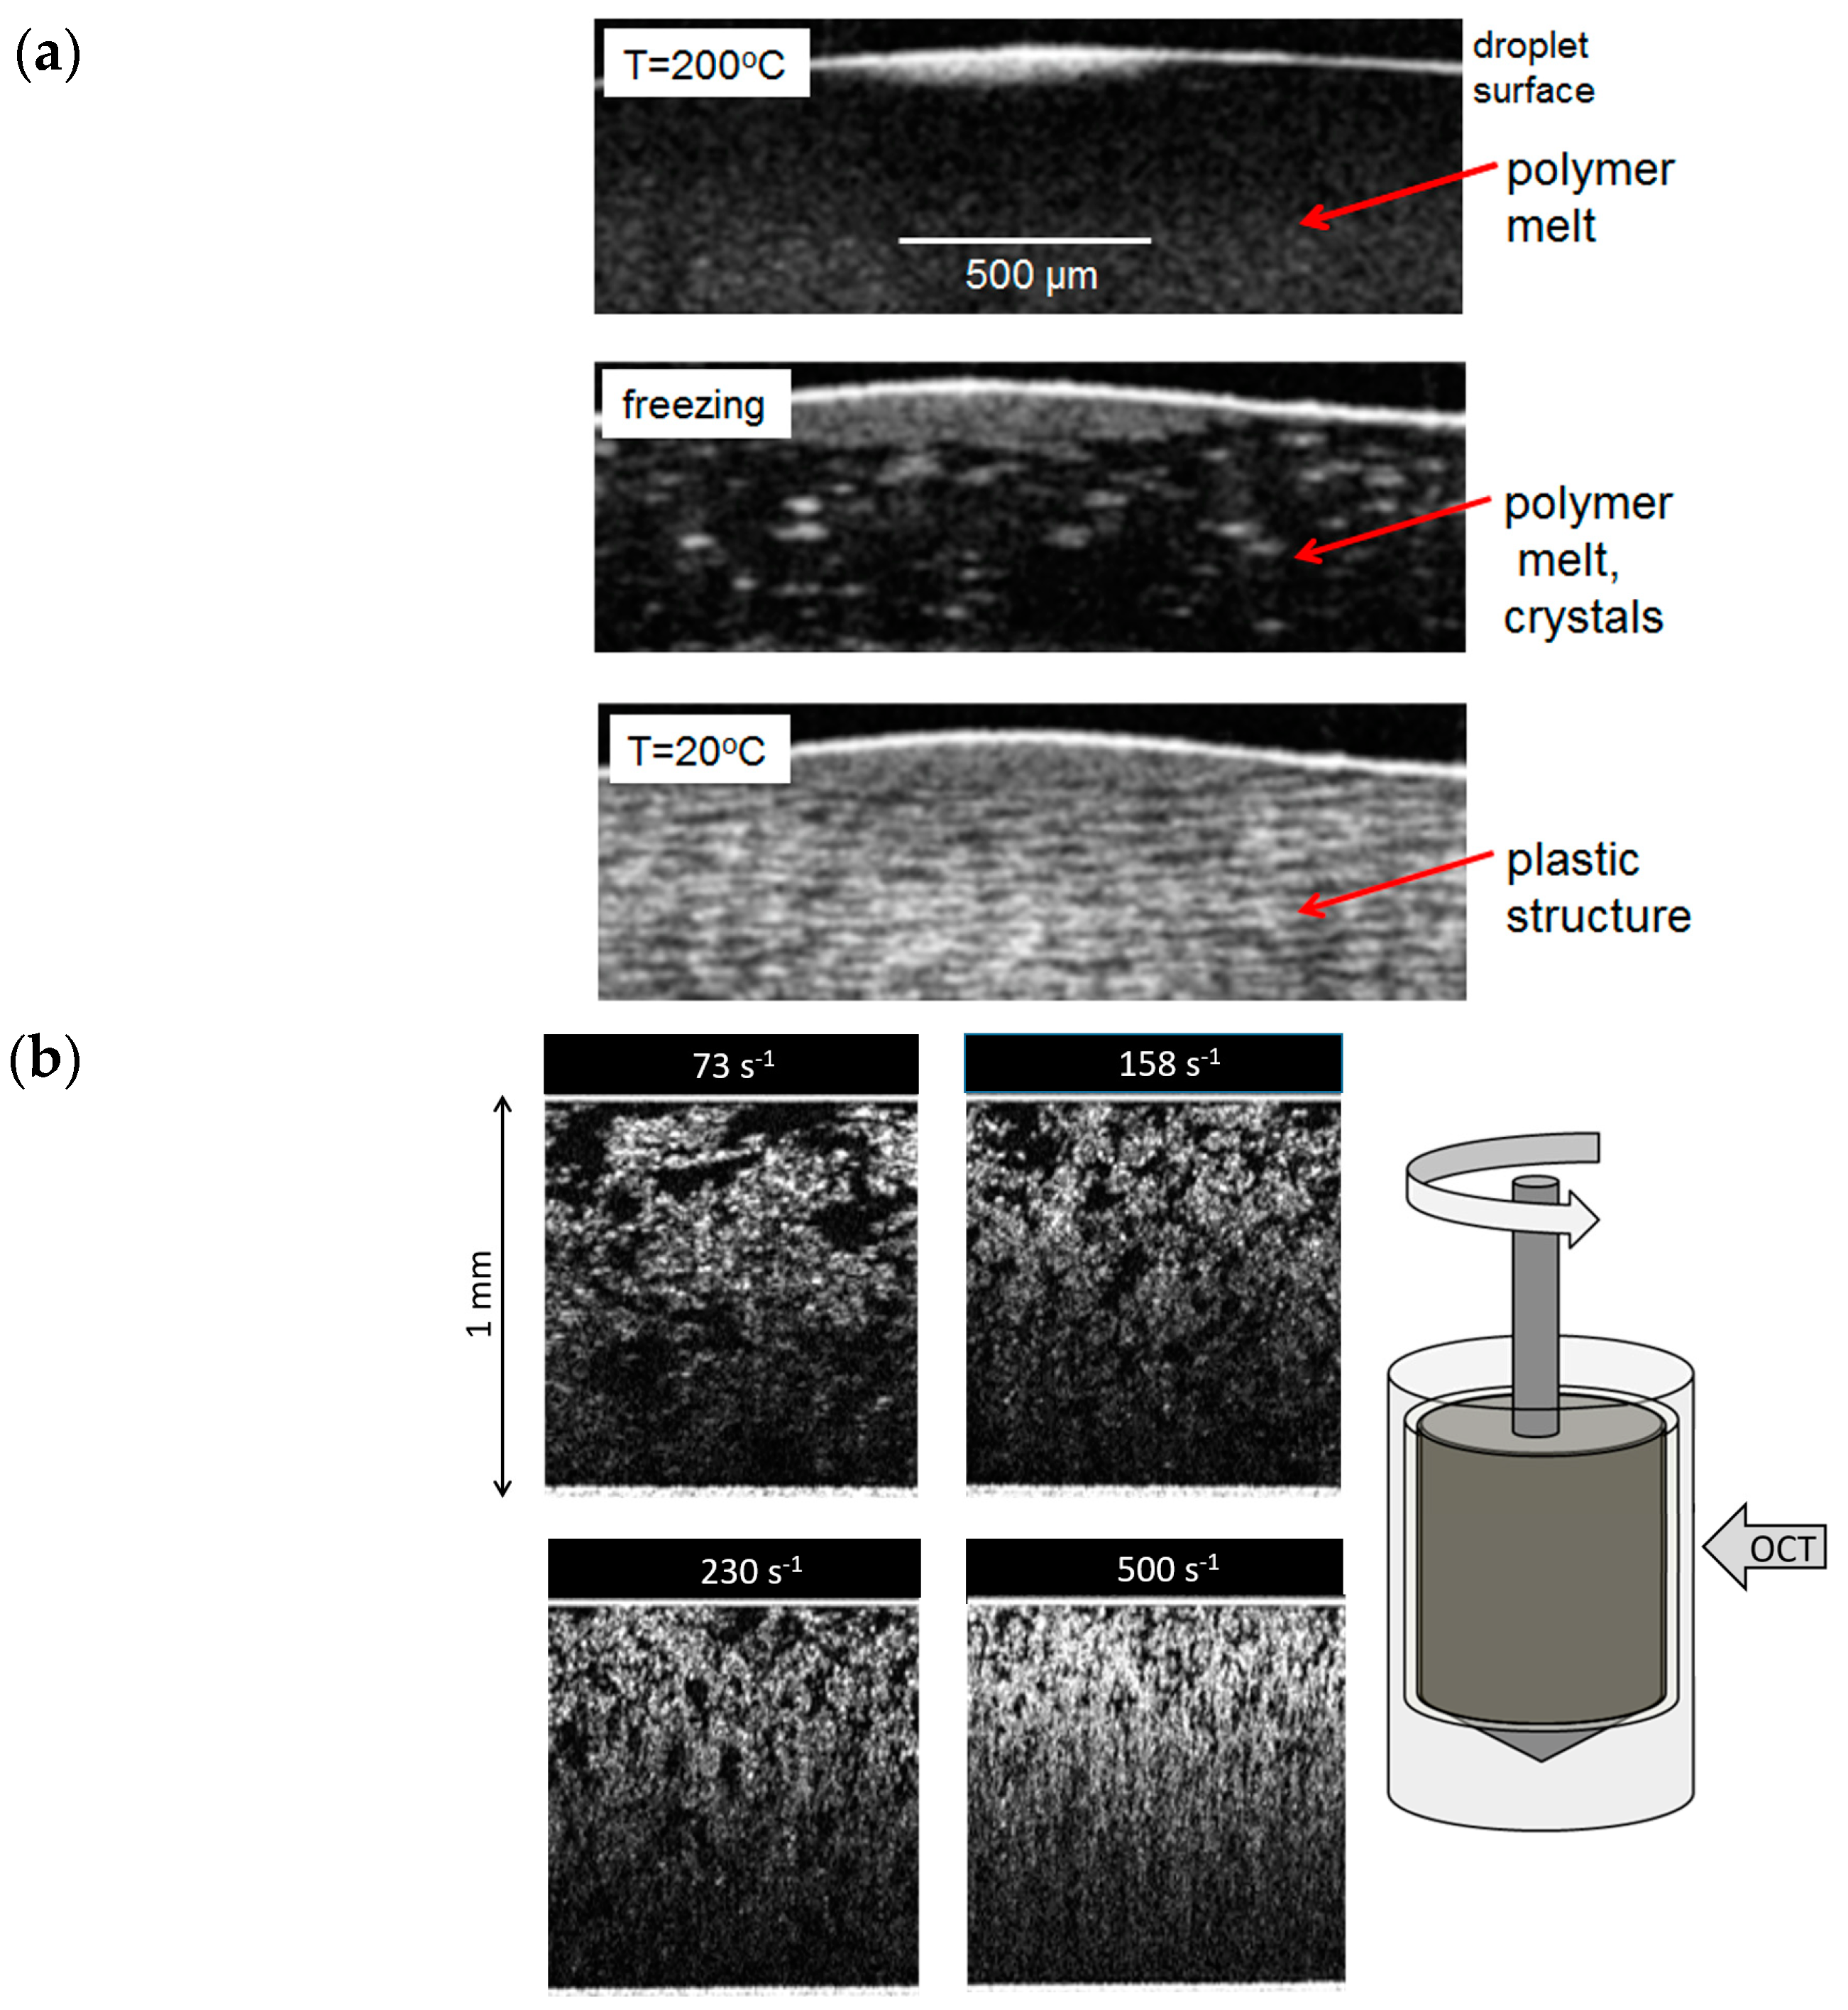
The achievable OCT imaging depth depends strongly on the studied material. The studied system needs to have enough, but not too many, light-scattering particles. OCT sensitivity decreases with increasing depth, and the penetration depth of the measurement signal is very limited with highly scattering media. Optically dense particles can also block the penetration of the OCT signal deeper into the medium. This can produce dark vertical lines in the OCT images. OCT can easily be combined with various (transparent) flow geometries such as capillaries (see Figure 6a), pipes, and rotational rheometers (see Figure 6b). Figure 7 shows examples of structural images taken with the Telesto I SD-OCT.
OCT is widely used for structural analysis, especially in the medical field [55], but also in many other areas of science and technology. Examples of various industrial applications are extensively documented in review papers [33,56], as well as in academic books [57,58]. OCT applications include crystallization processes in polymers [59], the thermal degradation of epoxy resin composites [60], automotive coatings [61], nanocomposites [62], quality control for film coatings [63], biofilms [64], the drying of particle-laden droplets [65], and fouling [66].
Figure 7.
Structural images taken with the Telesto I SD-OCT. (a) Images of a freezing polymer melt. (Unpublished. OCT imaging by Juha Salmela.) (b) Images of cellulose microfibrils (CMFs) in concentric cylindrical rheometer geometry with a one-millimeter gap. The numbers indicate the rheometer shear rates [67].

Unlike most other optical methods, OCT can also be applied to turbid and opaque materials, which makes it an attractive option for studying, e.g., particle suspensions [68]. Given its high temporal resolution, OCT can also be used to study relatively fast-moving suspensions. OCT needs optical access to the measured target, but the OCT beam is very thin, and the optical window needs to be only a few tens of micrometers wide. It is thus possible to make flow measurements in non-transparent pipes with a decent amount of preparatory work.
Monitoring Flocculation with OCT
Applications of OCT to the analysis of particle dispersion flows are still rather limited despite it being promising in this field. Lauri et al. [69] studied the distribution of single red blood cells during capillary flow. Meeuw et al. [70] demonstrated the use of OCT in the analysis of carbon nanotube–epoxy dispersions. The floc structure of CMFs was studied with OCT in a rheometer using a concentric cylindrical geometry by Haavisto et al. [67] and Saarinen et al. [71]. CMF floc structure during pipe flow was imaged with OCT by Kataja et al. [72]. Jäsberg et al. used OCT in the analysis of the precipitation and agglomeration of minerals on a hot surface during pipe flow [66]. CMF agglomeration (or flocculation) during pipe flow was studied quantitatively by Koponen et al. [73] and Lauri et al. [74]. Below we will briefly review the work performed by Lauri et al., 2021 [74].
Lauri et al. [74] studied the flocculation of CMF fibrils during pipe flow with 0.4%, 1.0%, and 1.6% CMF consistency (w/w). A microscopic image of the used CMF grade is shown in Figure 8. The experimental setup is shown in Figure 9. The studied suspension was circulated in a flow loop equipped with a flow rate sensor and a temperature control unit. The rheological measurements were performed consistently in a 2.5 m long glass pipe with a diameter of 19 mm. Shear stress in the pipe was determined with a differential pressure sensor—the distance between the measurement taps was one meter.
The OCT measurements were performed with a Telesto I SD-OCT. The device depth resolution is approximately 5.6 µm in water. The lateral resolution is approximately 15 µm. The maximum imaging depth range in water is 1.9 mm. As the A-scan consists of 512 pixels, the pixel resolution is 3.7 µm. The available scanning rates are 5, 25, and 91 kHz. The OCT device was set to perform continuous A-scans, and the location of the OCT probing beam remained the same. The floc structure of the CMF suspension was captured in the resulting OCT images. There was a small angle between the beam and the normal of the pipe surface to prevent the reflected beam from hitting the OCT device.
The floc sizes were determined in the radial (normal to pipe wall) and axial (along the pipe) directions. The imaging depth was 500–700 µm depending on the CMF consistency. The wall depletion layer close to the pipe wall was removed from the analysis.
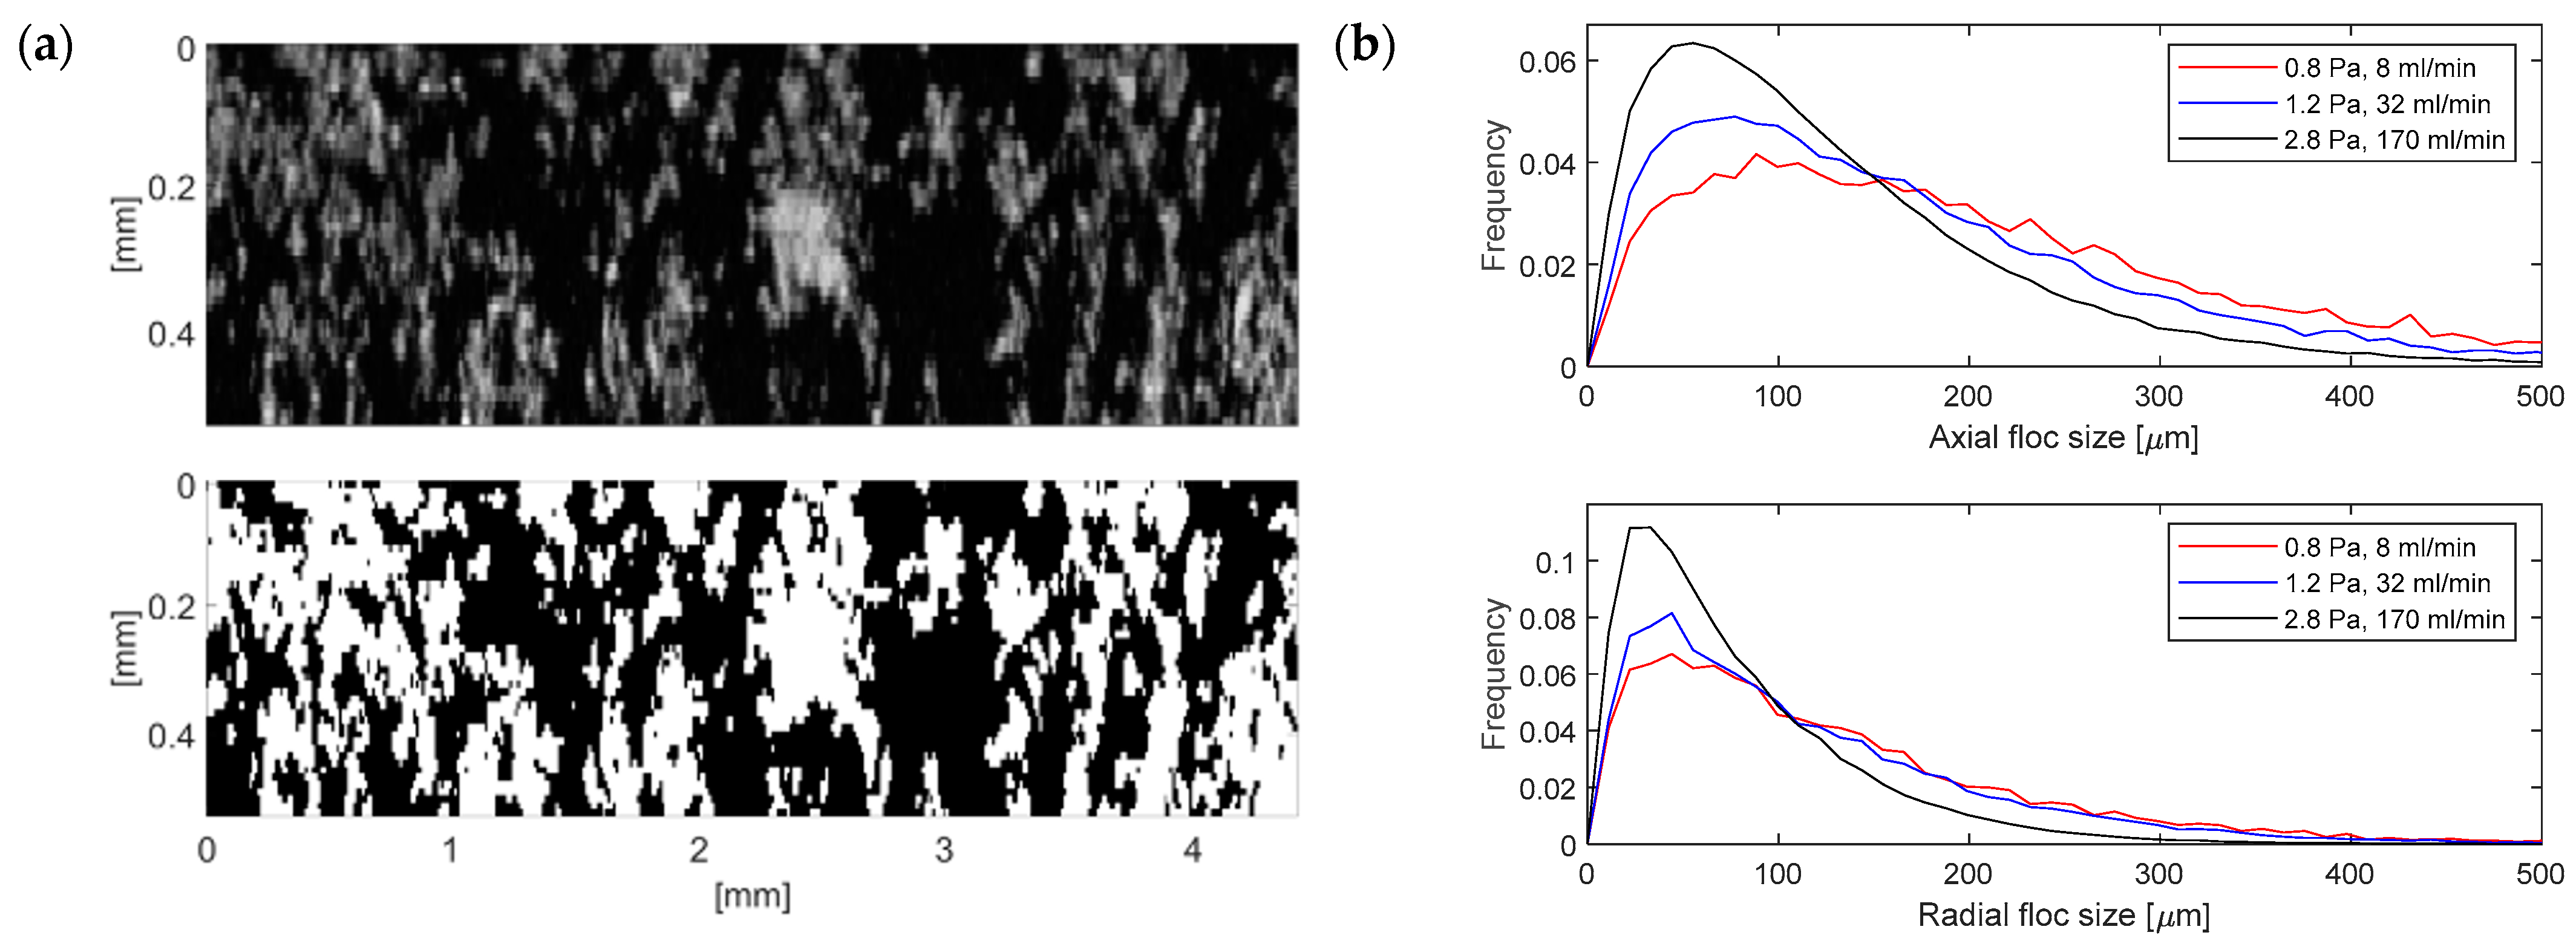
The floc size analysis was as follows: the depth-dependent decay of the OCT signal (see Figure 10) was first corrected by calculating the average OCT signal as a function of depth and then scaling the pixel values at a given depth with it. This process ensures that the average OCT signal is equal to the corrected image at each depth. Next, the OCT images were resized to 11 µm × 11 µm pixels to account for the different radial and axial resolutions. This step can be omitted if only axial floc sizes are calculated. Finally, the resized images were thresholded using Otsu’s method [75], and the radial and axial floc size distributions were calculated as run-length distributions. Figure 11a shows resized images (upper row) and Otsu-thresholded images (lower row) for 0.4% consistency. Figure 11b shows the radial and the axial floc size distributions for 0.4% consistency at various flow rates (and shear stresses). Figure 12 shows the radial and axial floc sizes as a function of shear stress for 0.4% CMF consistency. We see in Figure 12 that axial floc size remains constant in the used shear stress region, whereas radial floc size drops by almost 30% before saturation.
To sum up, OCT is a versatile imaging technique that provides high-resolution images of the size, shape, and distribution of particles in a medium. It offers real-time information with a high data acquisition rate, making it ideal for monitoring dynamic aggregation processes in complex environments. OCT’s ability to penetrate turbid media adds to its usefulness in understanding particle aggregation. The main limitation of this method is the measurement depth, which depends strongly on the optical properties of the medium.
4. Laser Diffraction Spectroscopy—LDS
Laser diffraction spectroscopy (LDS) is a particle size analysis technique based on the acquisition of light scattered by particles in the forward direction when a laser beam interferes with the particles. When the particle size is larger than the wavelength, light scatters mainly in the forward direction. Then, if diffraction is the main scattering mechanism, the particle surface conditions the scattered light, and particles of different sizes will scatter light in the forward direction to different scattering angles. Larger particles scatter predominantly for low angles, while small particles will scatter mostly for large angles (see Figure 13) [76].
When a sample is being analyzed following this principle, by collecting the light scattered by the particles for different scattering angles, it is possible, after signal treatment (light intensity versus angle), to obtain information about the particle size distribution in the sample. Depending on the relationship between the size of the particles and the laser wavelength, different theories can be used to treat the signal acquired, corresponding to the scattered light, to retrieve the particle size distribution. For large particles, Fraunhofer theory can be used, while for small particles, Mie theory has to be used, which requires additional information about the optical properties of the system [21,76]. LDS supplies information about the full particle size distribution, intensity, or volume-weighted distributions for a wide range of particle sizes (0.3–3000 µm).
Additionally, through adequate signal processing, it is also possible to acquire information about the particles’ structure by calculating the fractal dimension of the particles or the scattering exponent [21,77]. This information is extracted by plotting, at a log scale, the intensity of the light scattered for the different angles (θ) as a function of the scattering vector (q = 4πn0/λ sin(θ/2); here, n0 is the medium refractive index. and λ is the laser wavelength). Figure 14 presents an example of this plot.
The slope of this plot supplies either the fractal coefficient (dF) or the scattering exponent (SE), depending on the region being considered. It is known that the fractal dimension (dF) (or the scattering exponent) provides a way of expressing the degree to which primary particles fill the space occupied by a nominal volume, supplying information about the particles’ structure, namely, porosity [21,77]. Biggs et al. [22] indicate that scattering patterns at small-length scales refer to the light scattered by primary aggregates, whereas the large-length scales correspond to the light scattered from secondary aggregates that resulted from the aggregation of the primary ones. The coefficient associated with the slope of the small-length scales is the fractal dimension (dF), while the coefficient associated with the slope of large-length scales (larger particles/aggregates) is the scattering exponent (SE) (Figure 14) [77].
The fractal dimension, dF, relates the mass of a porous particle or aggregate with its diameter (Equation (1)).
Standard LDS commercial equipment—equipped with one or two different laser sources of different wavelengths and with a set of circular detectors corresponding to different scattering angles—can be used to monitor, off-line, aggregation processes and to supply the corresponding aggregation kinetic curves [8,23], including information on the influence of different parameters on the flocculation process [41,78]. This monitoring strategy allows for the optimization of the flocculation conditions, selecting the best polymer for the process, considering the target flocs’ sizes and structure and also optimizing the flocculant concentration [79].
Additionally, LDS can also be used to monitor, on-line, particle formation/evolution, including aggregation processes. This is the case, for instance, for the system developed by Ma et al. [80] that adapted LDS for on-line particle size measurement in a jet mill. The main novelty of this study was the use of a CMOS detector (a complementary metal oxide semiconductor) of 512 × 512 pixels (two-dimensional pixel array sensor) to improve signal acquisition, enabling the direct measurement of the scattering patterns. This sensor is much more flexible than the standard fixed-ring detection array.
LDS has also been used to monitor, on-line, crystallization processes, including monitoring the formation of crystals and their size evolution with time [81,82].
The Insitec system by Malvern Panalytical, UK, which is based on LDS, delivers continuous particle size analysis. It can be used on-line, in either dry or wet systems, to monitor or control processes (batch or continuous) [83]. Representative samples are automatically and consistently delivered to the measurement zone in an appropriate dispersed state and adequate concentration for analysis. Applications have been reported for food, pharmaceuticals, fine chemicals, and cement sectors. Chan et al. [84] reported the use of the Insitec PAT (process analytical technology) in the monitoring of maltodextrin microsphere production in a pilot-scale spray dryer. An important feature was the purge airflow, whose velocity had to be set to a value greater than that of the primary flow to prevent the adhesion of the particles to the lens’s surface.
Despite the many advantages of this technique, such as the ability to continuously monitor processes in which particulate materials change over time and to easily and quickly adjust process conditions based on information about particle size distribution and structure, it is important to recognize certain limitations. These limitations relate mainly to the maximum particle concentration that can be effectively monitored in the system and the optical properties of the particles themselves. However, detection systems are constantly evolving to be able to detect smaller signals, and signal-processing models are also evolving to take into account different phenomena associated with the scattered light.
Monitoring Flocculation with LDS
Regarding monitoring aggregation processes, LDS has been mainly used in the monitoring of flocculation in different applications. It was proved by Rasteiro et al. in 2008 [23] that LDS can be used for the continuous monitoring of the flocculation process, following the evolution of both floc size and structure, provided by the scattering exponent, with time [8,21], and allowing for the selection of the best conditions for a certain flocculation process aimed at obtaining targeted floc characteristics [79,85].
These first studies were directed at the application of flocculation in papermaking, studying the effect of polymer characteristics (molecular weight, charge density, and branching) on flocculation kinetics and floc characteristics (size and structure) when precipitated calcium carbonate (PCC), a standard filler in papermaking, is flocculated with different polyacrylamides [8,79]. Also, the effect of medium characteristics on the flocculation process and floc properties could be evaluated with this technique [86]. Using this technique, it was possible to screen, in an efficient way, a wide range of polymers, assessing the influence of polymer properties on aggregate characteristics to select a polymer that produces flocs with the right characteristics for the targeted application [21].
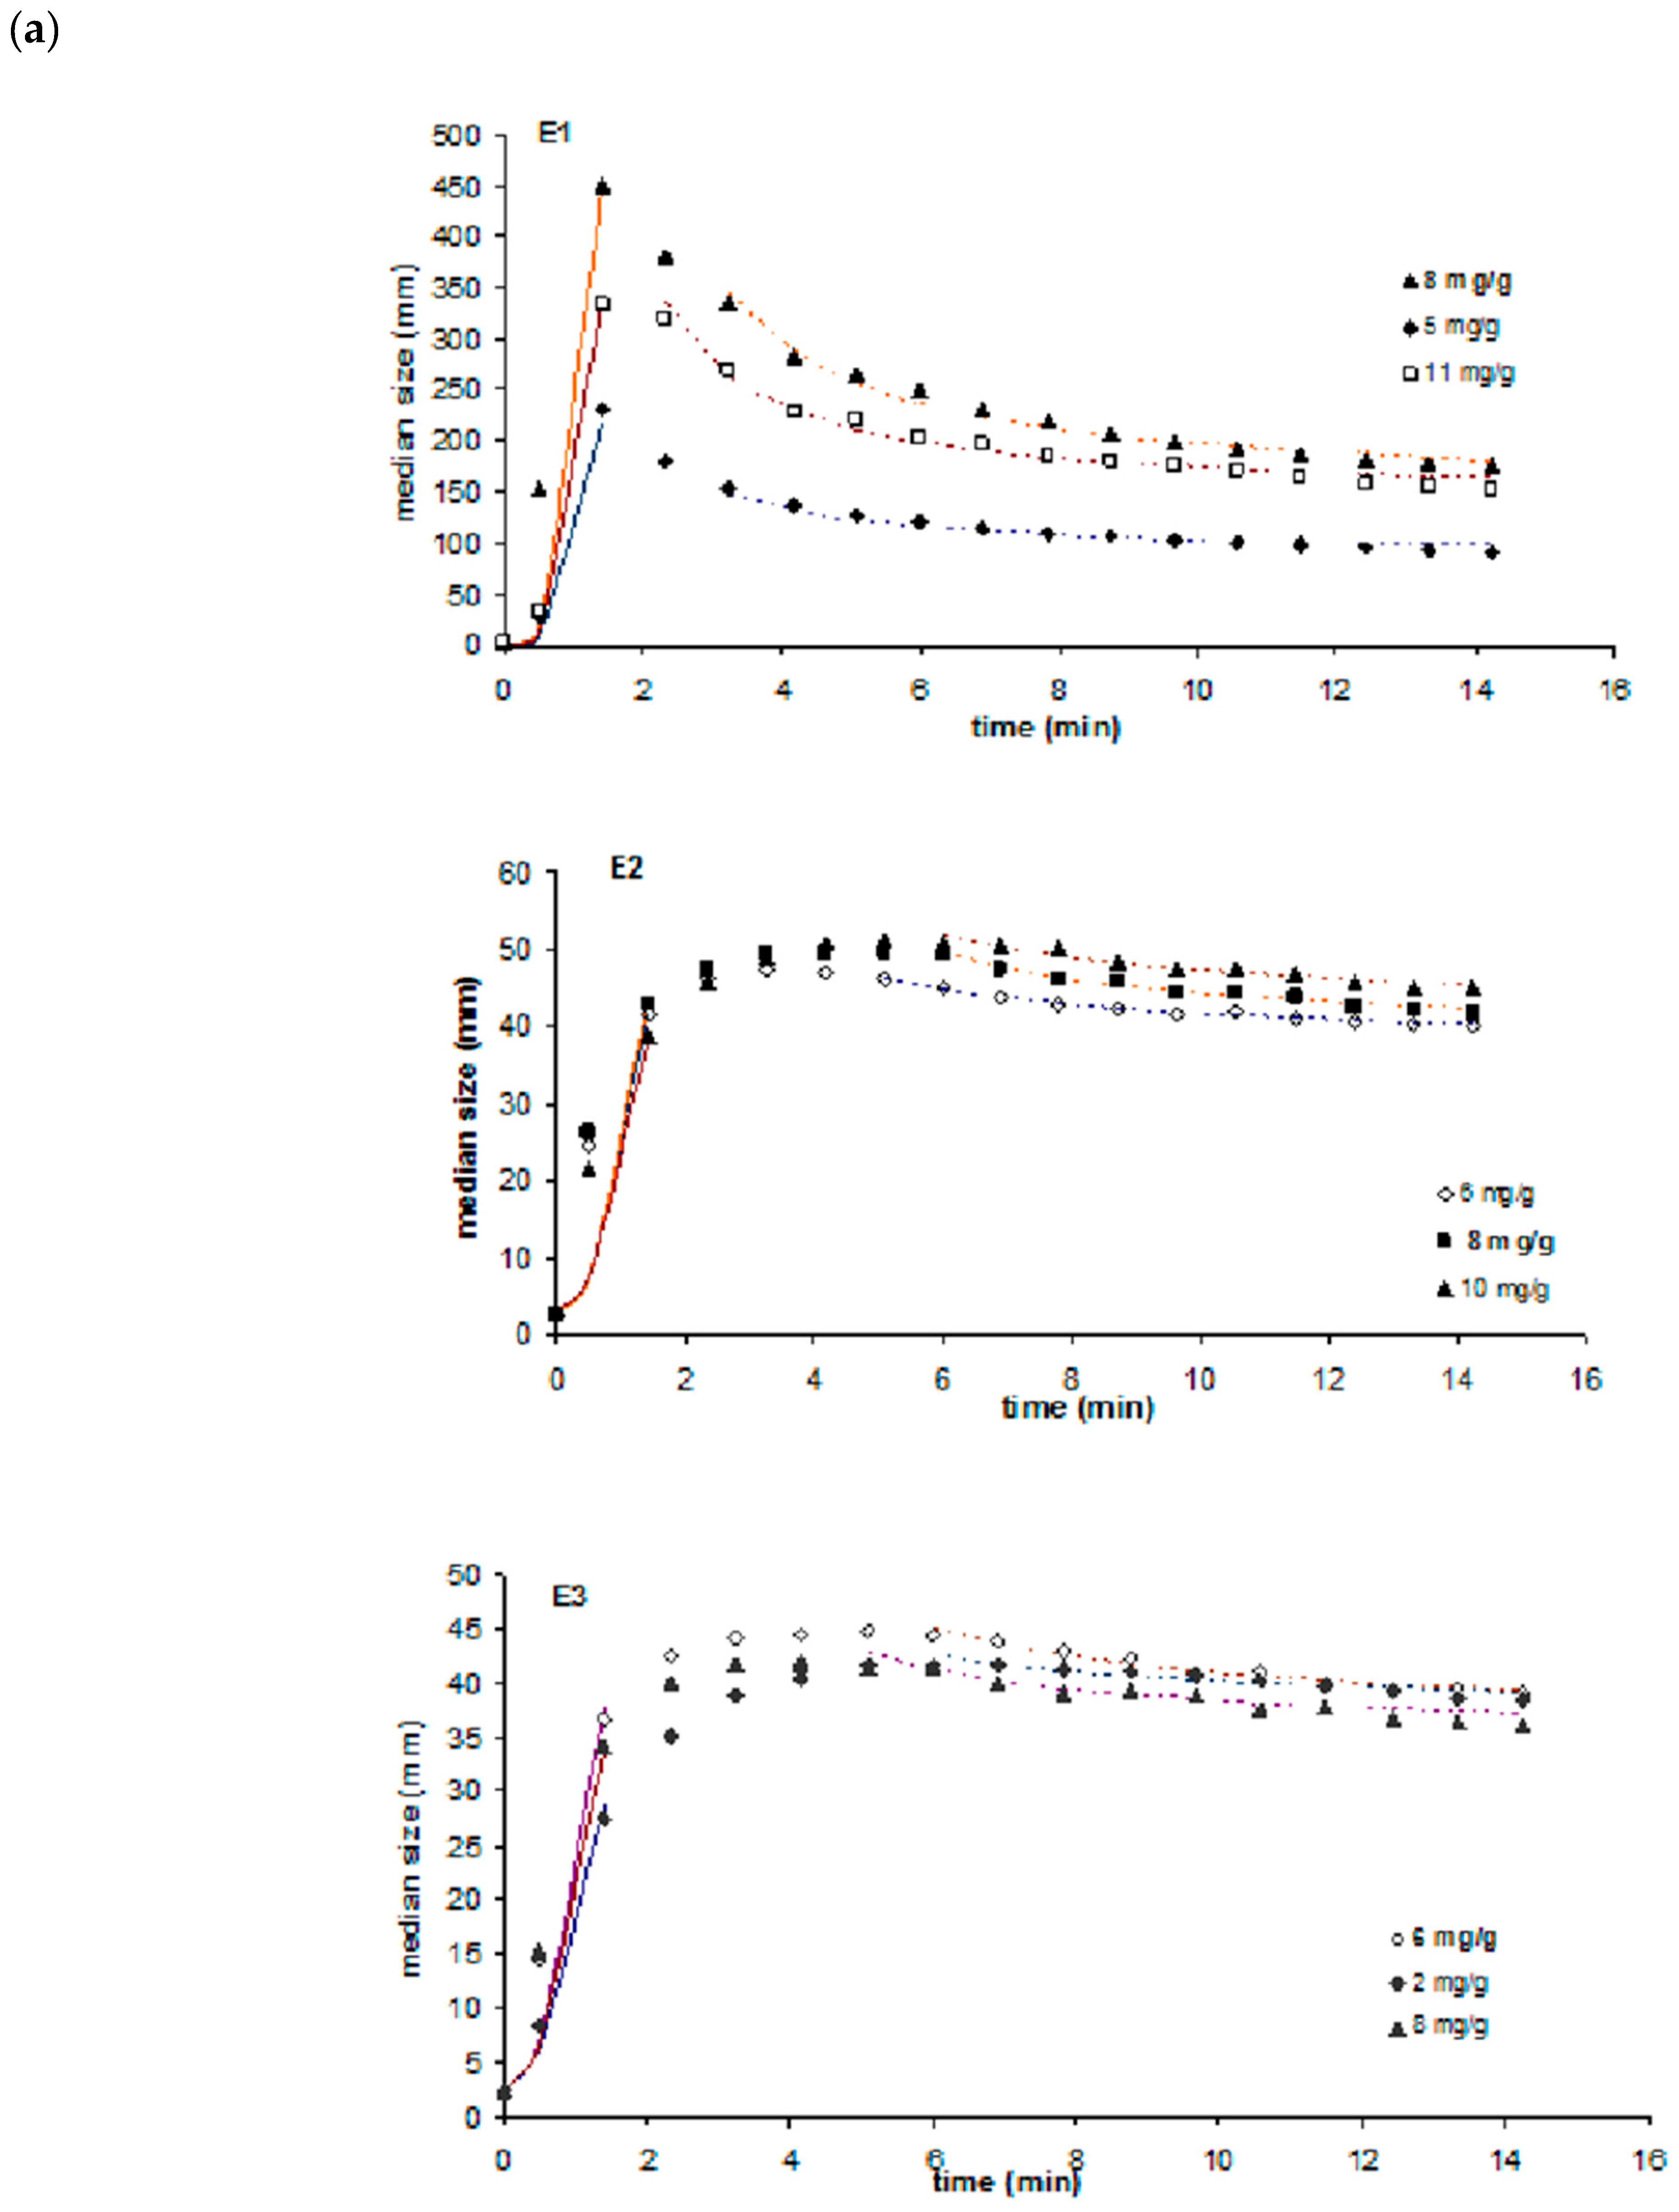
Figure 15a shows how the molecular weight of a polymer (polyacrylamide) influences both flocculation kinetics and the size of the flocs produced when flocculating PCC particles. Three polymers of the same charge density (c.a. 50%) and with different molecular weights were used in this study (molecular weight order: E1 > E2 > E3), and it was possible to conclude that the lower the molecular weight, the lower the size of the flocs, and, additionally, the flocculation rate slows down.
By analyzing the evolution of the scattering exponent with time using the same three polymers (Figure 15b), it is also possible to conclude that, with the lower-molecular-weight polymers (E2, E3), more compact flocs were obtained.
Also, using LDS, it was possible to study the influence of polymer concentration on flocculation kinetics and floc characteristics, allowing for the optimization of the polymer dosage considering the targeted flocs’ characteristics.
Soos et al. [41] used LDS to investigate coagulation mechanisms during the flocculation of polystyrene latex particles in turbulent flow using Al(NO3)3 as a coagulant, specifically regarding how collision efficiency depends on shear rate. Floc size was continuously (on-line) monitored using LDS. Through the tests conducted, the authors could also determine the aggregates’ cohesive force for the conditions tested and the re-flocculation ability of the aggregates formed (the reversibility of the aggregation phenomena). They concluded that LDS provides a tool to measure, in detail, various parameters of systems undergoing aggregation and breakage and, thus, to compare the performance of the process for different operating conditions.
Mietta et al. [78] studied the effect of the electrokinetic charge of the bentonite, pH, and ionic strength of the medium, on floc size and floc size evolution for different shear rates. LDS was used to measure floc size distribution at different times, but no continuous monitoring was performed. In this case, samples were taken from a mixing jar at discrete times and analyzed with the LDS equipment.
In a more recent study, Wilkinson et al. [87] used LDS to evaluate the influence of polymer characteristics on the flocculation of anisotropic bentonite clay particles. The influence of the medium ionic strength was also evaluated. The objective was to check the existence of different flocculation mechanisms depending on the conditions used. The results obtained with LDS were compared with results obtained using X-ray diffraction. Again, only discrete measurements were conducted for different flocculation times. Flocculation was conducted in a jar vessel, and samples were withdrawn from that vessel at different times. Fractal dimension characterization was performed using image analysis.
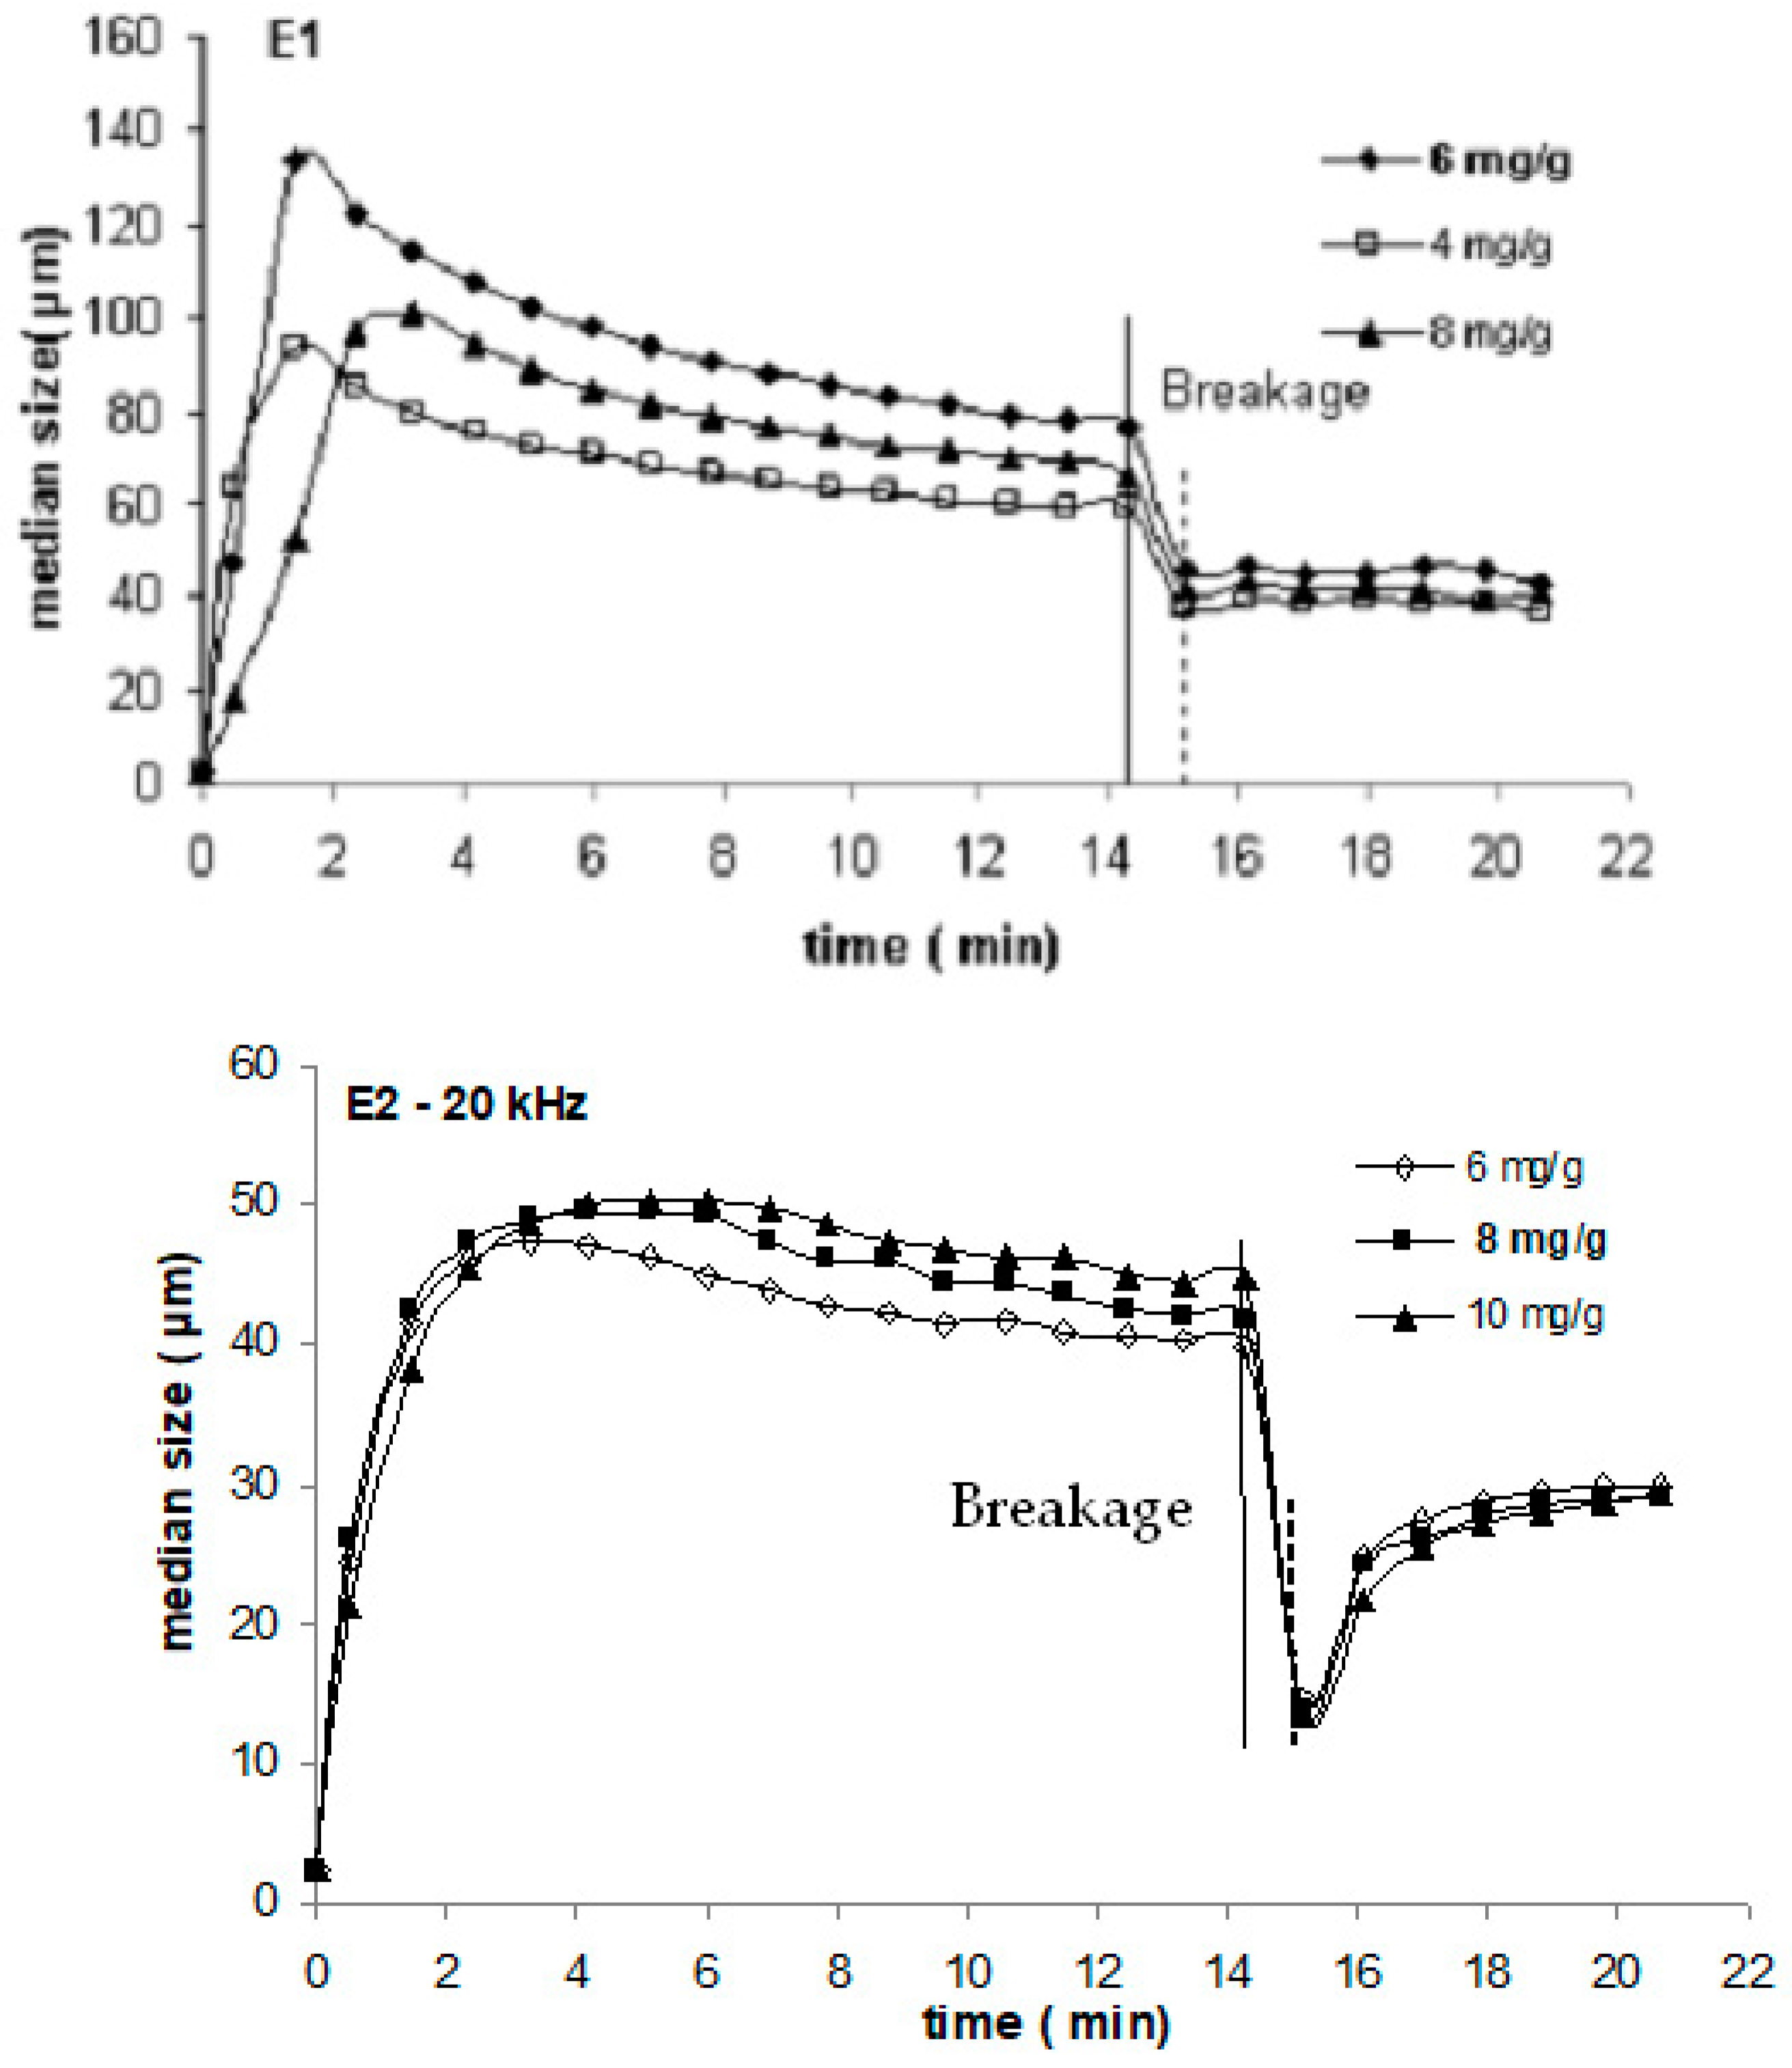
LDS has also been used with success to follow de-flocculation (breakage) and re-flocculation events in certain processes [34,86], specifically in order to optimize the conditions allowing for better re-flocculation in processes where aggregates are submitted to high shear rates. Figure 16 shows how re-flocculation depends on polymer characteristics when PCC flocs produced with two different polyacrylamides varying in molecular weight (E1 has a higher molecular weight than E2) are subjected to sudden breakage (application of ultrasounds, 20 kHz, for 30 s) and then allowed to re-flocculate after this shearing event.
Guerin et al. [88] used LDS to monitor, in-line, in a Taylor Couette reactor, floc formation and floc characteristics in a model suspension of latex microspheres using different coagulants and a cationic polymer. The objective was to evaluate not only the influence of the coagulant/polymer used on the floc characteristics but also how shear rate can influence the formation of flocs and their respective characteristics considering different prevailing mechanisms. Besides particle size distribution, the fractal dimension of the aggregates was also calculated during each stage. Since different stages of flocculation and breakage were performed, the re-flocculation ability of the flocs formed could also be evaluated.
In general, LDS can be used to optimize flocculation conditions, select the best polymer for the process considering the target flocs size and structure, and optimize the flocculant concentration.
LDS has also been used to optimize flocculation conditions in effluent treatment processes. Lourenço et al. [89] used LDS to optimize polymer dosage and polymer characteristics to treat, via flocculation, an industrial oily effluent from potato crisp manufacturing. In another study, Grenda et al. [12] used LDS to evaluate the performance of different cationic and anionic cellulose-based polyelectrolytes with different lignin content in the treatment, via flocculation, of a textile industry effluent, discussing the possible flocculation mechanisms.
When using LDS for the on-line monitoring of processes involving particulate systems, the main advantage is the fast continuous acquisition of the particle size distribution of the materials in the process. With this technique, it is possible to obtain full size distributions every few seconds, depending on the system. Moreover, with this technique, thousands of particles can be analyzed in each run. So, representativeness is another advantage. The wide range of particle sizes that can be analyzed (0.5–3000 µm), as well as the fact that no calibration is required constitutes another advantage of this technique. Additionally, more recently, the possibility of also retrieving information about particle structures [21] constitutes another advantage.
Regarding limitations, the main limitation is related to the range of concentrations that can be used, which involves relatively low concentrations. However, there have been improvements in the last few years; higher concentrations are now being analyzed, either by introducing corrections in the signal treatment model (Mie theory) or through improvements to the detection system. Another important feature is related to the optical properties of the system. Inaccuracies arise when the refractive indices of particles and media are very similar, even when using Mie theory to treat the signal. This is particularly relevant if loose aggregates are being analyzed. Additionally, the fouling of the measurement window can be a problem, even if strategies have been developed to avoid or minimize this problem, especially in dry systems [80,83,84].
In summary, LDS is now considered a process optimization tool that can supply fast information about the evolution of particle size in a system, helping to control and maintain product quality by continuously streaming data to the control room.
5. Focused Beam Reflectance Measurement—FBRM
The FBRM technique is a real-time (on-line) monitoring tool for the determination of the size and shape of particles in a process by measuring the chord length of the particles. Chord length distribution (CLD) provides indirect information about particle size distribution (PSD) [35].
The underlying principle of the FBRM instrument (from Mettler Toledo) consists of scanning with a highly focused rotating laser beam (an infrared laser) at a fixed speed (2 m/s) across particles in a suspension and the measurement of the time duration of the backscattered light from these particles. The sapphire window at the probe tip allows us to set the best focus point for the laser and for the propagation of the laser beam through the system of interest. The temporal duration of the reflection from each particle (measured crossing time) is multiplied by the velocity of the scanning laser and supplies information about a characteristic measurement of particle geometry, the chord length [35,90]. Figure 17 is a schematic representation of the FBRM probe.
The probe detects pulses of backscattered light and relates them to the scanned chord lengths of particles (see Figure 18).
Thousands of chord length measurements are collected per second. These measurements produce a chord length histogram in which the number of chords is sorted in different chord length intervals (bins) for a range of 0.5–1000 µm. For channel distribution, it is possible to use logarithmic or linear scales depending on which region a higher sensitivity is required for. Considering the width of the laser beam, lower-size-range acquisitions have a higher uncertainty. Some statistical parameters—such as mean chord length, square mean chord length, or cubic mean chord length; median; and the number of chords between any size interval—can be extracted from the measurements. The more counts/channels are acquired, the better the statistical stability is. Additionally, different strategies can also be used to represent the histogram, such as number weight, square weight, and cubic weight, which determine the sensitivity of the distribution to different regions of the population. Figure 19 presents an example of a chord length distribution obtained via FBRM.
FBRM can also supply information about the particle size distribution of the particle population. However, this requires a pre-definition/knowledge of the properties of the particles to build a preliminary 3D model that can be used to convert the chord length distribution into size distributions [90]. If no complementary information is available, in standard FBRM data treatment, the particles are assumed to be spherical to obtain the size distribution.
Previous studies have used a 2D representation of the particles to convert the chord length distribution (CLD) to a full particle size distribution (PSD). This, however, leads to a more inaccurate transformation of CLD into PSD [92]. Still, the construction of a 3D model also involves several assumptions; for example, the particles are assumed to be static with respect to the laser beam during the chord measurement. Considering the assumptions referred to, the CLD of a single particle is calculated, and this constitutes the characteristic fingerprint of the particle, which is then used to convert the CLD into a PSD. Pre-information about the shape of the particles is, of course, necessary for this conversion. Statistical and empirical models are usually favored when the objective is to transform the CLD into a particle size distribution [35,90].
It must be recalled that FBRM measurements can be affected by the distance of the particles from the laser focal point, continuous medium characteristics (for example, the refractive index), the refractive index of the particles, the existence of a multimodal size distribution in the sample, and the sample concentration [35,90]. Thus, it is important to control the operation conditions in the measurement system to guarantee a representative/accurate measurement. FBRM can be used in a particle size range of 0.5–1000 µm.
FBRM is mainly used as an in-line qualitative tool to access the evolution of particle characteristics in different processes. One of the main advantages is the fast acquisition of data, which allows for the monitoring of the rapid evolution of particle characteristics. Examples of processes where FBRM is used for in-line monitoring and, especially, processes where it is already being applied as a reference technique are as follows: crystallization processes, granulation processes, and flocculation/aggregation processes. In these processes, FBRM is used to monitor size change kinetics and to track qualitative trends in particle populations, providing good sensitivity to real-time changes in the count and dimensions of particle populations, with the potential to be used for control purposes.
In the case of crystallization, FBRM can be used to follow nucleation, crystal growth, agglomeration, attrition, and breakage of crystals [93,94,95]. It can be used to follow the progression of crystal size distribution in a batch crystallization process, that is, crystallization kinetics, even if it does not directly provide the crystal size distribution. Additionally, it allows for the evaluation of the response of crystallization to operation parameters such as solute concentration and temperature. So far, it has been used in both batch and continuous crystallization processes. In general, the FBRM technique shows potential to be part of process analytical technologies (PATs) to monitor and control crystallization processes.
Another frequently found application is the monitoring of mixing processes. This is, e.g., the case for the analysis of suspensions during the pre-clinical formulation stage in the pharmaceutical industry [96]. Using FBRM, it is possible to obtain real-time information on suspension characteristics. For instance, it allows for the rapid in situ analysis of system homogeneity. In these systems, FBRM can monitor particle sedimentation in the process, as well as the attrition of particles and subsequent size degradation during prolonged stirring. Also, in this case, it is possible to establish a correlation between particle concentration and count rate for lower particle sizes. Overall, FBRM has shown the potential to be a useful tool for qualitative and quantitative analyses of pharmaceutical suspensions.
In the case of flocculation, FBRM has proven to be suitable for the rapid analysis of flocculation processes [37]. It allows for the interpretation of the evolution of the flocculation process of suspended particles in real time. Through this monitoring, it is possible to optimize the flocculant dosage necessary for each type of suspension; to obtain insight into predominant flocculation mechanisms; and to evaluate floc stability, strength, and re-flocculation ability [34,37]. Thus, FBRM is a useful tool for optimizing flocculation in different processes, specifically in environmental applications and the pulp and paper industry.
FBRM has also been recently applied to real-time (on-line) monitoring in the fabrication of composite materials, especially in the synthesis of various polyacrylamide composite materials through an in situ polymerization process [97]. It could be effectively used for the determination of particle-size-change kinetics, providing an understanding of the material formation mechanism. FBRM can reveal different trends in particle size evolution depending on the nature of the filler and the composites produced.
The main advantage of this technique is related to the speed of acquisition, which allows for the monitoring of rapidly changing particulate systems and, thus, the acquisition of information about the kinetics of transformation. Thousands of chord lengths are counted every second, and a high sensitivity to changing particle sizes and counting can be achieved in real time [91]. Moreover, it allows for the evaluation of a wide range of particle sizes, going from 0.5 to 1000 µm. Also, as mentioned, it can be used up to intermediate concentrations and track changes in particle concentrations in an easy way.
The disadvantages of FBRM are related to some limitations regarding the optical properties of this system: a too-high refractive index in the medium can cause absorption of the laser beam by the carrier liquid and degrade the intensity of the focused beam. On the other hand, similar optical properties of the particles and the liquid can cause “chord splitting” phenomena (large and nearly transparent particles are not recognized as one chord but as multiple small chords), which affects the accuracy of the measurements. Because of these effects, some suspension characteristics can degrade the quality of the signal, for example, a high concentration of particles can degrade the intensity of the focused beam and the return signal. Fouling of the probe window can also have the same effect. Also, the measurement signal can be affected by the rotation velocity. Additionally, the count rate for very small particles is sometimes too low and affected by noise. Particles passing the measuring point must be sufficiently representative. FBRM is, in general, quite sensitive to experimental conditions; for instance, particle mean size and solid concentrations, as mentioned, have a significant impact on the total counts and fouling index. To achieve the best sensitivity, probe location, probe angle, the duration of data acquisition, and data averaging need to be optimized. For instance, placing the probe in an inclined position can reduce fouling.
In summary, FBRM can be considered a rather powerful PAT technique since it can be used on-line and in situ, without the need for sampling, to monitor changes in certain processes. CLD measurements provide, however, only indirect information about the particle size distribution, which, nevertheless, supplies information about the overall microscopic properties of interest to characterize the quality/characteristics of solid particles. Presently, studies are ongoing regarding the use of FBRM for control purposes in different processes, in particular, crystallization processes.
Monitoring Aggregation with FBRM
Regarding the monitoring of aggregation processes, FBRM has been mainly used to monitor flocculation processes [37,98], including re-flocculation ability [34]. Still, lately, FBRM has found application in the monitoring of other aggregation processes, including granulation processes [99], flotation during mineral treatment [100], and the onset of asphaltene aggregation during crude oil extraction or processing [36].
In the case of granulation, FBRM was applied to study, in-line, granule growth kinetics in a fluidized bed granulator [99]. The effect of different parameters on the granules’ growth was evaluated, and the spray rate was found to be the most significant factor. The CLD evolution measured by FBRM confirmed that the granule agglomeration was mainly dominated by the amount of binder on the granule surface. FBRM proved to be a valuable PAT tool to be applied to high shear granulation, supplying process information immediately and, thus, providing opportunities to control the granules’ growth.
FBRM has also been used recently to monitor in situ particle aggregation during the agitated flotation of chalcopyrite in saline water [100]. The objective was to evaluate kaolinite aggregation in order to assess which conditions lead to a reduction in kaolinite entrainment, thus guaranteeing the higher recovery of the floated chalcopyrite and a selective reduction in kaolinite entrainment. This study enables a better understanding of the selective entrainment of undesired particles/materials during mineral flotation, leading to the better design of future systems using different polymers.
In the case of a study directed at the monitoring of asphaltene aggregation, to mimic what happens during crude oil extraction or production, which can lead to plugging problems, FBRM was used to continuously monitor asphaltene aggregation in the presence of different precipitants, supplying the kinetic evolution of aggregate sizes [36]. In this case, FBRM presented the additional advantage of the capacity to be applied at higher pressures and temperatures in comparison with other techniques. In the study conducted, it was possible to identify the conditions that can lead to asphaltene aggregation, which should be avoided, and guarantee more stable asphaltenes.
So far, the most widely reported application of FBRM in the monitoring of aggregation processes is in the field of flocculation monitoring. The first studies in this field were from Blanco et al., who reported, for the first time, in 2001, the use of FBRM to measure flocculation related to papermaking [98]. Other studies from the same research group appeared later, also regarding the flocculation of filler in papermaking [37], with the objective of identifying the optimum flocculation conditions that allow for simultaneously good retention and drainage in papermaking, also guaranteeing the adequate re-flocculation of the suspension. According to Angles et al. [37], the availability of a sensor to directly monitor flocculation can considerably improve process control. FBRM can be used in the laboratory or directly on-line [37]. Using this monitoring strategy, it is possible to optimize the flocculant concentration and type for a certain pulp fraction and to determine the strength of the flocs, the behavior of the different types of flocs under the influence of shear forces, and the respective re-flocculation levels [37]. Thus, FBRM is a very useful tool for optimizing flocculation and providing a better understanding of flocculation mechanisms.
FBRM was also used by Antunes et al., 2015 [34], to continuously monitor the flocculation and re-flocculation of PCC-particles targeting applications in papermaking. The objective was to evaluate the possible advantages of using branched polyacrylamides in the flocculation process, specifically in relation to the size and structure of the obtained aggregates. However, since branched polymers can hinder the re-flocculation capacity of aggregates, the possibility of introducing clay particles (bentonite) into the system after aggregates breakage was also considered, leading to positive results. Figure 20 presents the kinetic curves obtained for this process, where FBRM was used to monitor the flocculation process, comparing results using a linear polymer and a branched polymer of a similar molecular weight.
It was found that bentonite significantly improved the re-flocculation stage, especially when the branched polymer E1++++ was used. In this study, FBRM monitoring was compared with monitoring using LDS. The trends obtained using both techniques were similar, even if the accurate monitoring of the initial instants of flocculation was more difficult when using FBRM. On the other hand, FBRM is better suited for speedy analysis of the flocculation processes.
In another study [101], FBRM was used to monitor, in real time, aggregate formation in kaolin suspensions, specifically with respect to the relationship between operation conditions and aggregate structure. Flocculation was conducted in a Couette mixing device. The influence of the co-addition of bentonite to enhance the flocculation process was also evaluated using FBRM. The advantages of using FBRM are most evident in the ability to capture the onset of aggregation, co-relating the FBRM response to a significant elevation of the settling rate. FBRM is a viable option for controlling the flocculation process and more effectively optimizing flocculant dosage requirements, identifying relative trends in the flocculation process as a function of different operation parameters. The responses for settling rate versus mean square-weighted chord length after flocculation could be used to successfully identify differences in the mineralogy of clays and differences in aggregate density due to mixing conditions during flocculation. In general, FBRM has shown the potential for flocculation control.
FBRM was also used in another study to monitor wastewater treatment systems [102]. FBRM was applied to a full-scale municipal wastewater treatment plant, measuring, in situ, activated floc size distributions. The issue of the optimal focal point was discussed in this study. It is essential to optimize the focal point of the FBRM probe. This is especially true for highly irregular particles and large flocs. The optimum focal point corresponds to the point leading to maximum reflectance. At high solid concentrations, the signal becomes increasingly shadowed with increasing focal distance. So, in concentrated suspensions, the focal point has to be close to the sapphire window. FBRM proved to be able to determine the spatial evolution of PSDs in settling tanks for a wide range of solid concentrations and to be able to be used in the evaluation of the performance of settling tanks.
In another study [103], FBRM was successfully used to evaluate, in-line, whether flocculation was occurring as expected during the production of cement reinforced with cellulose fibers. The measurements were performed in an industrial Hatschek machine using different mineral raw materials and flocculants. FBRM enabled the quantification of flocculation changes resulting from changes in flocculant dosage and the type of flocculant. Also, a good correlation was obtained between the FBRM data and the density of the final product. Thus, FBRM can be used as an alarm sensor to predict eventual quality problems related to low density values in the final product.
6. Ultrasonic Monitoring
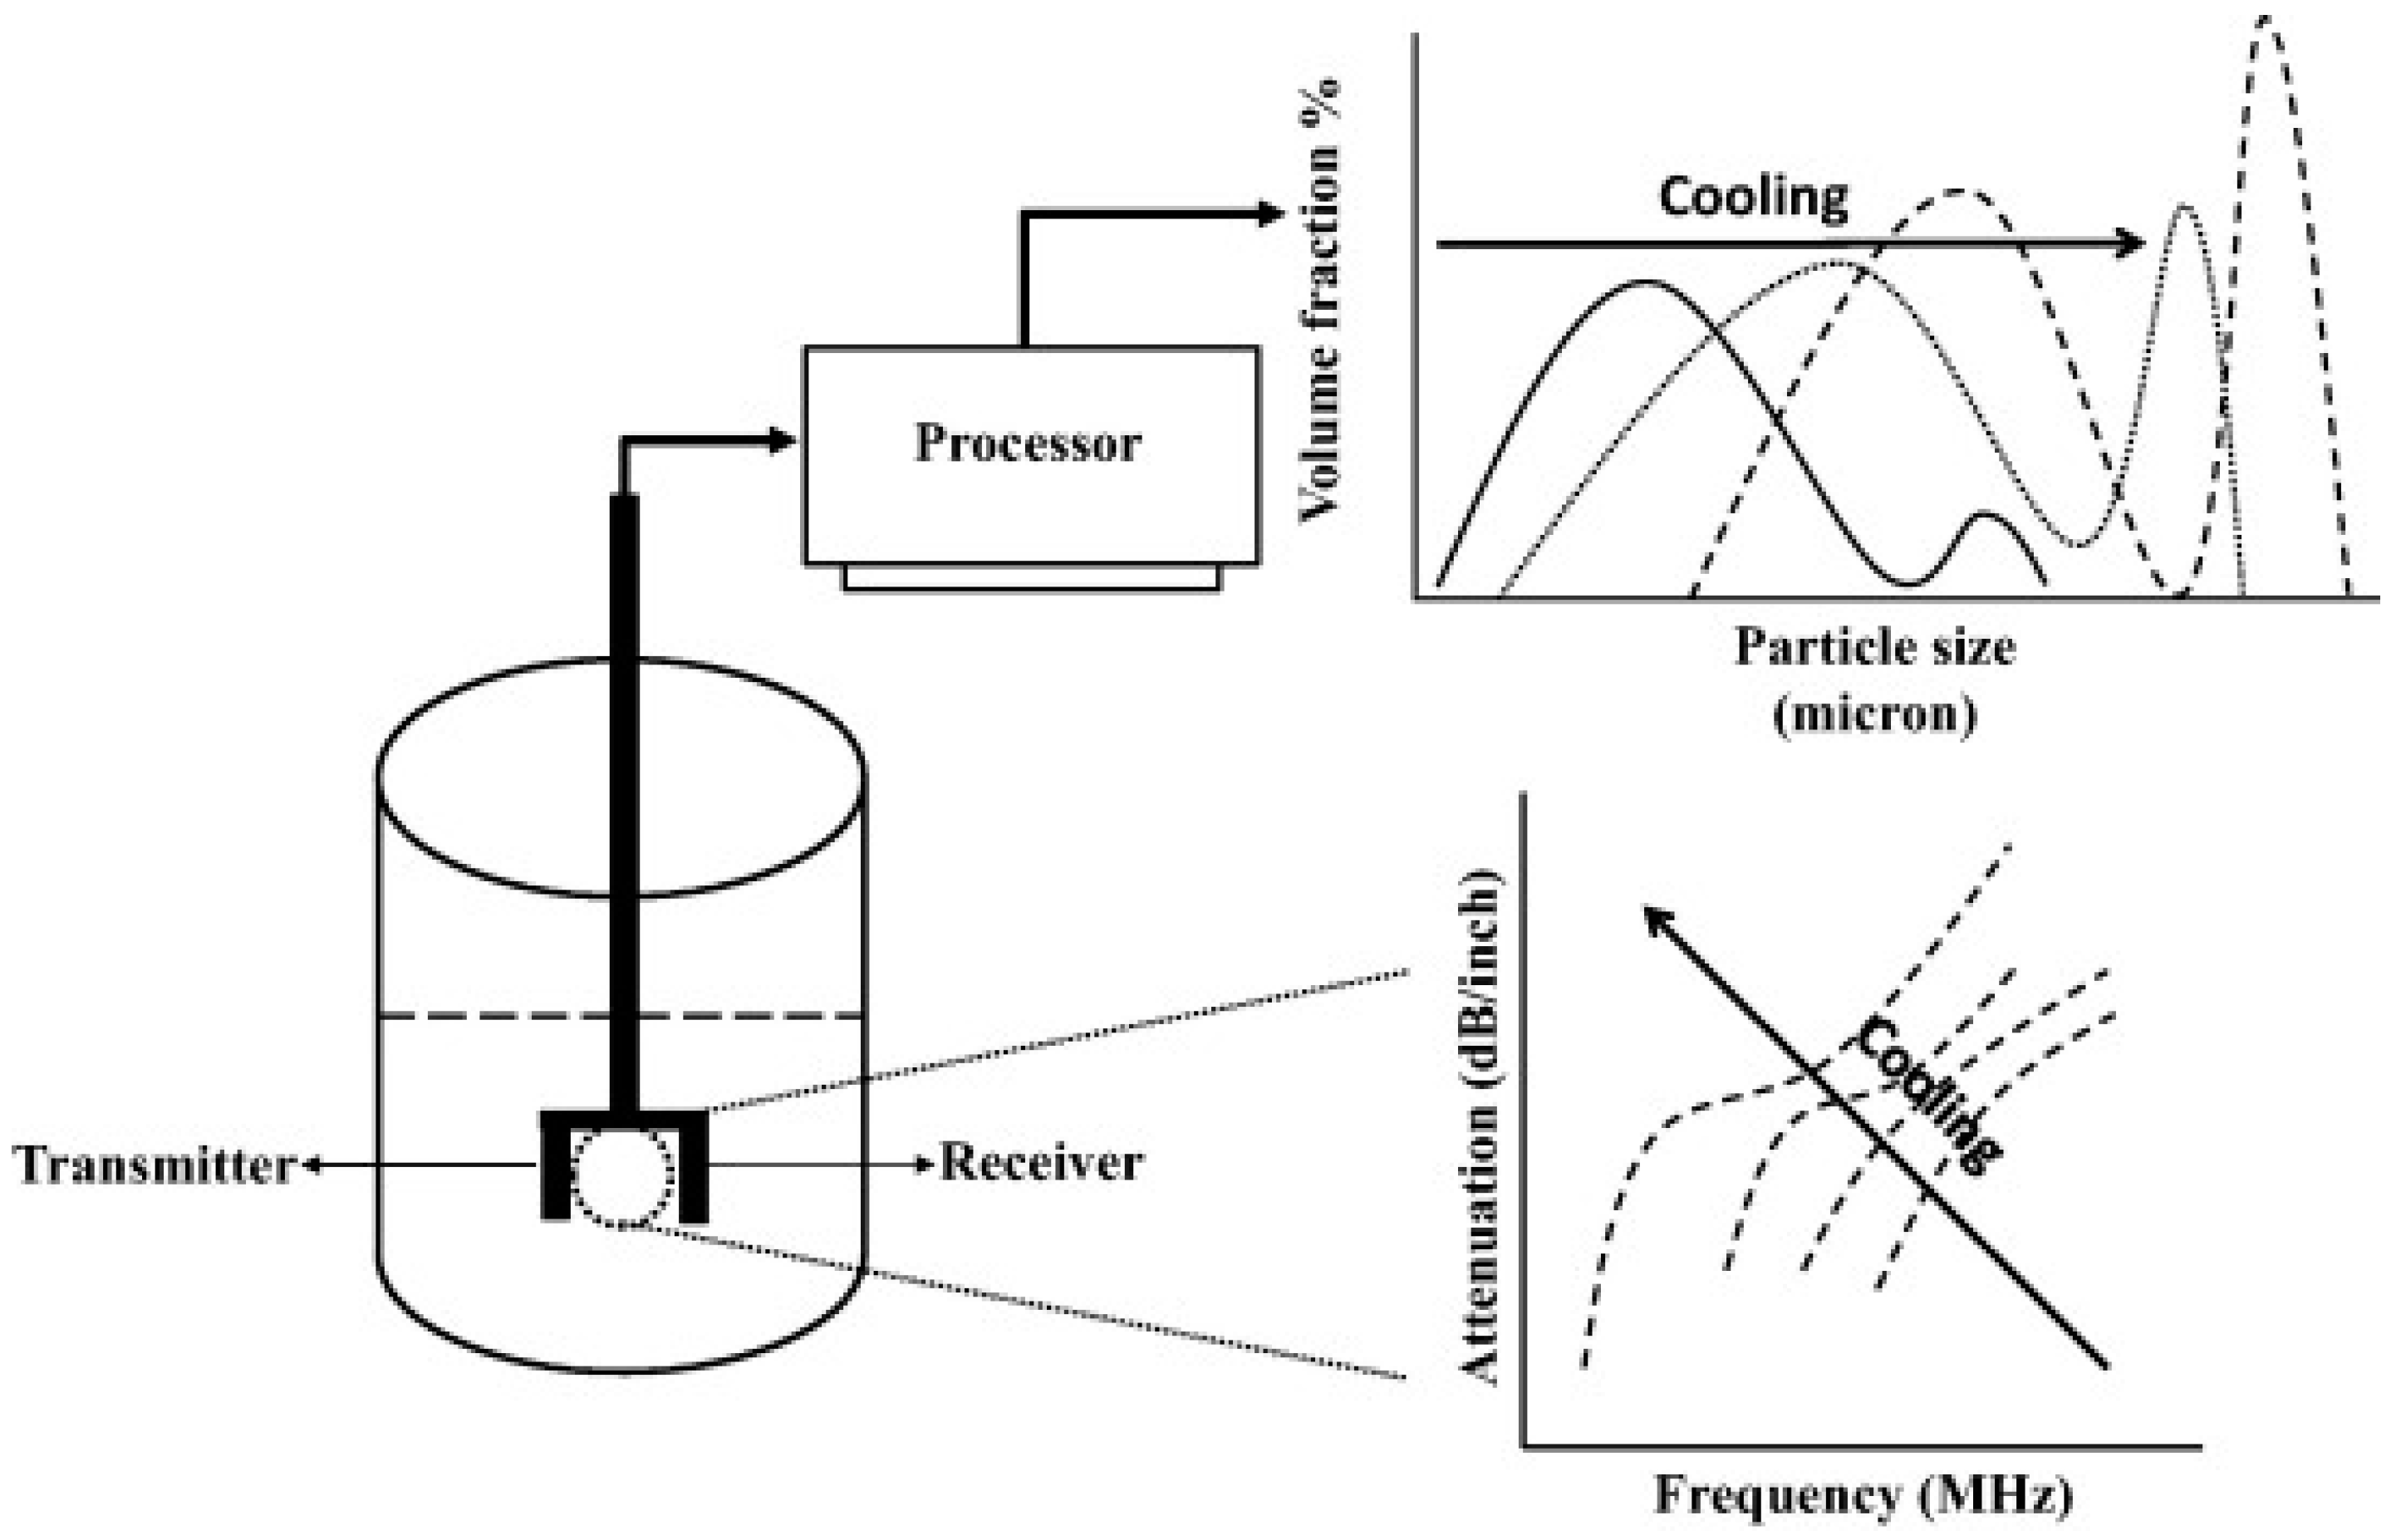
Ultrasonic techniques are quite common for characterizing colloidal dispersions and suspensions [104]. The attenuation of ultrasonic waves as a function of frequency depends on the concentration, size, and density of the particles. Figure 21 presents a typical scheme of an ultrasound attenuation device. Ultrasound typically works with concentrated systems that are out of reach for optical methods because of opacity [104]. Also, the technique is quite suited for on-line applications in process monitoring [104].
Ultrasound backscattering techniques have been developed for various health applications, including blood cell monitoring [105]. Analyses of changes in the scattering power spectrum of the echoes resulting from the interaction of ultrasound with particles have the potential to detect the particles’ structures. However, here, an adequate model is needed to treat the signal [106]; this can be, e.g., the structure factor model (SFM) [107].
In the case of ultrasound attenuation, particles affect the speed and attenuation of ultrasonic waves in a suspension, and an acoustic attenuation spectrum is obtained over a defined frequency range. Information is obtained by measuring the attenuation of a low acoustic wave by the disperse phase at various frequencies. The changes observed depend on the particle size and concentration. Acoustic wave attenuation via dispersion (α), as a function of frequency, is obtained based on the amplitude of the collected wave signal. The phase of the wave signal is used to determine the speed of sound through the dispersion [108]. The attenuation of sound by the suspension provides important information, particularly related to particle size and concentrations.
The interaction of ultrasound waves with particles is well described, in most cases, by the mathematical framework known as the ECAH theory (Epstein, Carhart, Allegro, and Hawley) [38,109], which predicts the attenuation spectrum by taking into account three main types of particle–wave interactions: thermo-elastic, scattering, and visco-elastic effects. This model can cover a wide range of particle sizes.
It has been demonstrated that acoustic spectroscopy, based on ultrasound attenuation, provides interesting information to monitor particulate processes, even if does not lead to precise PSD results [38].
Ultrasound backscattering analysis, has, so far, been mainly applied to blood control [97,106]. Here, the approach is to analyze the magnitude and frequency dependence of backscatter echoes when the ultrasound wave interacts with red blood cells (RBCs) [107]. Savery and Coultier, 2001 [107], proposed the structure factor model (SFM) to predict backscattering by RBCs or their respective aggregates. The structure factor is related to the standard Fourier transform of the projection on the ultrasound propagation axis of the total correlation function. The ultrasound scattering power strongly depends on the frequency. The slope of the scattering power versus frequency depends on the size of the disperse phase in a limited frequency range. As the disperse phase increases in size, the frequency dependence becomes weaker, and the scattering power increases. That is, both the frequency dependence and the intensity of the scattering power depend on the size of the disperse phase [105].
Another cellular ultrasound imaging technique, based on backscattering, uses the structure factor size and attenuation estimator (SFSAE) to estimate RBC size, including aggregate size [110]. In these systems, high-frequency ultrasounds are used. The SFSAE uses a spectral model that can extract information about the mean aggregate diameter based on the analysis of radio frequency echoes backscattered by blood.
From what has been presented, we can conclude that ultrasound (acoustic spectroscopy) can be applied to monitor on-line and in situ concentrated systems, allowing for the real-time monitoring and control of industrial processes. Also, these systems are robust enough to be placed, for instance, inside a chemical reactor, allowing for the real-time measurement of particle size and concentration, evidencing suitability to be used in an industrial environment. Despite its similarity to light-scattering techniques, the ultrasound technology is not restricted by the optical properties of the system. Also, it can be made portable and robust for application in hostile environments.
Additionally, as also referred to above, ultrasounds are a promising, reliable, and non-invasive tool for the in vivo measurement of RBC characteristics, including the presence of aggregates in the blood.
The application of ultrasound has been reported in the literature to monitor crystallization from solution, in real time, as shown in Figure 22, enabling to distinguish crystalline dispersion states and crystal morphology; obtaining the volume fraction of the disperse phase and the size of the particles, as well as the progress of the crystallization process; and detecting the final product forms [110,111,112].
The onset of crystallization can clearly be seen in the ultrasonic attenuation response, which increases significantly at that moment, particularly at high frequencies [112,113]. Ultrasonic attenuation is sensitive to the onset of nucleation. Ultrasounds have also been used to monitor the growth of the volume fractions of crystals. This type of monitoring can be important in different industrial sectors, particularly in the pharmaceutical and agrochemical sectors.
The long-term objective for ultrasonic characterization is to provide an on-line instrument that will measure crystal size distribution immediately after nucleation occurs and to update information in real time as crystal growth takes place. This technique has the potential to be incorporated into rugged instrumentation for monitoring crystallization in an industrial process environment.
Ultrasonic attenuation has also been used for the real-time monitoring of the size and concentration of nanoparticle synthesis [108], providing real-time monitoring of the growth of nanoparticles. Nanoparticles affect the speed and attenuation of ultrasonic waves through dispersion. This method is cheap and can perform measurements at high concentrations in opaque dispersions, allowing for real-time measurements. Ultrasounds can also be used to characterize colloidal dispersions, in real time, based on the attenuation approach [104].
At the industrial level, there are several industrial applications where a yes/no decision is required from a monitoring system to determine whether the production process remains within specifications. Ultrasound monitoring can provide this information.
In addition, it is also important to stress the application of ultrasonic monitoring based on ultrasound wave backscattering for monitoring, in vivo, blood cell aggregation in the human body, which can contribute to the development of vascular complications [105,110]. Studies have been conducted aimed at explaining factors affecting the frequency-dependent backscatter coefficient [106] and taking into account the attenuation effects of intervening tissues between the probe and the blood flow. In the case of ultrasonic blood characterization, the aim is to obtain quantitative parameters that reflect the RBCs’ state.
In what refers to aggregation monitoring, ultrasound measurements have been used in different systems/processes to detect the existence of aggregation or to monitor aggregate formation, including the kinetics of aggregation. This is, for instance, the case for the monitoring of shear-induced floc disruption in oil–water emulsions through the analysis of ultrasound attenuation [114] and also the monitoring of the flocculation of oil–water emulsions [115]. Also, ultrasound has been used to monitor, on-line, the aggregation of colloidal silica suspensions to evaluate the evolution of silica suspension properties during aggregation [38]. In all these studies, the main advantage observed was the capacity to test higher-concentration systems.
Regarding applications in health control, ultrasound techniques (based on backscattering) have been used in the last few years to monitor, in vivo, the aggregation of red blood cells [105,110], which can have strong health implications.
The application of ultrasounds to monitor aggregation processes will be discussed in more detail in the next section.
Monitoring Aggregation Processes Using Ultrasound
As noted, ultrasound has been used with success to monitor aggregation processes in different systems. When referring to industrial processes, aggregation monitoring using ultrasound is based on ultrasonic attenuation spectroscopy. The main advantage of this monitoring strategy is related to the fact that it can be applied in highly concentrated systems, even if the level of detail obtained is less than the one obtained when using other approaches, for example, light-scattering strategies [104].
In one study, ultrasonic attenuation was used to study the flocculation of oil–water emulsions, including the shear-induced disruption of the flocs, using low-intensity ultrasounds [114]. Ultrasound was successfully used to monitor the influence of shear on the flocculation of emulsions. At low frequencies, the attenuation coefficient decreased with increasing flocculation. The effect of surfactant concentration on emulsion flocculation was also studied using ultrasonic attenuation [115]. The attenuation spectrum of flocculated emulsions depends on the fraction of flocculated droplets, floc size, and the packing of droplets within the aggregate. Attenuation did reduce as the internal packing of the droplets within the floc increased. These studies did show that ultrasounds are sensitive to the state of aggregation of droplets in an emulsion and can be used to probe droplet–droplet interactions. The flocculation of droplets in emulsions can be monitored by measuring the frequency dependency of the attenuation coefficient. In summary, ultrasound offers a sensitive tool to investigate the structure of concentrated and optically opaque emulsions.
The studies discussed above showed that the ECAH theory, referred to previously, could be used to estimate the floc size of evolving flocs in an oil–water emulsion, assuming the thermo-physical properties of the flocs are similar to those of the individual droplets.
Regarding the flocculation of dense colloidal silica suspensions of high concentration, on-line acoustic spectroscopy was used in one study to evaluate the evolution of silica suspension properties during aggregation processes, under flow conditions [38], based on the analysis of the attenuation of the acoustic spectrum. Information about the size evolution of the aggregates and the suspension concentration can be obtained by analyzing the attenuation of ultrasound over a given frequency range. Again, the ECAH theory was used to predict the attenuation spectrum. The influence of physicochemical and hydrodynamic parameters on the aggregation process could be detected based on the acoustic attenuation spectra. The direct analysis of spectra could supply information on the kinetics of aggregation and also a fast comparison of the effect of different operation parameters on the aggregation process.
As referred to before, ultrasonic monitoring has also been used in health applications to evaluate the presence of red blood cell aggregates in blood, which can contribute to the development of vascular complications [106]. In this case, the strategy used is to monitor ultrasound backscattering. The objective is to obtain quantitative parameters that reflect the RBCs’ aggregation stage. One of the most relevant parameters is the aggregates’ size. The magnitude and frequency dependence of the backscattered echoes depend on the aggregation stage of the RBCs. A structure factor model (SFM) has been produced to predict backscattering by blood aggregates. This SFM sums the contributions from individual RBC interactions and models the cells’ interactions using a statistical mechanics structure factor [106]. The main limitation of this model is the assumption of isotropic aggregates, which can limit the use of the model in the case of pathological blood analysis. These techniques require the use of high-frequency ultrasounds.
Tripette et al. [110] developed a new ultrasound imaging technique using the structure factor size and attenuation estimator (SFSAE) to estimate, in vivo, RBC aggregate sizes in diabetic patients non-invasively and in real time. The SFSAE factor uses a spectral model to extract the mean aggregate diameter from the analysis of the backscattered ultrasound.
In a recent study, a new strategy for evaluating the condition of a patient’s blood using medical ultrasound—which uses two new parameters determined from changes in the backscattering power spectrum of the echoes from RBCs before and after the cessation of blood flow—was developed [105].
In summary, ultrasound backscattering has the potential to measure, non-invasively, RBC states, including their aggregation, in vivo and in situ, in flow conditions, specifically in abnormal blood conditions.
7. Final Remarks
Particle aggregation plays an important role in many industrial sectors. In many cases, aggregation is an important part of the process, but it can also be an undesired side effect. In both cases, monitoring and measuring the level of aggregation is essential for ensuring good performance in the process.
In this paper, we presented the current status of several methods for aggregate analysis. These techniques have developed rapidly during the last few years, to a large extent because of an increase in computing power and the development of new algorithms. On a laboratory scale, most of these methods are quite straightforward to use, but the in-line analysis of real industrial processes is often also possible with proper pre-arrangements, even if a lot of research is still required.
The discussed techniques have their advantages and disadvantages. Direct techniques, such as in-line microscopy and optical coherence tomography, have an advantage in that the interpretation of the measurement data is straightforward. Laser diffraction spectroscopy and focused beam reflectance measurement are very fast, but they require proper models to obtain the particle size distribution, especially for complex aggregates. Unlike other optical methods, OCT works for turbid fluids if scattering is not very intensive. Ultrasonic monitoring is a complementary method to optical methods, as it works for highly scattered turbid fluids. However, it also necessitates good models to transform the measurement data into meaningful information.
The presented methods offer a wide selection of options for both laboratory-scale investigations and in-line processes. These methods have different advantages and disadvantages, and the choice between them has to be made considering the specific needs and purpose of the application. In the future, the continuous improvement of these techniques, and possibly emerging new ones, will further help to improve process control, thus ensuring the desired results and products and reducing the undesirable consequences of particle aggregation in different industrial applications.
Author Contributions
Conceptualization, M.G.R. and A.K.; writing—original draft preparation, M.G.R. and A.K.; writing—review and editing, M.G.R. and A.K. All authors have read and agreed to the published version of the manuscript.
Funding
Maria Rasteiro acknowledges the funding of the Strategic Research Centre Project, UIDB00102/2020, funded by FCT (Fundação da Ciência e Tecnologia), Portugal (DOI: 10.54499/UIDB/00102/2020 and 10.54499/UIDP/00102/2020). The work by Antti Koponen was partly supported by the public project ImSol—Imaging Solutions for Industrial Applications, which was funded by Business Finland (1061/31/2020, primary funder), VTT Technical Research Centre of Finland Ltd., and 12 industrial partners.
Data Availability Statement
Not applicable.
Conflicts of Interest
The authors declare that this study received partial funding from a public project funded by Business Finland (1061/31/2020, primary funder), VTT and industrial partners. The funder was not involved in the study design, collection, analysis, interpretation of data, the writing of this article or the decision to submit it for publication.
References
- Esparza, T.; Ngo, T.B.; Fraschini, C.; Boluk, Y. Aggregate Morphology and Aqueous Dispersibility of Spray-Dried Powders of Cellulose Nanocrystals. Ind. Eng. Chem. Res. 2019, 58, 19926–19936. [Google Scholar] [CrossRef]
- Francia, V.; Martín, L.; Bayly, A.E.; Simmons, M.J.H. Particle Aggregation in Large Counter-current Spray Drying Towers: Nozzle Configuration, Vortex Momentum and Temperature. Procedia Eng. 2015, 102, 668–675. [Google Scholar] [CrossRef]
- Kano, T.; Yoshihashi, Y.; Yonemochi, E.; Terada, K. Clarifying the mechanism of aggregation of particles in high-shear granulation based on their surface properties by using micro-spectroscopy. Int. J. Pharm. 2014, 461, 495–504. [Google Scholar] [CrossRef]
- Myers, D. Surfaces, Interfaces, and Colloids: Principles and Applications, 2nd ed.; Wiley: Hoboken, NJ, USA, 2002. [Google Scholar]
- Parikh, D.M. (Ed.) Handbook of Pharmaceutical Granulation Technology, 2nd ed.; CRC Press: Boca Raton, FL, USA, 2005. [Google Scholar]
- Zbicinski, I.; Ciesielski, K.; Bangguo Ge, B. Mechanism of Particle Agglomeration for Single and Multi-Nozzle Atomization in Spray Drying: A Review. Processes 2022, 10, 727. [Google Scholar] [CrossRef]
- Fu, N.; Xiao, J.; Woo, M.W.; Chen, X.D. Frontiers in Spray Drying; CRC Press: Boca Raton, FL, USA, 2020. [Google Scholar]
- Antunes, E.; Garcia, F.A.P.; Ferreira, P.; Rasteiro, M.G. Flocculation of PCC for Papermaking: Influence of the Particle Characteristics. Chem. Eng. Res. Design 2008, 86, 1155–1160. [Google Scholar] [CrossRef]
- Cadotte, M.; Tellier, M.E.; Blanco, A.; Fuente, E.; van de Ven, T.G.M.; Paris, J. Flocculation, Retention and Drainage in Papermaking: A Comparative Study of Polymeric Additives. Can. J. Chem. Eng. 2008, 85, 240–248. [Google Scholar] [CrossRef]
- Horrocks, A.R.; Anand, S.C. (Eds.) Handbook of Technical Textiles; CRC Press: Boca Raton, FL, USA, 2000. [Google Scholar]
- Ives, J.K. (Ed.) The Scientific Basis of Flocculation; NATO Advanced Study Institute Series, Series E: Applied Science, Nr. 27; Springer Science & Business Media: Berlin/Heidelberg, Germany, 1978. [Google Scholar]
- Grenda, K.; Gamelas, J.A.F.; Arnold, J.; Cayre, O.J.; Rasteiro, M.G. Evaluation of Anionic and Cationic Pulp-Based Flocculants with Diverse Lignin Contents for Application in Effluent Treatment from the Textile Industry: Flocculation Monitoring. Front. Chem. 2020, 8, 5. [Google Scholar] [CrossRef]
- Teh, C.Y.; Budiman, P.M.; Shak, K.P.Y.; Wu, T.Y. Recent Advancement of Coagulation–Flocculation and Its Application in Wastewater Treatment. Ind. Eng. Chem. Res. 2016, 55, 4363–4389. [Google Scholar] [CrossRef]
- Bolto, B.; Gregory, J. Organic polyelectrolytes in water treatment. Water Res. 2007, 41, 2301–2324. [Google Scholar] [CrossRef] [PubMed]
- Knoll, P.; Stein-bock, O. Particle Aggregation Modifies Crystallization: Extending the Hierarchical Order of a Polycrystalline Material to the Macroscale. J. Phys. Chem. C 2018, 122, 23554–23563. [Google Scholar] [CrossRef]
- Mullin, J.W. Crystallization, 4th ed.; Butterworth Heinemann: Oxford, UK, 2001. [Google Scholar]
- Huawei, Y.; Lindström, T.; Christiernin, M. Some ways to decrease fibre suspension flocculation and improve sheet formation. Nord. Pulp Pap. Res. J. 2006, 21, 36–43. [Google Scholar] [CrossRef]
- Koponen, A.; Jäsberg, A.; Lappalainen, T.; Kiiskinen, H. The effect of in-line foam generation on foam quality and sheet formation in foam forming. Nord. Pulp Paper Res. J. 2018, 33, 482–495. [Google Scholar] [CrossRef]
- He, M.; Cho, B.U.; Won, J. Effect of precipitated calcium carbonate—Cellulose nanofibrils composite filler on paper properties. Carbohydr. Polym. 2016, 136, 820–825. [Google Scholar] [CrossRef]
- Fein, K.; Bousfield, D.; Gramlich, W. The influence of versatile thiol-norbornene modifications to cellulose nanofibers on rheology and film properties. Carbohydr. Polym. 2020, 230, 115672–115681. [Google Scholar] [CrossRef] [PubMed]
- Rasteiro, M.G.; Pinheiro, I.; Garcia, F.A.P.; Ferreira, P.; Hunkeler, D. Using light scattering to screen polyelectrolytes (PEL) performance in flocculation. Polymers 2011, 3, 915–927. [Google Scholar] [CrossRef]
- Biggs, S.; Habgood, M.; Jameson, G.J.; Yan, Y.D. Aggregate structures formed via a bridging flocculation mechanism. Chem. Eng. J. 2000, 80, 13–22. [Google Scholar] [CrossRef]
- Rasteiro, M.G.; Garcia, F.A.P.; Ferreira, P.; Blanco, A.; Negro, C.; Antunes, E. The use of LDS as a tool to evaluate flocculation mechanisms. Chem. Eng. Proc. 2008, 47, 1329–1338. [Google Scholar] [CrossRef]
- Gregory, J. Monitoring Particle Aggregation Processes. Adv. Colloid Interface Sci. 2009, 147–148, 109–123. [Google Scholar] [CrossRef] [PubMed]
- Serra, T.; Logan, B.E. Collision Frequencies of Fractal Bacterial Aggregates with Small Particles in a Sheared Fluid. Environ. Sci. Technol. 1999, 33, 2247–2251. [Google Scholar] [CrossRef]
- Antunes, E.; Garcia, F.A.P.; Ferreira, P.; Blanco, A.; Negro, C.; Rasteiro, M.G. Modelling PCC flocculation by bridging mechanism using population balances: Effect of polymer characteristics on flocculation. Chem. Eng. Sci. 2010, 65, 3798–3807. [Google Scholar] [CrossRef]
- Levente, L.; Patak, H.; Marosi, G.; Meemken, F.; Hungerbuhler, K.; Baiker, A.; Tummala, S.; Glennon, B.; Kuentz, M.; Steele, G.; et al. Assessment of recent process analytical technology (PAT) trends: A multiauthor review. Org. Proc. Res. Dev. 2015, 19, 3–62. [Google Scholar] [CrossRef]
- Emmerich, J.; Tang, Q.; Wang, Y.; Neubauer, P.; Junne, S.; Maaß, S. Optical inline analysis and monitoring of particle size and shape distributions for multiple applications: Scientific and industrial relevance. Chin. J. Chem. Eng. 2019, 27, 257–277. [Google Scholar] [CrossRef]
- Fischer, C.; Jaskulski, M.; Tsotsas, E. Inline method of droplet and particle size distribution analysis in di-lute disperse systems. Adv. Powder Technol. 2017, 28, 2820–2829. [Google Scholar] [CrossRef]
- Panckow, R.P.; Bliatsiou, C.; Nolte, L.; Böhm, L.; Maaß, S.; Kraume, M. Characterisation of particle stress in turbulent impeller flows utilising photo-optical measurements of a flocculation system—PART 1. Chem. Eng. Sci. 2023, 267, 118333–118353. [Google Scholar] [CrossRef]
- Drexler, W.; Fujimoto, J.G. (Eds.) Optical Coherence Tomography Technology and Applications; Springer: Berlin/Heidelberg, Germany, 2008. [Google Scholar]
- Popescu, D.; Choo-Smith, L.-P.; Flueraru, C.; Mao, Y.; Chang, S.; Disano, J.; Sherif, S.; Sowa, M. Optical coherence tomography: Fundamental principles, instrumental designs and biomedical applications. Biophys. Rev. 2011, 3, 155–169. [Google Scholar] [CrossRef] [PubMed]
- Koponen, A.; Haavisto, S. Analysis of industry-related flows by optical coherence tomography—A review. KONA Powder Part. J. 2020, 37, 42–63. [Google Scholar] [CrossRef]
- Antunes, E.; Garcia, F.A.P.; Blanco, A.; Negro, C.; Rasteiro, M.G. Evaluation of the flocculation and re-flocculation performance of a system with calcium carbonate, cationic acrylamide copolymers and bentonite microparticles. Ind. Eng. Chem. Res. 2015, 54, 198–206. [Google Scholar] [CrossRef]
- Heath, A.R.; Fawell, P.D.; Bahri, P.A.; Swift, J.D. Estimating Average Particle Size by Focused Beam Reflectance Measurement (FBRM). Part. Part. Syst. Charact. 2002, 19, 84–95. [Google Scholar] [CrossRef]
- Gimenez-Aguirre, R.; Dufour, J.; Calles, J.A.; Marugán, J. Using Focused Beam Laser Reflectance Measurements to Determine Asphaltene Aggregation Stability. Energy Fuels 2022, 36, 6058–6068. [Google Scholar] [CrossRef]
- Blanco, A.; Fuente, E.; Negro, C.; Tijero, J. Flocculation monitoring: Focused beam reflectance measurement as a measurement tool. Can. J. Chem. Eng. 2002, 80, 1–7. [Google Scholar] [CrossRef]
- Tourbin, M.; Francis, C. Monitoring of the aggregation process of dense colloidal silica suspensions in a stirred tank by acoustic spectroscopy. Powder Technol. 2009, 190, 25–30. [Google Scholar] [CrossRef]
- Chen, J.; Kazzaz, A.E.; AlipoorMazandarani, N.; Feizi, Z.H.; Fatehi, P. Production of Flocculants, Adsorbents, and Dispersants from Lignin. Molecules 2018, 23, 868. [Google Scholar] [CrossRef] [PubMed]
- Thill, A.; Spalla, O. Aggregation due to capillary forces during drying of particle submonolayers. Colloids Surf. A Physicochem. Eng. Asp. 2003, 217, 143–151. [Google Scholar] [CrossRef]
- Soos, M.; Moussa, A.S.; Ehrl, L.; Sefcik, J.; Wu, H.; Morbidelli, M. Effect of shear rate on aggregate size and morphology investigated under turbulent conditions in stirred tank. J. Colloid Interface Sci. 2008, 319, 577–589. [Google Scholar] [CrossRef] [PubMed]
- Watano, S.; Miyanami, K. Image processing for on-line monitoring of granule size distribution and shape in fluidized bed granulation. Powder Technol. 1995, 83, 55–60. [Google Scholar] [CrossRef]
- Barret, P. Selecting in-process particle-size analyzers. Chem. Eng. Prog. 2003, 99, 26–32. [Google Scholar]
- Gerristen, J.W.; Li, R.; Penchev, R.; Wang, X.Z.; Roberts, K.J.; Tweedie, R. Online shape analysis of particles using an in-situ vision system. In Proceedings of the Control of Particulate Processes VII Intelligent Sensing and Control—The Path to Manufacturing Excellence, Harrison Hot Springs, BC, Canada, 29 October–2 November 2006. [Google Scholar]
- Kacker, R.; Maaβ, S.; Emmerich, J.; Kramer, H. Application of inline imaging for monitoring crystallization process in a continuous oscillatory baffled crystallizer. AIChE J. 2018, 64, 2450–2461. [Google Scholar] [CrossRef]
- Maaβ, S.; Wollny, S.; Voigt, A.; Kraume, M. Experimental comparison of measurement techniques for drop size distributions in liquid/liquid dispersions. Exp. Fluids 2011, 50, 259–269. [Google Scholar] [CrossRef]
- Sopat. Available online: https://www.parsum.de/en/ (accessed on 15 November 2023).
- Maaβ, S.; Rojahn, J.; Hänsch, R.; Kraume, M. Automated drop detection using image analysis for online particle size monitoring in multiphase systems. Comput. Chem. Eng. 2012, 45, 27–37. [Google Scholar] [CrossRef]
- Panckow, R.P.; Comandè, G.; Maaβ, S.; Kraume, M. Determination of particle size distributions in multiphase systems containing nonspherical fluid particles. Chem. Eng. Technol. 2005, 38, 2011–2016. [Google Scholar] [CrossRef]
- Amokrane, A.; Maaβ, S.; Lamadie, F.; Puel, F.; Charton, S. On droplets size distribution in a pulsed column. Part I: In-situ measurements and corresponding CFD-PBE simulations. Chem. Eng. J. 2016, 296, 366–376. [Google Scholar] [CrossRef]
- Stuber, A.; Auer, G.; Fischlechner, M.; Wockstrom, C.; Reiter, L.; Lutsch, E.; Simon-Nobbe, B.; Marozin, S.; Lepperdinger, G. Low-cost devices for three-dimensional cell aggregation, real-time monitoring microscopy, microfluidic immunostaining, and deconvolution analysis. Bioengineering 2022, 9, 60. [Google Scholar] [CrossRef]
- Costa, J.C.; Mesquita, D.P.; Amaral, A.L.; Alves, M.M.; Ferreira, E.C. Quantitative image analysis for the characterization of microbial aggregates in biological wastewater treatment: A review. Env. Sci. Pollut. Res. 2013, 20, 5887–5912. [Google Scholar] [CrossRef]
- Neu, T.R.; Manz, B.; Volke, F.; Dynes, J.J.; Hitchcock, A.P.; Lawrence, J.R. Advanced imaging techniques for assessment of structure, composition and function in biofilm systems. FEMS Microbiol. Ecol. 2010, 72, 1–21. [Google Scholar] [CrossRef] [PubMed]
- Drexler, W.; Liu, M.; Kumar, A.; Kamali, T.; Unterhuber, A.; Leitgeb, R.A. Optical coherence tomography today: Speed, contrast, and multimodality. J. Biomed. Opt. 2014, 19, 071412. [Google Scholar] [CrossRef] [PubMed]
- Aumann, S.; Donner, S.; Fischer, J.; Müller, F. Optical Coherence Tomography (OCT): Principle and Technical Realization. In High-Resolution Imaging in Microscopy and Ophthalmology; Bille, J., Ed.; Springer: Berlin/Heidelberg, Germany, 2019. [Google Scholar] [CrossRef]
- Song, G.; Harding, K. OCT for industrial applications. In Proceedings of the Optical Metrology and Inspection for Industrial Applications II, Beijing, China, 5–7 November 2012; Harding, K.G., Huang, P.S., Yoshizawa, T., Eds.; SPIE: Bellingham, DC, USA, 2012; Volume 8563. article 85630N. [Google Scholar] [CrossRef]
- Kawasaki, M. Optical Coherence Tomography; InTechOpen: London, UK, 2013. [Google Scholar]
- Yoshizawa, T. Handbook of Optical Metrology, Principles and Applications, 2nd ed.; CRC Press: Boca Raton, FL, USA, 2015. [Google Scholar]
- Hierzenberger, P.; Leiss-Holzinger, E.; Heise, B.; Stifter, D.; Eder, G. In-situ optical coherence tomography (OCT) for the time-resolved investigation of crystallization processes in polymers. Macromolecules 2014, 47, 2072–2079. [Google Scholar] [CrossRef] [PubMed]
- Awaja, F.; Arhatari, B.; Wiesauer, K.; Leiss, E.; Stifter, D. An investigation of the accelerated thermal degradation of different epoxy resin composites using X-ray microcomputed tomography and optical coherence tomography. Polym. Degrad. Stab. 2009, 94, 1814–1824. [Google Scholar] [CrossRef]
- Lawman, S.; Williams, B.; Zhang, J.; Shen, Y.C.; Zheng, Y. Scanless line field optical coherence tomography, with automatic image segmentation, as a measurement tool for automotive coatings. Appl. Sci. 2017, 7, 351. [Google Scholar] [CrossRef]
- Schneider, S.; Eppler, F.; Weber, M.; Olowojoba, G.; Weiss, P.; Hübner, C.; Mikonsaari, I.; Freude, W.; Koos, C. Multiscale dispersion-state characterization of nanocomposites using optical coherence tomography. Sci. Rep. 2016, 6, 31733–31745. [Google Scholar] [CrossRef] [PubMed]
- Markl, D.; Zettl, M.; Hannesschläger, G.; Sacher, S.; Leitner, M.; Buchsbaum, A.; Khinast, J. Calibration-free in-line monitoring of pellet coating processes via optical coherence tomography. Chem. Eng. Sci. 2015, 125, 200–208. [Google Scholar] [CrossRef]
- Hou, J.; Wang, C.; Rozenbaum, R.; Gusnaniar, N.; de Jong, D.; Woudstra, W.; Geertsema-Doornbusch, G.I.; Atema-Smit, J.; Sjollema, J.; Ren, Y.; et al. Bacterial density and biofilm structure determined by optical coherence tomography. Sci. Rep. 2019, 9, 9794–9806. [Google Scholar] [CrossRef]
- Sewalt, E.J.G.; Kalkman, J.; van Ommen, J.R.; Meesters, G.M.H.; van Steijn, V. Revealing how maltodextrin-containing droplets dry using optical coherence tomography. Food Res. Int. 2022, 157, 111049–111058. [Google Scholar] [CrossRef]
- Jäsberg, A.; Turpeinen, T.; Tanaka, A.; Ketola, A.; Järvinen, M.; Ojaniemi, U.; Pättikangas, T.; Koponen, A. Fouling dynamics of SMUF on a plate heat exchanger. Heat Transf. Eng. 2022, 43, 1387–1395. [Google Scholar] [CrossRef]
- Haavisto, S.; Salmela, S.; Jäsberg, A.; Saarinen, T.; Sorvari, A.; Koponen, A. Rheological characterization of MFC using Optical Coherence Tomography. TAPPI J. 2015, 14, 291–302. [Google Scholar] [CrossRef]
- Haavisto, S.; Koponen, A.; Salmela, J. New insight into rheology and flow properties of complex fluids with Doppler optical coherence tomography. Front. Chem. 2014, 2, 27. [Google Scholar] [CrossRef] [PubMed]
- Lauri, J.; Bykov, A.; Fabritius, T. Quantification of cell-free layer thickness and cell distribution of blood by optical coherence tomography. J. Biomed. Opt. 2016, 21, 40501–40505. [Google Scholar] [CrossRef] [PubMed]
- Meeuw, H.; Körbelin, J.; von Bernstorff, D.; Augustin, T.; Liebig, W.V.; Fiedler, B. Smart dispersion: Validation of OCT and impedance spectroscopy as solutions for in-situ dispersion analysis of CNP/EP-composites. Materialia 2018, 1, 85–197. [Google Scholar] [CrossRef]
- Saarinen, T.; Haavisto, S.; Sorvari, A.; Salmela, J.; Seppälä, J. The effect of wall depletion on the rheology of microfibrillated cellulose water suspensions by optical coherence tomography. Cellulose 2014, 21, 1261–1275. [Google Scholar] [CrossRef]
- Kataja, M.; Haavisto, S.; Lehto, R.; Salmela, J.; Koponen, A. Characterization of micro-fibrillated cellulose fiber suspension flow using multi-scale velocity profile measurements. Nord. Pulp Pap. Res. J. 2017, 32, 473–482. [Google Scholar] [CrossRef]
- Koponen, A.; Lauri, J.; Haavisto, S.; Fabritius, T. Rheological and flocculation analysis of microfibrillated cellulose suspension using optical coherence tomography. Appl. Sci. 2018, 8, 755. [Google Scholar] [CrossRef]
- Lauri, J.; Haavisto, S.; Salmela, J.; Miettinen, A.; Fabritius, T.; Koponen, A. Online measurement of floc size, viscosity, and consistency of cellulose microfibril suspensions with optical coherence tomography. Cellulose 2021, 28, 3373–3387. [Google Scholar] [CrossRef]
- Otsu, N. A threshold selection method from gray-level histograms. IEEE Trans. Syst. Man Cybern. 1979, 9, 62–66. [Google Scholar] [CrossRef]
- Xu, R. Particle Characterization: Light Scattering Methods; Kluwer Pub.: Dordrecht, The Netherlands, 2000. [Google Scholar]
- Liao, J.Y.; Selomulya, C.; Bushell, G.; Bickert, G.; Amal, R. On different approaches to estimate the mass fractal dimension of coal aggregates. Part. Part. Syst. Charact. 2005, 22, 299–309. [Google Scholar] [CrossRef]
- Mietta, F.; Chassagne, C.; Winterwerp, J.C. Shear-induced flocculation of a suspension of kaolinite as function of pH and salt concentration. J. Colloid Interface Sci. 2009, 336, 134–141. [Google Scholar] [CrossRef] [PubMed]
- Antunes, E.; Garcia, F.A.P.; Ferreira, P.; Rasteiro, M.G. Evaluation of Polyelectrolytes Performance on PCC Flocculation Using the LDS Technique. Part. Sci. Technol. J. 2010, 28, 426–441. [Google Scholar] [CrossRef]
- Ma, Z.; van der Veen, H.; Merkus, H.G.; Scarlett, B. In-line particle size measurement for control of jet milling. Part. Part. Syst. Charact. 2001, 18, 99–106. [Google Scholar] [CrossRef]
- Brown, D.J.; Alexander, K. Rates of nucleation in the crystallization of sucrose. J. Cryst. Growth 1992, 118, 464–466. [Google Scholar] [CrossRef]
- Inaba, K.; Matsumoto, K. Continuous measurement of crystal number concentration in crystallization of fructose by laser diffraction method. J. Chem. Eng. Jpn. 1998, 31, 122–125. [Google Scholar] [CrossRef]
- Malvern Panalytical. Available online: https://www.malvernpanalytical.com/en/products/product-range/insitec-range (accessed on 20 November 2023).
- Chan, L.W.; Tan, L.H.; Heng, P.W.S. Process analytical technology: Application to particle sizing in spray drying. AAPS Pharm. Sci. Technol. 2008, 9, 259–266. [Google Scholar] [CrossRef]
- Rasteiro, M.G.; Garcia, F.A.P.; Ferreira, P.; Antunes, E.; Wandrey, C.; Hunkeler, D. Flocculation by cationic polyelectrolytes: Relating efficiency with polymer characteristics. J. Appl. Polym. Sci. 2010, 116, 3603–3612. [Google Scholar] [CrossRef]
- Antunes, E.; Garcia, F.A.P.; Ferreira, P.; Blanco, A.; Negro, C.; Rasteiro, M.G. Effect of Water Cationic Content on Flocculation, Flocs Resistance and Reflocculation Capacity of PCC Induced by Polyelectrolytes. I ECR J. 2008, 47, 6006–6013. [Google Scholar] [CrossRef]
- Wilkinson, N.; Metaxas, A.; Brichetto, E.; Wickramaratne, S.; Reineke, T.M.; Dutcher, C.S. Ionic strength dependence of aggregate size and morphology on polymer clay flocculation. Colloids Surf. A 2017, 529, 1037–1046. [Google Scholar] [CrossRef]
- Guérin, L.; Frances, C.; Liné, A.; Coufort-Saudejau, C. Fractal dimensions and morphological characteristics of aggregates formed in different physicochemical and mechanical flocculation environments. Colloids Surf. A 2019, 560, 213–222. [Google Scholar] [CrossRef]
- Lourenco, A.; Arnold, J.; Cayre, O.J.; Rasteiro, M.G. Flocculation Treatment of an Industrial Effluent: Performance Assessment by Laser Diffraction Spectroscopy. I ECR J. 2018, 57, 2628–2637. [Google Scholar] [CrossRef]
- Ruf, A.; Worlitschek, J.; Mazzotti, M. Modeling and experimental analysis of PSD measurements through FBRM. Part. Part. Syst. Charact. 2000, 17, 167–179. [Google Scholar]
- Mettler Toledo. Available online: https://www.mt.com/es/en/home/products/L1_AutochemProducts/particle-size-analyzers/particletrack-fbrm.html (accessed on 3 January 2023).
- Tadayyon, A.; Rohani, S. Determination of particle size distribution by par-tec 100: Modeling and experimental results. Part. Part. Syst. Charact. 1998, 15, 127–135. [Google Scholar] [CrossRef]
- Barthe, S.; Rousseau, W. Utilization of focused beam reflectance measurement in the control of crystal size distribution in a batch cooled crystallizer. Chem. Eng. Technol. 2006, 29, 206–211. [Google Scholar]
- Acevedo, D.; Wu, W.L.; Yang, X.; Pavurala, N.; Mohammad, A.; O’Connor, T.F. Evaluation of focused beam reflectance measurement (FBRM) for monitoring and predicting the crystal size of carbamazepine in crystallization processes. RSC Cryst. Eng. Comm. 2021, 23, 972–985. [Google Scholar] [CrossRef]
- Pandalaneni, K.; Amamcharia, J.K. Focused beam reflectance measurement as a tool for in situ monitoring of the lactose crystallization process. J. Dairy Sci. 2016, 99, 5244–5253. [Google Scholar] [CrossRef] [PubMed]
- Dave, K.; Luner, P.E.; Forness, C.; Baker, D.; Jankovsky, C.; Chen, S. Feasibility of focused reflectance measurement (FBRM) for analysis of pharmaceutical suspensions in preclinical development. AAPS Phar. Sci. Technol. 2018, 19, 155–165. [Google Scholar] [CrossRef] [PubMed]
- Sankaranarayanan, S.; Likozar, B.; Navia, R. Real-time particle size analysis using the focused beam reflectance measurement probe for in-situ fabrication of polyacrylamide-filler composite materials. Sci. Rep. 2019, 9, 10126–10138. [Google Scholar] [CrossRef]
- Blanco, A.; Fuente, E.; Negro, C.; Monte, C.; Tijero, J. FBRM as a tool to measure flocculation. In Proceedings of the TAPPI Papermakers Conference, Cincinnati, OH, USA, 11 March 2001. [Google Scholar]
- Hu, X.; Cunningham, J.C.; Winstead, D. Study growth kinetics in fluidized bed granulation with at-line FBRM. Int. J. Pharm. 2008, 347, 54–61. [Google Scholar] [CrossRef]
- Chimonyo, W.; Peng, Y. Selective inhibition of kaolinite entrainment during chalcopyrite flotation in saline water. Miner. Eng. 2022, 184, 107637–107649. [Google Scholar] [CrossRef]
- Kyodaa, Y.; Costine, A.D.; Fawellb, P.D.; Bellwood, J.; Das, G.K. Using focused beam reflectance measurement (FBRM) to monitor aggregates structures formed in flocculated clay suspensions. Miner. Eng. 2019, 138, 148–160. [Google Scholar] [CrossRef]
- De Clercq, B.; Lant, P.A.; Vanrolleghem, P.A. Focused beam reflectance technique for in situ particle sizing in wastewater treatment settling tanks. J. Chem. Technol. Biotechnol. 2004, 79, 610–618. [Google Scholar] [CrossRef]
- Negro, C.; Blanco, A.; San Pío, I.; Tijero, J. In-line flocculation monitoring in a Hatschek machine for fibre-cement manufacture. Compos. Part A 2007, 38, 26–33. [Google Scholar] [CrossRef]
- Challis, R.E.; Povey, M.J.W.; Mather, M.L.; Holmes, A.K. Ultrasound techniques for characterizing colloidal dispersions. Rep. Prog. Phys. 2005, 68, 1541–1637. [Google Scholar] [CrossRef]
- Sakaki, H.; Arakawa, M.; Yashiro, S.; Todate, Y.; Ishigaki, Y.; Kanai, H. Ultrasound scattering by aggregated red blood cells in patients with diabetes. J. Med. Ultrason. 2019, 46, 3–14. [Google Scholar] [CrossRef] [PubMed]
- Franceschini, E.; Cloutier, G. Modeling of Ultrasound Backscattering by Aggregating Red Blood Cells, Quantitative Ultrasound in Soft Tissues; Mamou, J., Oelze, M.L., Eds.; Springer: Berlin/Heidelberg, Germany, 2013; pp. 117–145. [Google Scholar]
- Savery, D.; Cloutier, G. A point process approach to assess the frequency dependence of ultrasound backscattering by aggregating red blood cells. J. Acoust. Soc. Am. 2001, 110, 3252–3262. [Google Scholar] [CrossRef]
- Van Groenestijn, G.J.; Meulendijks, N.; Van Ee, R.; Volker, A.; Van Neer, P.; Buskens, P.; Julien, C.; Verheijen, M. Qualification of an Ultrasonic Instrument for Real-Time Monitoring of Size and Concentration of Nanoparticles during Liquid Phase Bottom-Up Synthesis. Appl. Sci. 2018, 8, 1064. [Google Scholar] [CrossRef]
- Epstein, P.S.; Carhart, R.R. The absorption of sound in suspensions and emulsions. I. Water Fog in Air. J. Acoust. Soc. Am. 1953, 25, 553–565. [Google Scholar] [CrossRef]
- Tripette, J.; Nguyen, L.-C.; Allard, L.; Robillard, P.; Soulez, G.; Cloutier, G. In Vivo Venous Assessment of Red Blood Cell Aggregate Sizes in Diabetic Patients with a Quantitative Cellular Ultrasound Imaging Method: Proof of Concept. PLoS ONE 2015, 10, e0124712–e0124724. [Google Scholar] [CrossRef] [PubMed]
- Marshall, T.; Tebbutt, J.S.; Challis, R.E. Monitoring the crystallization from solution of a reactive dye by ultrasound. Meas. Sci. Technol. 2000, 11, 509–517. [Google Scholar] [CrossRef]
- Prasad, R.; Dalvi, S.V. Sonocrystallization: Monitoring and controlling crystallization using ultrasound. Chem. Eng. Sci. 2020, 226, 115911–115940. [Google Scholar] [CrossRef]
- Hipp, A.K.; Walker, B.; Mazzotti, M.; Morbidelli, M. In-Situ Monitoring of Batch Crystallization by Ultrasound Spectroscopy. Ind. Eng. Chem. Res. 2000, 39, 783–789. [Google Scholar] [CrossRef]
- Chanamai, R.; Herrmann, N.; McClements, D.J. Ultrasonic Spectroscopy Study of Flocculation and Shear-Induced Floc Disruption in Oil-in-Water Emulsions. J. Colloid Interface Sci. 1998, 204, 268–276. [Google Scholar] [CrossRef]
- McClements, D.J. Ultrasonic determination of depletion flocculation in oil-in-water emulsions containing a non-ionic surfactant. Colloids Surf. A Physicochem. Eng. Asp. 1994, 90, 25–35. [Google Scholar] [CrossRef]
Figure 1.
Lennard–Jones Diagram: influence of electric double layer thickness on the energy barrier.
Figure 1.
Lennard–Jones Diagram: influence of electric double layer thickness on the energy barrier.

Figure 2.
Scheme of the patching mechanism in aggregation (according to Bolto [14]).
Figure 2.
Scheme of the patching mechanism in aggregation (according to Bolto [14]).

Figure 3.
Scheme of the bridging mechanism in aggregation (adapted from Jiachuan Chen et al., 2018 [39]).
Figure 3.
Scheme of the bridging mechanism in aggregation (adapted from Jiachuan Chen et al., 2018 [39]).

Figure 4.
Scheme of a photo-optical probe (SOPAT) and examples of images collected [45].
Figure 4.
Scheme of a photo-optical probe (SOPAT) and examples of images collected [45].

Figure 5.
Main steps employed in the two image analysis procedures (pattern matching and segmentation-based processing) [44].
Figure 5.
Main steps employed in the two image analysis procedures (pattern matching and segmentation-based processing) [44].

Figure 6.
(a) Measurement of capillary flow with the Telesto I SD-OCT by Thorlabs, Inc., Newton, NJ, USA. (b) A Rheo–OCT setup where a Telesto I SD-OCT has been combined with a TA instruments rheometer with a transparent vane-in-cup geometry.
Figure 6.
(a) Measurement of capillary flow with the Telesto I SD-OCT by Thorlabs, Inc., Newton, NJ, USA. (b) A Rheo–OCT setup where a Telesto I SD-OCT has been combined with a TA instruments rheometer with a transparent vane-in-cup geometry.

Figure 8.
A light microscopy image of the commercial-grade CMF Celish® KY-100G from Daicel Chemical Industries, Tokyo, Japan. (Image taken by Ulla Salo, VTT).
Figure 8.
A light microscopy image of the commercial-grade CMF Celish® KY-100G from Daicel Chemical Industries, Tokyo, Japan. (Image taken by Ulla Salo, VTT).

Figure 9.
The measurement configuration of Lauri et al. [74]. The CMF suspension was pumped from the fluid tank to the pipe, which included the flow rate sensor and the temperature control unit. OCT and pressure loss measurements were performed in the loop section, which consisted of a glass pipe.
Figure 9.
The measurement configuration of Lauri et al. [74]. The CMF suspension was pumped from the fluid tank to the pipe, which included the flow rate sensor and the temperature control unit. OCT and pressure loss measurements were performed in the loop section, which consisted of a glass pipe.

Figure 10.
An example of a backscattering amplitude from OCT measurements. The CMF consistency is 0.4%. The data were extracted from a graph from [74].
Figure 10.
An example of a backscattering amplitude from OCT measurements. The CMF consistency is 0.4%. The data were extracted from a graph from [74].

Figure 11.
(a) Resized images with a uniform pixel size of 11 µm (upper row) and corresponding Otsu-thresholded images (bottom row) for 0.4% CMF. The white color depicts the fibrils, and black corresponds to water [74]. (b) Floc size distributions in the radial and axial directions at a CMF consistency of 0.4%. The numbers in the legend show the wall shear stress and the flow rate in the pipe. The data were extracted from a graph from [74].

Figure 12.
Radial and axial floc sizes as a function of shear stress for 0.4% CMF consistency. The data were extracted from a graph from [74].
Figure 12.
Radial and axial floc sizes as a function of shear stress for 0.4% CMF consistency. The data were extracted from a graph from [74].

Figure 13.
Diffraction scattering angles as a function of particle size.

Figure 14.
Logarithmic plot of scattered light intensity (black dots) versus scattering vector.

Figure 15.
Evolution of PCC floc sizes with time using three polymers of different molecular weights for flocculation (a); evolution of SE and dF with time for the same process conditions (b). Monitoring was performed using LDS.
Figure 15.
Evolution of PCC floc sizes with time using three polymers of different molecular weights for flocculation (a); evolution of SE and dF with time for the same process conditions (b). Monitoring was performed using LDS.


Figure 16.
Kinetic curves for two polymers, E1 and E2, for three different concentrations, as well as floc breakage due to sonication at 20 kHz and re-flocculation. Monitoring was performed using LDS.
Figure 16.
Kinetic curves for two polymers, E1 and E2, for three different concentrations, as well as floc breakage due to sonication at 20 kHz and re-flocculation. Monitoring was performed using LDS.

Figure 17.
Schematic representation of the FBRM probe (the image was obtained by coupling an in-line microscope with FBRM).
Figure 17.
Schematic representation of the FBRM probe (the image was obtained by coupling an in-line microscope with FBRM).

Figure 18.
Path of the focused beam and chord lengths of the particles.

Figure 19.
Example of a chord length distribution obtained using FBRM [91].
Figure 19.
Example of a chord length distribution obtained using FBRM [91].

Figure 20.
Monitoring PCC flocculation using FBRM: breakup of flocs and re-flocculation with bentonite addition. (a) flocculant used, E1; (b) flocculant used, E1++++ [34].
Figure 20.
Monitoring PCC flocculation using FBRM: breakup of flocs and re-flocculation with bentonite addition. (a) flocculant used, E1; (b) flocculant used, E1++++ [34].

Figure 21.
Scheme of an ultrasonic attenuation system for particle characterization.

Figure 22.
Scheme of an ultrasonic attenuation spectroscopy sensor for monitoring particle size evolution during cooling crystallization (adapted from [112]).
Figure 22.
Scheme of an ultrasonic attenuation spectroscopy sensor for monitoring particle size evolution during cooling crystallization (adapted from [112]).

Disclaimer/Publisher’s Note: The statements, opinions and data contained in all publications are solely those of the individual author(s) and contributor(s) and not of MDPI and/or the editor(s). MDPI and/or the editor(s) disclaim responsibility for any injury to people or property resulting from any ideas, methods, instructions or products referred to in the content. |
© 2024 by the authors. Licensee MDPI, Basel, Switzerland. This article is an open access article distributed under the terms and conditions of the Creative Commons Attribution (CC BY) license (https://creativecommons.org/licenses/by/4.0/).
Share and Cite
MDPI and ACS Style
Rasteiro, M.G.; Koponen, A. Monitoring Aggregation Processes in Multiphase Systems: A Review. Powders 2024, 3, 77-110. https://0-doi-org.brum.beds.ac.uk/10.3390/powders3010007
AMA Style
Rasteiro MG, Koponen A. Monitoring Aggregation Processes in Multiphase Systems: A Review. Powders. 2024; 3(1):77-110. https://0-doi-org.brum.beds.ac.uk/10.3390/powders3010007
Chicago/Turabian StyleRasteiro, Maria Graça, and Antti Koponen. 2024. "Monitoring Aggregation Processes in Multiphase Systems: A Review" Powders 3, no. 1: 77-110. https://0-doi-org.brum.beds.ac.uk/10.3390/powders3010007