
Mechanical Properties of Al–Mg–Si Alloys (6xxx Series): A DFT-Based Study
by
 , , and
Kipkorir Kirui Pius
1,*, 
Nicholas O. Ongwen
2,3,4,
Maxwell Mageto
1,4,
Victor Odari
1,4 and
Francis Magiri Gaitho
1,4 1
Department of Physics, Masinde Muliro University of Science and Technology, P.O. Box 190, Kakamega 50100, Kenya
2
Department of Physics and Material Science, Maseno University, Maseno 40137, Kenya
3
Faculty of Physical and Biological Sciences, Tom Mboya University, P.O. Box 199, Homa-Bay 40300, Kenya
4
Materials Research Society of Kenya, P.O. Box 15653-00503, Nairobi 00100, Kenya
*
Author to whom correspondence should be addressed.
Alloys 2023, 2(3), 213-226; https://0-doi-org.brum.beds.ac.uk/10.3390/alloys2030015
Submission received: 24 May 2023
/
Revised: 4 September 2023
/
Accepted: 11 September 2023
/
Published: 13 September 2023
Abstract
:Al–Mg–Si alloys are used in aircraft, train, and car manufacturing industries due to their advantages, which include non-corrosivity, low density, relatively low cost, high thermal and electrical conductivity, formability, and weldability. This study investigates the bulk mechanical properties of Al–Mg–Si alloys and the influence of the Si/Mg ratio on these properties. The Al cell was used as the starting structure, and then nine structures were modeled with varying percentages of aluminium, magnesium, and silicon. Elastic constant calculations were conducted using the stress–strain method as implemented in the quantum espresso code. This study found that the optimum properties obtained were a density of 2.762 g/cm3, a bulk modulus of 83.3 GPa, a shear modulus of 34.4 GPa, a Vickers hardness of 2.79 GPa, a Poisson’s ratio of 0.413, a Pugh’s ratio of 5.42, and a yield strength of 8.38 GPa. The optimum Si/Mg ratio was found to be 4.5 for most of the mechanical properties. The study successfully established that the Si/Mg ratio is a critical factor when dealing with the mechanical properties of the Al–Mg–Si alloys. The alloys with the optimum Si/Mg ratio can be used for industrial applications such as plane skins and mining equipment where these properties are required.
1. Introduction
Aluminium and its alloys have numerous applications that range from cladding walls in buildings to aircraft parts, power cables, heat exchangers, and heat shields. Most car parts (about 60% of the weight), such as gear box housing, cylinder heads, and wheel rims, are made of Al and/or its alloys [1,2]. The alloys are preferred due to their many advantages, such as non-corrosivity, low density, relatively low cost, and high thermal and electrical conductivity [3,4,5,6]. Additionally, aluminium–magnesium–silicon (Al–Mg–Si) alloys have excellent mechanical strength due to small precipitates of Mg and Si formed in the solid-solution phase, where maximum hardness arises from a combination of a large number of coherent Guinier Preston 1 (GP1) zones (GP phase) and semi-coherent Guinier Preston 2 (GP2) zones (the Mg5Si6 phase, also known as the β” phase), both existing as needle-like structures [7]. The mechanical properties of alloys can be significantly altered with the addition of small amounts of alloying elements and by suitable heat treatments [8]. Specifically, the mechanical strength of the alloys can be improved through cold working and alloying. However, both processes tend to diminish their resistance to corrosion. Moreover, their applicability faces the limitation of a low melting point (660 °C). The principal alloying elements are copper, Si, Mg, manganese, and zinc [9].
Al–Mg–Si belongs to the 6xxx series of Al alloys, which contain traces of elements such as tin, indium, copper, iron, manganese, chromium, zinc, titanium, zirconium, and lanthanum that have been found to improve the mechanical properties of this series [8,10,11]. It has always been a challenge to come up with materials that have high resistance to cracking and spalling that result from rapid heating in the course of their applications in airplanes, vehicles, train coaches, and other transport facilities [12]. Aircraft materials are designed to have very low density so as to reduce the overall weight of the aircraft parts, which would otherwise contribute to an increase in overall load. The quest to find better materials in this and similar industries is a continuous and never-ending venture. Alloys of aluminium are, therefore, ideal in this sector, mainly due to their light weight [13].
The microstructure, mechanical, and thermal properties of Al–Mg–Si alloys have been studied by a number of researchers [3,8,9]. However, there is scanty literature on ab initio studies of a combination of mechanical properties of these alloys, namely, bulk modulus, shear modulus, Young’s modulus, Poisson’s ratio, Pugh’s ratio, Vickers hardness, and ductility. Furthermore, the silicon and aluminium percentages used in this study have not been exhaustively explored in previous studies. Using density functional theory (DFT) [14], we modeled various combinations of Al–Mg–Si alloys and then calculated their mechanical properties, with the main aim of optimizing them as regards strength, hardness, and ductility, as well as examining the effects of the Si/Mg ratio on these properties. DFT remains one of the most effective ab initio tools for quantitatively predicting and rationalizing the mechanical response of materials. In addition, DFT reduces the number of laboratory trials needed when manufacturing a material with desired mechanical properties [15]. The choice of the alloys in this study was based on previous studies, which have mainly shown that Al–Mg–Si alloys (6xxx series) are appropriate for use in the aircraft, motor vehicle, and train manufacturing industries. It is worth noting that although the mechanical properties of the Al–Mg–Si alloys can be greatly improved by heat treatments, the same was not undertaken in this study since the calculations were carried out at the ground state.
2. Materials and Methods
2.1. Density Functional Theory
DFT uses a set of reasonable physical approximations to simplify the many-particle Schrödinger equation to something that can be solved numerically [14]. Equation (1) shows the many-particle Schrödinger equation.
where is the many-particle wave function for N particles, with each particle having its own mass , charge , and position . The interaction is the coulomb interaction: is the kinetic energy of the N particles, and is the total potential energy of the N particles. DFT calculations usually involve the Born–Oppenheimer approximation with an appropriate choice of the functional part. The Kohn–Sham Equations can be used to find the ground-state energy and electronic density of a system of interacting electrons and ions.
2.2. Modeling the Structures of the Alloys
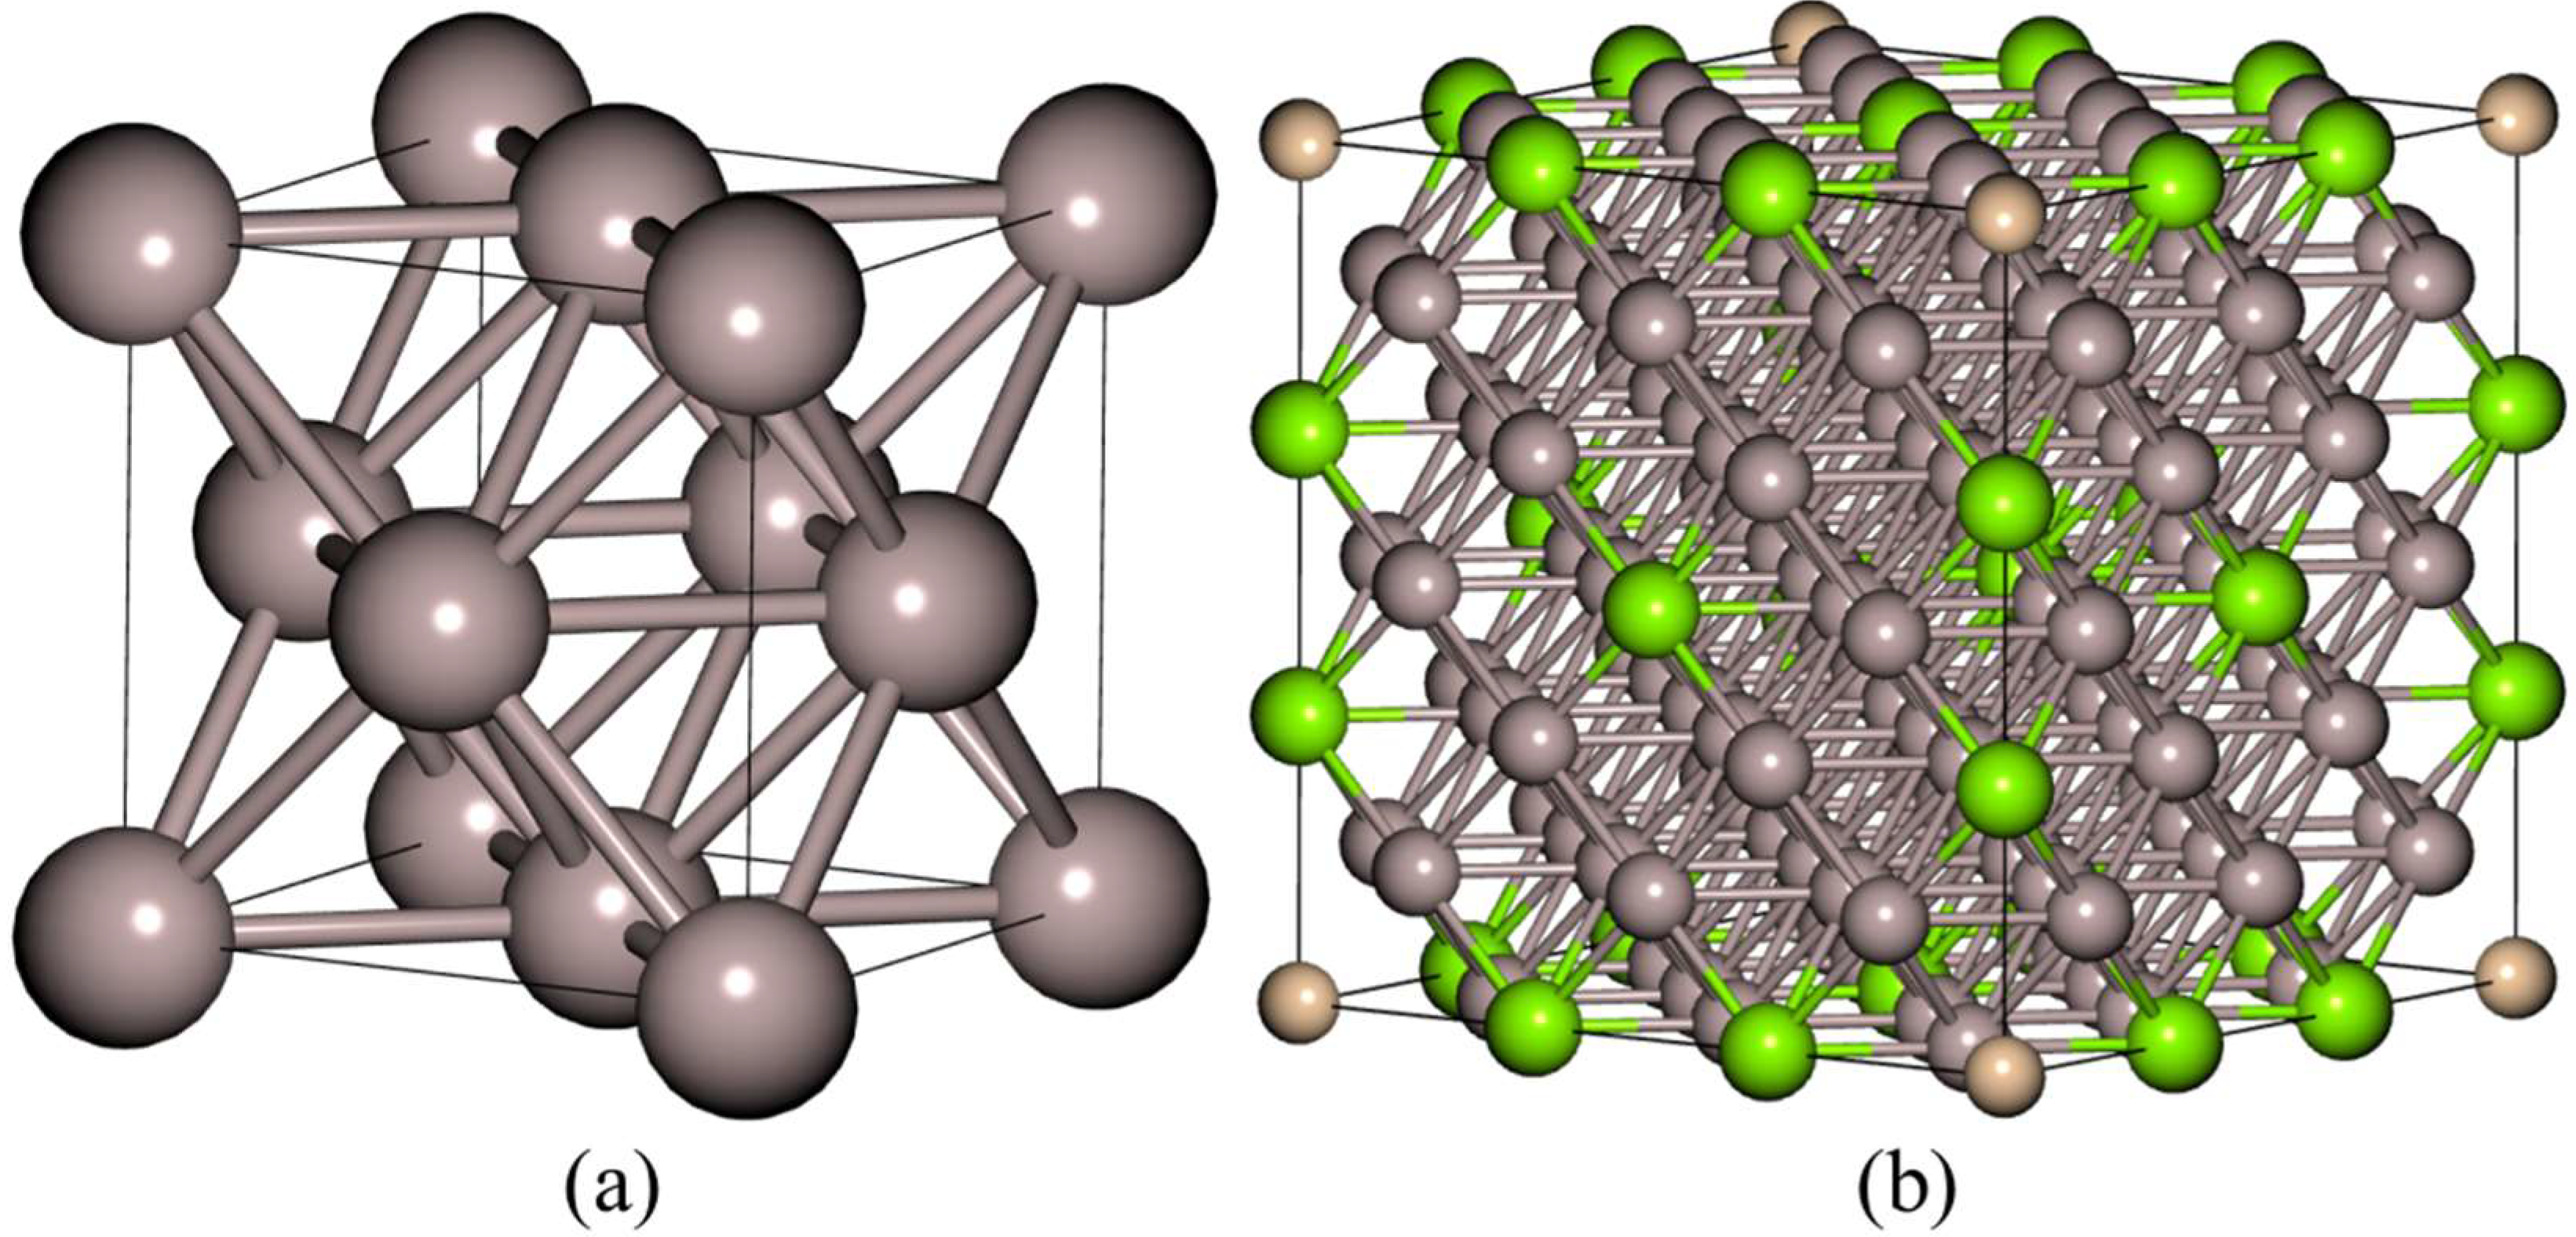
The Al crystallographic information file (CIF) was obtained from the crystallography.net open database. Figure 1a shows the 3-D structure of the unit cell as viewed in Burai, a graphical user interface tool for quantum espresso. The input file was Fm3m, space group number 225, and lattice parameter a = 4.0478 Å [16]. The input file consisting of 4 atoms was first transformed into a 3 × 3 × 3 supercell containing 108 atoms, with lattice parameter a = 12.1434 Å. The supercell was then alloyed by replacing some of the Al atoms with those of Mg and Si atoms as per the concentrations given in Table 1. This was carried out within the Burai tool.
The code names used in Table 1 contain the percentage silicon concentration (first digit), followed by the percentage magnesium concentration (second digit). Figure 1b, which shows the structure of the A_19 supercell, is representative of all the other eight supercells. The A_00 cell (the pure Al cell) was also included in the calculation as a reference.
The number of atoms in the concentration percentages chosen was approximated to the nearest whole number. The concentration of Al was kept constant at 90%, while that of Si and Mg was varied to yield the nine Al–Mg–Si alloys with different concentrations. The first alloy (A_19) had the lowest concentration of Si (1%) and the highest concentration of Mg (9%). Si concentration was then consistently increased, while that of Mg was consistently reduced.
2.3. Structural Optimization
The electron–ion interactions in this study were described by scalar-relativistic, norm-conserving ultrasoft pseudopotentials (PPs). This is because, apart from allowing a basis set with a significantly lower kinetic energy cut-off (ecut) to be used to describe the electron wave functions and allowing numerical convergence with reasonable computing resources, ultrasoft PPs also relax norm-conserving constraints to reduce the necessary basis set size further at the expense of introducing a generalized eigenvalue problem [17]. The Perdew–Burke–Erzernhof functional for SOLids (PBESOL) was used. Norm-conserving ultrasoft pseudopotentials (PPs) by Adllan and Corso [18], Al.pbesol.rrkjus.UPF, Mg.pbesol.rrkjus.UPF, and Si.pbesol.rrkjus.UPF, which have been generated with scalar-relativistic calculation, were also employed. PBESOL PPs produce results for mechanical properties that are comparable to those of experimental studies [19]. Moreover, ultrasoft PPs allow basis sets with a significantly lower ecut to be used in order to describe the electron wave function, thus allowing numerical convergence with reasonable computing resources.
The ecut, charge density cut-off (ecutrho) (ecut × 8), the k_ points, and the lattice parameters were then optimized. Ecut was varied from 10 to 100 in steps of 10, leading to 10 data points. The structural optimization was achieved when the difference between two adjacent values of total energy was in the order of 10−4 Ry. K_points varied from 2 to 9 in steps of 1. To obtain the equilibrium lattice parameters of the crystal, calculations on the total energy were carried out for a range of unit cell volumes by varying the lattice parameters in steps of 0.2 a.u from 19.3 to 22.1, producing 15 data points. The equilibrium lattice parameters were obtained by fitting the resulting total energies versus volumes data into the third-order Birch–Murnaghan equation of state, given by Equation (2) [10]:
where P is the pressure, Vo is the reference volume, V is the deformed volume, is the bulk modulus, and is the derivative of the bulk modulus with respect to pressure. From Equation (2), the minimum equilibrium volumes were obtained. The values of the equilibrium volumes were then fitted into the equation for finding the volume of a simple cubic cell, given by Equation (3):
After optimizing the lattice parameters, the atomic coordinates were then optimized by performing a variable cell relaxation (vc-relax) calculation using the Brodyden–Fletcher–Goldfarb–Shanno (BFGS) algorithm, such that the components of force on each atom are less than × 10−4 Ry/Å.
2.4. Calculation of Mechanical Properties
Solid materials exhibit resistance to the action of external forces that tend to deform them [20]. The elastic properties of materials give the characteristics of their response to external loads, which can be applied in different manners. The elastic properties of materials are governed by Hooke’s law, which states that the stresses σi in a material are directly proportional to the corresponding applied strain δi within the linear regime of the crystal:
where cij is the elastic stiffness constant corresponding to the spring constant in Hooke’s law.
Elastic properties of materials are important, as they give vital information about the anisotropic character of bonding, bonding characteristics between adjacent planes, and the structural stability of a compound. Calculation of the elastic constants of materials requires knowledge of the curvature of the energy curves as a function of strain for the selected deformations. In this study, the stress–strain method by Ongwen et al. [19] was employed. Instead of the three distortion matrices (, , and ) that are required in the energy–strain method for the calculation of elastic constants of cubic crystals, only two distortion matrices ( and ) are required. Small strains (±0.006 in steps of 0.002, 5 data points) were applied to the crystals, after which the stresses were obtained.
The three elastic stiffness constants for the cubic crystals () must meet the Borne Huang criterion for a stable structure [21,22], given by Equation (5):
The elastic stiffness constants and the corresponding elastic compliance constants () for the cubic crystals are related by Equation (6a,b) [23,24]:
From elastic stiffness () and elastic compliance constants (), the bulk modulus (B) and the shear modulus (G) were calculated using the Voigt and Reuss approximations. For a cubic crystal, the Voigt bulk () and shear () moduli are, respectively, given by Equation (7a,b):
The Reuss bulk () and shear bulk () moduli are, respectively given by (8a,b):
The effective bulk and shear moduli are the arithmetic averages of the Voigt and Reuss moduli, known as Hill’s average and given in Equation (9) [25];
The brittle and ductile behavior of a material was determined by using Equation (10) [24]:
where n is a constant known as the Pugh’s modulus ratio. If n > 1.75, the material is ductile; otherwise, the material is brittle. The Vickers hardness () was determined according to the Chen model, given in Equation (11) [26,27]:
The Tian model, given by Equation (12), was also used for comparison and improvement [28].
where n is Pugh’s ratio and G is the shear modulus.
3. Results and Discussion
3.1. Structural Properties
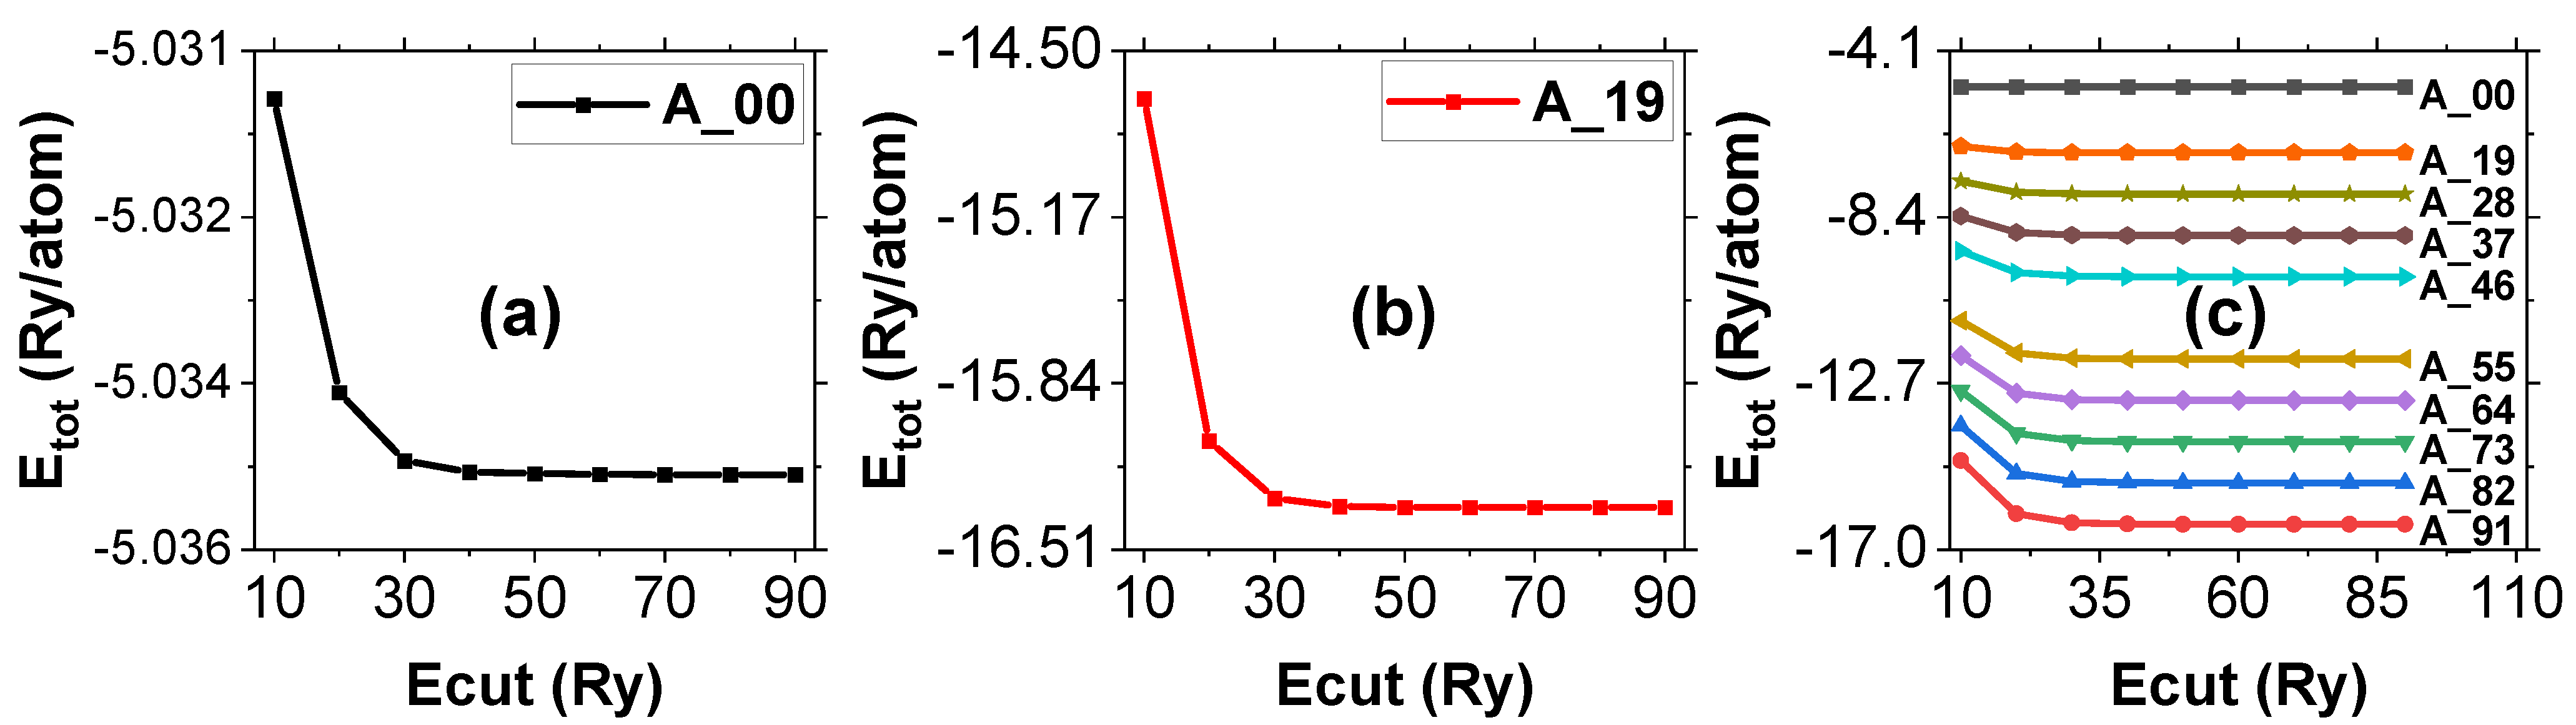
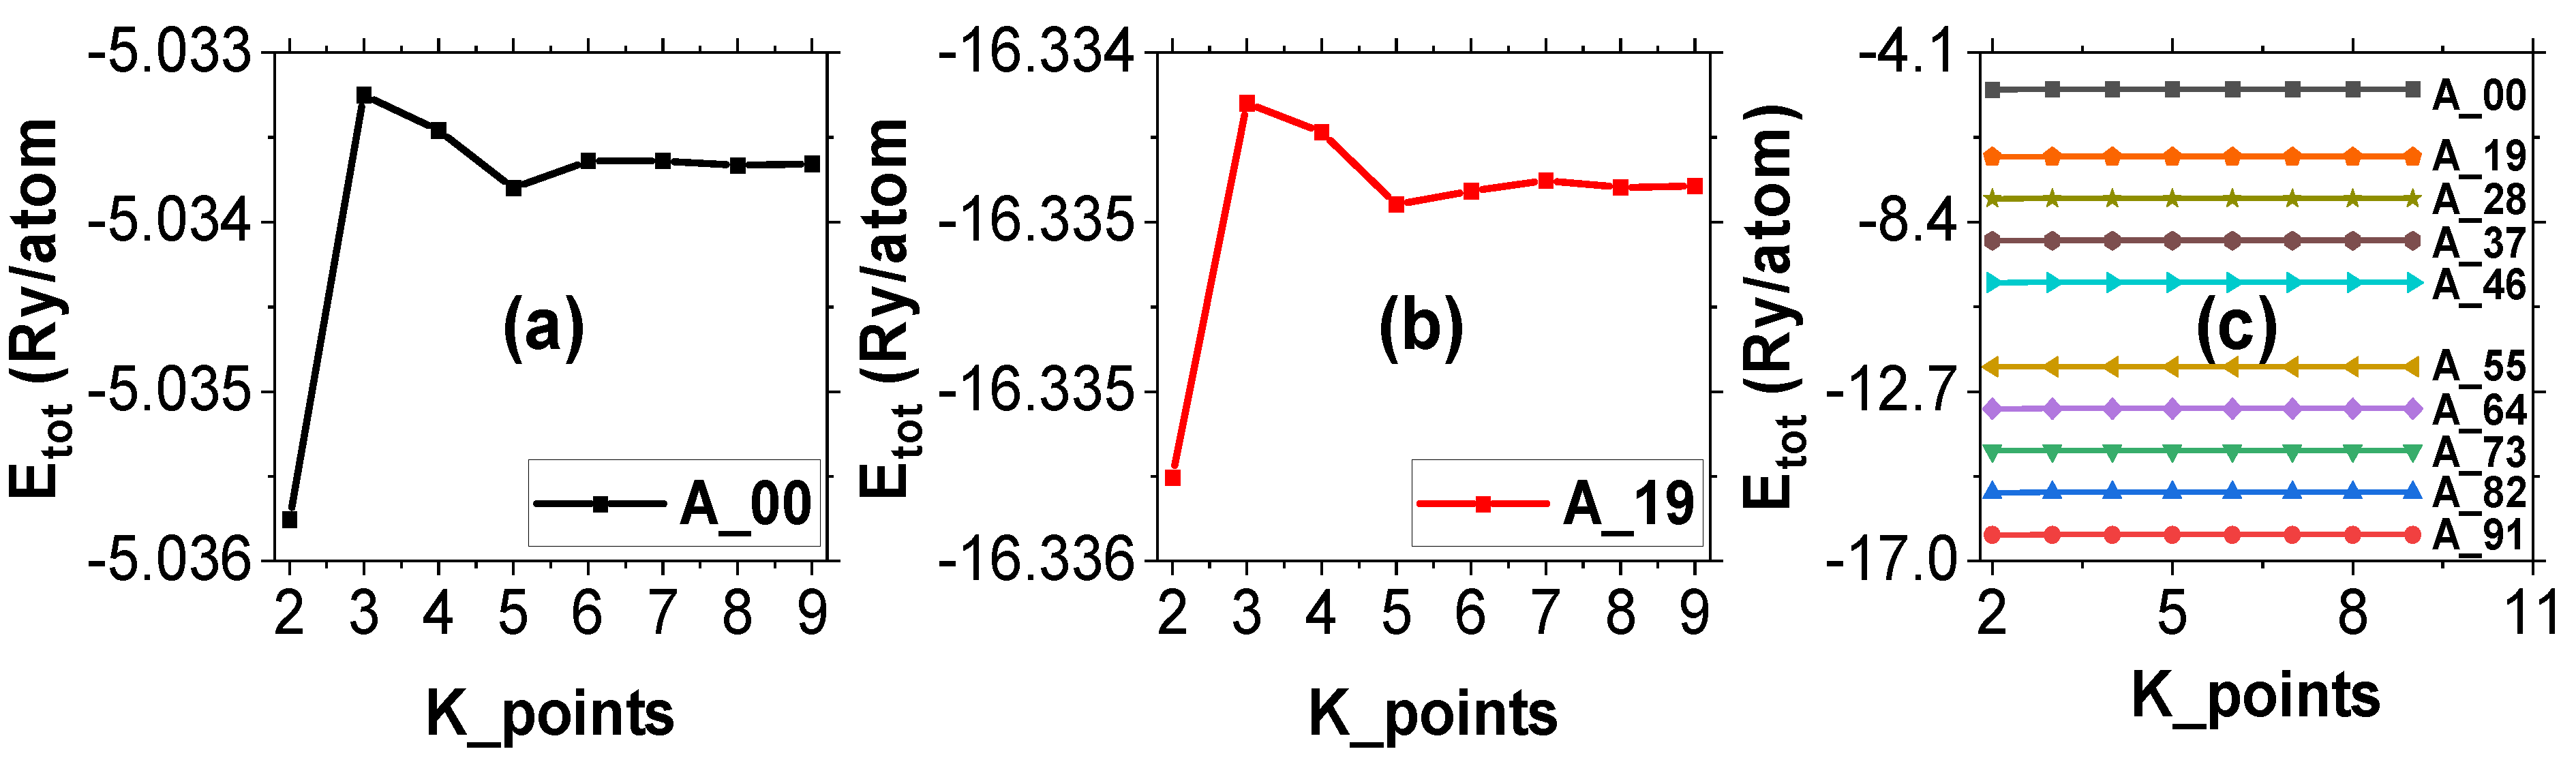
Figure 2 shows the variation of the total energy per atom with ecut for samples A_00, A_19, and all ten alloy samples combined. From the figure, the ecut was observed to stabilize at 50 Ry. Thus, 50 Ry was picked for the subsequent calculations for all the supercells. The energy difference between the 55 Ry and 50 Ry total energies was found to be 2.4 × 10⁻³ Ry. Figure 3 presents the total energy per atom against k_points for samples A_00, A_19, and all the alloy samples combined, which was found to stabilize at the 5 × 5 × 5 mesh. The energy difference corresponding to this mesh was found to be 3.5 × 10⁻⁴ Ry. Thus, the 5 × 5 × 5 k_point mesh was chosen for all the other supercells. Although higher values for the ecut and k_point mesh would have been chosen so as to improve the accuracy of the calculation, it was noted that the higher values would have been more computationally expensive, considering the large number of atoms (108 atoms) in each supercell that were modeled in this study. However, the 50 Ry ecut and 5 × 5 × 5 Ry k_points are sufficient to give accurate results.
From both Figure 2c and Figure 3c, it is evident that A_91 requires the least energy to be formed and, hence, is the most mechanically stable. There is a consistent decrease in the total energy from A_00 to A_91, implying that the mechanical stability of the alloys increases consistently from A_00 to A_91 (with an increase in the number of Si atoms added to the structures).
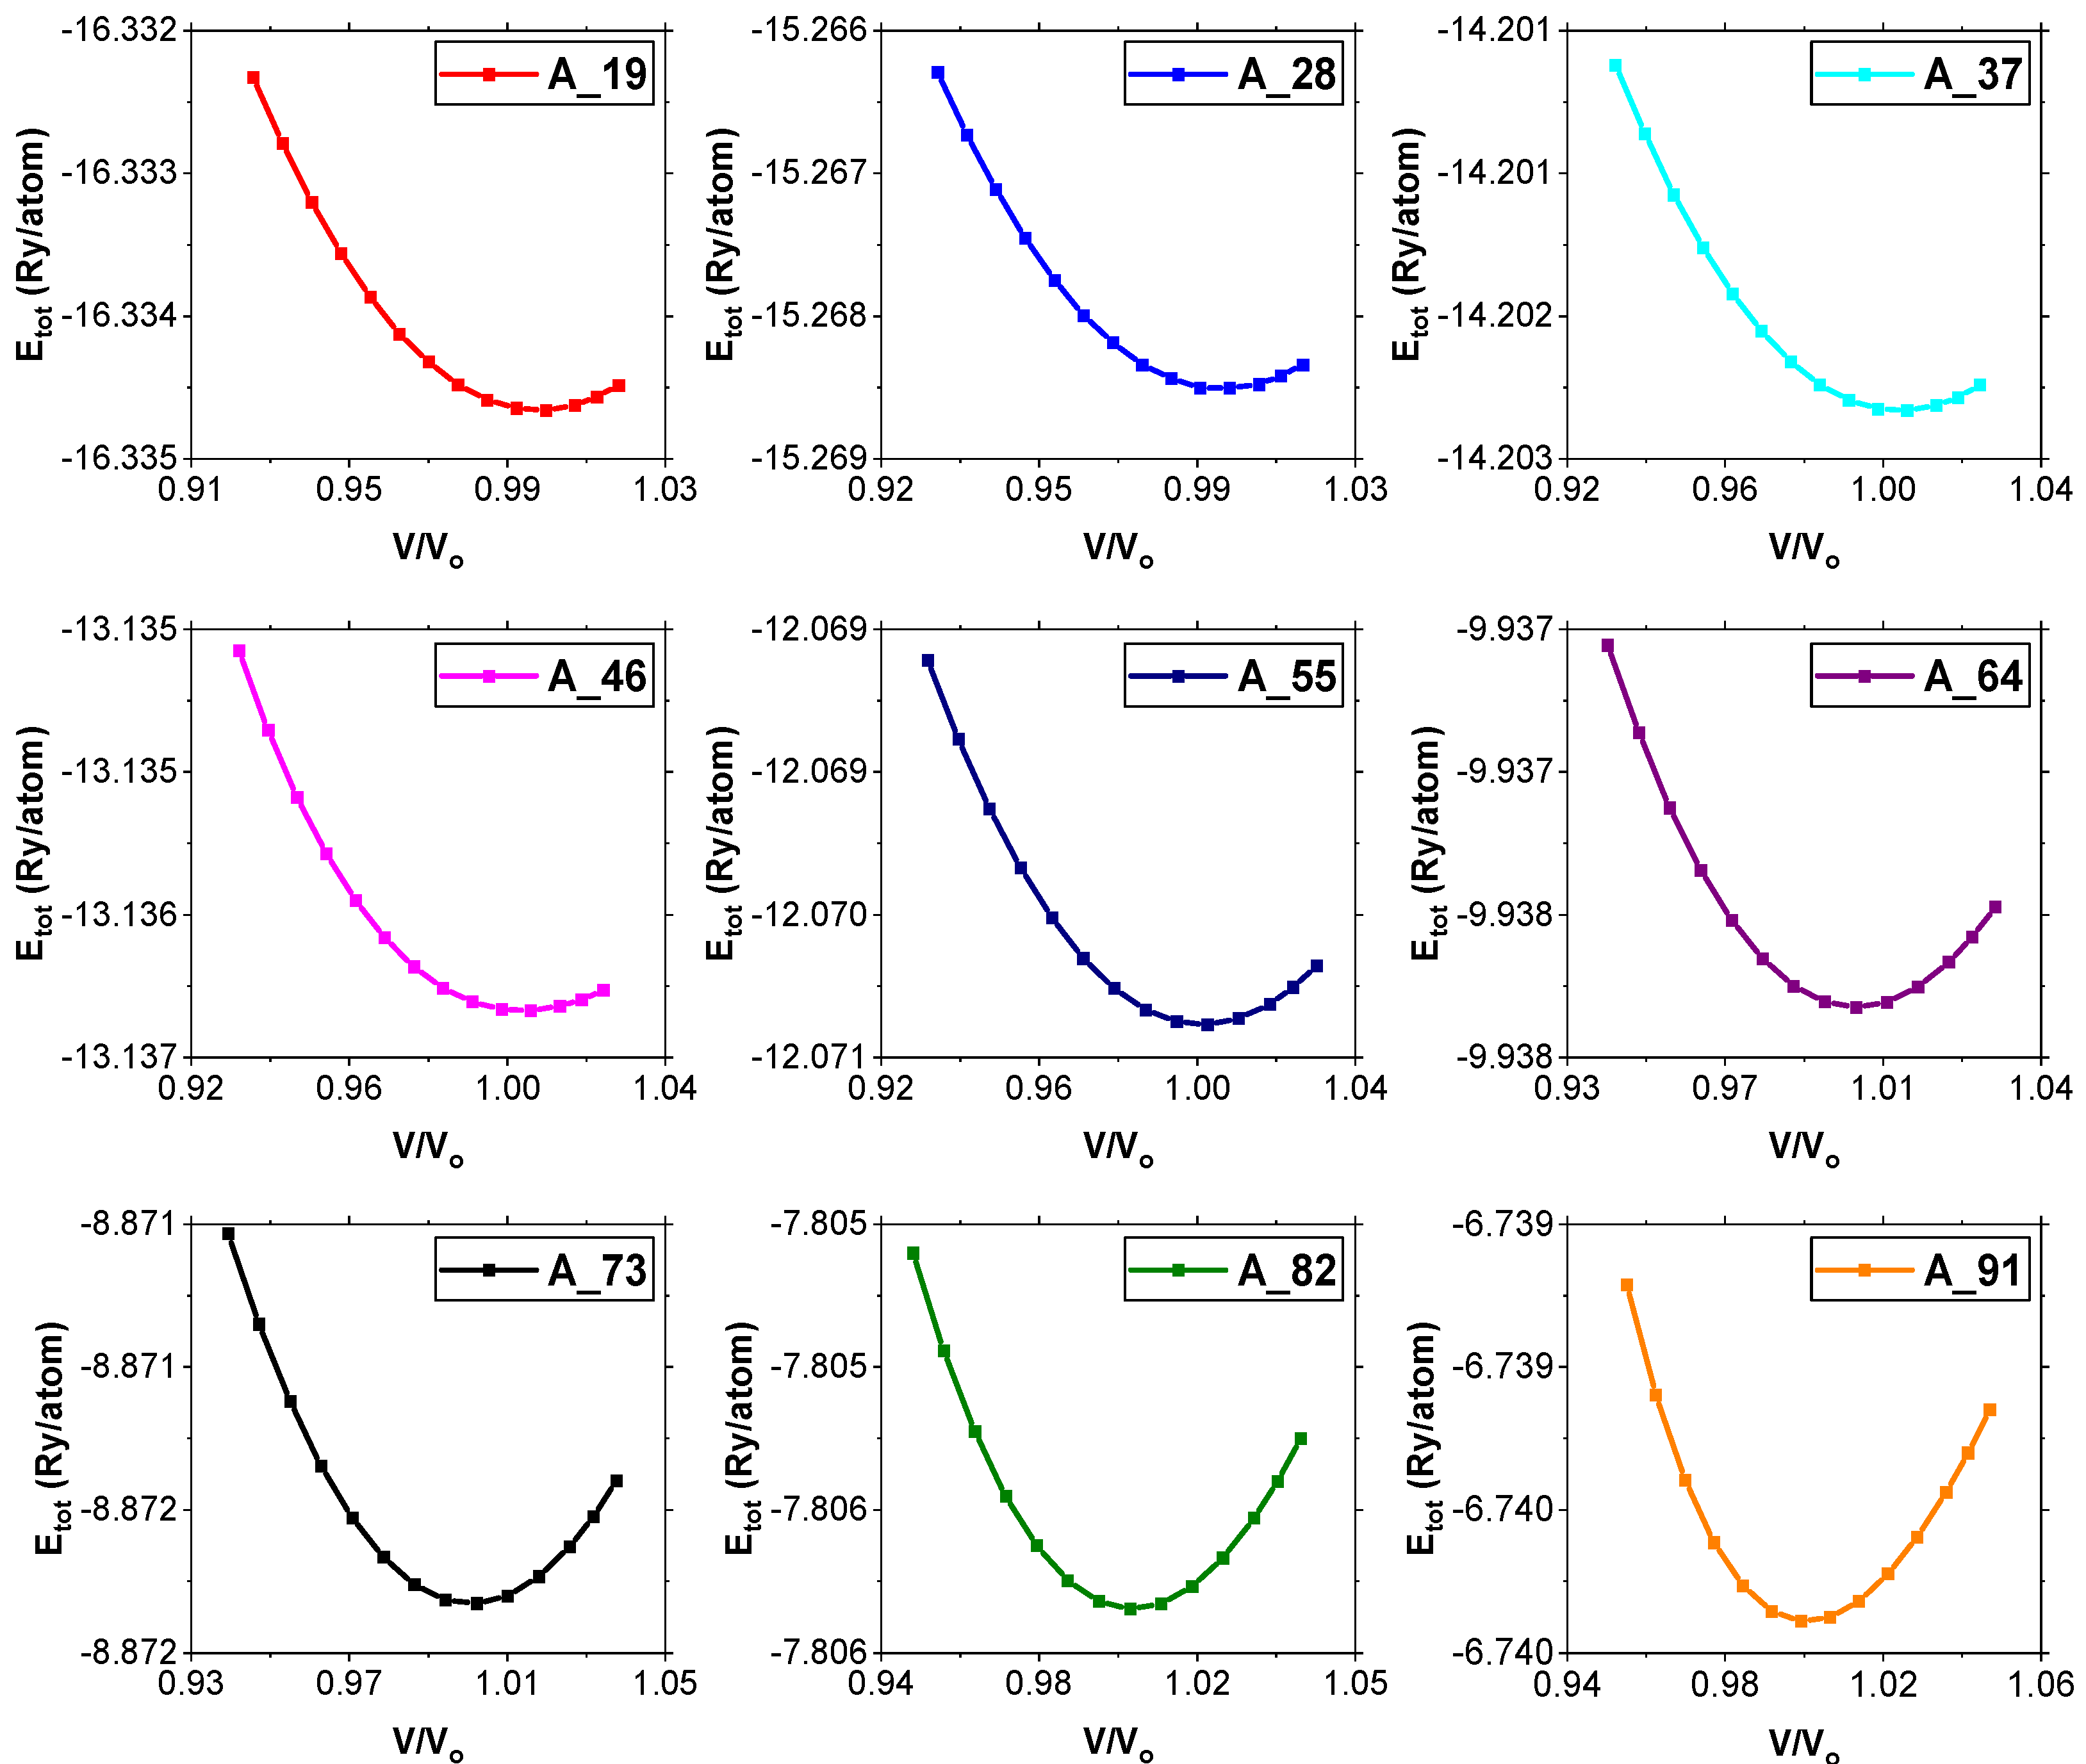
The equilibrium volumes (Vo) of the alloys were obtained with the help of Equation (2). By applying the formula for finding the volume of a cube (Equation (3)), the volumes of the cells were calculated. The normalized volumes (v/vo) were also obtained and the graphs of total energy versus normalized plotted in order to optimize the equilibrium volumes as shown in Figure 4. It is evident from Table 2 that the optimum lattice parameters of the supercells decrease from A_19 to A_91. Since the trend from A_19 to A_91 is accompanied by an increase in the Si/Mg ratio, it implies that as the ratio increases, the lattice parameters of the alloys decrease (Table 2). This shows that the unit cells shrink with an increase in the Si/Mg ratio and is in agreement with the corresponding consistent increase in the densities of the alloy samples.
The lattice parameter of the pure Al sample (sample A_00) obtained in this study compares favorably with those obtained for β”, U1, and U2 precipitates by Froseth’s group [19], which represents a 0.7463% deviation. The computational lattice parameter by Nakashima [20] also compares favorably with the result of this study, representing a 0.2488% deviation. The known trend of overestimation of the lattice parameters by general gradient approximation (GGA) was not witnessed in this work. However, this can be attributed to the improvement of the GGA over time [27].
The density of the 6060 T66 alloy that is available in the literature is 2.074% higher [3] than that of the A_00 sample obtained in this study, which is quite close. The A_00 alloy was found to have the lowest density. Density is a very important property of a material since it is related to the arrangement of atoms in the crystal as well as the corresponding electron density [22]. The density of the alloys in this study was observed to increase consistently with the addition of Si to the structures. A_00 was found to be the least dense, while A_91 was found to be the most dense. Thus, the highest density of A_91 shows the closeness of atoms in its crystal as well as the high electron density in its structure.
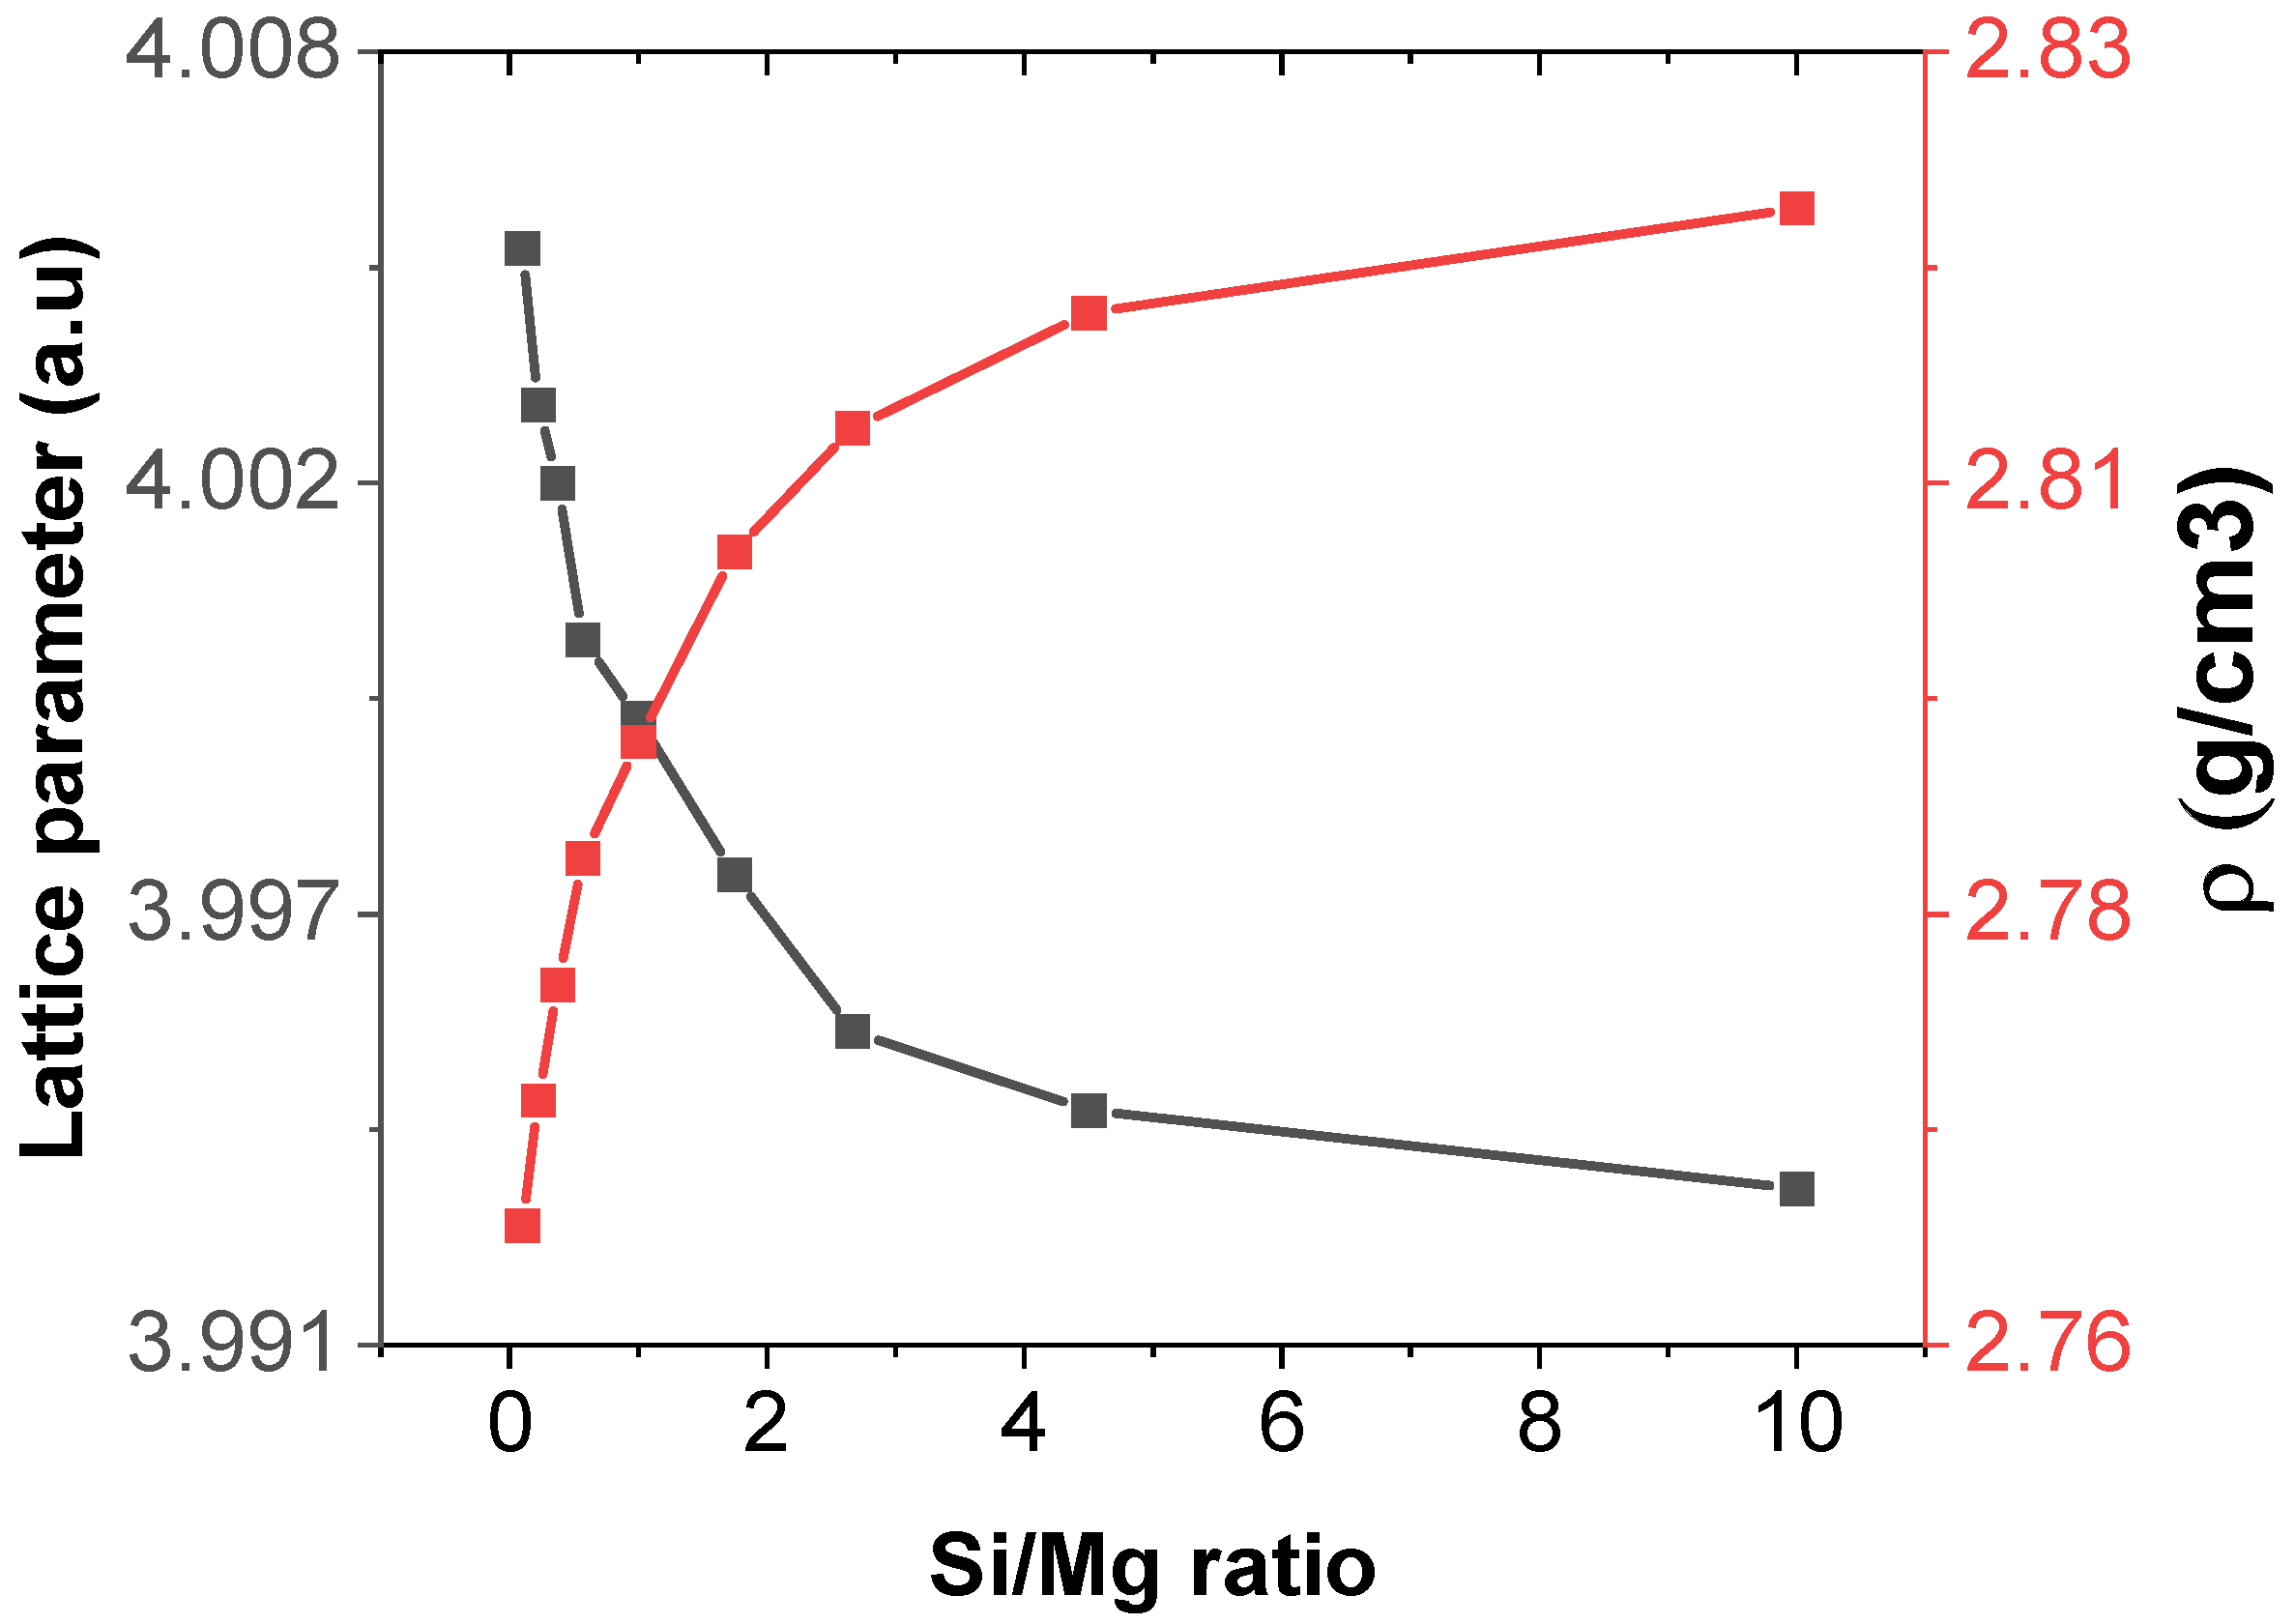
Figure 5 shows the plot of the equilibrium lattice parameter against the Si/Mg ratio, which shows that the reduction of the equilibrium unit cell parameter is not linear but exponential. The densities of the alloy samples, on the other hand, increase non-linearly with the Si/Mg ratio. This was expected since density and lattice parameters are inversely related. The modulus of a lattice parameter is the length of a unit cell, which determines its volume (V = a3) and the volume of the whole crystal, and, hence, its density, since density is affected by volume. At lower Si/Mg ratios, there is a sharp decrease in the unit cell parameters with a corresponding increase in the densities of the alloy samples. At higher values of the Si/Mg ratios, however, both curves tend to be constant. This shows that as the Si/Mg ratio increases, the distance between atoms is becoming smaller, which implies that as you move from A_19 towards A_91, the interatomic distances decrease. A_19, therefore, having the lowest density, will be the lightest and more appropriate for use in making aircraft parts. It is also worth noting that the difference between the highest (2.821 g/cm3) and the lowest (2.762 g/cm3) density is very small and hence insignificant, since the difference between the masses of 1 cm3 of A_19 and A_91 is just 0.059 g.
3.2. Mechanical Properties
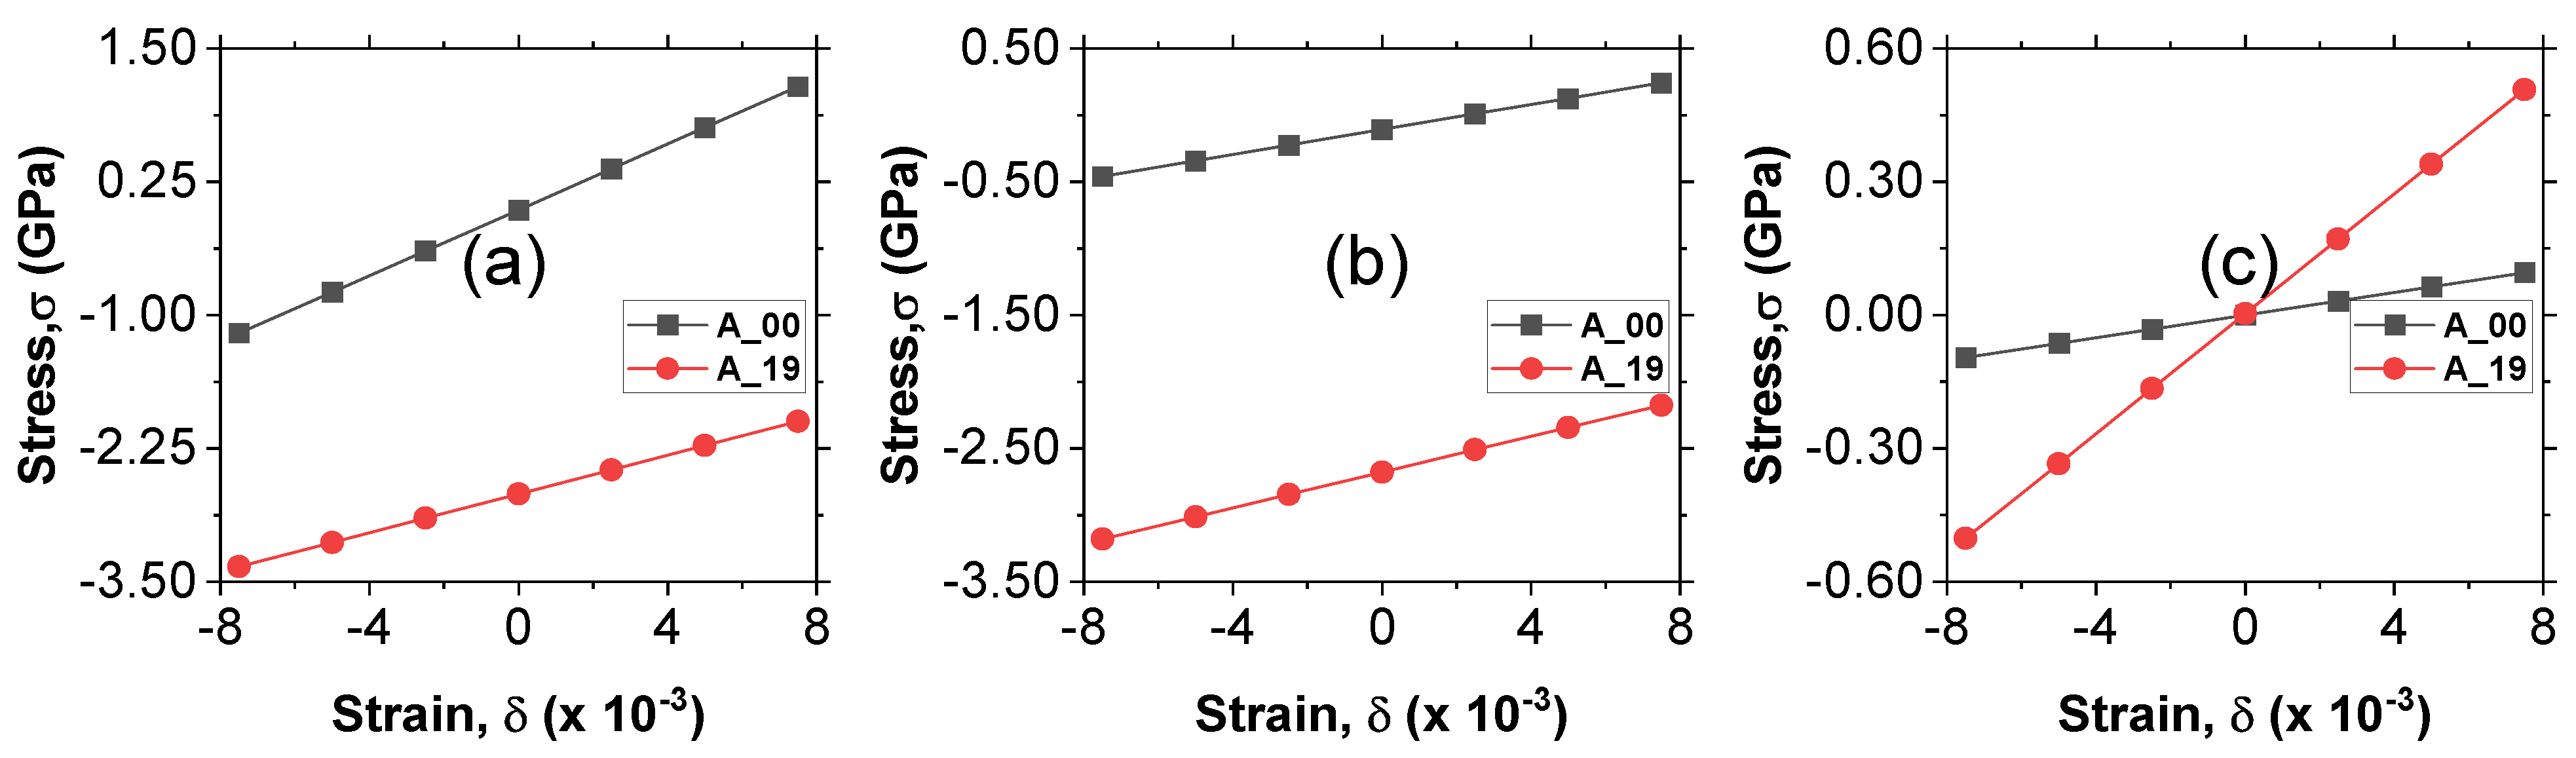
Figure 6 shows the stress–strain curves for obtaining the elastic stiffness constants: (Figure 6a), (Figure 6b), and (Figure 6c) for the A_00 and A_19 alloy samples. By performing a linear fit on the curves, the values of the elastic stiffness constants were obtained from the slopes for all the alloy samples. The fitted values are presented in Table 3. The calculated values of all the elastic stiffness constants obtained in this study are all positive, and, hence, they meet the Borne Huang criterion [21,22]. This indicates that all nine alloys are mechanically stable under ambient conditions. The elastic stiffness constant is related to the elasticity of the length along the a direction (linear resistance to compression along the direction of the a axis), while and are related to the shape of the crystal. The value of is an indication that the crystal is more susceptible to changes in shape than it is to changes in length since is greater than both and .
The values of and in Table 3 drop from A_19 to A_46, then rise from A_55 up to A_82, and finally reduce for A_91. This means that for a lower Si/Mg ratio, the values are higher, but they start to reduce as the Si/Mg ratio increases up 0.571, then rise up to the point where the Si/Mg ratio is 4.5. Finally, for a Si/Mg ratio of 10, the values drop. Thus, the values of and peak at a Si/Mg ratio of 4.5. The value of increases from A_19 to A_55, then starts to drop from A_64 up to A_82, and finally rises for A_91. The peak value of occurs when the Si/Mg ratio is 1 (at A_55).
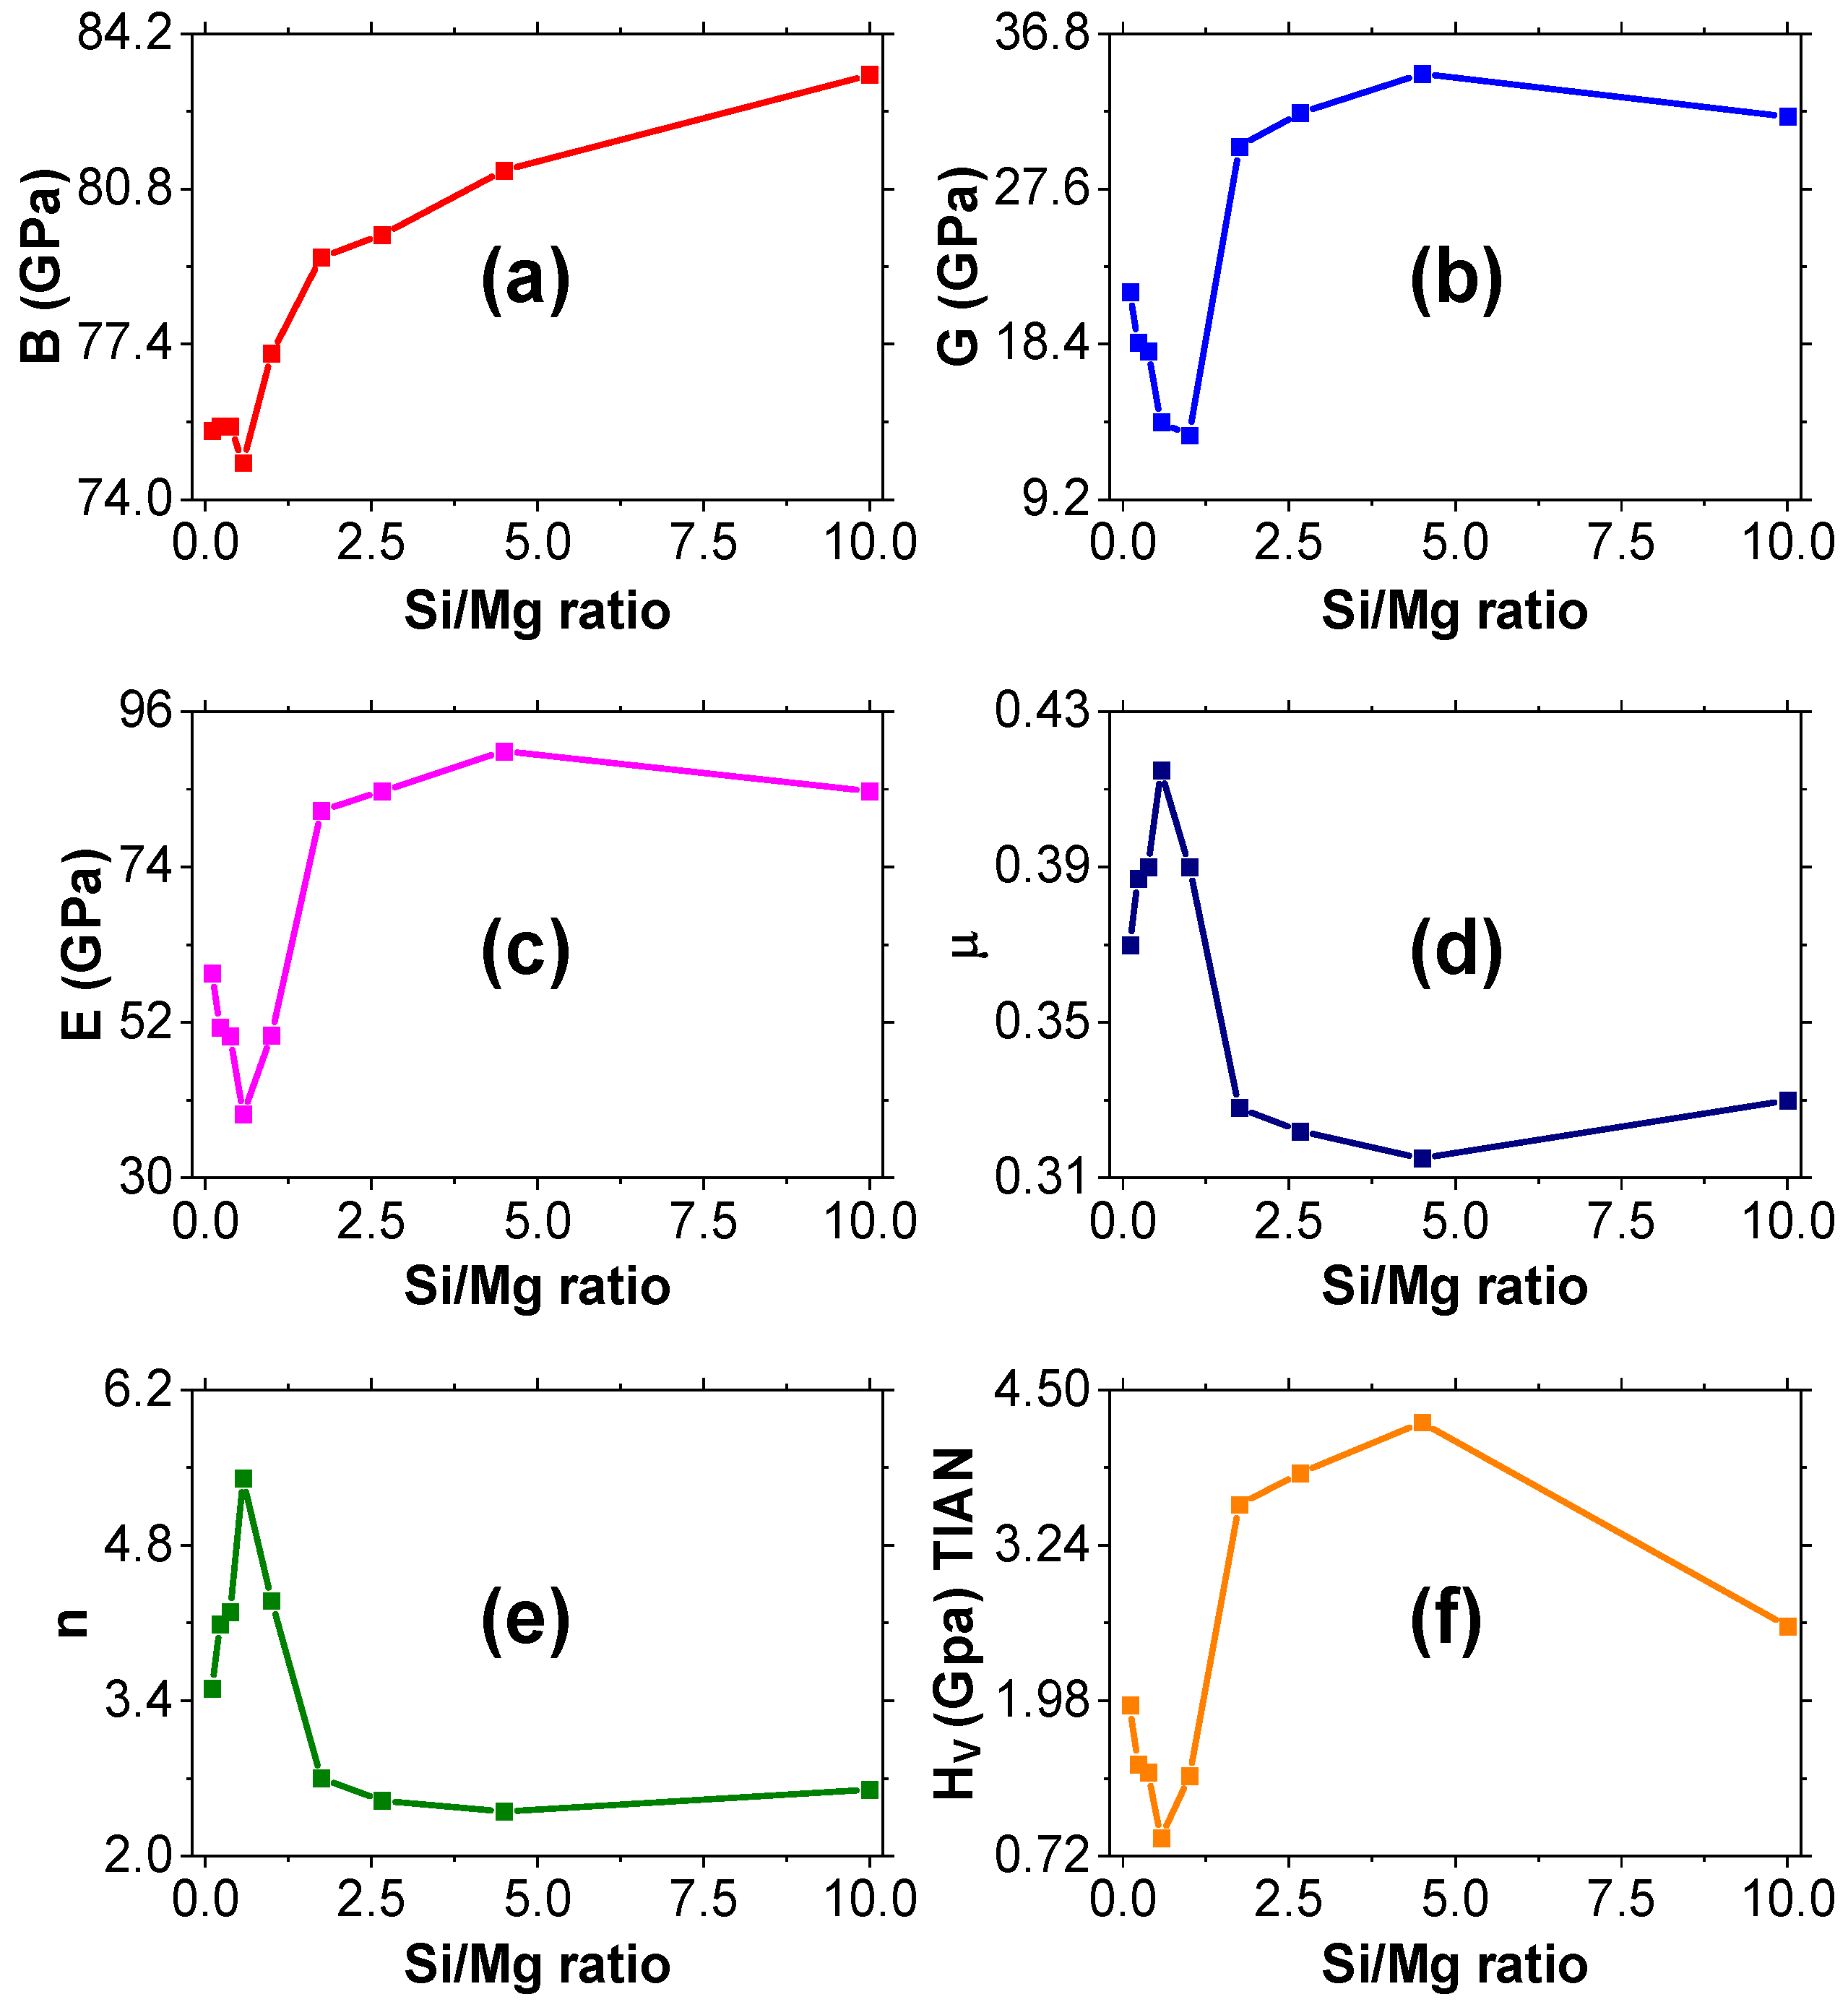
Elastic constants control how materials react to external pressure. The crystalline elastic constants that can be described in the form of bulk modulus, shear modulus, Young’s modulus, and Poisson’s ratio are used to characterize engineering materials and are useful parameters in engineering design. Using the elastic stiffness constants (), the elastic constants and mechanical properties were calculated. The results are presented in Table 4, from which the curves presented in Figure 7 were obtained.
Figure 7a shows a slight decline in the bulk modulus for lower Si/Mg ratios and an increase for higher Si/Mg ratios. The bulk modulus is at its highest when the Si/Mg ratio is 10. This shows that higher values of bulk modulus are achieved with higher Si/Mg ratios. The bulk moduli obtained in this study, which range from 74.0–83.3 GPa (Table 4), compare favorably with the bulk modulus of 70 GPa obtained for the 6060 T66 alloy by Ambroziak and Solarczyk [3]. It also compares with those obtained by Froseth’s group [29], which range from 65 to 71 GPa for the various precipitates of Al–Mg–Si alloys. There is an initial sharp decline in the shear moduli at lower Si/Mg ratios. As the Si/Mg ratio increases, the shear modulus also increases and peaks when the ratio is 4.5, after which it decreases as the ratio increases further (Figure 7b). This means that to design an alloy that can withstand high shearing forces, the ratio of Si to Mg should be approximately 4.5. All the samples in this study have bulk moduli that are significantly greater than the shear moduli, which suggests that the alloys are more resistant to volume change than to shape change. This makes all the alloy samples in this study appropriate for building automobile parts, such as rail coaches and motor vehicle parts, since their shapes cannot be easily changed.
A material’s resistance to longitudinal tension is gauged by its Young’s modulus. A high Young’s modulus indicates high stiffness [32]. Additionally, Young’s modulus affects the ability of a material to withstand thermal shock since it is inversely correlated to the critical thermal shock coefficient, which is crucial in gauging the flammability of a material. It is evident from Figure 7c that the Young’s modulus follows the same trend as the shear modulus for these alloys. There is a slight drop in the Young’s modulus for low values of Si/Mg ratio and a steady increase in the modulus until a peak is reached at a Si/Mg ratio value of 4.5 (corresponding to alloy A_82). A_82 is, therefore, appropriate for parts that require high stiffness, such as gear boxes in cars. A further increase in the Si/Mg ratio leads to a drop in the Young’s modulus value.
Poisson’s ratio can be used to assess many physical properties of solids, including the prediction of stability against shear [33]. The value of Poisson’s ratio obtained in this study (Figure 7d) is closer to that obtained by Ambroziak and Solarczyk [3] for 6060 T66 alloy, which was 0.3. A lower value of Poisson’s ratio leads to the stability of a material against shear. Generally, for all the alloys in this study, the Poisson’s ratio is greater than 0.3, meaning that they are easily deformed, with A_82 being the least easily deformed and A_28 being the most easily deformed.
The Poisson’s ratio as well as the Pugh’s ratio can be used to determine the ductile or brittle nature of materials. Materials that fracture when subjected to stress but have little tendency to deform before rupture are said to be brittle, while those that can easily be distorted are said to be ductile. The values of Poisson’s ratio in this study show that all these alloys are ductile. This is because a material is brittle if the value of Poisson’s ratio is less than 0.27 [23,34]. The higher the value, the more ductile the material is. This study confirms that all the values of Poisson’s ratios are greater than 0.27 and, hence, the alloys are ductile. Poisson’s ratio rises at a low Si/Mg ratio, then falls, approaching almost a low asymptotic value before rising steadily with a further increase in the Si/Mg ratio.
A material is ductile if the Pugh’s ratio is greater than 1.75 [35]. The Pugh’s ratios obtained in this study are greater than 1.75 for all nine alloy samples (Figure 7e), also confirming that they are all ductile. This means that the materials are flexible and can be formed into thin sheets, which is a crucial property of materials for technical and industrial applications. The values of Pugh’s ratio obtained in this study at 2.57–5.42 show that all the alloys in this study are highly ductile materials, with A_46 being the most ductile and A_82 being the least ductile. Although the alloys in this study are ductile based on Pugh’s and Poisson’s ratios, this criterion alone is not sufficient to suggest specific applications of these alloys in the industry since it leads to elongation to fracture in a tensile test, which is only in the regime of a few percent (less than the recommended 10% ELF) of plastic deformation.
Another significant property that affects many industrial applications of materials is hardness. Generally, hardness is the resistance that a material offers to external mechanical actions that tend to scratch, abrade, indent, or in other ways permanently affect its surface. Hard materials, such as diamond, have low compressibility and high wear resistance, a property that is highly desired in making parts of automobiles that do not wear out easily, such as plane skins. Materials with a Vickers hardness of more than 40 GPa are referred to as super hard materials [36]. The alloys in this study are generally softer materials, since the highest hardness value obtained from the Tian model is 4.24 GPa (alloy A_82) and 2.79 GPa (alloy A_82) from the Chen model. These hardness values are still quite high for Al–Mg–Si alloys. This can be attributed to the fact that the Chen and Tian models used in this study (and generally all macroscopic models) are known to overestimate hardness values for soft materials [28]. The negative values realized in the Chen model are due to the fact that there is a negative term (−3) in Equation (11). If the first term of the equation yields a value less than 3, then we end up getting a negative hardness value. The Chen model has been known to accurately predict the hardness of super-hard materials but yields negative values for softer materials (hardness less than 5 GPa) [28]. The increase in hardness of the alloys in this study can be attributed to the extensive alloying [9]. A_82 is, therefore, recommended for use in plane skins since it has the highest hardness of all the alloys.
The Vickers hardness falls first as the Si/Mg ratio is increased from zero, before rising to a maximum value, and then falling again slightly (Figure 7f). Precipitation is delayed in Mg-rich alloys (lower Si/Mg ratios), hence the low hardness values at low ratios [9]. The increase in hardness is due to more β″ precipitates, which are responsible for coarser structures in the 6xxx series and, hence, higher hardness. It is, however, worth noting that the increase in Vickers hardness with the Si/Mg ratio has a limit; it peaks when the Si/Mg ratio is 4.5 (alloy A_82), after which it generally drops. The Si/Mg ratio obtained here is different from that obtained in experimental studies. Since no heat treatments were performed in this study (only alloying was carried out), precipitation hardening, which involves the loss of the original elements and the formation of extremely small, uniformly dispersed particles (precipitates) of a second phase within the original phase matrix, was not realized. Precipitates are known to enhance the strength and hardness of Al–Mg–Si alloys. The Vickers hardness for pure aluminium (A_00) is 1.35 GPa. The values of Vickers hardness for Si/Mg ratios of 1 and below are negative, whereas for Si/Mg ratios above 1, the Vickers hardness is higher than that of pure Al. This implies that, to achieve a higher Vickers hardness, the amount of Si used in the alloy should be higher than the amount of Mg, with the peak being when the amount of Si is 4.5 times the amount of Mg.
4. Conclusions
The mechanical properties of Al–Mg–Si alloys at different concentrations of Al, Mg, and Si using first-principles calculations based on DFT have been investigated. The significance of the Si/Mg ratio in influencing the mechanical properties of Al–Mg–Si alloys has been confirmed. The results of the elastic stiffness constants reveal that all the alloys are mechanically stable under ambient conditions. Most of the properties in this study are at their optimum when the Si/Mg ratio is 4.5. Vickers hardness increases with an increase in the Si/Mg ratio, peaking when the value of the Si/Mg ratio is 4.5. The alloys can be used in the manufacture of parts for airplanes owing to their low densities and high hardness, especially in plane skins. All the alloy samples in this study were found to be ductile. However, the ductility criteria used in this study are not sufficient to make recommendations for applications where ductility is considered. Further investigations on these alloys, including, but not limited to, fabrication, heat treatments, cold work, and strain hardening, are recommended for improved mechanical properties.
Author Contributions
Conceptualization, M.M. and N.O.O.; methodology, K.K.P., M.M., N.O.O., F.M.G. and V.O.; software, V.O. and N.O.O.; validation, F.M.G., V.O. and M.M.; formal analysis, K.K.P., F.M.G., V.O., M.M. and N.O.O.; resources, V.O.; data curation, K.K.P.; writing—original draft preparation, K.K.P. and N.O.O.; writing—review and editing, F.M.G.; visualization, K.K.P.; supervision, M.M., F.M.G. and N.O.O.; project administration, M.M. All authors have read and agreed to the published version of the manuscript..
Funding
This research received no external funding.
Data Availability Statement
Data will be made available on request.
Acknowledgments
The authors acknowledge the Kenya Education Network (KENET) CMMS and ISP, Uppsala University for sponsorship of MSSEESA conferences, and also the Centre for High Performance Computing (CHPC) in Cape Town, South Africa for the computing resources provided.
Conflicts of Interest
The authors declare no conflict of interest.
References
- Hirsch, J. Aluminium alloys for automotive application. Mater. Sci. Forum 1997, 242, 33–50. [Google Scholar] [CrossRef]
- Hirsch, J. Recent development in aluminium for automotive applications. Trans. Nonferrous Met. Soc. China 2014, 24, 1995–2002. [Google Scholar] [CrossRef]
- Ambroziak, A.; Solarczyk, M.T. Application and Mechanical Properties of Aluminum Alloys; Gdansk University of Technology, Faculty of Civil and Environmental Engineering: Gdansk, Poland, 2018. [Google Scholar] [CrossRef]
- Heinz, A.; Haszler, A.; Keidel, C.; Moldenhauer, S.; Beneductus, R.; Miller, W.S. Recent development in aluminium alloys for aerospace applications. Mater. Sci. Eng. A 2000, 280, 102–107. [Google Scholar] [CrossRef]
- Hirsch, J. Automotive trends in aluminium—The European perspective. Mater. Sci. Forum 2004, 28, 14–23. [Google Scholar]
- Padmanaban, D.A.; Kurien, G. Silumins: The automotive alloys. AM&P Tech. Artic. 2012, 170, 28–30. [Google Scholar] [CrossRef]
- Derlet, P.M.; Andersen, S.J.; Marioara, C.D.; Froseth, A. A first rinciples study of the B″-phase in Al-Mg-Si alloys. J. Phys. Condens. Matter 2009, 14, 4011. [Google Scholar] [CrossRef]
- Baruah, M.; Borah, A. Processing and precipitation strengthening of 6xxx series aluminium alloys: A review. Int. J. Mater. Sci. 2020, 1, 40–48. [Google Scholar] [CrossRef]
- Mageto, J.M. TEM Study of Microstructure in Relation to Hardness and ductility In Al-Mg-Si Alloys (6xxx Series). Master’s Thesis, Department of Physics, Faculty of Natural Sciences and Technology, Norwegian University of Science and Technology (NTNU), Trondheim, Norway, 2003. [Google Scholar]
- Werinos, M.; Antrekowitsch, H.; Ebner, T.; Prillhofer, R.; Uggowitzer, P.J.; Pogatscher, S. Hardening of Al–Mg–Si alloys: Effect of trace elements and prolonged natural aging. Mater. Des. 2016, 107, 257–268. [Google Scholar] [CrossRef]
- Yuan, W.; Liang, Z.; Zhang, C.; Wei, L. Effects of La addition on the mechanical properties and thermal-resistant properties of Al–Mg–Si–Zr alloys based on AA 6201. Mater. Des. 2012, 34, 788–792. [Google Scholar] [CrossRef]
- Raj, R.J.; Selvam, P.; Pughalendi, M. A review of aluminum alloys in aircraft and aerospace industry. J. Huazhong Univ. Sci. Technol. 2021, 1671, 4512. [Google Scholar]
- Georgantzia, E.; Gkantou, M.; Kamaris, G.S. Aluminium alloys as structural material: A review of research. Eng. Struct. 2021, 227, 111372. [Google Scholar] [CrossRef]
- Lejaeghere, K.; Bihlmayer, G.; Bjorkman, T.; Blaha, P.; Blugel, S. Reproducibility in Density Functional Theory Calculations of Solids. Science 2016, 351, 3000. [Google Scholar] [CrossRef]
- Avery, P.; Wang, X.; Oses, C.; Gossett, E.; Proserpio, D.M.; Toher, C.; Curtalo, S.; Zurek, E. Predicting superhard materials via a machine learning informed evolutionary structure search. Comput. Mater. 2019, 89, 1038. [Google Scholar] [CrossRef]
- Jona, F.P.; Marcus, P.M. Lattice parameters of aluminium in Mbar range by first principles. J. Physiscs Condens. Matter 2006, 18, 10881–10888. [Google Scholar] [CrossRef]
- Vanderbilt, D. Soft self-consistent pseudopotential in generalised eigenvalue formalism. Phys. Rev. B Am. Phys. Soc. 1990, 41, 7892–7895. [Google Scholar] [CrossRef]
- Adllan, A.A.; Corso, A.D. Ultrasoft pseudopotentials and projector augmented-wave data sets: Application to diatomite molecules. J. Phys. Condens. Matter 2011, 23, 425501. [Google Scholar] [CrossRef]
- Ongwen, N.O.; Ogam, E.; Otunga, H. Ab initio study of elastic properties of orthorhombic cadmium stannate as a substrate for manufacture of MEMS devices. Mater. Today Commun. 2020, 26, 101822. [Google Scholar] [CrossRef]
- Bouchenafa, M.; Benmakhlouf, A.; Sidoumou, M.; Bouchemadou, A.; Maabed, S.; Halit, M. Theoretical investigation of the structural, elastic, electronic and optical properties of the ternary tetragonal tellurides KBTe2 (B = Al, In). Mater. Sci. Semicond. Process. 2020, 114, 105085. [Google Scholar] [CrossRef]
- Boucetta, S.; Zegrar, F. Density functional study of elastic, mechanical and thermodynamic properties of MgCu with a CsCl-type structure. J. Magnessium Alloys 2013, 1, 128–133. [Google Scholar] [CrossRef]
- Daoud, S.; Loucif, K.; Bioud, N.; Lebga, N. First-principles study of structural, elastic and mechanical properties of zinc-blende boron nitride (B3-BN). Acta Phys. Pol. A 2012, 122, 109–115. [Google Scholar] [CrossRef]
- Ongwen, N.O.; Ogam, E.; Fellah, Z.E.A.; Otunga, H.O.; Oduor, A.; Mageto, M. Accurate Ab-initio calculation of elastic constants of anisotropic binary alloys: A case of Fe–Al. Solid State Commun. 2022, 353, 114879. [Google Scholar] [CrossRef]
- Wen, Y.; Wang, L.; Liu, H.; Song, L. Ab initio study of elastic and mechanical properties of B19 TiAl. Crystals 2017, 7, 39. [Google Scholar] [CrossRef]
- Hill, R. The elastic behaviour of a crystalline aggregate. Proc. Physcal Soc. A 1952, A65, 349. [Google Scholar] [CrossRef]
- Chen, X.Q.; Niu, H.; Franchini, C.; Li, D.; Li, Y. Hardness of T-carbon: Density functional calculations. Phys. Rev. B 2011, 84, 121405. [Google Scholar] [CrossRef]
- Ongwen, N.; Ogam, E.; Fellah, Z.E.A.; Mageto, M.; Othieno, H.; Otunga, H. Thermal properties and pressure-dependent elastic constants of cadmium stannate as a substrate for MEMS: An ab initio study. Phys. B Condens. Matter 2022, 651, 414599. [Google Scholar] [CrossRef]
- Kiely, E.; Zware, R.; Fox, R.; Reilly, A.; Guerin, S. Density functional theory predictions of the mechanical properties of crystalline materials. R. Soc. Chem. 2021, 23, 5697–5710. [Google Scholar] [CrossRef]
- Froseth, A.G.; Hoier, R.; Derlet, P.M.; Andersen, S.J.; Marioara, C.D. Bonding in MgSi and Al-Mg-Si compounds relevant in Al-Mg-Si alloys. Phys. Rev. B 2003, 67, 224106. [Google Scholar] [CrossRef]
- Nakashima, P.N.H. The Crystallography of Aluminium and Its Alloys. In Encyclopedia of Aluminium and Its Alloys; Totten, G.E., Tiryakioglu, M., Kessler, O., Eds.; CRC Press: Boca Raton, FL, USA, 2018; pp. 488–586. [Google Scholar]
- Hashiguchi, D.; Ashurst, A.N.; Grensing, F.C.; Marder, J.M. Materion beryllium & composites. In Proceedings of the International Symposium Advanced Materials for Lightweight Structures, ESTEC, Noordwijk, The Netherlands, 25–27 March 1992. [Google Scholar]
- Marie, H.A. Retrieved from What Is Shear Modulus? Available online: https://www.thoughtco.com/shear-modulus-4176406 (accessed on 17 February 2021).
- Hadi, M.; Rayhan, M.; Naqib, S.; Chroneous, A.; Islam, A. Structural, elastic, thermal and lattice dynamic propertiesof new 321 MAX phases. Comput. Mater. Sci. 2019, 170, 109144. [Google Scholar] [CrossRef]
- Fleury, E.; Kim, D. Poisson’s ratio and fragility of bulk metallic glasses. J. Mater. Res. 2008, 23, 523–528. [Google Scholar] [CrossRef]
- Pugh, S. XCII. Relations between the elastic moduli and the plastic properties of polycrystalline pure metals. Lond. Edinburg Dublin Philos. J. Sci. 1954, 84, 823–843. [Google Scholar] [CrossRef]
- Teter, D. Computational alchemy: The search for new super hard materials. MRS Bull. 1998, 23, 22–27. [Google Scholar] [CrossRef]
Figure 1.
Three-dimensional structures of (a) an aluminium unit cell and (b) a supercell of the A_19 (a 3 × 3 × 3 modeled Al–Mg–Si) alloy as visualized in Burai. The grey spheres represent the aluminium atoms; the brown spheres represent the silicon atoms; and the green spheres represent the magnesium atoms.

Figure 2.
Graphs of total energy against kinetic energy cut-off for (a) sample A_00, (b) sample A_19, and (c) all 10 samples combined.
Figure 2.
Graphs of total energy against kinetic energy cut-off for (a) sample A_00, (b) sample A_19, and (c) all 10 samples combined.

Figure 3.
Graphs of total energy against K_points for (a) sample A_00, (b) sample A_19, and (c) all 10 samples combined.
Figure 3.
Graphs of total energy against K_points for (a) sample A_00, (b) sample A_19, and (c) all 10 samples combined.

Figure 4.
Graphs of total energy per atom against normalized unit cell volume (V/Vo).

Figure 5.
Graphs of equilibrium unit cell parameters and the densities of the alloy samples against the Si/Mg ratio.
Figure 5.
Graphs of equilibrium unit cell parameters and the densities of the alloy samples against the Si/Mg ratio.

Figure 6.
Calculated stress–strain curves for elastic stiffness constants (a) c11, (b) c12, and (c) c44 for samples A_00 and A_19.
Figure 6.
Calculated stress–strain curves for elastic stiffness constants (a) c11, (b) c12, and (c) c44 for samples A_00 and A_19.

Figure 7.
Variations of the mechanical properties of the Al–Mg–Si alloys: (a) bulk modulus, (b) shear modulus, (c) Young’s modulus, (d) Poisson’s ratio, (e) Pugh’s ratio, and (f) Vickers hardness as a function of Si/Mg ratio.
Figure 7.
Variations of the mechanical properties of the Al–Mg–Si alloys: (a) bulk modulus, (b) shear modulus, (c) Young’s modulus, (d) Poisson’s ratio, (e) Pugh’s ratio, and (f) Vickers hardness as a function of Si/Mg ratio.


Table 1.
Concentrations of various Al–Mg–Si alloys (6xxx series) and the number of atoms of each element.
Table 1.
Concentrations of various Al–Mg–Si alloys (6xxx series) and the number of atoms of each element.
| Sample ID | Silicon | Magnesium | Aluminium | Si/Mg Ratio | Si/(Mg+Si) | |||
|---|---|---|---|---|---|---|---|---|
| Conc. (%) | Atoms | Conc. (%) | Atoms | Conc. (%) | Atoms | |||
| A_00 | 0 | 0 | 0 | 0 | 100 | 108 | - | - |
| A_19 | 1 | 1 | 9 | 10 | 90 | 97 | 0.100 | 0.091 |
| A_28 | 2 | 2 | 8 | 9 | 90 | 97 | 0.222 | 0.182 |
| A_37 | 3 | 3 | 7 | 8 | 90 | 97 | 0.375 | 0.270 |
| A_46 | 4 | 4 | 6 | 7 | 90 | 97 | 0.571 | 0.364 |
| A_55 | 5 | 5 | 5 | 5 | 90 | 97 | 1.000 | 0.455 |
| A_64 | 6 | 7 | 4 | 4 | 90 | 97 | 1.750 | 0.545 |
| A_73 | 7 | 8 | 3 | 3 | 90 | 97 | 2.667 | 0.636 |
| A_82 | 8 | 9 | 2 | 2 | 90 | 97 | 4.500 | 0.727 |
| A_91 | 9 | 10 | 1 | 1 | 90 | 97 | 10.00 | 0.818 |
Table 2.
Computed unit cell volumes and densities of the nine alloy samples.
| Alloy Sample | a (Å) | ρ (g/cm3) |
|---|---|---|
| A_00 | 4.020 (4.050 a) (4.032 b) | 2.756 (2.700 c) (2.700 d) |
| A_19 | 4.005 | 2.762 |
| A_28 | 4.003 | 2.770 |
| A_37 | 4.002 | 2.779 |
| A_46 | 4.000 | 2.783 |
| A_55 | 3.999 | 2.790 |
| A_64 | 3.997 | 2.801 |
| A_73 | 3.995 | 2.808 |
| A_82 | 3.994 | 2.815 |
| A_91 | 3.993 | 2.821 |
Table 3.
Calculated elastic stiffness constants (, and ) of the alloy samples.
| Alloy Sample | Si/Mg Ratio | (GPa) | (GPa) | (GPa) |
|---|---|---|---|---|
| A_00 | - | 100.5 | 62.5 | 34.6 |
| A_19 | 0.100 | 90.5 | 68.0 | 33.2 |
| A_28 | 0.222 | 87.8 | 69.5 | 29.5 |
| A_37 | 0.375 | 87.0 | 69.9 | 29.5 |
| A_46 | 0.571 | 82.5 | 71.0 | 24.5 |
| A_55 | 1.000 | 88.6 | 71.5 | 29.6 |
| A_64 | 1.750 | 114.3 | 61.8 | 34.4 |
| A_73 | 2.667 | 118.2 | 59.9 | 34.2 |
| A_82 | 4.500 | 126.3 | 58.7 | 34.8 |
| A_91 | 10.00 | 123.3 | 63.3 | 33.2 |
Table 4.
Calculated elastic constants (bulk modulus (B), shear modulus (G), Young’s modulus (E), Poisson’s ratio (μ), Pugh’s ratio (n), and Vickers hardness (Hv) of the alloy samples. μ and n do not have units.
Table 4.
Calculated elastic constants (bulk modulus (B), shear modulus (G), Young’s modulus (E), Poisson’s ratio (μ), Pugh’s ratio (n), and Vickers hardness (Hv) of the alloy samples. μ and n do not have units.
| Alloy Sample | Si/Mg Ratio | B (GPa) | G (GPa) | E (GPa) | µ | n | Hv (GPa) Chen | Hv (GPa) Tian |
|---|---|---|---|---|---|---|---|---|
| A_00 | - | 74.0 | 27.6 | 73.1 | 0.335 | 2.70 | 1.35 | 3.14 |
| A_19 | 0.100 | 75.5 | 21.5 | 59.0 | 0.370 | 3.51 | −0.22 | 1.94 |
| A_28 | 0.222 | 75.6 | 18.5 | 51.3 | 0.387 | 4.09 | −0.88 | 1.46 |
| A_37 | 0.375 | 75.6 | 18.0 | 50.1 | 0.390 | 4.20 | −0.97 | 1.39 |
| A_46 | 0.571 | 74.8 | 13.8 | 39.0 | 0.413 | 5.42 | −1.71 | 0.86 |
| A_55 | 1.000 | 77.2 | 18.0 | 50.2 | 0.392 | 4.28 | −1.02 | 1.37 |
| A_64 | 1.750 | 79.3 | 30.9 | 82.0 | 0.328 | 2.57 | 1.93 | 3.57 |
| A_73 | 2.667 | 79.3 | 32.1 | 84.6 | 0.322 | 2.48 | 2.27 | 3.82 |
| A_82 | 4.500 | 81.2 | 34.4 | 90.4 | 0.315 | 2.36 | 2.79 | 4.24 |
| A_91 | 10.00 | 83.3 | 31.9 | 84.8 | 0.330 | 2.61 | 1.93 | 3.58 |
Disclaimer/Publisher’s Note: The statements, opinions and data contained in all publications are solely those of the individual author(s) and contributor(s) and not of MDPI and/or the editor(s). MDPI and/or the editor(s) disclaim responsibility for any injury to people or property resulting from any ideas, methods, instructions or products referred to in the content. |
© 2023 by the authors. Licensee MDPI, Basel, Switzerland. This article is an open access article distributed under the terms and conditions of the Creative Commons Attribution (CC BY) license (https://creativecommons.org/licenses/by/4.0/).
Share and Cite
MDPI and ACS Style
Pius, K.K.; Ongwen, N.O.; Mageto, M.; Odari, V.; Gaitho, F.M. Mechanical Properties of Al–Mg–Si Alloys (6xxx Series): A DFT-Based Study. Alloys 2023, 2, 213-226. https://0-doi-org.brum.beds.ac.uk/10.3390/alloys2030015
AMA Style
Pius KK, Ongwen NO, Mageto M, Odari V, Gaitho FM. Mechanical Properties of Al–Mg–Si Alloys (6xxx Series): A DFT-Based Study. Alloys. 2023; 2(3):213-226. https://0-doi-org.brum.beds.ac.uk/10.3390/alloys2030015
Chicago/Turabian StylePius, Kipkorir Kirui, Nicholas O. Ongwen, Maxwell Mageto, Victor Odari, and Francis Magiri Gaitho. 2023. "Mechanical Properties of Al–Mg–Si Alloys (6xxx Series): A DFT-Based Study" Alloys 2, no. 3: 213-226. https://0-doi-org.brum.beds.ac.uk/10.3390/alloys2030015