Article

A Process for Monitoring the Impact of Architecture Principles on Sustainability: An Industrial Case Study

1
Department of Computer Science, Vrije Universiteit Amsterdam, 1081 HV Amsterdam, The Netherlands
2
Department of Information Engineering, Univerisity of Florence, 50121 Florence, Italy
3
Schiphol Group, 1118 CP Schiphol, The Netherlands
*
Author to whom correspondence should be addressed.
Submission received: 9 February 2024 / Revised: 6 March 2024 / Accepted: 8 March 2024 / Published: 13 March 2024

Abstract

:
Architecture principles affect a software system holistically. Given their alignment with a business strategy, they should be incorporated within the validation process covering aspects of sustainability. However, current research discusses the influence of architecture principles on sustainability in a limited context. Our objective was to introduce a reusable process for monitoring and evaluating the impact of architecture principles on sustainability from a software architecture perspective. We sought to demonstrate the application of such a process in professional practice. A qualitative case study was conducted in the context of a Dutch airport management company. Data collection involved a case analysis and the execution of two rounds of expert interviews. We (i) identified a set of case-related key performance indicators, (ii) utilized commonly accepted measurement tools, and (iii) employed graphical representations in the form of spider charts to monitor the sustainability impacts. The real-world observations were evaluated through a concluding focus group. Our findings indicated that architecture principles were a feasible mechanism with which to address sustainability across all different architecture layers within the enterprise. The experts considered the sustainability analysis valuable in guiding the software architecture process towards sustainability. With the emphasis on principles, we facilitate industry adoption by embedding sustainability in existing mechanisms.

1. Introduction

Increasing global concerns about climate change have raised interest in environmental sustainability in various research disciplines and industry sectors. The aviation sector, for instance, has been actively shifting to greener practices. A 2013 report found that the majority of European aviation players anticipate the impact of climate change on their operations by 2050 [1]. As a consequence, the Schiphol Group (https://www.schiphol.nl/en/schiphol-group/, accessed: 30 January 2024), who is responsible for managing Amsterdam’s Schiphol Airport, announced their vision for 2050 as “create the world’s most sustainable airports” [2].
In approaching the concept of sustainability, we recognize the United Nations’ fundamental definition as the “environment’s ability to meet present and future needs” [3]. This global perspective has led to the emergence of sustainability development goals (SDGs) (https://sdgs.un.org/goals, accessed: 30 January 2024) as worldwide targets, along with actionable indicators to measure progress on a global scale. However, for industries that focus on specific impacts and outcomes, a more targeted approach is needed. In this regard, Wynn and Jones [4] uncovered “an issue about how companies report their progress in addressing the SDGs”, noting that “there is no generally agreed framework for companies to report on the SDGs”. Reporting becomes particularly important in light of the Corporate Sustainability Reporting Directive (CSRD) enforced by the EU in 2023 [5]. The CSRD sets high reporting standards for sustainability information for a wide range of companies. These requirements, together with the strategic sustainability goals defined by companies, identify the need to strengthen and monitor sustainability in an industrial context [6]. Key performance indicators (KPIs) have proven to be a useful tool for continuously monitoring project performance [7,8] and can provide the necessary feedback on whether strategic sustainability goals are being achieved ([6], ch.4). We therefore use KPIs to facilitate a systematic approach to measuring sustainability in the context of software architecture.
Software architecture is defined as a major part of the software engineering discipline. It is described as a process of organizing components to form an overarching system [9] and has as a foundation “to reason about the system” ([10], p. 4). In practice, software architecture is a process that affects an enterprise holistically and thus emerges at different business layers: (i) enterprise, (ii) application and data, and (iii) technology architectures [11]. A strategic transformation, like the vision of the Schiphol Group for 2050, requires instruments on all these layers to steer decisions towards the future. Within software architecture, principles are an instrument used to fill in the gap between the different layers, i.e., between the high-level strategic objectives and the specific design and implementation decisions [12]. Principles provide underlying rules and guidelines for realizing the strategic objectives [11,12]. In this research, we use the concept of architecture principles to effectively embed sustainability into the software engineering process, helping organizations achieve their strategic goals for a more sustainable environment. Thanks to the close relation of principles with the business layers, KPIs provide an effective mechanism for quantifying the principles’ impact on sustainability. Long-term observations in the form of KPIs can help in identifying positive or negative effects and can therefore support the software architecture process.
To achieve sustainable development in the first place, four sustainability dimensions should be considered [13]: technical, economic, environmental, and social. However, current research and industrial practice discuss software architecture and its impact mostly regarding certain aspects of sustainability, such as environmental concerns only (e.g., [14,15,16]).
In response to the problem statements above, the main objective of this research was to create a process for evaluating and monitoring the impact of architecture principles on the four sustainability dimensions. In addition, we aimed to illustrate the application and integration of such a process in professional practice. In cooperation with the Schiphol Group, we addressed this objective by executing a case study and examining potential KPIs and their impact on sustainability.
In a previous study conducted with the Schiphol Group, Gupta et al. [17] proposed the principle, rationale, strategies, and measures (PRSM) model to map a software architecture principle incorporating these four sustainability dimensions. In that work, the authors focused on the theoretical background and evaluated it based on various software architecture principles. However, the framework was developed without relation to an actual software solution and without validation of the measures. In our present follow-up study, we reused and extend this PRSM model and evaluated it on a real-world software solution. The Schiphol Group is a suitable example of a large airport management company whose business strategy is already positioned towards sustainable IT and which is already using the sustainability framework of Gupta et al. [17] in practice.
Our main contributions consist of the following:
(i)
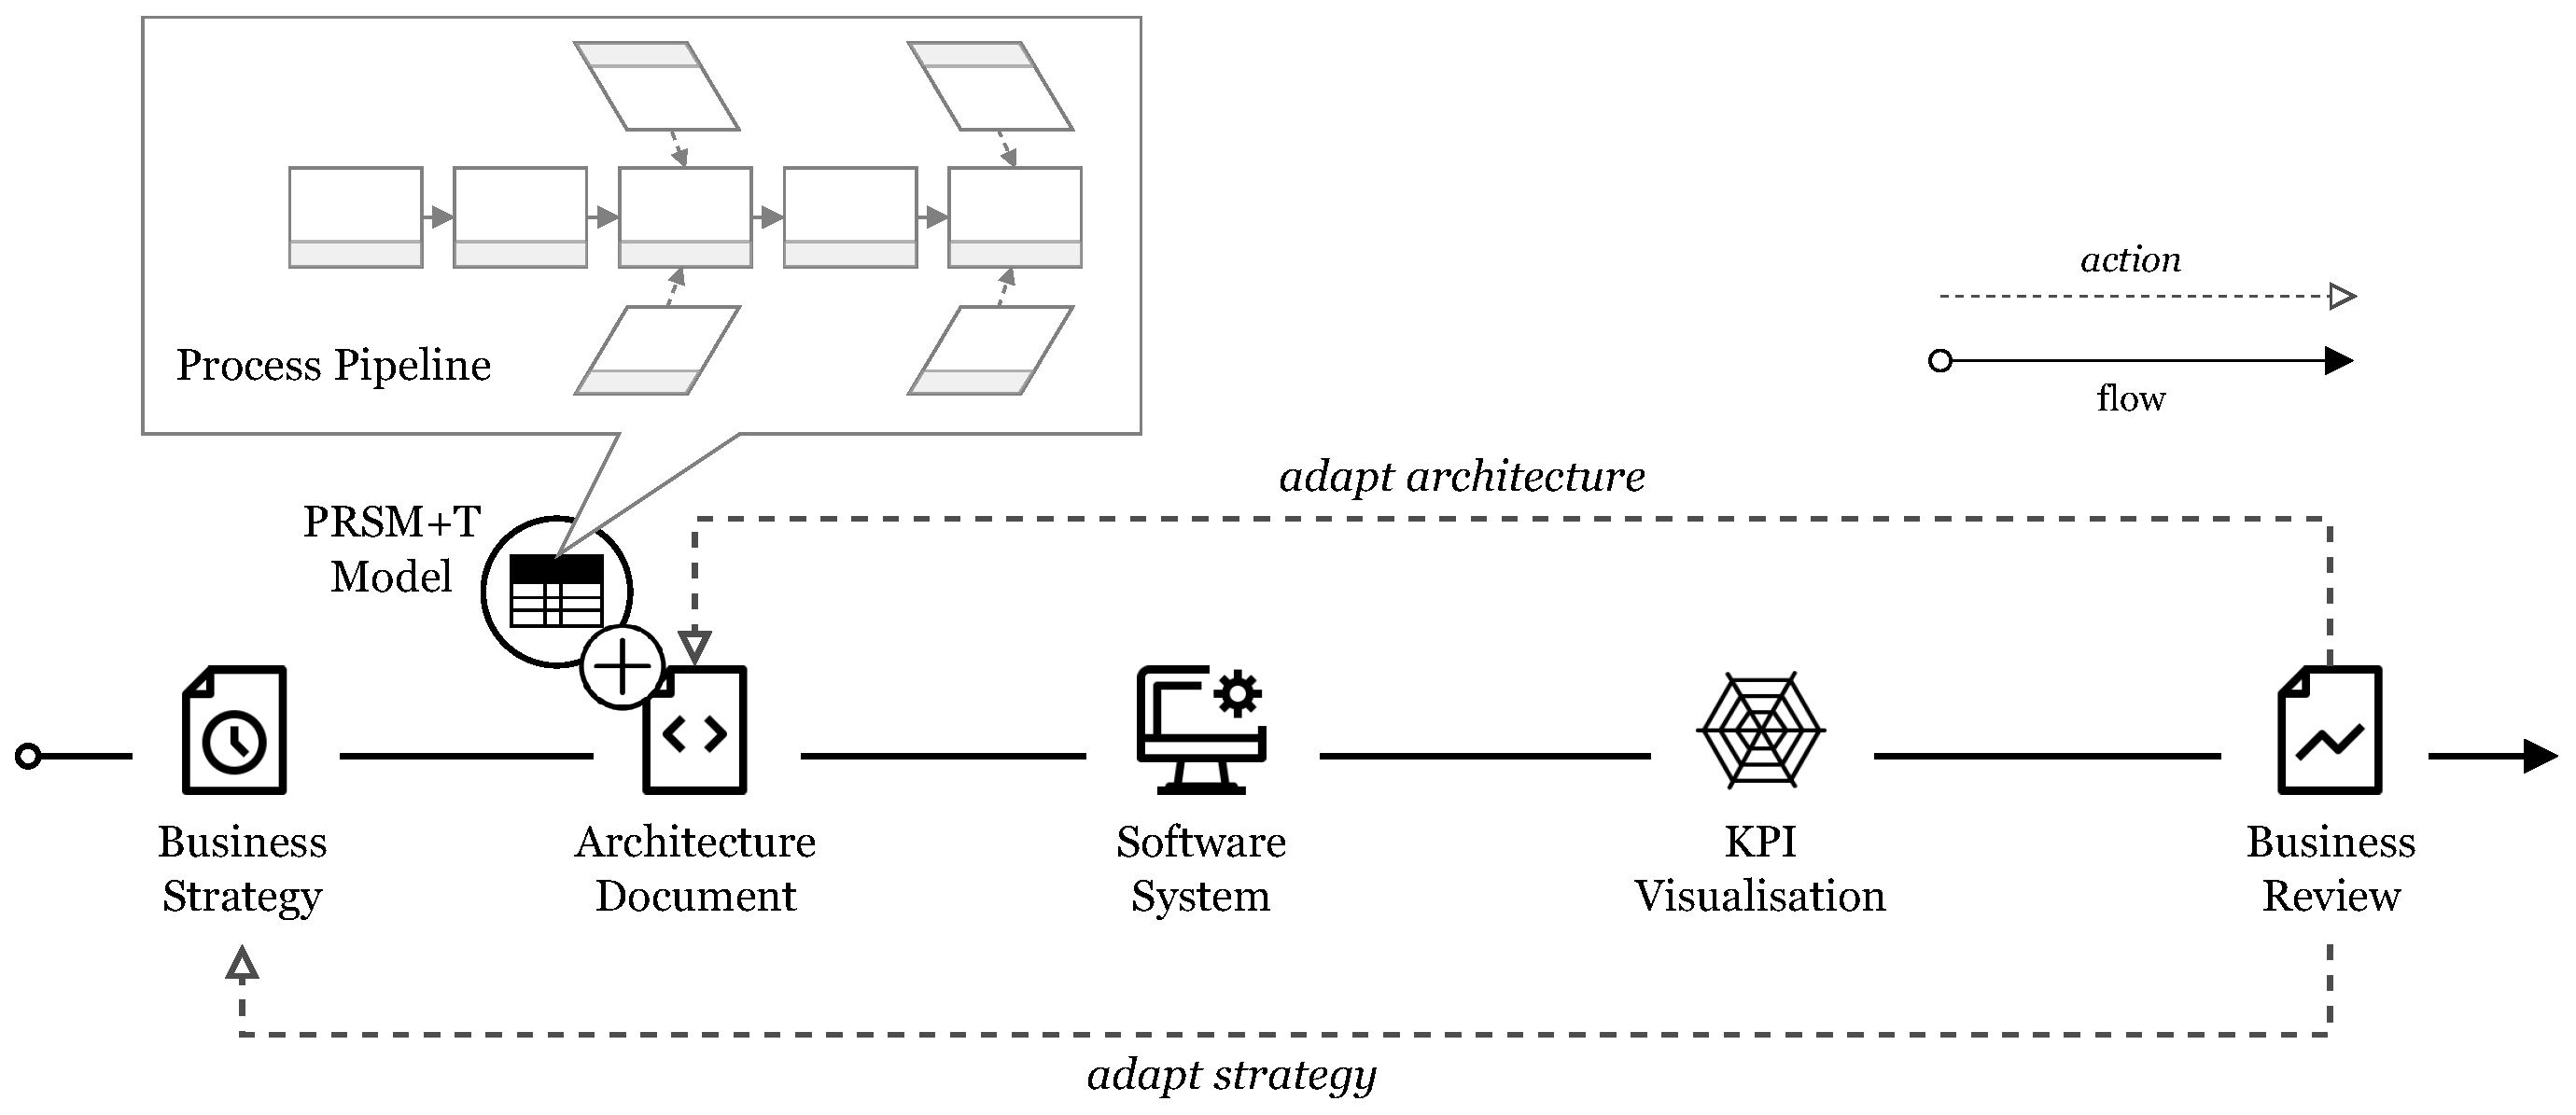
a process pipeline to perform sustainability analysis, i.e., to obtain PRSM models and their extension. The pipeline associates architecture principles with sustainability quality attributes, KPIs, and measurement tools to monitor them;
(ii)
the visualization of the derived measurements in the form of two types of spider chart. The graphical representations can be used on strategic, operational, and tactical levels to derive a principle’s performance regarding sustainability;
(iii)
the application of the process pipeline and visualizations in a real-world context, to draw conclusions for future studies.
This paper is organized as follows: Section 2 provides information and the necessary context to help understand the background. Section 3 presents our research questions and describes the research steps, as well as the method we used to answer them. Section 4 outlines the industrial case study in detail. Section 5 documents the results of our study in the form of the final sustainability models, KPIs, and measurement tools. An evaluation of the results is given in Section 6 in the form of concrete measurements and the execution of a focus group. Section 7 presents an analysis and discussion of the results and reports potential threats to validity. Section 8 discusses related work, and finally, in Section 9 we close the paper by summarizing the results and outlining possible future research.

2. Background

In this section, we present the concept of measuring business objectives, the background in software and sustainability, and the groundwork on which our work is based on. Since we rely on a number of concepts that are relevant to this study, we provide an overview of the most important concepts summarized in Table 1.

2.1. Key Performance Indicators

In large organizations, KPIs can act as a fundamental management tool for identifying gaps between the current situation and the business and IT strategy goals aspired to, locating issues and closing gaps [8]. In our study, KPIs provide a suitable mechanism to define measurable objectives and monitor the impact of architecture principles on sustainability. To evaluate the conditions and relevance of a certain KPI we make use of the SMART (specific, measurable, achievable, relevant, time phased) characteristics. The SMART conditions were first introduced by Doran [18] to define effective business objectives. Ishak et al. [22] documented how the SMART method became a widely-used concept and evolved into a mainstream method. Beyond the SMART evaluation of KPIs, Parmenter further describes seven characteristics of business KPIs [8,23] such as “measurement timing” and “responsibilities”. To the best of our knowledge, there is no current research that applied the SMART method or the characteristics from Parmenter to KPIs concerning software sustainability. In our research, we will showcase that both concepts can be successfully used in such a context.
The Schiphol Group has already implemented various KPIs to continuously monitor its business performance and steer its processes. As IT is an enabler, helping a business to reach its business goals, the Schiphol Group has defined an IT & Data strategy 2021–2023 to support achieving their vision. In our case study, we made use of this strategy to map existing goals (e.g., use re-usable standardized building blocks) and existing KPIs (e.g., up-time for key platforms) onto software architecture principles regarding their sustainability impact. Nevertheless, we could only consider the available KPIs as preliminary, since they were developed with a different objective: to fill in the technology component towards the overall vision for 2050. In our research, however, we aimed for balanced sustainability, which includes the consideration of multiple sustainability dimensions. Moreover, we wanted to use KPIs to show how the impact of a software system on sustainability can be monitored—rather than the impact of the entire Schiphol Group. Therefore, it may not be possible to reuse all existing KPIs in their current form or benchmark them against existing measurements.

2.2. Software and Sustainability

Sustainability has been identified as a crucial part of software [13,24,25]. Towards IT sustainability, four dimensions [13] or five dimensions [25] have been identified, respectively. As the “individual”, the fifth dimension represents the well-being of an individual, we embed this dimension within the social sustainability dimension, and thus follow the approach and definitions from Lago et al. [13], as described below:
  • The technical dimension includes aspects about the implementation of a system and concerns about the evolution, maintenance, and long-term use of systems regarding software aspects.
  • The economic dimension refers to business concerns as capital investment and profitability to protect capital.
  • The social dimension focuses on the concepts of embedding software systems into communities (i.e., humans, groups, or organizations) to improve maintainability, trust, and quality for the software users.
  • The environmental dimension goes beyond CO2 emissions and covers the effects of our actions on the natural ecosystem and its preservation to ensure long-term human welfare [13,25].
Condori-Fernandez and Lago [20] characterized traditional quality attributes (QAs) according to the ISO/IEC 25010 SQuaRE [26] standard and identified their contribution to sustainability. The output is two-fold: (i) all ISO/IEC 25010 QAs are mapped onto the four sustainability dimensions to create a Sustainability–Quality (SQ) model, and (ii) dependencies between the QAs and dimensions are uncovered and quantified by providing a set of dependency matrixes (D-matrix). The SQ model offers the possibility of expressing QAs related to a particular software project and of defining the individual characteristics and their impact on the sustainability dimensions. By defining the D-matrix, a QA can either have a contribution in two different dimensions (inter-dependency) or it can relate to a different QA within the same dimension (intra-dependency). The follow-up research from Condori-Fernandez et al. [19] combined the contributions outlined above in the form of the sustainability-quality assessment framework (SAF) toolkit [21]. The SAF-Toolkit also incorporates decision maps (DMs) [27] to provide software architects with the necessary tools to holistically support decision making from a software sustainability perspective. We made use of the SAF-Toolkit as part of our sustainability analysis and for defining sustainability QAs for architecture principles in a standardized way.

2.3. PRSM Framework

Gupta et al. [17] proposed a framework to map software architecture principles on all four sustainability dimensions. The authors redefined a strategic planning process model to link architecture principles to their sustainability concerns: the OGSM model (objective, goals, strategies, and measures), which is used in the strategic planning process to develop and document goals, strategic rationales, and accompanying actions to achieve precise and measurable objectives [28], was transformed into the PRSM model (principle, rationale, strategies, and measures). The framework was developed to establish a balance for a sustainable business and its services [17]. The Schiphol Group served as an example to derive software architecture principles at enterprise, solution, and domain levels; but the principles were not applied as part of a specific software solution.
For our research, however, these architecture principles and their analysis cannot be reused, as they do not apply to our chosen case. Beyond this limitation, the work from Gupta et al. [17] did not consider the ISO/IEC 25010 standard as a guideline for defining software quality attributes. In comparison, our work aimed at an elaboration of the PRSM model incorporating the ISO/IEC 25010 standard. This standard is widely used in professional practice, including by the Schiphol Group. The relevance of our work is also underlined by the future work suggested by Gupta et al. [17], who proposed monitoring architecture principles and their KPIs to determine the impacts of the design decisions taken. The PRSM model is therefore reused and evaluated for the first time in the context of a real-world software solution.

3. Study Design

In this section, we describe the method used in our research and the details of the study design. First, the overarching research questions are outlined. Then, the design of our study is reported by discussing all three research phases. To address the overarching research objective, we derived a main research question ( R Q ). This R Q was further divided into two sub-questions, R Q 1 and R Q 2 , as further documented below. As this research was conducted as an industrial study, we defined the research questions within the context of a given organization embedded in the aviation sector.
RQ 
How can key performance indicators of software architecture principles be operationalized and measured concerning sustainability?
By answering this main R Q , we identified and evaluated options for measuring KPIs continuously in an industrial context. This enabled analyzing and monitoring the impact of software architecture principles on the four sustainability dimensions over time.
RQ1 
What tools are accessible to measure sustainability key performance indicators for software solutions within a given organization?
Our goal was to identify a set of tools within the portfolio of a particular organization to measure KPIs in different sustainability dimensions. Since a tool portfolio is available beyond a specific software solution, these tools can also be applied to other solutions. It is common practice to measure KPIs in technical and economic dimensions, such as the number of bugs, the code quality, and the net revenue. The goal was to also derive tools for environmental and social dimensions.
RQ2 
To what extent can the sustainability key performance indicators be monitored in an automatic way?
We used the tools identified in R Q 1 to investigate whether KPIs can be monitored in an automatic way. Automation would allow continuous monitoring as well as continuous evaluation of the impact over time.
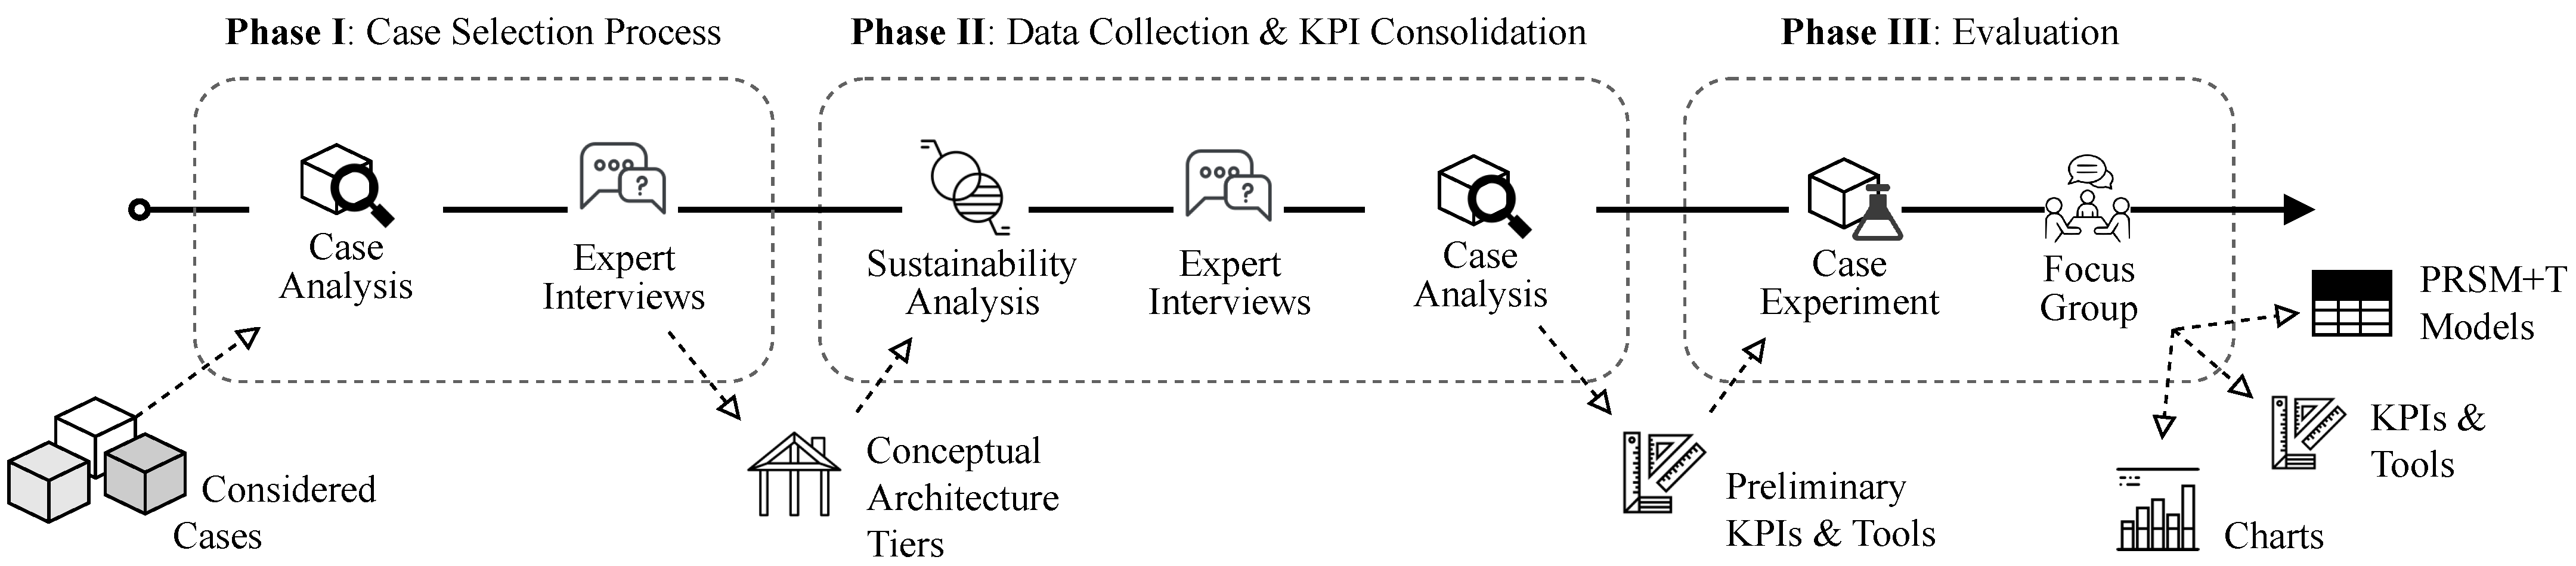
Our research is organized in three phases. An overview of the study design is given in Figure 1, explaining the individual steps at a high level in the following. A detailed examination of the steps involved is outlined in detail later on in Section 4.
  • Phase I
This phase was dedicated to the selection of the case under investigation. As stated in the objective of this research, we aimed to define a process for measuring the sustainability impact of architecture principles. To that extent, we used a real-world software system to develop such a process. We only considered one software system, as we wanted to derive and evaluate the process based on this case. According to Darke et al. [29], focusing on one specific case allows for an in-depth investigation and thorough comprehension of the desired methodology. Nevertheless, to generalize and strengthen our outcomes, additional cases were needed to validate and confirm the findings in contexts beyond the Schiphol Group [29,30]. The threats to validity in Section 7.2 discuss this in more detail.
To identify a suitable case for this research, we analyzed various software-intensive systems according to a set of systematic evaluation criteria, which will be introduced later on. After the case had been selected, the software system was studied in depth. For that purpose, available documentations were scrutinized to gain familiarity with the software solution and to create an overview of its architecture. As the main document, we considered the architecture definition document (ADD). However, since not all information and background details can be part of such document, a second data source was used: expert interviews were conducted to validate and enrich the information extracted from the ADD.
As every single Schiphol Group software solution is driven by more than 20 architecture principles, we focused on the most influential ones, to achieve targeted and analyzable results. Consequently, Phase I organized the software solution according to its main architecture tiers based on the ADD and the internal organizational structure, i.e., the project teams. Once derived, these tiers were revised by the experts during the interviews. Hence, the output of Phase I was one concrete case, structured by its conceptual tiers.
  • Phase II
We built on Phase I to determine the driving architecture principles associated with a particular tier. Additionally, we aimed to distill associated KPIs (potentially) into all four sustainability dimensions particular to the case under study. The proposed PRSM framework from Gupta et al. [17] was used to conduct the sustainability analysis and map the case-relevant architecture principles onto all four sustainability dimensions. To underline the measurement tools required to monitor the associated KPIs, we introduced a dedicated column for the tools. We detached the tools (+T), as they are only an extension and were not necessarily needed for the analysis of the architecture principles themselves. While the PRSM model was sufficient to perform the sustainability analysis, the PRSM+T model focuses on an industrial context and was necessary to monitor the architecture principles over the long-term. In the remainder of our study, we refer to the PRSM model as the tool-agnostic model and the PRSM+T model as the tool-dependent model.
The Schiphol IT & Data strategy 2021–2023 was consulted to identify preliminary KPIs. The potential set of KPIs, together with their sustainability mapping and related architecture principles, were used for a second round of expert interviews. Reviewing the interview results for their suitability for the selected case, a preliminary set of KPIs and measurement tools was evolved. These KPIs and tools served as input for the final evaluation phase. The methodology of research Phase II, i.e., the sustainability analysis, was concluded by providing a developed process pipeline. Such a pipeline is essential to define a standardized process for deriving a PRSM model for arbitrary architecture principles. We implemented this pipeline to complement the overall study design and the work of Gupta et al. [17]. It was also necessary in order to create comparable PRSM models across organizations in a systematic manner.
  • Phase III
Finally, we evaluated the obtained results by implementing the selected tools in the chosen case. The results were concrete measurements in the form of spider charts. This output is intended to help software architects and researchers monitoring sustainability KPIs. The measurements and visualizations served as input for a final focus group to evaluate the results based on expert knowledge. These insights allowed presenting sound case study results, along with reusable tools and KPIs. As a result, this phase provided (i) an extension of the PRSM model from Gupta et al. [17] to the PRSM+T model, (ii) a set of software sustainability KPIs and measurement tools, and (iii) a proposal to visualize the measurements in the form of spider charts.

4. Study Execution

Our research followed the guidelines from Runeson and Höst [30] for conducting and reporting case study research in software engineering. Accordingly, a case study protocol together with a checklist was used to document each research phase and all case study design decisions [30,31]. Both are available in the online replication package (https://github.com/S2-group/MDPI_monitoring-sustainability_rep-pkg, accessed: 30 January 2024).

4.1. Case and Subject Selection

Despite the observation from Runeson and Höst [30] that a case under study is usually intentionally selected, we opted for a systematic selection process to increase the replicability of our single-case research. Hence, all eligible cases from the Schiphol group were examined based on a list of criteria. Three criteria were derived from Runeson and Höst [30] (i.e., C1—Availability, C2—Confidentiality, C3—Case Size); the other three emerged from experience with industrial projects and were only considered for this research purpose (i.e., C4—Development status, C5—Relevance, C6—Completeness). The criteria and their descriptions are outlined in the case study protocol as part of the replication package.
Initially, six cases were provided. As a detailed documentation of all the different cases is beyond the scope of this study and would not provide valuable insights into answering the research questions, only the evaluation of the actual case is presented in the case study protocol available online. After applying the criteria to the software solutions, we concluded that all criteria positively contributed to the selection of the datahub platform Port Community System (PCS). Only the large case size (C3) and the proof of concept (PoC) development status (C4) of the PCS solution could be partly considered as negative aspects. However, both criteria were considered to be a trade-off between (i) a wide range of available data and the extensive familiarization period, and (ii) the limited feature set and the coherence with multiple architecture principles.

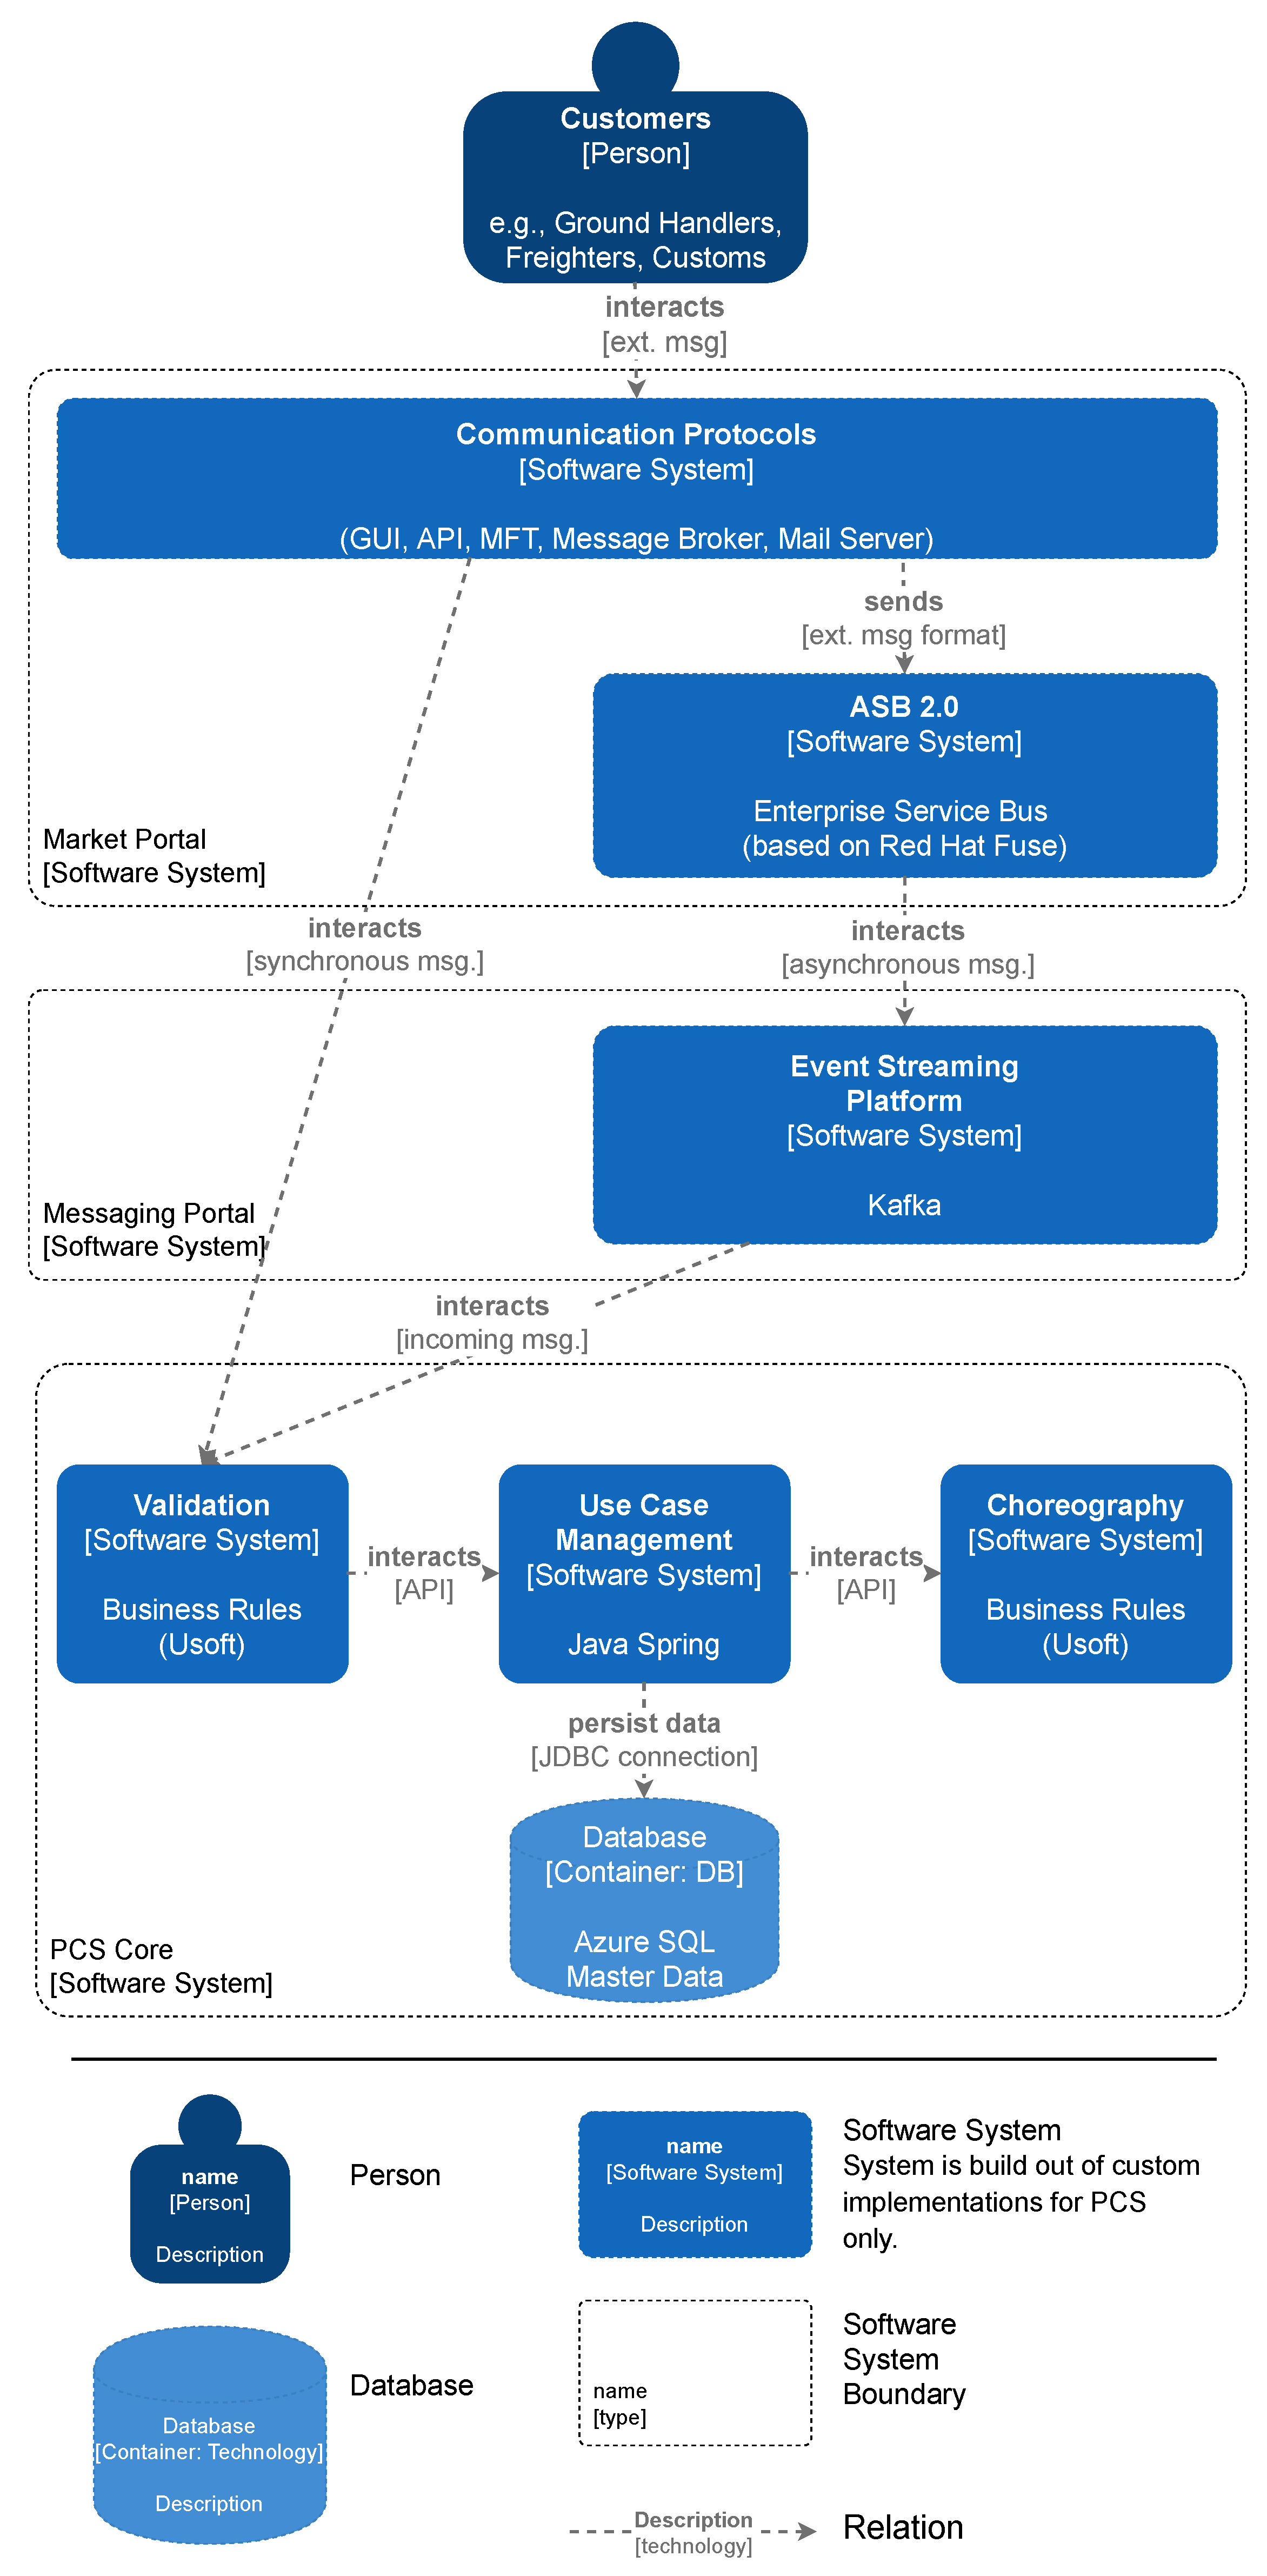
4.2. Case Description

The datahub platform PCS handles and integrates Cargo freight related messages from and to various parties for the aviation sector. Its main goal is to prepare, create, and keep track of the documents necessary for the transportation of goods from a shipper to the consignee. All involved customers and authorities can exchange data with each other and keep track of the status. The simplified architecture of the PCS solution is visualized in Figure 2. All provided information about the software solution itself, its architecture, and the functionalities were gathered by consulting the ADD and weekly tutorial sessions with software architects. Figure 2 highlights the interaction between the customers (i.e., the freighters, ground handlers, and customs) with the airport.
The description below outlines the general flow following the components depicted in Figure 2: the customer claims access to the system as they want to input or request certain data into or from the PCS system. This access is achieved via various interfaces and communication protocols, i.e., external data formats. These protocols are (mostly) implemented as architecture building blocks. By relying on building blocks, the package of functionality can be ideally (re)used across software solutions and an organization [11,33]. The external data formats needed to be translated into an internal data format, specifically valid for the PCS solution. This translation was carried out at the Market Portal via the Airport Service Bus (ASB). The ASB is dedicated to implementing information exchange based on enterprise service bus (ESB) technology. After a message has been translated, it is published as an event on the Messaging Portal which event consumers can subscribe to. Eventually, the message is processed by the PCS Core, which is responsible for outbound message orchestration, use case management, validation, and persistent data storage.

4.3. Case and Units of Analysis

According to the definition of Runeson and Höst [30], we can consider the PCS solution as holistic case study with embedded units of analysis. In our research, the Schiphol Group served as the context of the case study. Three different units of analysis were embedded and examined, namely (unit #1) the tiers of the PCS solution, (unit #2) the driving software architecture principles, and (unit #3) the Schiphol IT & Data Strategy 2021–2023, with predefined strategic goals, metrics, and KPIs. By combining the case units of analysis, we could focus on the most driving parts of the software-intensive system (unit #1), perform a sustainability analysis of its architecture (unit #2), and map our findings to an actual business strategy (unit #3).

4.4. Expert Interviews

Two rounds of expert interviews were executed. Interviewees were invited according to their role and responsibility regarding the PCS solution (cf. Table 2). The initial contact with the experts was facilitated by the fourth author of our study, who possesses a network of contacts within the company and a comprehensive knowledge of each expert’s role. This ensured a targeted recruitment process, enhancing the relevance of our experts to the PCS solution. In total, five participants were involved, divided into four interview sessions; P#2 and P#3 were interviewed at the same time as they are both key players concerning the PCS architecture. The interviews were conducted to increase the precision of this research and were used as data triangulation, to use sources beyond the provided documents [30].
All interviews were designed as semi-structured interviews, to provide as much flexibility as possible but also to obtain replicable results. A mix of open and closed questions led to funnel interview sessions [30], by starting with open and broad questions and moving to more specific ones. The two interview rounds are described below; the full structure, including all questions, can be found in Appendix A.
In Round I we identified the driving architecture principles for the case under research. Sub-objectives were to validate the previously defined tiers, gather first-hand knowledge about the PCS case and its stakeholders, and assemble potential QAs for sustainability. We aimed to identify the driving software architecture principles concerning the selected tiers. To achieve this goal, the participants were asked the following main question:
What architecture principle(s) would you define as driving one(s) for this specific part of the PCS solution?
In Round II we derived potential KPIs, gathered universally valid measurement units, and explored the set of available or potential tools to measure the KPIs. The main question of this interview session was as follows:
Regarding the PCS solution, what KPIs, metrics, and measurement tools would you define as applicable to this specific architecture principle?
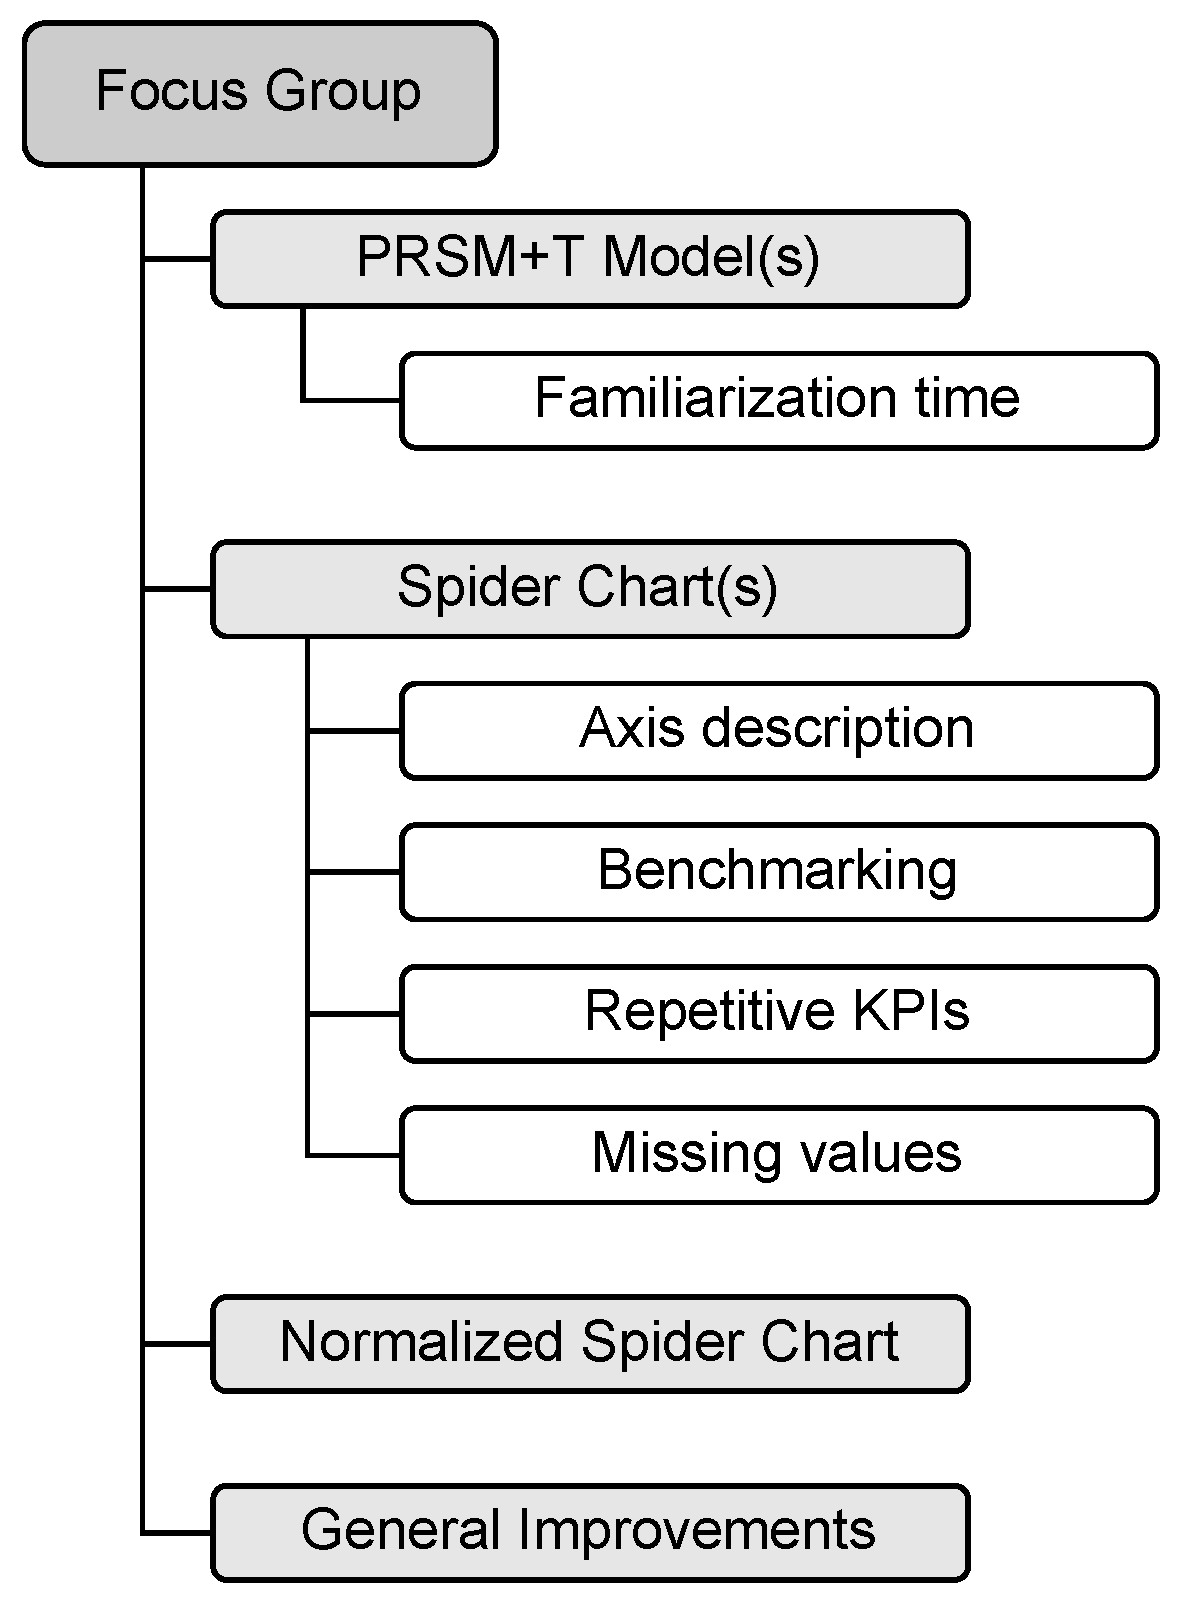
The results presented in this research, i.e., the architecture principles, QAs, KPIs, and measurement tools were directly derived from the interviews. Since the experts are solely responsible for their allocated role and were solely interviewed about that role, the derived results could be directly attributed to the associated interviewee. Specifically, this means that the use of a particular coding strategy or a qualitative analysis of the interview sessions was not necessary. To address any potential gaps encountered during the interviews, available documents were consulted by a researcher (i.e., the ADD and the Schiphol IT & Data Strategy) and then re-evaluated in the second interview session. Such interim steps are reported as intermediate results in the replication package, which is publicly available.

4.5. Focus Group

As proposed by Kontio et al. [34], focus groups are a suitable tool for the evaluation phase of research; focus groups help answer questions like “what are the potential problems in using or understanding the model?”. According to the authors, a focus group should be organized in three steps: (i) preparation, (ii) execution, and (iii) analysis. These steps are further described below.
  • Preparation
To follow the study design and comply with the typical size of focus groups (4–8 participants [34]), the same five experts interviewed in research Phase I and II were invited. This selection allowed the experts to collectively evaluate the isolated results of the other participants from the previous interview phases. The focus group was structured in the form of presentation slides. The predefined questions are available in Appendix A. The main objective of this focus group was to
Evaluate the final PRSM+T models with their measurements and their spider charts as a tool to visualize sustainability.
  • Execution
A “synchronous online focus group” [34] was conducted, which means that the participants were at different places at the same time and the group was computer-mediated by using Microsoft Teams as the online-meeting tool. To provide a common setting, the session was opened with a short summary of the research topic. After this introduction, general rules (e.g., time window, audio recording, etc.) were presented.
  • Analysis
After finishing the focus group, the recording was transcribed, analyzed, and reported. In contrast to the interviews, the aim of the focus group was to evaluate existing results. Hence, only the opinions and viewpoints of the experts on the final results were essential. We applied open and axial coding to the focus group transcript to achieve bottom-up coding and a synthesis of the observations (i.e., inductive coding [35]). This meant that no predefined coding categories were applied, rather the categories emerged from reading the transcript [35]. The procedure finally delivered four coding categories and five sub-categories, as illustrated in Figure 3. According to these categories, the main observations of the focus group are discussed and evaluated in Section 6.3.

5. Results

This section outlines the findings obtained with this research. All parts are the result of applying the process pipeline. Specifically, four independent pipeline processes were performed: a separate process for each architecture principle. First, we introduce the selected PCS tiers together with their mapped principles. Second, the process pipeline is introduced, considering three different levels of abstractions. At each level, the pipeline is examined at a different granularity, to increase adoption beyond our specific case. Third, the PRSM+T model developed for a concrete architecture principle is explained in detail. Then, the used KPIs are discussed in detail. Last, all considered measurement tools are analyzed.

5.1. Architecture Principles

As described, the conceptual tiers were used to create a high-level abstraction of the PCS solution. By executing research Phase I and conducting the first interview session, the driving architecture principles according to these tiers were derived and are presented in Table 3. Throughout our research, they were used to (i) distil sustainability QAs, (ii) map KPIs, and (iii) depict suitable tools to measure the impact on sustainability.

5.2. Process Pipeline
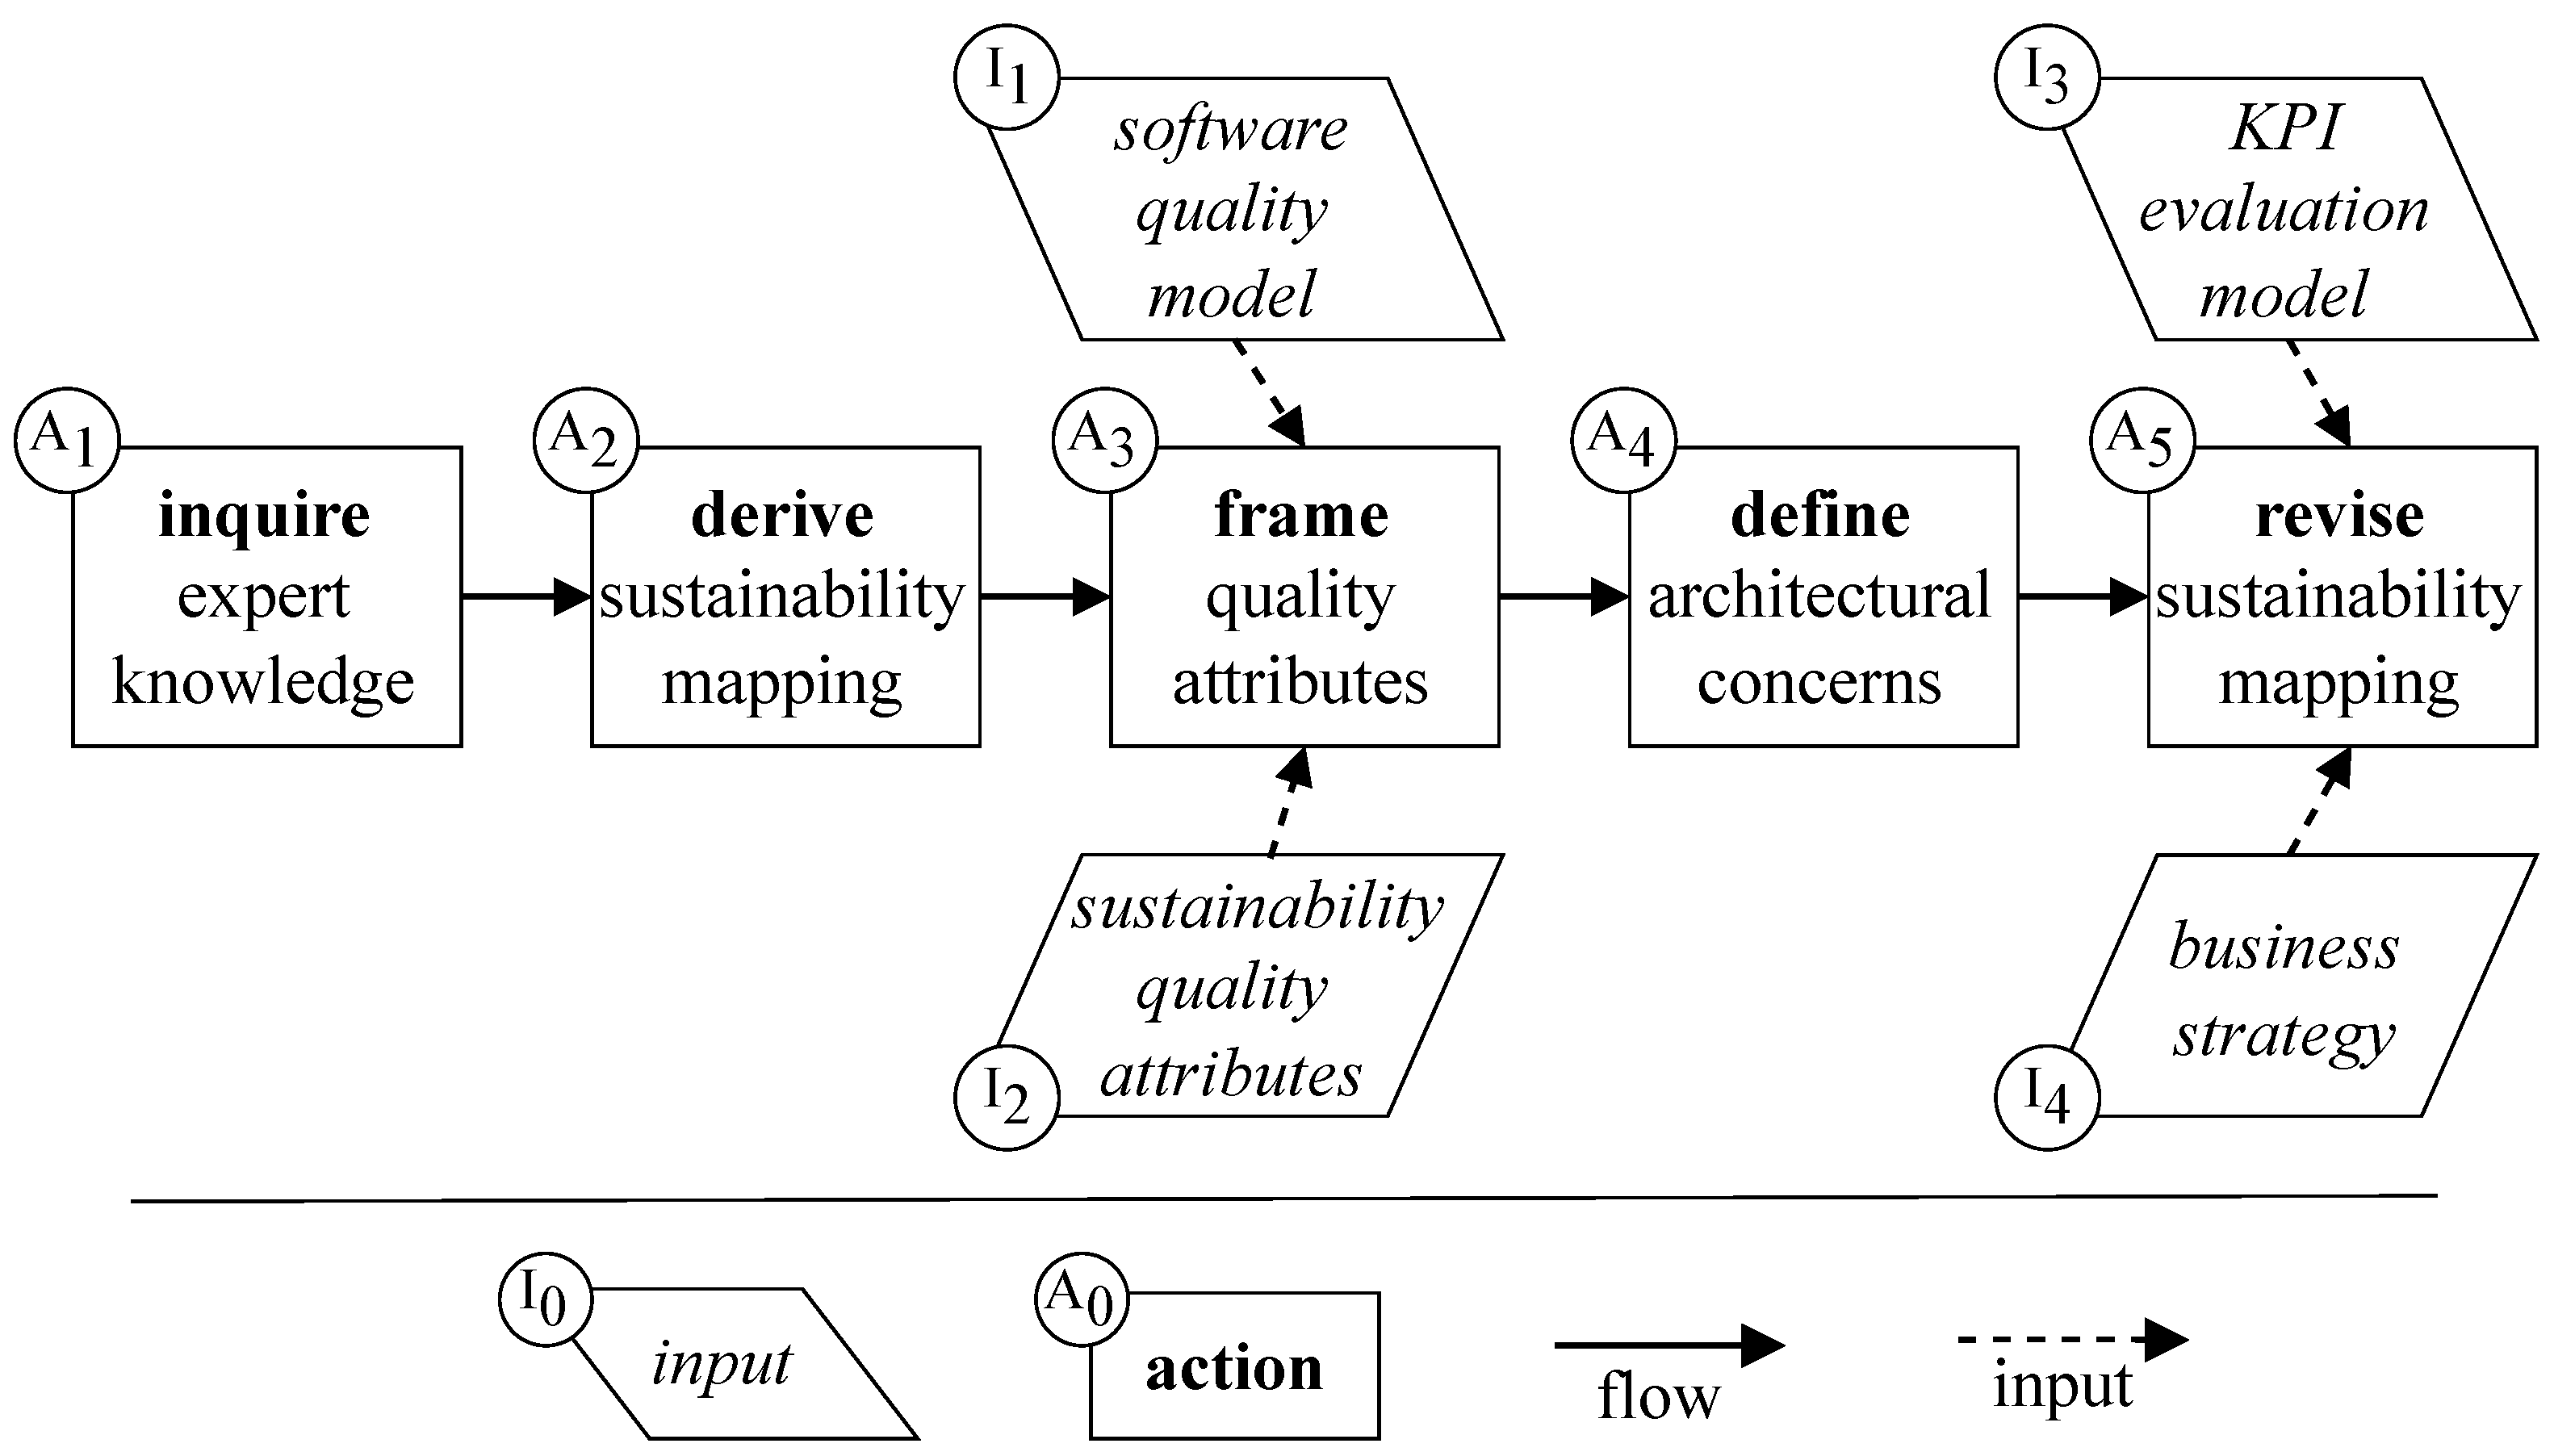
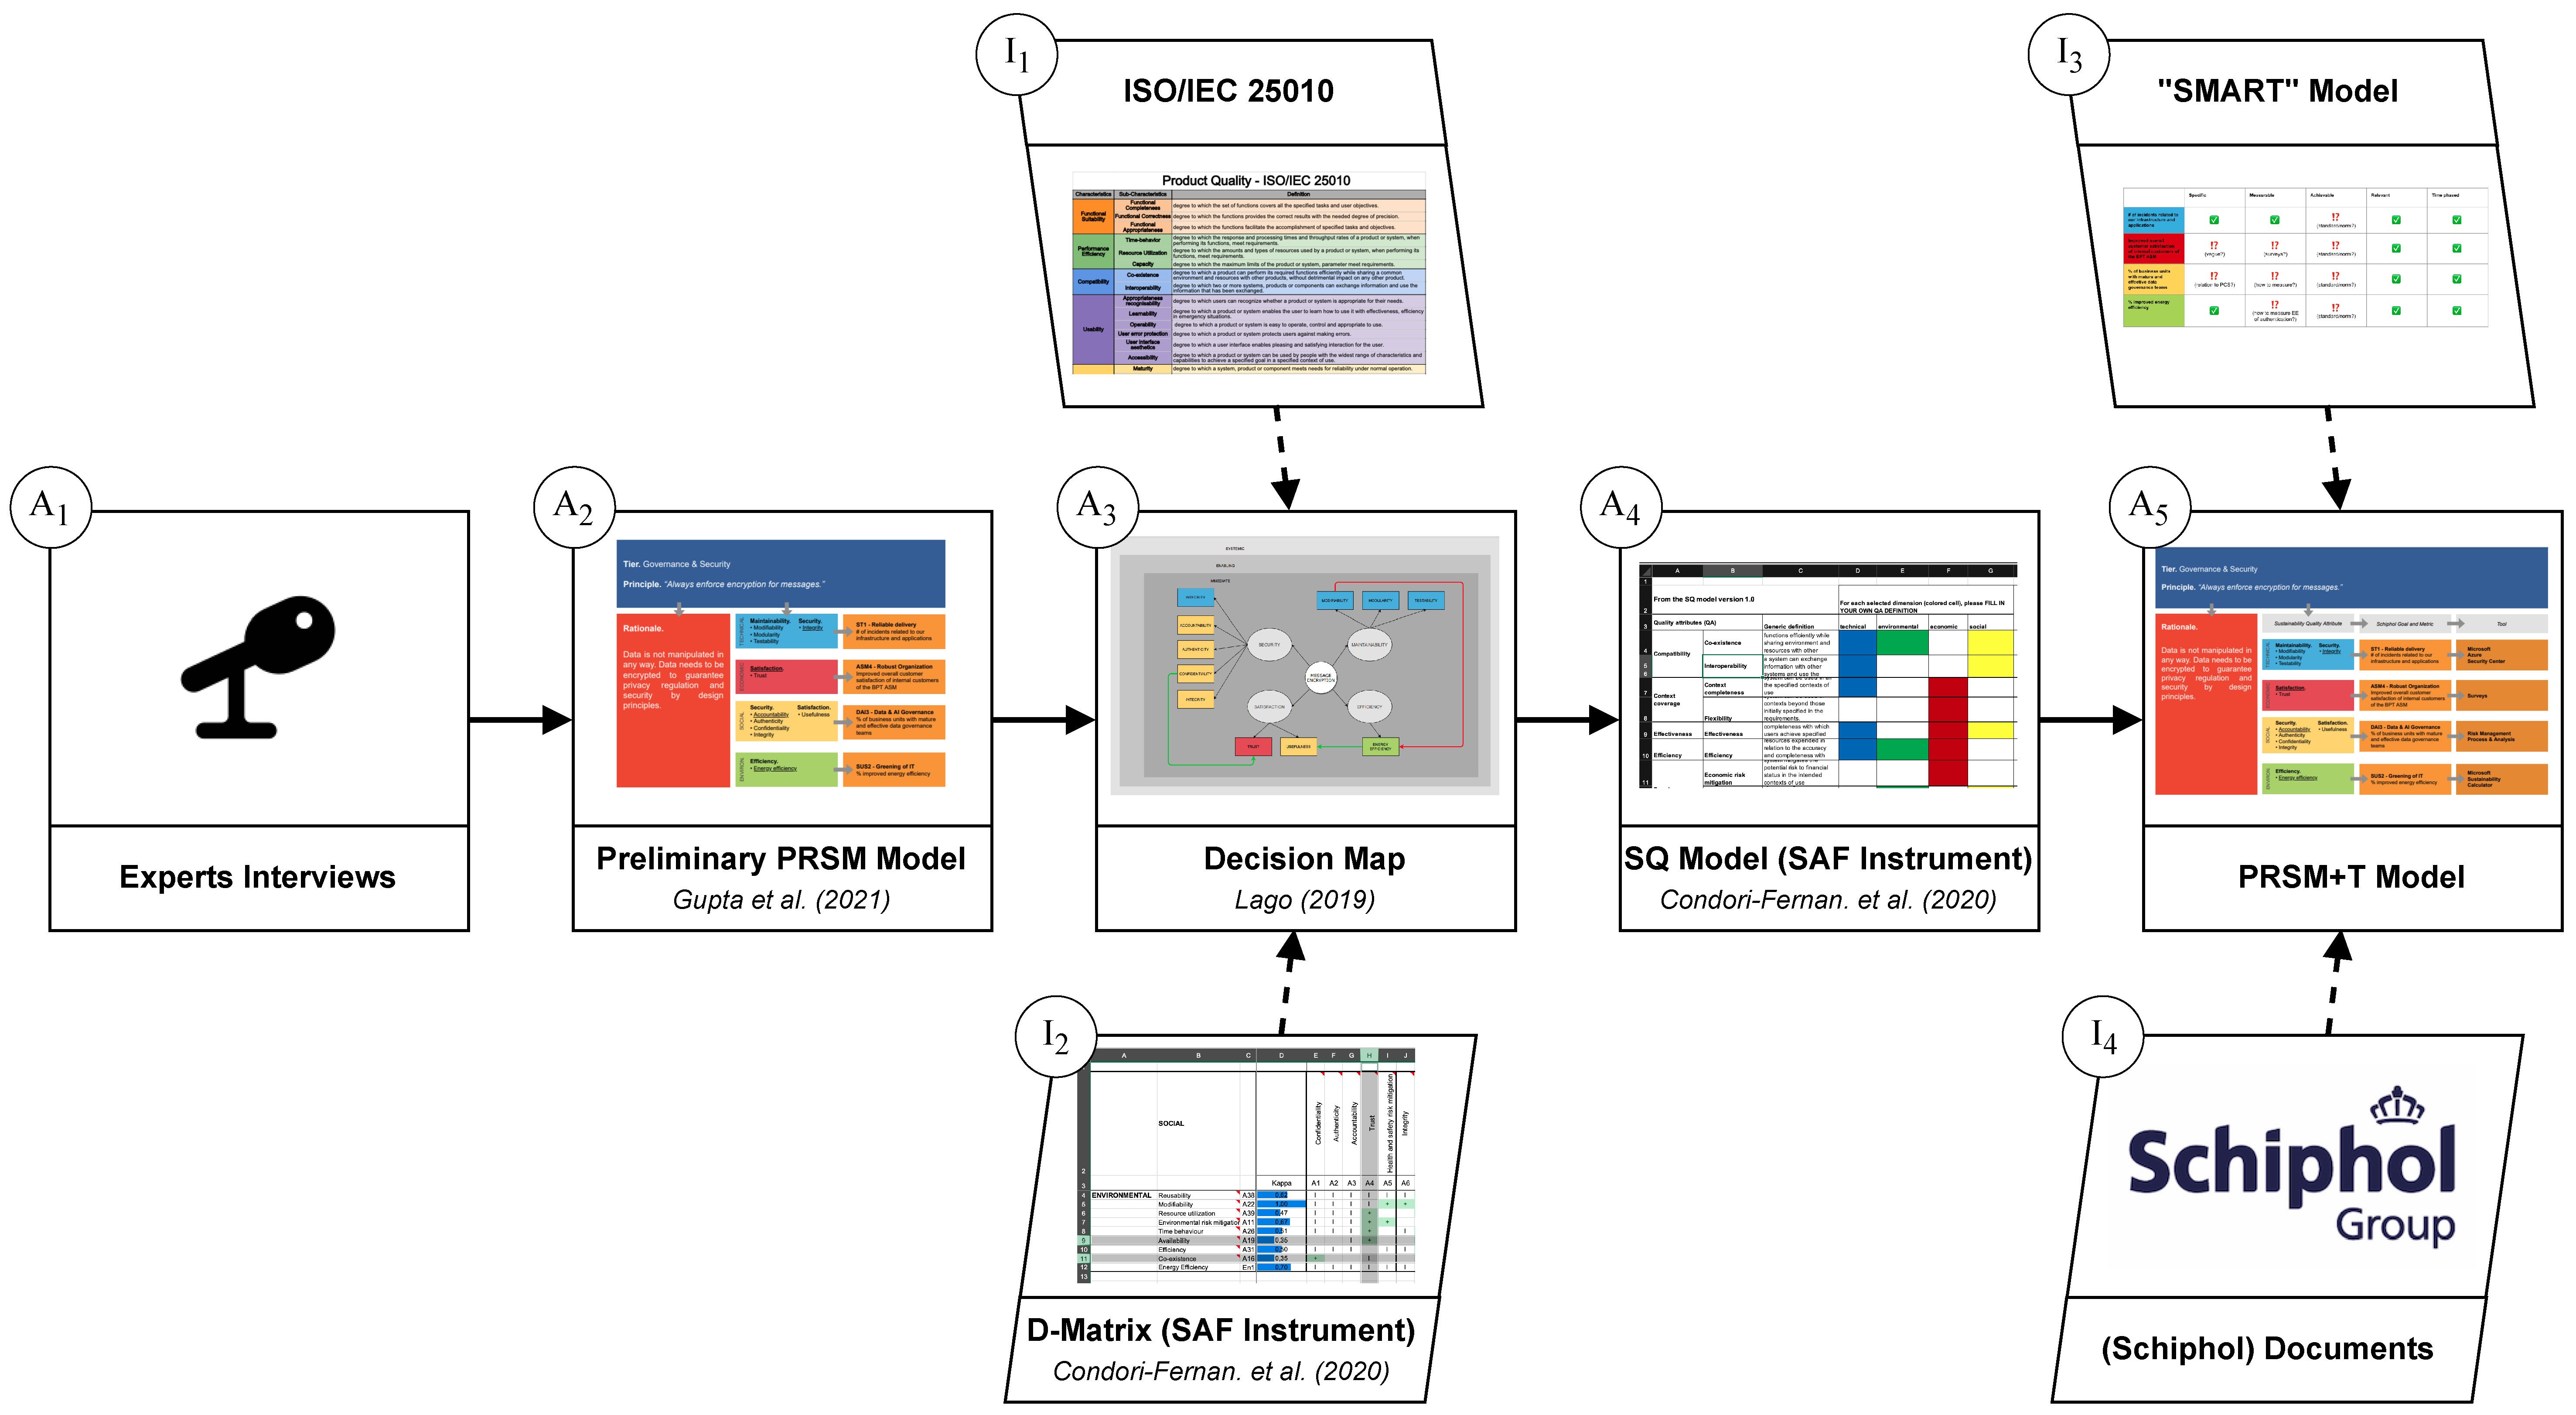
To analyze the architecture principles and their impact on sustainability in a structured and reproducible way, a process pipeline was implemented and is presented in this section. In a first step, we described the process at an abstract level. The abstraction reduced the pipeline to the underlying concepts, without specifying concrete models. This allows adoption beyond the Schiphol Group, as all models can be replaced by other or similar ones—as long as the purpose is preserved. In the second step, we populated the actions and inputs with concrete models that were used in our case study. In this step, we put the pipeline into a tangible environment and implemented it in professional practice. In the final step, we conceptually tied the process pipeline into a general business context and illustrated how the pipeline and its output could be integrated into the decision-making process.

5.2.1. Abstraction

Figure 4 shows the process pipeline at an abstraction level. All actions and inputs are described below.
A 1
gathers the necessary knowledge about the software system under study. We used the knowledge of the experts, i.e., the software architects, to determine which software architecture principle should be selected for the sustainability analysis and the rationale with respect to the software system. This information could only be derived from the experts involved in the development of the system, as only they were in a position to judge which principles were relevant. To our knowledge, there is no current model or architecture documentation strategy that documents the driving principles for a particular software system in a systematic way, so that information can be derived automatically.
A 2
captures the expert knowledge in a preliminary sustainability analysis by mapping potential QAs to the selected principle and software system. We called this the preliminary sustainability analysis because the potential QAs should already be mapped to the four sustainability dimensions. Only when all four dimensions were considered could a balanced sustainability be achieved. The analysis was considered as preliminary, since the QAs would be refined later in the process.
A 3
models the preliminary QAs in a systematic way. For this purpose, we considered an arbitrary software quality model I 1 together with a list of sustainability quality attributes I 2 . Both allowed us to (i) uncover related QAs, (ii) identify sustainability-related quality concerns on all four dimensions, and (iii) uncover missing dependencies. Both inputs ensured replicability and comparability with other sustainability analyses performed with the same software quality model. The output of this step constituted a model containing all related sustainability QA for a particular principle in the form of, e.g., a diagram.
A 4
captures each defined sustainability QA definition regarding their context. Determining concrete definitions allowed (i) the selected sustainability QA to be documented in a structured way for future assessment and (ii) the selected sustainability QA to be reconsidered and revised.
A 5
assigns KPIs and measurement tools to the sustainability QAs, resulting in a viable version of the sustainability analysis. The KPIs can either be derived from an existing business strategy I 4 or developed from scratch. In either case, we suggest considering KPIs that contribute to a specific business objective—only then can we derive relevant information about whether the principle, and thus the software solution, is steering in the right strategic direction. We suggest applying a KPI assessment model I 3 to evaluate the conditions and relevance of the selected KPIs.
Completing all steps led to a first working-version of the sustainability analysis. The analysis focused on (i) the most relevant sustainability QAs, (ii) KPIs that measure the impact of the QAs, (iii) associated business objectives, and (iv) tools available to monitor the defined KPIs. The proposed pipeline can be repeated arbitrarily such that each repetition results in revised components (e.g., revised concerns).

5.2.2. Implementation

Figure 5 illustrates the same process pipeline as described before, though now showing the concrete concepts used for implementing and applying the process in a real-world scenario. The preliminary PRSM model in A 2 represents the tool agnostic model and performed the sustainability analysis according to Gupta et al. [17]; while A 3 A 4 followed the general usage-guidelines of the SAF-Toolkit from Lago and Condori-Fernandez [21]. A 5 concluded the pipeline by proposing the tool-dependent model, i.e., the PRSM+T model, and set the focus to a business and industrial context. Whereas the actions A 2 A 4 and inputs I 1 I 3 were based on existing deliverables and widely-used standards, they were all developed either in isolation or without a software sustainability context. By combining and reusing these existing concepts, we were able to propose a reference process to perform the sustainability analysis for architecture principles in a structured manner. All concepts are described below.
A 1
For our case study, interviews with the five experts were used to derive the necessary knowledge.
A 2
The interview results led to a preliminary PRSM model. The model captured the architecture principle, its rationale, and assigned QAs, while keeping the four sustainability dimensions in mind. At this stage, the model may include a set of multiple sustainability QAs for each dimension; ambiguities and uncertainties will be eliminated in the subsequent steps or another iteration.
A 3
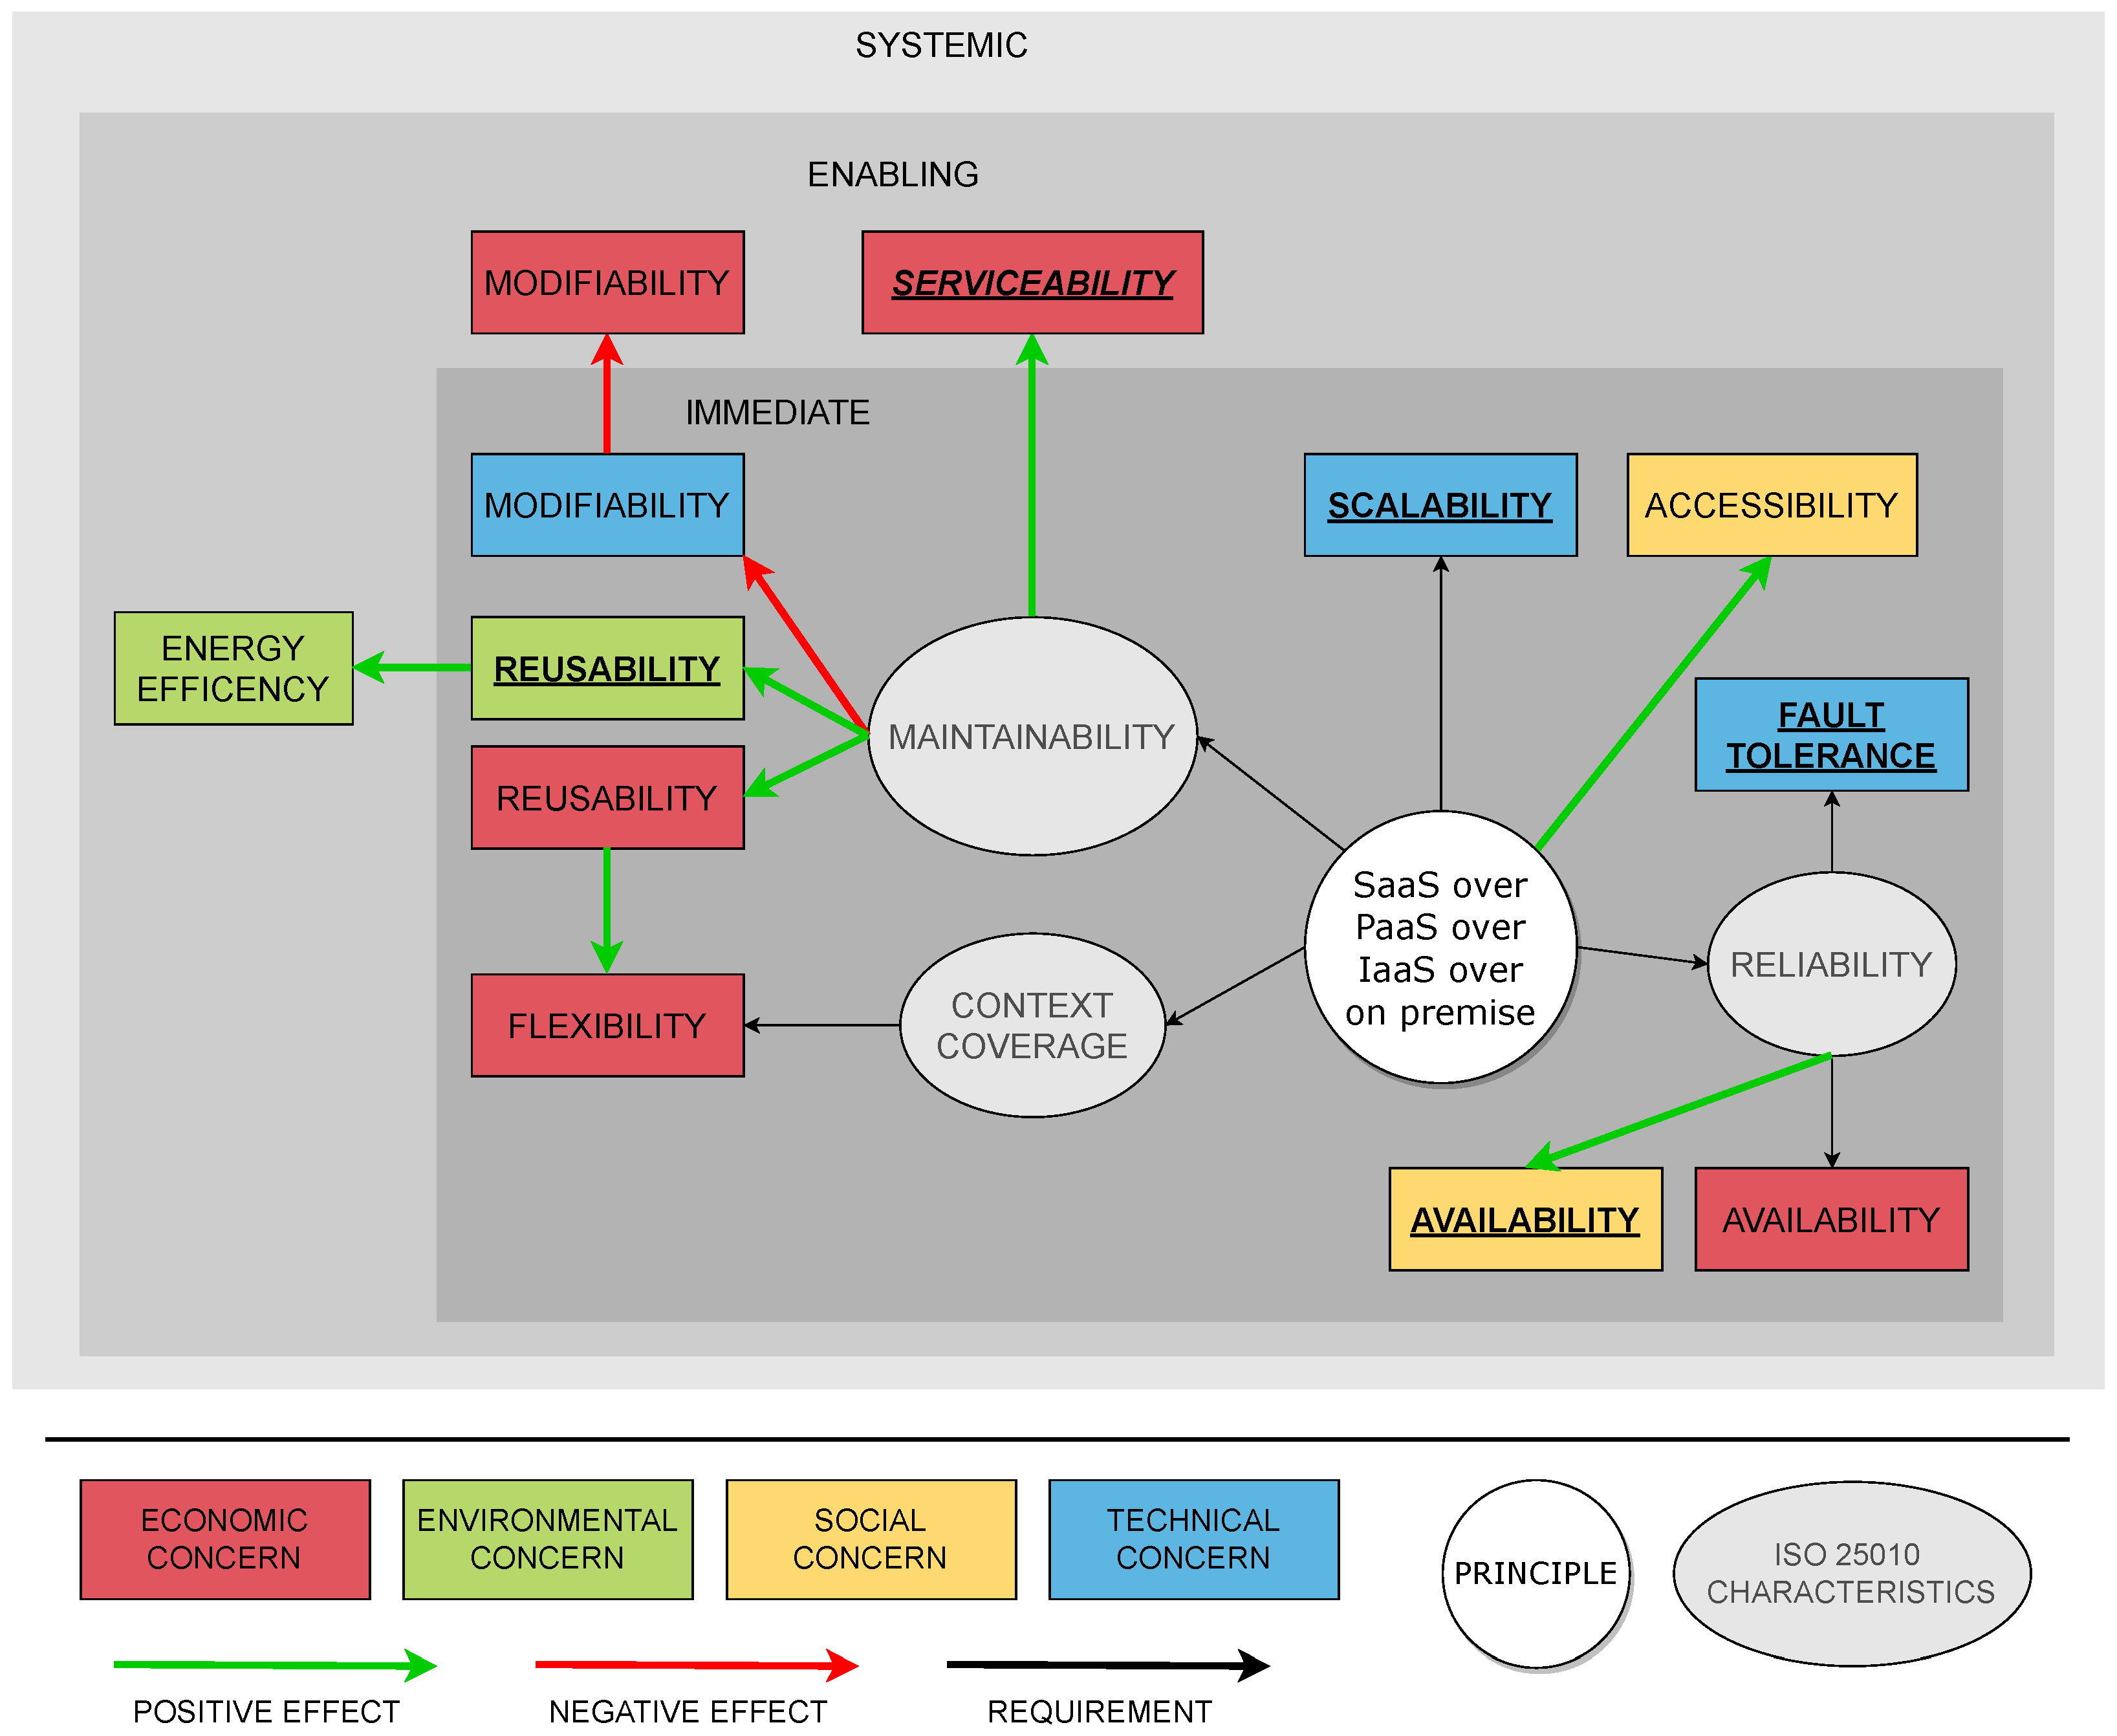
Decision maps were used to model the driving sustainability QAs and uncover related quality concerns. As a software quality model, we consideed the ISO/IEC 25010 SQuaRE [26] standard for defining the QAs and framing the concerns in the decision map. To reveal dependencies between the sustainability QAs and uncover missing sustainability concerns, a dependency matrix was used. As output, we expected a coherent diagram, framing the related sustainability QA and revealing the driving ones.
A 4
The concerns were captured in the SQ model to define their definition related to the case study context, i.e., the PCS Cargonaut solution. As the SQ model is part of the SAF-Toolkit, it offered a central place together with the DM for documenting and preserving the sustainability analysis.
A 5
All previous steps led to a continuous revision of the PRSM model. Since all artifacts are related to a corporate context, we considered the ADD and the Schiphol IT & Data Strategy to derive and map the KPIs. To also capture the metrics and measurement tools necessary for monitoring the KPIs, we used the tool dependent model, i.e., the PRSM+T model to assign and highlight the measurement tools. The KPIs considered were analyzed according to the SMART method and revised to obtain sound KPIs.

5.2.3. Integration

Figure 6 illustrates the concept of incorporating the proposed sustainability analysis into the software architecture process with respect to the overall business strategy. As mentioned earlier, the principles of software architecture were derived from a specific business strategy and used to guide the architecture process at all business levels. Using the proposed process, software architects can obtain guidance for creating PRSM+T models and integrating them into the regular architecture process. Having a PRSM+T model as part of the regular architecture document enables the monitoring of a software system’s impact on all four sustainability dimensions. Derived measurements in the form of visualizations can be fluently included into a regular business review. These reviews provide information on whether the software system implemented is steering in the right direction. If deviations are apparent that are not in line with the business strategy and the identified sustainability goals, actions can be taken to adjust either the software architecture and its implementation (operational level) or even the business strategy (strategic level) if necessary.

5.3. PRSM+T Model

As the aforementioned Table 3 shows, we covered the four main architecture principles related to the PCS solution in our case study. However, results are only shown in detail for the PCS messaging portal and its assigned architecture principle. The PCS messaging portal was selected, as it contains the most relevant results, i.e., interview observations and measurement data regarding the mapped architecture principle, showcasing the entire workflow of the sustainability analysis. Focusing the presentation on a single tier allowed us to provide an in-depth documentation and analysis of the results. Observations of similar nature could also be drawn for the other tiers. All information regarding the omitted tiers, i.e., architecture principles, is provided in our replication package. The PRSM+T model (Figure 7), the DM (Figure 8), and the SQ model (Appendix C Table A5) are the final results of research Phases I and II, including the interview sessions with P#1 and applying the pipeline.
The central part of the PCS messaging portal contains a message broker that is responsible for publishing and subscribing to streams of events. This event streaming platform is implemented by using distributed cloud solutions. Hence, it is not surprising that the cloud distribution principle was considered by interviewee P#1 as the driving one. While asking about the driving QAs for this architecture principle, P#1 explained that the architecture principle is also driven by the AMUSE characteristics:
  • Adaptable: One size does not fit all.
  • Maintained: Build once, run many times.
  • Usable: Self service, fits with needs.
  • Sanctioned: Secured, tested and governed.
  • Easy to start with: Get started in hours, not weeks.
These characteristics were used to further develop the actual QAs related to this architecture principle and software solution (i.e., using the SAF-Toolkit and DMs). As can be observed in the PRSM+T model reported in Figure 7, a total of five QAs were distributed across the four dimensions that are discussed below:
The technical dimension (blue) contains two QAs: fault tolerance and scalability. This is an extension compared to the PRSM model from Gupta et al. [17]. Three out of five interviewees mentioned that sometimes it is not possible to distill the most important QA for a particular dimension. Hence, we allowed multiple QAs for one single dimension ( 1 ). However, to preserve the focus on the driving QAs, we suggest limiting the amount of QAs per dimension to two ( 1 2 ).
Serviceability (also referred to supportability) in the economic dimension (red) is considered as an outlier, since it is not part of the ISO/IEC 25010 standard. Serviceability concerns maintaining the software system: i.e., life cycle management (LCM), like upgrades, updates, and the support beyond the development cycle. Hence, the QA is considered as sub-characteristic of the ISO/IEC 25010 characteristic maintainability. In the context of SaaS solutions, serviceability is especially important for LCM, as it is handled on the provider side. This ensures lower support costs on the company side.
The social dimension (yellow) shows that only when the PCS solution is available will the customers trust the software product and eventually use it. In addition, in the DM in Figure 8, it can be observed that economic revenue can only be increased if the PCS solution is available. Due to this fact, the up-time of the cloud solutions is considered as metric to measure both the fault tolerance in the technical dimension and availability in the social dimension.
Cloud solutions on the provider side can be shared among the customers. Thus, reusability in the environmental dimension (green) enables reusable software solutions for multiple customers and saves resources, but also saves costs immediately when a cloud component can be reused across software solutions.

5.4. Key Performance Indicators

KPIs on their own do not give any information about a certain strategic goal. KPIs are only meaningful in combination with business goals and objectives [23]. Therefore, the KPIs necessary for the PRSM+T model were developed by consulting the Schiphol IT & Data Strategy 2021–2023. These KPIs and goals are depicted in the third column of the PRSM+T model in Figure 7. For example, the KPI up-time contributes to the goal ETO2—reliable delivery, which pursues continuity and an automated process between all involved parties in a reliable manner (a detailed overview of the utilized Schiphol Group goals is given in Appendix B). The SMART evaluation method was used to analyze all considered KPIs.

5.4.1. Final Set of KPIs

In total, 14 KPIs were implemented across the four architecture principles and sustainability dimensions. As can be observed in Table 4, three different kinds of KPIs were available; the KPIs were either (S) extracted from the Schiphol IT & Data Strategy 2021–2023 and ready to use; (S⁎) customized based on an existing Schiphol KPI, because it needed some optimization to fit our purposes; or () if no applicable Schiphol KPI was available, a dedicated KPI for this research purpose and Schiphol was designed.
When conducting the first round of interviews, the preliminary KPIs had already been derived. Interviewee P#4, for instance, stated that the security & governance department performs a survey of users within the organization to measure awareness once a year. This information was taken to determine a correlated strategy goal as well as metrics inside the Schiphol IT & Data Strategy. For this specific KPI, the metric overall customer satisfaction was found. Hence, the KPI was considered extracted unchanged from the strategy to monitor usefulness for the social dimension. The KPI cyber risk score (CRS) illustrates an example where the predefined Schiphol KPI had to be adopted to fulfill the needs of the architecture principle. P#4 mentioned that a business impact analysis (BIA) is an important tool for determining the CRS for a certain software solution. However, this strategy only defines the “cyber maturity based on the ISF Framework”. In the second round of interviews, this conflict was discussed, and it was concluded that the policies of the company were composed based on the ISF framework but the CRS works at a software solution level. As a result, the business goal and metric were taken but customized to measure the CRS. According to this procedure, three KPIs were adopted unaltered, five KPIs were customized, and six KPIs were developed solely for this research.
As can be observed in Table 4, ETO2—reliable delivery was the most frequently mapped goal; in particular, the technical dimension used this goal exclusively. This can be attributed to the main purpose of the PCS solution and the selected architecture principles: as the PCS solution can be categorized as a datahub platform, its major objective is to receive, process, and deliver data. Hence, all related ETO building blocks need to be delivered reliably, such that continuity and an automated process is ensured. This can be achieved by a transition to cloud applications. To monitor such a transition, KPIs are necessary (e.g., UPT—Up-Time; NoOWN—Number of OpenShift Worker Nodes).

5.4.2. SMART Evaluation

To evaluate the KPIs, the SMART assessment method was applied. Table 5 lists all KPIs and their evaluation. Each characteristic could either be (i) completely satisfied, (ii) partly satisfied, or (iii) currently not satisfied. For each SMART characteristic, we summarize our findings and observations below:
  • Specific
To some extent, certain KPIs were not that specific as initially thought or defined. This was most probably attributable to the fact that those KPIs were customized and designed specifically for the Schiphol Group. Hence, they do not currently have experience values from a longer productive operating phase and it could not be concluded whether the KPI will be sufficiently specific. A total of 14 KPIs were defined as fully specific and 3 KPIs only partially.
  • Measurable
As discussed in Section 4, the full feature set of the PCS solution was not available at the time this research was conducted. This also applied to some of the defined monitoring tools. Thus, all KPIs associated with a currently unavailable tool were defined as currently not measurable. Overall, tools were not available for five KPIs, one KPI could only be partially measured, and the remaining eight KPIs supported full measurements.
  • Achievable
KPIs for which it is difficult to achieve the predefined standard were considered to be partly-achievable. This means that, for security-related KPIs, for example, considerable effort was required to achieve the norm. For the CRS, a norm of 0 was derived from the interview with P#4. However, a score of 0 was almost impossible to achieve, as every software solution involved some cyber risks and trade-offs. This is supported by the work of McKinsey [36], who stated “In most cases, it is impossible to stop all cyber attacks, so sometimes controls can be developed that tolerate some incidents”. McKinsey recommended that business risks should be captured by defining dedicated key risk indicators (KRIs) and linking them on KPIs, which can lead to a “complete risk-based measurement”. Due to this fact, eight KPIs could only be partially achieved and six KPIs could be fully achieved.
  • Relevant
Only the KPI NoOWN—Number of OpenShift Worker Nodes was declared as partly relevant for providing more insight into the performance of the organization in obtaining its strategy. Due to the high degree of specialization and technological dependence (i.e., OpenShift), this KPI addressed only a fraction of the entire IT landscape. The remaining 13 KPIs were considered fully relevant.
  • Time phased
All KPIs are completely time-phased. This was substantiated by the fact that the Schiphol IT & Data Strategy is time-phased in itself. For each year, quarter, and month, the company specifies and monitors the goals for every pillar by conducting reviews.
As explained in Section 2 and mentioned by Ishak et al. [22], certain KPIs do not necessarily satisfy all SMART conditions. This behavior was especially observed for the measurable condition, as not all KPIs were measurable at the point of this research. Only by having experience values from a longer productive operating phase, could final conclusions be derived.
If the characteristics from Parmenter [8] are considered, it can be concluded that the KPIs indeed violated some of these characteristics, because in detail, not all KPIs can be measured on a 24/7 basis. For instance, the OCS—overall customer satisfaction cannot be monitored in such a way. Even if an automatic survey approach were found, it is most likely that the satisfaction of customers does not change that frequently. While this study mainly considered non-financial KPIs, it also included some financial KPIs (cf. CpC—costs per change), which violated the characteristic from Parmenter [8]. This can be explained by the fact that we aimed to use balanced KPIs that ccould be used to monitor performance at all business levels and across all sustainability dimensions.
We can conclude that the characteristics from Parmenter do indeed help to revise and rethink sustainability KPIs in a software context. Using the example of the KPI UPT—up-time, the following revision was made: In the IT & Data strategy, the KPI up-time is defined as “Up-time for key platforms”. However, by validating this KPI against the characteristic proposed by Parmenter, “the responsibility can be tied down to the individual or team”, we can clearly deduce that “key platforms” constitutes an ambiguous definition and involves, at least, more than one individual or team. Thus, to be more concrete and tie the KPI to a specific team, we revised the KPI as “Ratio (%) of total run-time and the total available time of the SaaS solutions”. However, inevitable violations of certain characteristics led us to conclude that the same observation from Ishak et al. [22] about the SMART method also applies to the attributes from Parmenter [8]: the criteria should be considered as a guideline but do not necessarily satisfy all conditions; in particular, in the context of software and sustainability, violations cannot be excluded.

5.5. Measurement Tools

In this section, the tools used to monitor the KPIs across all four sustainability dimensions are presented. The capabilities of each tool, as shown in Table 6, were derived either during the weekly tutorial sessions with the PCS software architect or during the interviews. As defined in R Q 2 , particular attention was paid to potential automation of the monitoring process. Hence, Table 6 also outlines the ability for automation. It can be seen that five out of seven tools completely support automation, one tool provides only partial automation, and one tool does not support automation at all. In addition, the considered ISO/IEC 25010 quality characteristics were mapped to provide an overview of which tool can be used to measure which QA.
Table 6 depicts the instruments’ ability to measure within the different sustainability dimensions. As shown, four tools support inter-dimensional measurements, while three tools are designated for one dimension only. The assignment to a sustainability dimension depends on the QA measured. It should be noted that all tools were already present in the portfolio of our selected organization and were used to measure the KPIs for the software system under study. It is certainly possible that a tool can also be used (i) in other dimensions, (ii) for other KPIs, or (iii) for other software systems. Moreover, all tools used in the Schiphol Group may also have a suitable equivalent in other organizations. Thus, we did not limit the set of potential measurement tools to the subset available at the Schiphol Group or to the chosen software solution. We instead provide our selection as a starting point for practitioners inside the aviation sector and beyond.
The large variety of tools could lead to increased complexity. This was also stated by interviewee P#4:
“It is really hard for us to have the right data at the moment when we need them. Therefore, we are looking for one dedicated tool to have all the data at one central point.”
P#4, Cyber Security Officer
This issue was also identified during our research. Monitoring the KPIs through all seven tools led to considerable maintenance and development overheads. As each tool is related to its own administrative unit, the data necessary for this study needed to be retrieved from seven different sources.

6. Evaluation

By using the selected tools, concrete measurements were obtained to monitor the selected KPIs. The measurements were visualized in the form of spider charts and were presented to the final focus group, aiming to evaluate the results based on expert knowledge. This section first examines the measurements. Then, the conclusions drawn by the focus group are presented.

6.1. Case Study Measurements

Spider charts have proven useful for data analysis in business processes and for benchmarking business performance [42]. Therefore, for each architecture principle, one spider chart was created (a detailed description of how the spider charts were generated (i.e., programming language and code), including the final raw values, can be found in the replication package online) following the recommendations by Andersen [42]. Figure 9 visualizes all obtained measurements. Each axis represents one of the defined KPIs. The mapping between the architecture principle, the related sustainability QAs, the KPIs, and the tools can be seen in the final PRSM+T model in Figure 7. Despite other suggestions (e.g., [43]), the spider charts created for this research (i) did not consider a unified point scale on each axis (e.g., five-point scale) but followed the suggestion by Andersen [42] to have a separate unit of measurement for each variable; (ii) the axis scales do not share a common minimum, because the center cannot be defined as a common zero point, since each axis has a different scale.
As mentioned, not all KPIs could be measured due to the development status of the PCS solution. Hence, the affected KPIs (7 out of 14) were marked as n/a and the value was set to 0. For all other KPIs, the value was obtained by using the corresponding tool and represents the factual value at the moment the data were extracted. As can be seen, for two charts (Figure 9a,b) it was possible to obtain real data for three out of five KPIs, one chart (Figure 9c) shows data for one out of five KPIs, and one chart (Figure 9d) does not contain any actual data. However, even with the missing values, it can be clearly observed that the graphical presentation offers the possibility to keep track of the KPI metrics (a further discussion follows in Section 7). Future data sets in the form of new data points would lead to a new polygon and, therefore, performance could be effortlessly monitored and benchmarked against previous data sets (blue polygon).

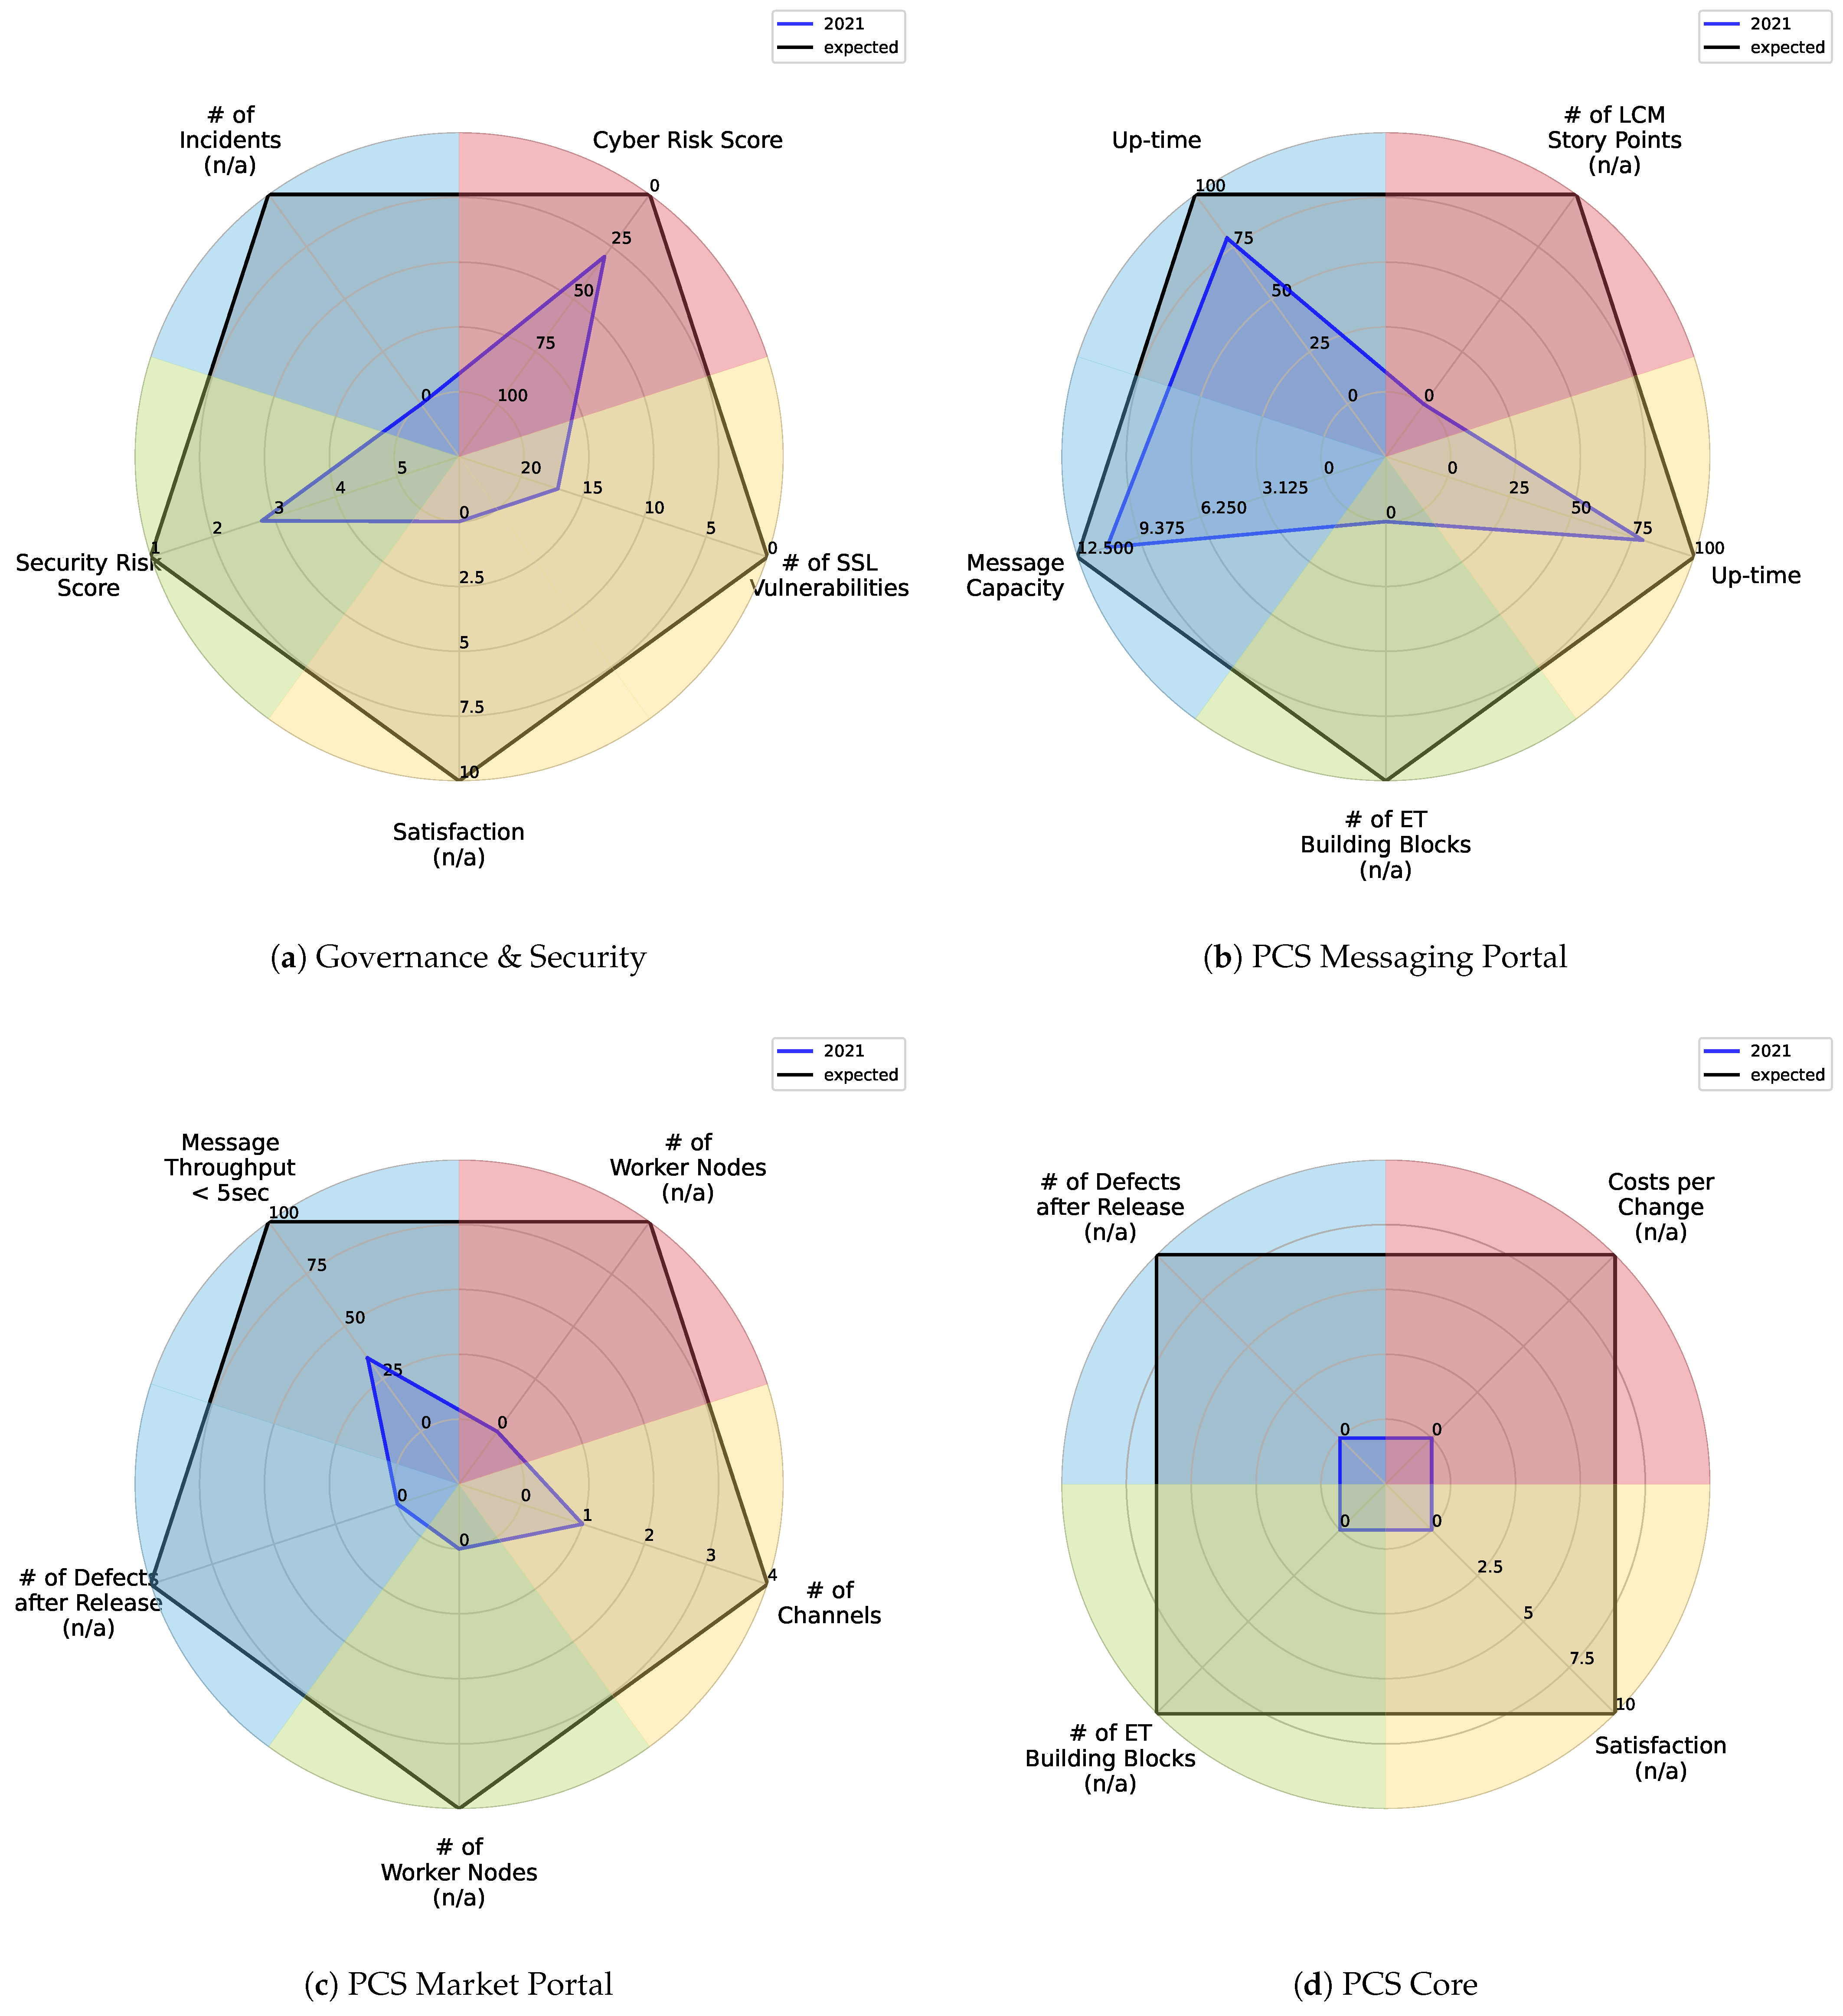
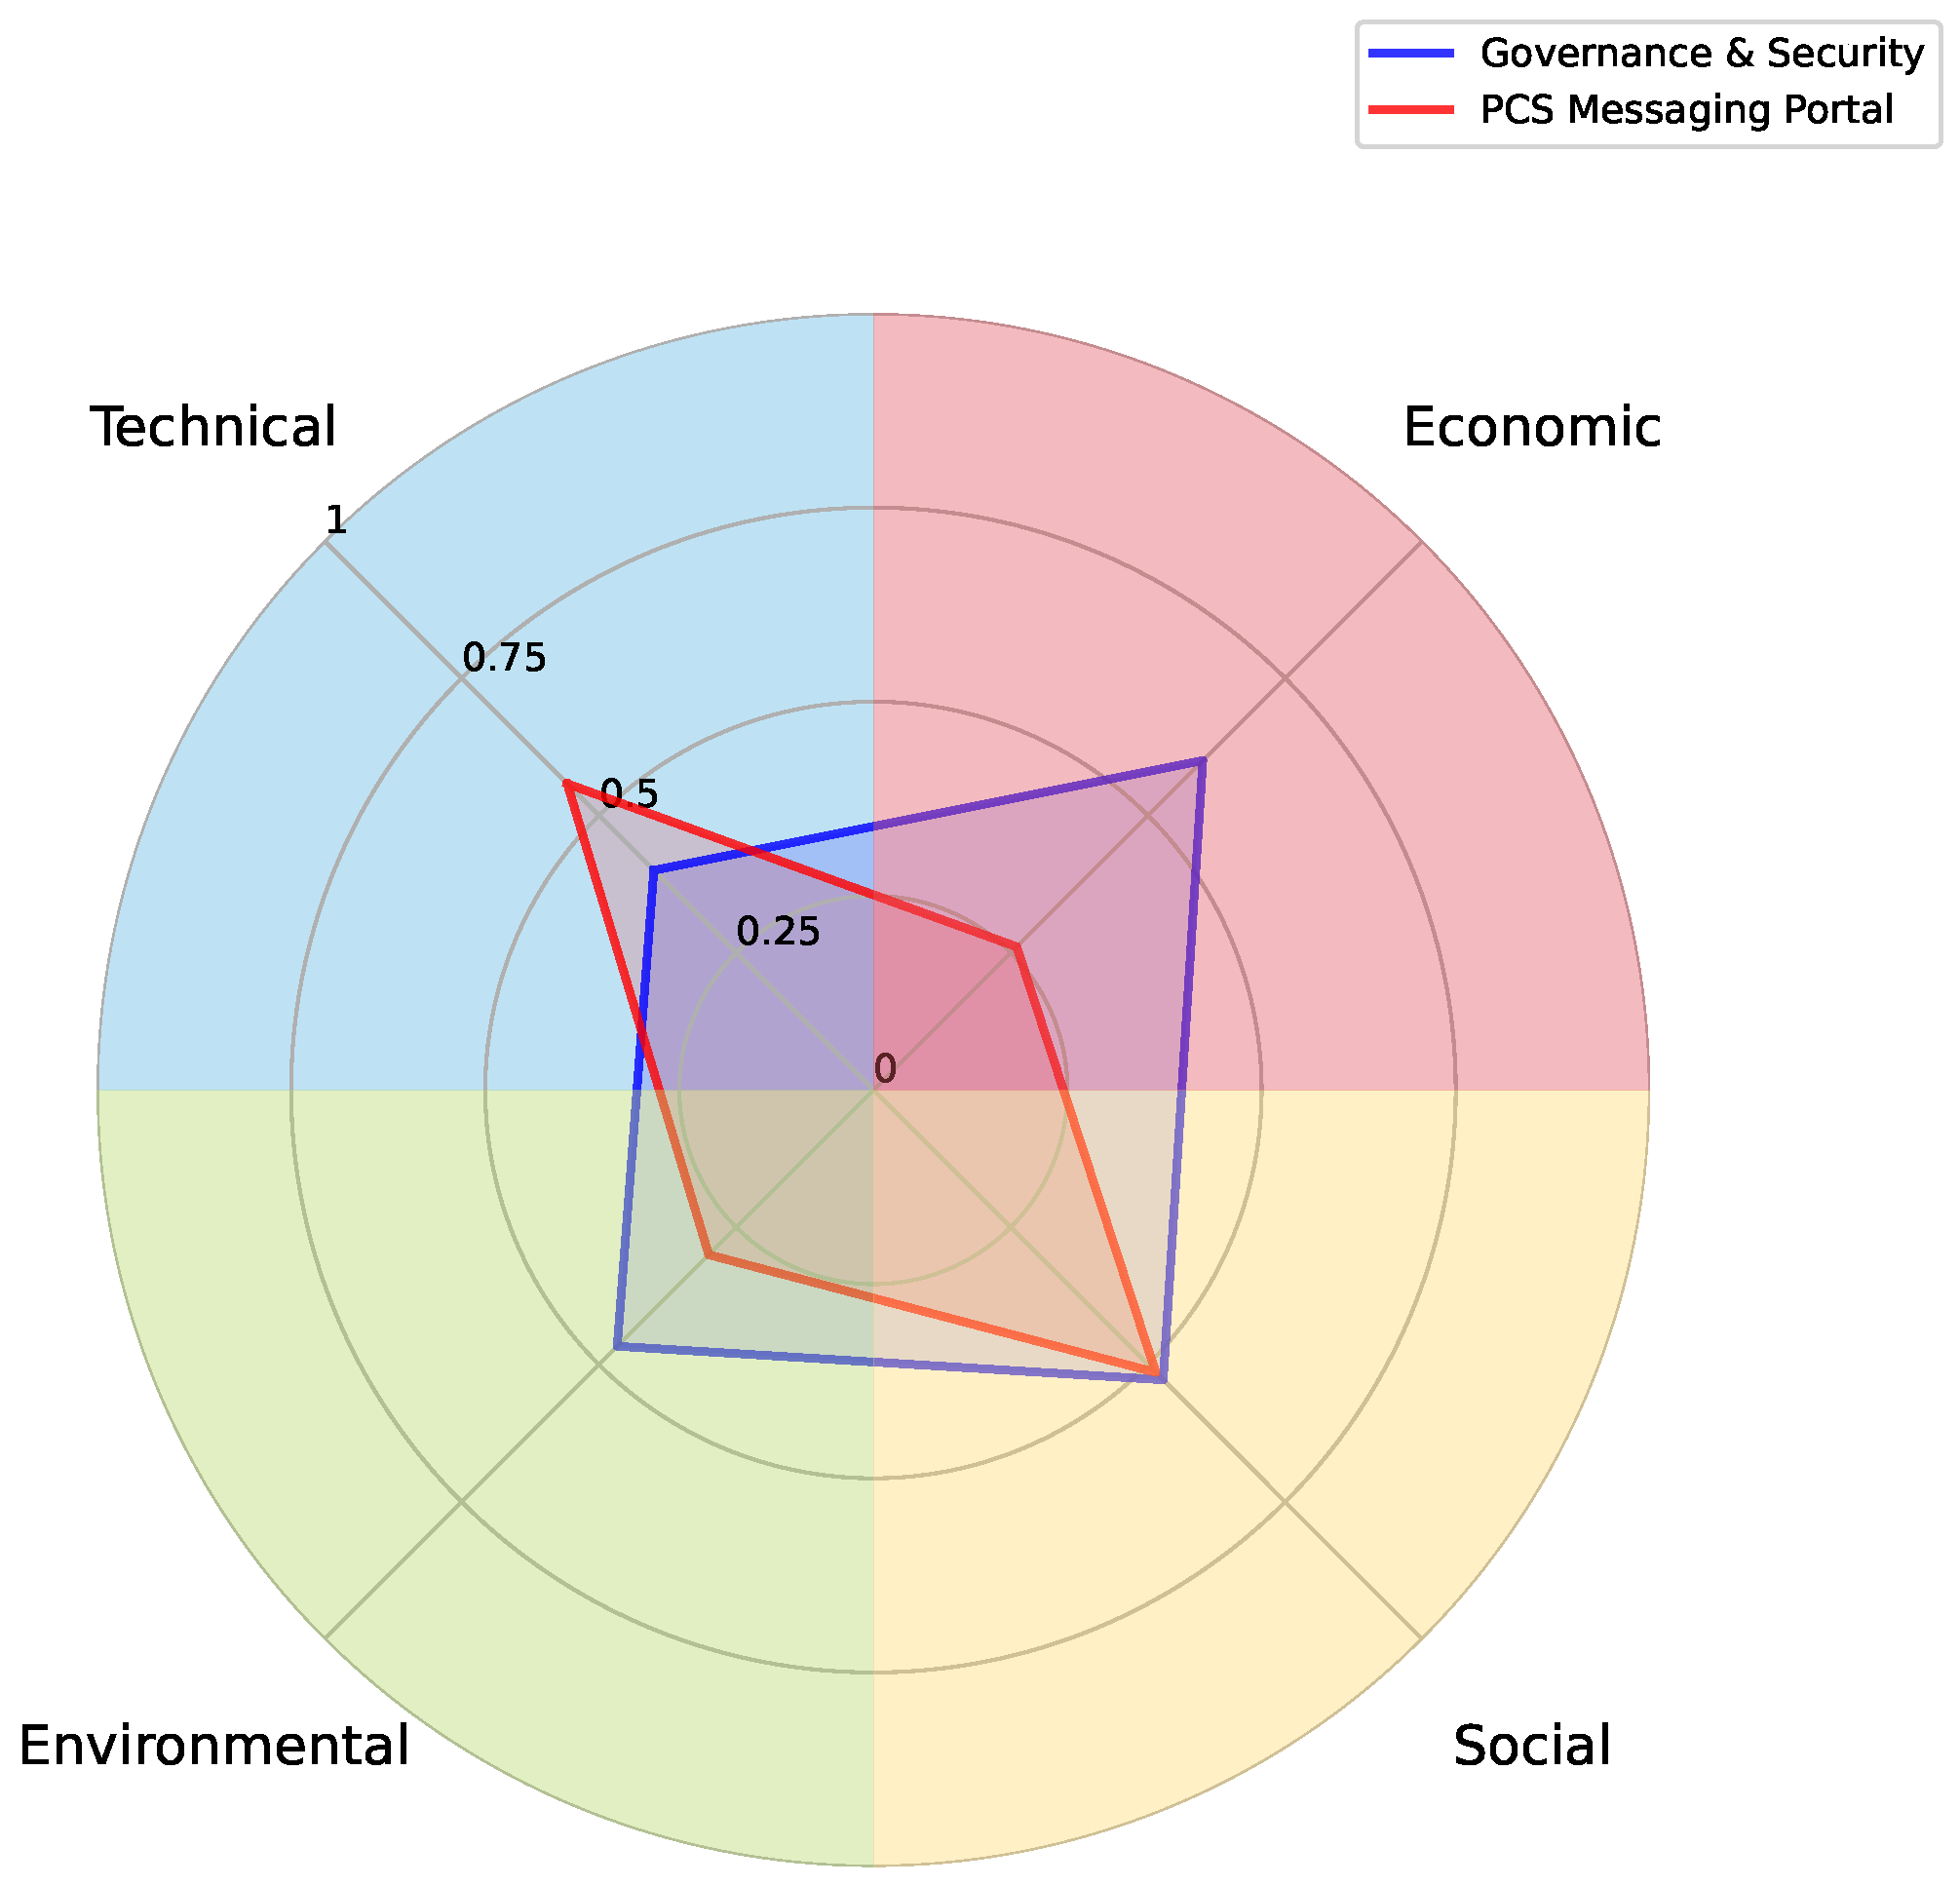
6.2. Normalized Spider Charts

Since architecture principles are subject to an iterative development process and as a change in business strategy can require the replacement of certain architecture principles [12], it is beneficial to create a benchmark. A comparison of architecture principles allows (i) keeping track of the sustainability impact before and after a change or replacement and (ii) uncovering potential weaknesses in certain sustainability dimensions of the new or old architecture principle. Nevertheless, a comparison using the spider charts proposed before is not possible. Due to the different KPIs on each axis and the different number of KPIs in the different dimensions, it is impossible to include the data set of one spider chart in another or to benchmark architecture principles against each other. To address such issue, Min-Max normalization [44] can be used to bring all variables to the same standing, i.e., a scale of [ 0 1 ] . Min–Max normalization uses linear transformation to fit data into a predefined frame, while preserving the relationship with the original data [44]. First, the m i n and m a x values are empirically derived to set the boundary; then, normalization on an arbitrary data set within this boundary is applied to re-scale the entire range. This data set can then be used to visualize multiple architecture principles as combined in one spider chart.
Throughout our case study, we were able to determine a snapshot of measurement data that represented the current state of the PCS solution. However, it was not possible to apply Min-Max normalization to a singular data snapshot (i.e., one single data row), due to missing m i n and m a x values. Thus, randomized test data were used. To simulate a realistic data set, we generated 50 randomized data rows for each variable. After applying Min-Max normalization to the data set, we used the same spider chart visualization method to plot the data.
Figure 10 illustrates an example outcome of the previously described process, based on randomized data for the variables in Governance & Security and PCS Messaging Portal. We call this the normalized spider chart. Compared to the spider plots in Figure 9 (non-normalized spider charts), the normalized plot is now based on (i) a unified scale in the interval [ 0 , 1 ] , (ii) a common minimum “0” in the center of the plot, and (iii) only one value per sustainability dimension.
It can be concluded that normalization is necessary to visualize multiple architecture principles in one chart and to compare their impact in each dimension. However, if a detailed look at an architecture principle is necessary, the zoomed-in version (non-normalized spider chart) with all KPIs and their raw data would be necessary. As the normalization procedure also comes with disadvantages (e.g., information loss), this kind of graphical representation was part of the focus group and will be discussed in the next section.

6.3. Focus Group Evaluation

Only four of the five focus group participants were able to attend the session—P#3 was unavailable. For each architecture tier, the same group of questions were asked, together with the derived case study results. For example, the PCS messaging portal was discussed, together with its final PRSM+T model (Figure 7) and the resulting spider chart (Figure 9b). In the following, the main observations are outlined and discussed. We grouped the observations according to the uncovered coding categories.
  • Familiarization Time
Three out of four participants needed some time to reacquaint themselves with the presented PRSM+T models and spider charts, e.g.,
P#4 stated: “I’m trying to understand the model. […] You would need to explain it a little bit more to make it more understandable. So providing only the terms are a bit meaningless or hard to understand.”
P#4, Cyber Security Officer
In contrast, P#1 did not need such familiarization. This could be because P#1 used such models frequently and was also involved in the development process of the PRSM model from Gupta et al. [17]. The latter can be considered a potential threat to validity and is therefore discussed in more detail in Section 7.2
  • Model Utility
All four experts considered the PRSM+T model in combination with a graphical representation as useful and beneficial for their daily business:
P#4 stated “I do think that having such a model is quite helpful. […] It will help us to understand what kind of things we are doing right or wrong.”
P#4, Cyber Security Officer
P#5 confirmed “I do also think that the analysis could help my department to keep track of their goals. Even if the model might need some learning.”
P#5, Developer
  • Axis Description
Three out of four participants needed assistance regarding the terms used to describe the spider chart axis (e.g., message capacity).
P#5 stated “It is not totally clear what you mean with Message Capacity in this context.”
P#5, Developer
We observed that such naming might be difficult for non-experts to understand, since the terms are strictly related to the particular software solution; without a proper description, the meaning of certain axes and their values might be misleading.
  • Benchmarking
Intuitively, two experts compared the spider charts against each other regarding the performance of their KPIs (e.g., by comparing the PCS Messaging Portal chart to the Governance & Security chart).
P#5 described “this chart [the PCS Messaging Portal] performs better than the first one [Governance & Security].”
P#5, Developer
This statement shows that the graphical representations were used by the expert to compare two different models related to their sustainability impact. However, from a formal perspective, this intuitive behavior was not correct, as the different axis show different values and different value ranges (cf. previous discussion about normalization).
  • Repetitive KPIs
Using the same KPI in two different dimensions, e.g., up-time in Figure 9b, (i) led to confusion among two respondents and (ii) could lead to a biased impact calculation, as they show the same value but in different dimensions. From the focus group, it hence emerged that it might be necessary to avoid using two identical KPIs in the same model. This is contrary to what is suggested in the literature, namely that KPIs should be reused as often as possible and as few KPIs as possible should be defined [23].
  • Missing Values
Missing values, i.e., n/a values, caused by the absence of data led to misleading interpretations, so that the performance of the overall architecture principle was interpreted as “poor” instead of “missing”.
P#2 stated “If we look at the throughput, it could give the impression that we still have much work to do.”
P#2, Enterprise Architect
Nevertheless, this remark emphasizes how the spider charts were used by the experts: the current condition of a certain KPI (blue polygon) was compared to the desired value (black polygon).
  • Normalized Spider Chart
The focus group was also used to evaluate the additional normalized version of the spider plot (cf. Figure 10). This version of the spider chart was considered useful by all four attendees. Comparing architecture principles to one another could be a useful tool.
In this regard, P#2 concluded “The normalized version could be the management summary, and the other ones are the detailed version to have a better and detailed look at it […]. I think we could use both […]. It shows you at which dimension we need to spend the money.”
P#2, Enterprise Architect
P#1 added “The management level would be also interested in the details, and would therefore need both versions of the charts because they want to know where exactly they need to put their money in.”
P#1, Software Architect
  • Summary
From the focus group, we can conclude that all experts found the graphical representation in the form of spider charts helpful. The experts intuitively used the charts to benchmark the architecture principles. Moreover, the intuition of the experts led to the right conclusions, e.g., that an architecture principle performs best when all KPIs match the outer polygon. These observations are consistent with the desired and also the expected output of this research.
Improvements, however, could be made by (i) changing the metric descriptions (i.e., the KPI names) to a more common terminology; (ii) common upper and lower bounds for each metric would lead to a better understanding; (iii) KPIs that are used in two different dimensions in the same model could lead to confusions and should be reconsidered.
Applying normalization to the entire data set results in a graphical representation that could be used to compare the impact of all architecture principles across all four sustainability dimensions simultaneously. The detailed, non-normalized version performed better at the operational level, revealing raw data and detailed information about which KPIs were falling behind; the normalized version had its strength at the strategic level, as it provided a birds-eye view on multiple architecture principles and their impact on sustainability, to find the right balance, even if some information was lost during the transformation.

7. Discussion

We present our main research contributions and the accompanying observations we made throughout this study by (i) interpreting the obtained results, (ii) comparing the results with the literature, and (iii) discussing the potential implications for researchers and practitioners. Possible threats to validity are outlined in the final section.

7.1. Contributions and Observations

The extension of the PRSM model [17] to the PRSM+T model helped in measuring the impact of architecture principles on sustainability over the long term. The model also served as groundwork to develop a process pipeline, as outlined in Section 5.2. This pipeline defines the steps necessary to work with PRSM models practically and in a structured way. Thus, both researchers and practitioners are able to create replicable and, especially, traceable PRSM(+T) models.
Condori-Fernandez et al. [19] suggested using the SQ model by defining plain definitions of the sustainability QAs under consideration. Despite this suggestion, the SQ models developed throughout this research (cf. Table A5) provided actual concerns over definitions. This can be explained by the execution of this research as a case study and the close relation to the industrial purpose. Throughout the weekly tutorial sessions, it was found that the defined sustainability QAs were always related to current business concerns. Therefore, the SQ models developed in this study can be successfully applied in practice, as they reflect daily operations.
The PRSM model, its extension, and the process pipeline were applied and evaluated in a real-world scenario for the first time. Gupta et al. [17] evaluated the PRSM model based on five different architecture principles, without relation to a specific software solution; in contrast, our research used and analyzed four concrete architecture principles related to the PCS solution. By conducting interviews and a focus group involving experts across different business units, the research results were evaluated. It became evident that the consideration of a software quality model (e.g., ISO/IEC 25010 [26]) is of great importance to ensure compliance in industrial practice. Without following a standard, the comparison and re-use of the PRSM+T models is questilknable.
PRSM+T Model & Process Pipeline
  • We extended the static tool-agnostic model (PRSM) to a measurable tool-dependent model (PRSM+T).
  • A process pipeline was implemented to systematically develop PRSM+T models.
  • We applied the PRSM(+T) model and the process pipeline in a real-world context.
As the usage of KPIs without considering a business strategy does not constitute meaningful information [23], the KPIs designed and used by this research were mapped on the IT & Data Strategy, towards contributing to the overarching business goals. This mapping was also embedded into the PRSM+T model. The SMART analysis revealed that some KPIs (6 out of 14) were not yet measurable in our chosen case. This conclusion supports the assertion by Ishak et al. [22] that not all KPIs necessarily satisfy all SMART conditions. For example, in an early KPI development process, the KPI might not be fully time-phased and the value might not be expressed in time until later. In addition, it may not be possible that one positive effect with a technology-related target also ensures a positive effect in other measures, as unknown technologies always harbor risks. To the best of our knowledge, SMART analysis was used for the first time in the context of software-related KPIs to monitor software sustainability.
The KPIs used in this research offer the capability for inter-dimensional support. This means that the same KPI can be used to measure the same (or even a different) QA in a different sustainability dimension. For example, in the context of this study, this conclusion underlines the suggestion from Parmenter [23] to define as few KPIs as possible. However, the usage of the same KPI in the same PRSM+T should be re-evaluated. As mentioned by the focus group, using the same KPI twice in the same spider chart, but for different dimensions, can lead to misunderstandings and biases in benchmark calculations.
Overall, the SMART method and the characteristics by Parmenter [23] can be used as guidance to develop sound KPIs. The more precise the defined KPIs or targets are, the more focused the efforts can be and the greater the chances of achieving the goal [22]. We can conclude that KPIs are useful and necessary to monitor the impact of architecture principles on sustainability. Our proposed method of defining and assessing KPIs can be used in the future. In particular, practitioners can apply the process to develop their own KPIs or even reuse some of our KPIs to keep track of their own architecture principles.
Key Performance Indicators
  • We provided a set of 14 KPIs, including their contributions to Schiphol’s IT & Data Strategy.
  • Mapping of all KPIs onto their related sustainability dimensions and QAs was applied.
  • We observed that KPIs can monitor inter-dimensional performance (for different PRSM+T models).
We explored seven tools to monitor the KPIs in the real-world context of the PCS solution. All tools were already available at the Schiphol Group and could be reused. The KPIs and their measurement tools are suitable for use by the Schiphol Group as a method for measuring further architecture principles. The adoption of available tools and their support for automation implies that the sustainability analysis (i) can be easily applied and integrated into everyday operations, and (ii) is lightweight, as it leverages existing capabilities within an organization.
Many different tools, however, can lead to problems with consistency, as mentioned by the interviewees. To overcome the inconsistencies caused by different tools and the reliability, availability, and separation issues caused by centralizing data, as many KPIs as possible should be measured using the available tools before introducing new ones.
Measurement Tools
  • We provided a selection and analysis of seven measurement tools together with a mapping of their inter-dimensional support.
  • We propose reusing as many centralized measurement tools as possible to enable a lightweight sustainability analysis and prevent potential inconsistencies.
Spider charts were used for visualization as they provided an overview of performance levels for various indicators, while revealing lagging variables [42]. In this study, color-coding was used to embed sustainability dimensions in the spider charts. All plots were created manually based on the data sets exported from the measurement tools. To support full automation, other tools are feasible (e.g., Grafana (Grafana Labs—https://grafana.com. accessed: 15 November 2023)). Both the experts from the focus group and the those in the literature consider spider charts as a valuable tool for monitoring business processes.
By applying Min-Max-normalization, we created one common spider chart to compare multiple architecture principles simultaneously. As software solutions are implemented with consideration of all architecture principles involved, performance aggregation of the principles would allow for comparisons among the various software solutions. In view of the mentioned issue of non-normalized spider charts, one could argue that a trend analysis [42] might also be a suitable visualization for depicting the performance of one architecture principle over time.
During the focus group session, we derived the conclusion that spider charts are a useful graphical representation for keeping track of sustainability impact. Nevertheless, the charts also have downsides, as the interviewees revealed: (i) continuous values without a maximum are difficult to interpret, and (ii) the mixed scales (i.e., [ 0 10 ] and [ 5 1 ] ) may confuse non-experts. These two drawbacks support the use of normalized visualization. However, spider charts only depict the impact’s general trend; the real business impact and risks remain hidden. One would need context-specific knowledge (i.e., insights into the business in question) to translate the data into meaningful risks and their impacts.
Graphical Representation
  • We used spider charts to monitor the impact of an architecture principle on sustainability and implemented the visualization of the corresponding sustainability dimension.
  • A proposal was given for a normalized spider chart, to compare the impact on sustainability of architecture principles against each other.
  • We suggest using the normalized spider charts on a strategic level as a holistic overview, and to use non-normalized spider charts on an operational level to zoom in and spot lagging KPIs.
  • We observed that the actual impact and risks for the business were not apparent.
In this section, we have presented and discussed the results grouped by our main contributions. The results presented in this research were based on an industrial case study and are therefore characterized by the attributes typical of such a research method [30]. Therefore, our findings are positioned within a middle-ranged substantive theory [45], i.e., the results gathered within the context considered in the study can be transferred to other contexts with similar characteristics. Throughout the design and execution of the research, the fit within a middle-ranged theory of both the presented process and the gathered results was purposely accounted for. First, we presented the PRSM+T model and process pipeline in their basic conceptions, so that practitioners and researchers can apply the model and pipeline to their own context by substituting elements as needed (e.g., using a different software quality model). Second, the set of KPIs can be used by our case provider or by practitioners in other sectors as a starting point to integrate sustainability KPIs into their business strategy. Third, the measurement tools provided are generally accessible and thus context-independent, allowing them to be implemented by other software systems beyond company boundaries. Finally, the graphical representations in the form of spider charts can be used by practitioners and researchers in all domains. The visualizations are a generic mechanism for monitoring and comparing the sustainability impacts of principles. For the interested reader, further considerations regarding the generazability of the study are discussed in the following section.

7.2. Threats to Validity

This section analyses possible threats according to Wohlin et al. [46] (i.e., threats to external validity, internal validity, construct validity, and conclusion validity). As this research was conducted as a case study, an additional threat to validity was considered as described by Runeson and Höst [30], i.e., reliability.
  • External Validity
External validity reflects the validity of the results beyond our research and the relevance of the collected results to practice [46]. As hinted at in Section 7.1, given that the research we conducted was based on an industrial case study, it inherited the characteristics typical of such types of studies. Therefore, our results may have been affected by the generalizability threats discussed at large in the work of Runeson and Höst [30], e.g., the population may not be representative due to the lack of statistics. For this reason, the results reported in this study have to be interpreted within middle-range substantive theory [45], i.e., the collected results can only be transferred to other contexts with similar characteristics. For this reason, we do not claim absolute generalizability of our results. In contrast, we consider the results collected in this study as a starting point, which further studies considering similar or even different contexts can build upon to assess and strengthen the generalizability of the method. In other words, this work presents research-oriented results that further studies can build upon, by carefully considering and discussing related threats to external validity. To further mitigate potential threats and to ensure that the research results are relevant to practice, the state-of-the-art Schiphol Group software-intensive system was selected. A systematic evaluation was conducted to support the determination of the subject. This subject offered different architecture principles and a wide variety of available measurement tools; both helped to mitigate bias, as we were not limited in our selection and analysis.
The maturation effect [46] of research subjects, i.e., the experts, can lead to bias if the interviewees are already familiar with the models or results being presented to them. To ensure that our research results were balanced on two levels of knowledge, two out of the five experts were already familiar with the PRSM model and the topic of software sustainability; the remaining three experts were not familiar with either.
  • Conclusion Validity
Conclusion validity concerns the question of whether the conclusions derived were misinterpreted [46]. In our qualitative study, there could have been a risk that we, or the respondents themselves, could have drawn the wrong conclusions during the interviews. Potential issues can arise in the interview implementation as well as in their execution. To mitigate the reliability of treatment delivery [46] our interview sessions followed a predefined interview design that was cross-validated by the authors of this study. This ensured an identical interview process for all experts. However, since all experts belonged to the same organization, we cannot rule out that respondents drew their conclusions in the best interest of the company and with less generalizable intent.
  • Internal Validity
Internal validity refers to the implicit assumption an independent variable is generally applicable and not driven by its context [46]. In our study, the process pipeline could be considered the independent variable. Therefore, it should be emphasized that the process obtained was the result of conducting a single-case study and therefore cannot be declared universally valid. The results were solely determined using the selected case, the corresponding principles, and the associated experts. However, this single-case study was necessary to derive and propose this novel process pipeline in the first place. To mitigate risks related to this threat, we relied on data triangulation and multiple data collection methods: we used evidence from (i) real-world documents like the ADD and the Schiphol IT & Data Strategy, (ii) related academic literature, (iii) quantitative data in form of real-world measurements, and (iv) qualitative data from multiple expert interviews. The results were validated by conducting a focus group of experts with diverse professional backgrounds and an average of 22.4 years of industry experience. Nevertheless, to fully mitigate risks, the developed process should be applied in field studies.
  • Construct Validity
Construct validity concerns the extent to which the measures taken actually correspond to the intended concept [30]. Such concerns can arise during interviews and are classified as social threats [46]. To mitigate these threats, first, the intermediate results were always presented to the experts and were part of the interviews, to provide an additional validation of the obtained data; second, the final results were evaluated together by all interviewees during the focus group. The focus group ensured that the results obtained by one interviewee were also cross-validated.
  • Reliability
We ensured reliability by designing a study geared towards providing replicable results [30]. Since our case study was conducted in the context of the aviation sector, not all raw data can be disclosed. In particular, safety and security-relevant data had to be omitted. Nevertheless, we provide an online replication package including all the necessary resources to make our study transparent (e.g., case study protocol, interview structures, intermediate results, and source code utilized).

8. Related Work

As Section 2.3 described, our research builds on the work provided by Gupta et al. [17]. The main focus of Gupta et al. [17] was a sustainability analysis to map architecture principles on all four dimensions of sustainability using the PRSM model. We extended the PRSM model to the PRSM+T model with related measurement tools. Additionally, we analyzed a real-world software solution based on the PRSM(+T) model for the first time. To complete such PRSM(+T) models in a common structure, we (i) first developed a process pipeline, (ii) then applied the pipeline in practice, and (iii) finally evaluated it with practitioners. Next to this fundamental groundwork from Gupta et al. [17], other research can be identified as related work and is discussed below.
Considering the evaluation of sustainability aspects in industry, a number of scholars have studied the role of sustainability in industry and attempted to integrate sustainability into a business strategy [47,48,49,50]. Chai [50] introduced the sustainability balanced scorecard (SBSC) by extending the balanced scorecard (BSC) [48] through three sustainability pillars, i.e., (i) economic, (ii) social, and (iii) environmental. Similar to the PRSM model [17] and our proposed PRMS+T model, the SBSC framework offers a multidimensional view of business performance by linking performance measures to goals. Hristov and Chirico [47] reused the SBSC model and proposed KPIs as suitable and quantifiable measures, to address and keep track of aspects of sustainability. The authors also considered the selection process of appropriate sustainability metrics as one of the key problems in realizing sustainable systems. In contrast to the work of Chai [50] and Hristov and Chirico [47], in our research, we also included the fourth dimension of technical sustainability and thus a relation to software concerns. Moreover, we overcame the problem of selecting appropriate sustainability metrics by providing a process to map sustainability KPIs to a real-world software solution using the PRSM+T model.
As IT and software are becoming ubiquitous in modern enterprises [12], the consideration of sustainability in software is gaining traction. Substantial research attention has been devoted to seeking a definition of the term sustainable software itself and its meaning [24,51,52,53,54]. Early studies defined sustainability either as the longevity of the software [15,55,56,57] or focused on environmental sustainability in terms of energy consumption [16,58,59,60,61]. A recent line of research has established that sustainable software can only be achieved holistically by addressing multiple dimensions of sustainability [13,20,25,62,63]. Venters et al. [25] emphasized the existence of dependencies and relationships between the different sustainability dimensions, where potential trade-offs must be considered while developing the system. In our research, we were aware of such dependencies and considered these relationships in our proposed process pipeline, using the SAF-Toolkit and its dependency matrix [21]. Saputri and Lee [63] provided a comprehensive overview of the emerging definitions of software sustainability and complemented the definitions with their limitations in terms of dimensions and potential metrics. The authors argued that most research only provides a “high-level abstraction”, without concrete metrics and measurements. In contrast, our research provided metrics and measurements in the form of KPIs derived from a real-world software system and a process to systematically quantify sustainability. Moreover, we followed the holistic concept of sustainability by considering the four sustainability dimensions according to Lago et al. [13] and explicitly addressing possible interdependencies of these dimensions.
To incorporate sustainability into software, several studies have been conducted on QAs and non-functional requirements [13,16,52,60,64]. Two different viewpoints can be derived from the recent body of research. While one view defines environmental sustainability as an additional non-functional requirement such as safety or security [64], the other identifies traditional quality requirements that contribute to sustainability and assigns these requirements to the sustainability dimensions [13,20]. To support wide industrial adoption, our research followed the approach from Condori-Fernandez and Lago [20] by relying on existing software quality models. Even though there has been much work on addressing sustainability with software, there has been limited research investigating actual measurement methodologies regarding software sustainability. While most work has focused on the environmental dimension by quantifying the energy consumption of software [16,58,59,65] or focused on the technical dimension by using code metrics [14,55,66], less work has sought to capture sustainability in multiple dimensions [17,63]. The approach of Saputri and Lee [63] used machine learning methods to assess sustainability criteria based on software code. Although the authors focused on three sustainability dimensions, i.e., economic, social, and environmental, the analysis was limited to actual software implementation rather than software architecture. We aimed to close the gap of sustainability QAs on software architecture by using a software quality model, i.e., the SAF-Toolkit by Condori-Fernandez et al. [19], mapping KPIs onto quality attributes and therefore considering all dimensions of sustainability regarding the software architecture.
From the aforementioned studies, we can observe that increasing attention has been dedicated to addressing sustainability aspects in software. However, in the current body of literature, only few studies investigated software sustainability from a software architecture viewpoint. Venters et al. [25] provided a comprehensive overview of the available perspectives and terminologies for software architecture and sustainability, as well as a roadmap of recent research topics for sustainable software architecture. The authors, however, put the emphasis of their work on design decisions focusing on longevity. A number of other scholars have also focused on technical sustainability solely by discussing architecture longevity [15,55,56,67] and technical debt [56,68]. Ojameruaye et al. [57] proposed a method suitable for evaluating technical and economic sustainability in software architectures. The authors sought to quantify the sustainability debt of architecture design decisions. Nevertheless, the environmental and social dimension remained hidden. To support the design process towards holistic sustainability, Lago [27] provided decision maps for framing concerns considering all four sustainability dimensions. In our study, we reused this concept of decision maps as part of our proposed process pipeline to map architecture principles on sustainability.
In this paper, we aimed to overcome certain limitations of previous studies by (i) taking a holistic view of sustainability; (ii) focusing on software architecture; (iii) quantifying sustainability QAs; and (iv) applying our research in an industrial context. Based on the groundwork of Gupta et al. [17], we aimed to contribute towards sustainable development in the context of software architecture by addressing sustainability holistically, i.e., technical, economic, social, and environmental sustainability. Focusing on architecture principles allows architects to address and integrate sustainability at all different layers of business. We used the notion of KPIs to quantify sustainability QA, opening up the feasibility of monitoring architecture principles over time. Our approach can be—and is already—embedded and applied in an industrial context, supporting architects with necessary insights in their sustainability decisions.

9. Conclusions

To summarize our work and draw conclusions, we map our results onto the research questions as defined in Section 3. We close this paper by providing future directions for research.
  • R Q —How can KPIs of software architecture principles be operationalized and measured concerning sustainability?
To answer this research question, a single case study in the context of the Schiphol Group was conducted. Six different cases were considered and the datahub platform PCS was selected for this research. The general PRSM model can be used as a tool-agnostic model by researchers or at a strategic level to analyze architecture principles of sustainability. The extended PRSM+T model can be used as a tool-dependent model by practitioners or on at operational level to monitor KPIs with concrete tools. The proposed process can be used by both practitioners and researchers. Practitioners outside the Schiphol Group can apply the process by integrating the PRSM(+T) model into the architecture process and by combining it with existing techniques. Even if an organization does not yet have elaborated KPIs, it can take our proposed KPIs as a starting point and use the process to develop its own KPIs. Researchers can use the process as a reference to build upon or substitute certain steps in future work.
  • R Q 1 —What tools are accessible to measure sustainability KPIs for software solutions within a given organization?
The KPIs and the tools were developed in a real-world environment. Therefore, the KPIs were measured with tools that are currently available at the Schiphol Group. As there is no universally valid tool that can monitor all KPIs by default, a set of tools were defined that can be used as a starting point by practitioners beyond case and organizational boundaries. In total, seven tools were defined. The tools also support inter-dimensional measurements across the four sustainability dimensions. We can also conclude that the existing tools in an organization should be reused to minimize the number of different data sources. Enterprise logging tools such as Splunk, for example, are useful for measuring multiple KPIs simultaneously. Therefore, centralized logging capabilities should be preferred.
  • R Q 2 —To what extent can the sustainability KPIs be monitored in an automatic way?
To answer this sub-question, all tools considered were analyzed according to their ability for automation. Most tools (six out of seven) support either full automation or semi-automation. Only surveys cannot be automated, because of the manual steps required. Nonetheless, surveys also have substantial value for monitoring sustainability, as this research showed: they are a key tool for the social dimension. Only by conducting surveys can the stakeholders’ experience be measured.
Spider charts were used to monitor and visualize KPIs continuously. For each PRSM+T model, i.e., architecture principle, one spider chart was created. Spider charts offer the ability to compare the impact of architecture principles over time and visualize all related KPIs in one plot. By applying normalization to the measurements, combined spider charts can be created that offer the ability to compare multiple architecture principles on all four sustainability dimensions for an entire software solution. While the normalized version can be used on the strategic level, the zoomed-in version offers a detailed view for the operational level.

Future Work

Our study concerned facilitating an integrated monitoring process. A follow-up long-term study could use our solution to monitor and evaluate the KPIs over a long period. Such a long-term study could be conducted on the PCS solution in production. The live environment would make it possible to implement all KPIs and tools as proposed, deriving further insights. Derived data could help to explore specific relationships between particular architecture principles and certain sustainability dimensions by employing statistical significance tests.
Future research could also engage in presenting the proposed process to a wider and more diverse audience, to assess its usability and generalizability. Potential improvements could be derived to further integrate the pipeline into the daily architecting process.
A further extension of the present study could consider the implementation of the ISO/IEC 2502n—Quality Measurement Division [69]. This standard contains definitions and guidelines for elements of quality measurement. The close relationship to the ISO/IEC 2501n quality model used by our study could provide an opportunity to also define the measurement elements according to a well-known standard.
The list of measurement tools and the assignment on the sustainability dimensions could serve as the basis for a follow-up study. The purpose would be to derive general characteristics of tools for measuring software sustainability. The follow-up study could examine the characteristics and properties of state-of-the-art tools, classify them, and suggest ways to support sustainability.
As already envisioned in this study, spider charts can be used to derive further insights into the actual sustainability impact by calculating the area of the spider polygon. By examining this area, it would be possible to draw further conclusions, such as the inter-dependencies between the sustainability dimensions and their KPIs. An answer to the question of the effective sustainability impact still needs to be investigated.

Author Contributions

Conceptualization, M.F. and P.L.; methodology, M.F.; validation, M.F. and R.D.; formal analysis, M.F.; investigation, M.F.; resources, P.L. and R.D.; data curation, M.F.; writing—original draft preparation, M.F.; writing—review and editing, M.F. and P.L. and R.V.and R.D.; visualization, M.F. and Verdecchia, R.; supervision, P.L. and R.V.and R.D.; project administration, P.L. All authors have read and agreed to the published version of the manuscript.

Funding

This research received no external funding.

Institutional Review Board Statement

Not applicable.

Informed Consent Statement

Informed consent was obtained from all subjects involved in the study.

Data Availability Statement

Data are contained within the article and are available in the online replication package at https://github.com/S2-group/MDPI_monitoring-sustainability_rep-pkg (accessed on 30 January 2024).

Acknowledgments

We would like to thank all interview participants from the Royal Schiphol Group who took part in this study and donated their time, knowledge, and support to make this research possible. We would also like to thank the Royal Schiphol Group for providing the case researched.

Conflicts of Interest

The authors declare no conflicts of interest.

Appendix A. Interviews

Table A1. Questions for interviews in research Phase I.
Goal: Defining the driving architecture principle(s) for a certain part of the PCS solution.
 IQ1.1 What architecture tiers would you define to structure the PCS solution?
 IQ1.2 Would you confirm that the following pillars represent the major components of the PCS solution sufficiently?
 IQ1.3 Would you add/change certain pillars?
 IQ1.4 What are the responsibilities and duties of the column for which you are in charge?
 IQ1.5 Which main stakeholder(s) are involved/addressed by this tier?
 IQ1.6 Which ETO building-blocks and/or cloud solutions (Saas/PaaS/etc.) are used for the implementation of this tier, and why?
 IQ1.7 What architecture principle(s) would you define as driving architecture principle(s) for this specific tier? And why?
 IQ1.8 Which sustainability quality attribute(s) would you select as the driving attribute(s) for the prior selected architecture principle?
 IQ1.9 For each selected sustainability quality attribute, can you define KPIs to track its impact in the context of the PCS solution?
 IQ1.10 The KPI mentioned, how can they be measured (tools; automated; manual; surveys; etc.)?
Table A2. Questions for interviews in research Phase II.
Goal: Defining applicable KPIs, metrics, and measurement tools to a certain architecture principle.
 IQ2.1 Do you agree with the selected architecture tiers defined during the first interview session?
 IQ2.2 Do you agree with the selected architecture principles selected during the first interview session?
 IQ2.3 Do you agree with the selected sustainability quality attributes selected during the first interview session?
 IQ2.4 Do you agree with the revised and selected as driving sustainability quality attributes after using decision maps? Would you choose different?
 IQ2.5 What KPIs and metrics can you think of to measure these particular quality attributes?
 IQ2.6 Are you aware of the Schiphol IT & Data Strategy 2021–2023?
 IQ2.7 (IQ2.6 answered with yes) What Schiphol goal, metric, KPI is suitable to measure these particular quality attributes? Can you think of alternatives?
 IQ2.8 (IQ2.6 answered with no) Do you think that the selected Schiphol goal; metric; KPI is suitable to measure these particular quality attributes? Can you think of alternatives?
 IQ2.9 Which measurement tools would you suggest to use to measure these particular quality attributes?
 IQ2.10 What do you think about this pre-selected measurement tools?
 IQ2.11 Do you have final remarks about the just created PRSM+T model for the selected architecture principle?
Table A3. Questions for focus group in research Phase III.
Goal: Evaluating the final PRSM+T models with their measurements and their spider charts as tool to visualize sustainability.
For each group of PRSM+T and computed spider chart:
 IQ3.1 Is the final PRSM+T model well defined (mapping of the architecture principle to the sustainability quality attributes, the KPIs, metrics, and measurement tools)?
 IQ3.2 Can you confirm the relation to the spider chart?
 IQ3.3 What does the data (i.e., spider chart) mean to you?
 IQ3.4 Do you see potential problems in using or understanding the model and the spider chart?
Regarding the normalized spider chart based on randomized data:
 IQ4.1 What are the advantages and potential problems in using or understanding the normalized spider chart?

Appendix B. Schiphol IT & Data Strategy 2021–2023 —Goals

Table A4. Utilized Schiphol IT & Data Strategy 2021–2023 goals for mapping the specific KPIs.
Focus on Business Value
ASM4—Robust Organization. Improve the focus of the customers to increase the business value.
Solid Foundation
DAI3—Data & AI Governance. Enable data governance to ensure appropriate data quality, lineage, as well as compliance with GDPR and ethical principles.
ETO1—Realize enabling technology outlook. Transform the basic technology landscape into standardized building blocks to assure reusable components.
ETO2—Reliable Delivery. Ensure a reliable transition to cloud applications to deliver continuity and automated processes.
Efficient IT & Data management
CIO1—Safe & Secure. Set cyber security standards to reduce the risk of cyber security threats.
PR2—Increase efficiency. Increase efficiency to reduce cost.

Appendix C. SQ Model

Table A5. SQ model—PCS Messaging Portal.
ISO/IEC 25010 Quality ModelSustainability Dimension
CharacteristicsAttributesTechnicalEnvironmentalEconomicSocial
MaintainabilityModifiabilitySaaS solutions can not be easily modified due to the provider dependencies. Modifications might be not possible due to provider restrictions. The SaaS provider takes care of the modification, hence custom modifications might be either not possible at all or expensive.
Reusability SaaS solutions can be reused by more than one system, even over customers and can be part of other software solutions. Resources at the provider side can be shared.If SaaS components can be reused across software solutions, costs can be reduced.
Serviceability LCM for SaaS solutions is handled by the provider, hence, less support employees are necessary. System has attributes that make it easy to maintain beyond the software development cycle. It continues even when the software is no longer used.
Context coverageFlexibility SaaS solutions can be used in contexts beyond the PCS solution. SaaS solutions have the ability to match with business needs as they flow [70].
ReliabilityAvailability System, i.e., the SaaS solution needs to be highly available. If not, delays in the Cargo process can occur, leading to flight delays and thus enormous economical costs.If the system is not available, the users and customers do not trust and do not use the software solution.
Fault toleranceEven in case of software or hardware faults on the provider side, the SaaS solution would/should operate as usual due to redundancy on the provider side.
AccessibilityAccessibility SaaS solutions are usable by users with different disabilities [70]. This leads to access by many different user groups and with many different devices. In addition, the access to SaaS solutions are easier which decreases the barriers to the service.

References

  1. European Union Aviation Safety Agency. European Aviation Environmental Report 2019; Publications Office. 2019. Available online: https://www.easa.europa.eu/eco/sites/default/files/2021-09/219473_EASA_EAER_2019_WEB_HI-RES_190311.pdf (accessed on 30 January 2024).
  2. Royal Schiphol Group. Annual Report 2020. Available online: https://www.schiphol.nl/en/schiphol-group/page/archive-annual-reports/ (accessed on 30 January 2024).
  3. World Commission on Environment and Development. Report of the World Commission on Environment and Development: Our Common Future; United Nations. 1987. Available online: https://sustainabledevelopment.un.org/content/documents/5987our-common-future.pdf (accessed on 30 January 2024).
  4. Wynn, M.; Jones, P. Industry Approaches to the Sustainable Development Goals. Int. J. Environ. Stud. 2022, 79, 134–148. [Google Scholar] [CrossRef]
  5. European Parliament and the Council of the European Union. Directive (EU) 2022/2464 of the European Parliament and of the Council; Technical Report Directive (EU) 2022/2464. 2022. Available online: https://eur-lex.europa.eu/legal-content/EN/TXT/?uri=CELEX%3A32022L2464 (accessed on 30 January 2024).
  6. Zipse, O.; Hornegger, J.; Becker, T.; Beckmann, M.; Bengsch, M.; Feige, I.; Schober, M. (Eds.) Road to Net Zero: Strategic Pathways for Sustainability-Driven Business Transformation; Springer International Publishing: Cham, Switzerland, 2023. [Google Scholar]
  7. Sürücü, C.; Song, B.; Krüger, J.; Saake, G.; Leich, T. Establishing key performance indicators for measuring software-development processes at a large organization. In Proceedings of the Joint Meeting on European Software Engineering Conference and Symposium on the Foundations of Software Engineering, Virtual, 8–13 November 2020; ACM: New York, NY, USA, 2020; pp. 1331–1341. [Google Scholar]
  8. Parmenter, D. The new thinking on key performance indicators. Financ. Manag. Mag. 2006, 133, 1–4. [Google Scholar]
  9. Kruchten, P.; Obbink, H.; Stafford, J. The Past, Present, and Future for Software Architecture. IEEE Softw. 2006, 23, 22–30. [Google Scholar] [CrossRef]
  10. Bass, L.; Clements, P.; Kazman, R. Software Architecture in Practice, 3rd ed.; SEI Series in Software Engineering; Addison-Wesley: Upper Saddle River, NJ, USA, 2013. [Google Scholar]
  11. The Open Group Architecture Forum. The TOGAF® Standard, Version 9.2; The Open Group. 2018, Volume 9.2. Available online: https://pubs.opengroup.org/architecture/togaf9-doc/arch/ (accessed on 30 January 2024).
  12. Greefhorst, D.; Proper, E. Architecture Principles: The Cornerstones of Enterprise Architecture; Springer: Berlin/Heidelberg, Germany, 2011. [Google Scholar]
  13. Lago, P.; Koçak, S.A.; Crnkovic, I.; Penzenstadler, B. Framing sustainability as a property of software quality. Commun. ACM 2015, 58, 70–78. [Google Scholar] [CrossRef]
  14. Koziolek, H. Sustainability evaluation of software architectures: A systematic review. In Proceedings of the Joint ACM SIGSOFT Conference on Quality of Software Architectures (QoSA) and Architecting Critical Systems (ISARCS), Boulder, CO, USA, 20–24 June 2011; ACM Press: New York, NY, USA, 2011. [Google Scholar]
  15. Durdik, Z.; Klatt, B.; Koziolek, H.; Krogmann, K.; Stammel, J.; Weiss, R. Sustainability guidelines for long-living software systems. In Proceedings of the International Conference on Software Maintenance (ICSM), Trento, Italy, 23–28 September 2012; pp. 517–526. [Google Scholar]
  16. Kern, E.; Dick, M.; Naumann, S.; Guldner, A.; Johann, T. Green Software and Green Software Engineering— Definitions, Measurements, and Quality Aspects. In Proceedings of the International Conference of ICT for Sustainability (ICT4S), Zurich, Switzerland, 14–16 February 2013. [Google Scholar]
  17. Gupta, S.; Lago, P.; Donker, R. A Framework of Software Architecture Principles for Sustainability-driven Design and Measurement. In Proceedings of the International Conference on Software Architecture Companion (ICSA-C), Stuttgart, Germany, 22–26 March 2021. [Google Scholar]
  18. Doran, G.T. There’s a S.M.A.R.T. way to write management’s goals and objectives. Manag. Rev. 1981, 70, 35–36. [Google Scholar]
  19. Condori-Fernandez, N.; Lago, P.; Luaces, M.R.; Places, Á.S. An Action Research for Improving the Sustainability Assessment Framework Instruments. Sustainability 2020, 12, 1682. [Google Scholar] [CrossRef]
  20. Condori-Fernandez, N.; Lago, P. Characterizing the contribution of quality requirements to software sustainability. J. Syst. Softw. 2018, 137, 289–305. [Google Scholar] [CrossRef]
  21. Lago, P.; Condori-Fernandez, N. The Sustainability Assessment Framework (SAF) Toolkit: Instruments to Help Sustainability-Driven Software Architecture Design Decision Making. Available online: https://github.com/S2-group/SAF-Toolkit (accessed on 30 January 2024).
  22. Ishak, Z.; Fong, S.L.; Shin, S.C. SMART KPI Management System Framework. In Proceedings of the International Conference on System Engineering and Technology (ICSET), Shah Alam, Malaysia, 7 October 2019; pp. 172–177. [Google Scholar]
  23. Parmenter, D. Key Performance Indicators: Developing, Implementing, and Using Winning KPIs, 3rd ed.; Wiley: Hoboken, NJ, USA, 2015. [Google Scholar]
  24. Penzenstadler, B. Towards a definition of sustainability in and for software engineering. In Proceedings of the 28th Annual ACM Symposium on Applied Computing (SAC), Coimbra, Portugal, 18–22 March 2013; ACM Press: New York, NY, USA, 2013; p. 1183. [Google Scholar]
  25. Venters, C.C.; Capilla, R.; Betz, S.; Penzenstadler, B.; Crick, T.; Crouch, S.; Nakagawa, E.Y.; Becker, C.; Carrillo, C. Software sustainability: Research and practice from a software architecture viewpoint. J. Syst. Softw. 2018, 138, 174–188. [Google Scholar] [CrossRef]
  26. International Organization for Standardization [ISO]. Systems and Software Engineering—Systems and Software Quality Requirements and Evaluation (SQuaRE)—System and Software Quality Models; Technical Report ISO/IEC 25010:2011; ISO/IEC: Geneva, Switzerland, 2011. [Google Scholar]
  27. Lago, P. Architecture Design Decision Maps for Software Sustainability. In Proceedings of the International Conference on Software Engineering: Software Engineering in Society (ICSE-SEIS), Montreal, QC, Canada, 25–31 May 2019; pp. 61–64. [Google Scholar]
  28. Chaffey, D. OGSM Model: A Strategic Framework for Top-Down Vision Realization. Available online: https://www.smartinsights.com/marketing-planning/marketing-models/ogsm-model-framework/ (accessed on 30 January 2024).
  29. Darke, P.; Shanks, G.; Broadbent, M. Successfully Completing Case Study Research: Combining Rigour, Relevance and Pragmatism. Inf. Syst. J. 1998, 8, 273–289. [Google Scholar] [CrossRef]
  30. Runeson, P.; Höst, M. Guidelines for conducting and reporting case study research in software engineering. Empir. Softw. Eng. Int. J. 2009, 14, 131–164. [Google Scholar] [CrossRef]
  31. Brereton, P.; Kitchenham, B.; Budgen, D.; Li, Z.H. Using a Protocol Template for Case Study Planning. In Proceedings of the International Conference on Evaluation and Assessment in Software Engineering (EASE), Bari, Italy, 26–27 June 2008; BCS Learning and Development Ltd. 2008. Available online: https://www.scienceopen.com/hosted-document?doi=10.14236/ewic/EASE2008.5 (accessed on 30 January 2024).
  32. Brown, S. The C4 Model for Software Architecture. Available online: https://c4model.com (accessed on 8 July 2021).
  33. Müller, J.K. The Building Block Method: Component-Based Architectural Design for Large Software-Intensive Product Families. Ph.D. Thesis, Universiteit van Amsterdam, Amsterdam, The Netherlands, 2003. [Google Scholar]
  34. Kontio, J.; Bragge, J.; Lehtola, L. The Focus Group Method as an Empirical Tool in Software Engineering. In Guide to Advanced Empirical Software Engineering; Shull, F., Singer, J., Sjøberg, D.I.K., Eds.; Springer: London, UK, 2008; pp. 93–116. [Google Scholar]
  35. Felderer, M.; Travassos, G.H. (Eds.) Contemporary Empirical Methods in Software Engineering; Springer: Berlin/Heidelberg, Germany, 2020. [Google Scholar]
  36. Boehm, J.; Curcio, N.; Merrath, P.; Shenton, L.; Stähle, T. The Risk-Based Approach to Cybersecurity; McKinsey & Company: New York, NY, USA, 2020. [Google Scholar]
  37. Splunk Inc. Available online: https://www.splunk.com (accessed on 30 January 2024).
  38. IBM Maximo IT. Available online: https://www.ibm.com/products/maximo/it-asset-management (accessed on 30 January 2024).
  39. Atlassian. Jira—Issue & Project Tracking Software. Available online: https://www.atlassian.com/software/jira (accessed on 30 January 2024).
  40. Red Hat Inc. Official Red Hat OpenShift Documentation. Available online: https://docs.openshift.com (accessed on 30 January 2024).
  41. Qualys. IT Security and Compliance Platform. Available online: https://www.qualys.com (accessed on 30 January 2024).
  42. Andersen, B. Business Process Improvement Toolbox, 2nd ed.; ASQ Quality Press: Milwaukee, WI, USA, 2007. [Google Scholar]
  43. Kaczynski, D.; Wood, L.; Harding, A. Using radar charts with qualitative evaluation: Techniques to assess change in blended learning. Act. Learn. High. Educ. 2008, 9, 23–41. [Google Scholar] [CrossRef]
  44. Patro, S.K.; Sahu, K.K. Normalization: A Preprocessing Stage. Int. Adv. Res. J. Sci. Eng. Technol. 2015, 2, 20–22. [Google Scholar] [CrossRef]
  45. Boudon, R. What Middle-Range Theories Are; American Sociological Association, Sage Publications, Inc.: Washington, DC, USA, 1991. [Google Scholar]
  46. Wohlin, C.; Runeson, P.; Höst, M.; Ohlsson, M.C.; Regnell, B.; Wesslén, A. Experimentation in Software Engineering; Springer: Berlin/Heidelberg, Germany, 2012. [Google Scholar]
  47. Hristov, I.; Chirico, A. The Role of Sustainability Key Performance Indicators (KPIs) in Implementing Sustainable Strategies. Sustainability 2019, 11, 5742. [Google Scholar] [CrossRef]
  48. Kaplan, R.S.; Norton, D.P. The Balanced Scorecard-Measures That Drive Performance. Harv. Bus. Rev. 1992, 71–79. [Google Scholar]
  49. Kaplan, R.S.; Norton, D.P. Using the Balanced Scorecard as a Strategic Management System. Harv. Bus. Rev. 1996, 35–48. [Google Scholar]
  50. Chai, N. Sustainability Performance Evaluation System in Government: A Balanced Scorecard Approach Towards Sustainable Development; Springer: Berlin/Heidelberg, Germany, 2009. [Google Scholar]
  51. Verdecchia, R.; Lago, P.; Ebert, C.; De Vries, C. Green IT and Green Software. IEEE Softw. 2021, 38, 7–15. [Google Scholar] [CrossRef]
  52. Venters, C.C.; Jay, C.; Lau, L.; Griffiths, M.K.; Holmes, V.; Ward, R.R.; Austin, J.; Dibsdale, C.E.; Xu, J. Software sustainability: The modern tower of babel. In CEUR Workshop Proceedings; CEUR: Karlskrona, Sweden, 2014; Volume 1216, pp. 7–12. [Google Scholar]
  53. Venters, C.C.; Kocak, S.A.; Betz, S.; Brooks, I.; Capilla, R.; Chitchyan, R.; Duboc, L.; Heldal, R.; Moreira, A.; Oyedeji, S.; et al. Software Sustainability: Beyond the Tower of Babel. In Proceedings of the International Workshop on Body of Knowledge for Software Sustainability (BoKSS), Virtual, 22–30 May 2021; pp. 3–4. [Google Scholar]
  54. Groher, I.; Weinreich, R. An Interview Study on Sustainability Concerns in Software Development Projects. In Proceedings of the Euromicro Conference on Software Engineering and Advanced Applications (SEAA), Vienna, Austria, 30 August–1 September 2017; pp. 350–358. [Google Scholar]
  55. Koziolek, H.; Domis, D.; Goldschmidt, T.; Vorst, P. Measuring Architecture Sustainability. IEEE Softw. 2013, 30, 54–62. [Google Scholar] [CrossRef]
  56. Capilla, R.; Nakagawa, E.Y.; Zdun, U.; Carrillo, C. Toward Architecture Knowledge Sustainability: Extending System Longevity. IEEE Softw. 2017, 34, 108–111. [Google Scholar] [CrossRef]
  57. Ojameruaye, B.; Bahsoon, R.; Duboc, L. Sustainability debt: A portfolio-based approach for evaluating sustainability requirements in architectures. In Proceedings of the International Conference on Software Engineering Companion, Austin, TX, USA, 14–22 May 2016; ACM: New York, NY, USA, 2016; pp. 543–552. [Google Scholar]
  58. Naumann, S.; Dick, M.; Kern, E.; Johann, T. The GREENSOFT Model: A reference model for green and sustainable software and its engineering. Sustain. Comput. Informatics Syst. 2011, 1, 294–304. [Google Scholar] [CrossRef]
  59. Kalaitzoglou, G.; Bruntink, M.; Visser, J. A Practical Model for Evaluating the Energy Efficiency of Software Applications. In Proceedings of the International Conference on ICT for Sustainability (ICT4S), Stockholm, Sweden, 24–27 August 2014; pp. 77–86. [Google Scholar]
  60. Koçak, S.A.; Alptekin, G.I.; Bener, A.B. Evaluation of Software Product Quality Attributes and Environmental Attributes using ANP Decision Framework. In Proceedings of the Third International Workshop on Requirements Engineering for Sustainability Systems, Karlskrona, Sweden, 26 August 2014; pp. 37–44. [Google Scholar]
  61. Manotas, I.; Bird, C.; Zhang, R.; Shepherd, D.; Jaspan, C.; Sadowski, C.; Pollock, L.; Clause, J. An empirical study of practitioners’ perspectives on green software engineering. In Proceedings of the International Conference on Software Engineering, Austin, TX, USA, 14–22 May 2016; ACM: New York, NY, USA, 2016; pp. 237–248. [Google Scholar]
  62. Andrikopoulos, V.; Lago, P. Software Sustainability in the Age of Everything as a Service. In Next-Gen Digital Services. A Retrospective and Roadmap for Service Computing of the Future; LNCS; Aiello, M., Bouguettaya, A., Tamburri, D.A., van den Heuvel, W.J., Eds.; Springer: Berlin/Heidelberg, Germany, 2021; Volume 12521, pp. 35–47. [Google Scholar]
  63. Saputri, T.R.D.; Lee, S.W. Software Analysis Method for Assessing Software Sustainability. Int. J. Softw. Eng. Knowl. Eng. 2020, 30, 67–95. [Google Scholar] [CrossRef]
  64. Penzenstadler, B.; Raturi, A.; Richardson, D.; Tomlinson, B. Safety, Security, Now Sustainability: The Nonfunctional Requirement for the 21st Century. IEEE Softw. 2014, 31, 40–47. [Google Scholar] [CrossRef]
  65. Mahmoud, S.S.; Ahmad, I. A Green Model for Sustainable Software Engineering. Int. J. Softw. Eng. Its Appl. 2013, 7, 20. [Google Scholar]
  66. Verdecchia, R.; Lago, P.; Malavolta, I.; Ozkaya, I. ATDx: Building an Architectural Technical Debt Index. In Proceedings of the International Conference on Evaluation of Novel Approaches to Software Engineering (ENASE), Prague, Czech Republic, 5–6 May 2020; SciTePress: Setúbal, Portugal, 2020; pp. 531–539. [Google Scholar]
  67. Sehestedt, S.; Cheng, C.H.; Bouwers, E. Towards quantitative metrics for architecture models. In Proceedings of the WICSA 2014 Companion Volume, Sydney, Australia, 7 April 2014; ACM Press: New York, NY, USA, 2014; pp. 1–4. [Google Scholar]
  68. Verdecchia, R.; Kruchten, P.; Lago, P.; Malavolta, I. Building and evaluating a theory of architectural technical debt in software-intensive systems. J. Syst. Softw. 2021, 176, 110925. [Google Scholar] [CrossRef]
  69. International Organization for Standardization [ISO]. Systems and Software Engineering—Systems and Software Quality Requirements and Evaluation (SQuaRE)—Quality Measurement Framework; Technical Report ISO/IEC 25020:2019; International Organization for Standardization [ISO]: Geneva, Switzerland, 2019. [Google Scholar]
  70. Khanjani, A.; Rahman, W.N.W.A.; Ghani, A.A.A.; Sultan, A.B.M. SaaS Quality of Service Attributes. J. Appl. Sci. 2014, 14, 3613–3619. [Google Scholar] [CrossRef]
Figure 1. Overview of the Study Design.
Software 03 00006 g001
Figure 2. PCS solution as a high-level architecture view (C4-Diagram according to Brown [32]).
Software 03 00006 g002
Figure 3. Focus group coding categories.
Software 03 00006 g003
Figure 4. Process illustrating the abstract concepts containing actions ( A 1 A 5 ) to perform the sustainability analysis and inputs ( I 1 I 4 ) to support the actions.
Software 03 00006 g004
Figure 5. Process illustrating the applied tools and references used to create a PRSM+T model for a certain software architecture principle. Actions ( A 1 A 5 ) perform the sustainability analysis; Inputs ( I 1 I 4 ) supporting the actions. (Preliminary PRSM Model [17]; Decision Map [27]; SQ Model [21]; D-Matrix [21]; ISO/IEC 25010 [26]; “SMART” Model [22]).
Software 03 00006 g005
Figure 6. Integration of the sustainability analysis and process pipeline into a general business context to guide decision making.
Software 03 00006 g006
Figure 7. PRSM+T model—PCS Messaging Portal.
Software 03 00006 g007
Figure 8. Decision map for the PCS messaging portal, illustrating the sustainability sub-characteristics and quality attributes. Underlined concerns are taken for the PRSM+T model.
Software 03 00006 g008
Figure 9. Spider charts for all four PRSM+T models obtained from the PCS solution and the proof of concept (PoC) environment. n/a: Measurements for this KPI were not available and therefore it was set to 0. expected: The black outer polygon represents the expected values that could be achieved in the best case. Dimension: Technical; Economic; Social; Environmental.
Software 03 00006 g009
Figure 10. Example spider chart based on randomized and normalized data sets for both tiers: the governance & security (blue) and the PCS messaging portal (red). Dimension: Technical; Economic; Social; Environmental.
Software 03 00006 g010
Table 1. Summary of the most important concepts relevant for the study at hand.
ConceptFull NameRationaleReference
KPIKey Performance IndicatorDefine measurable business objectives and monitor the impact of architecture principles on sustainability.Parmenter [8]
SMARTSpecific; Measurable; Achievable; Relevant; Time phasedEvaluation criteria of the conditions and relevance of a certain KPI.Doran [18]
SQ modelSustainability-Quality (SQ) ModelCaptures for each sustainability-quality concern definitions regarding their context.Condori-Fernandez et al. [19]
D-matrixDependency MatrixIdentifying and uncovering missing sustainability-quality concerns.Condori-Fernandez and Lago [20]
DMDecision MapDiagram framing and illustrating the sustainability-relevant design- and quality concerns and their related dependencies.Lago et al. [13]
SAF-ToolkitSustainability Assessment Framework (SAF) ToolkitA set of instruments (D-Matrix, SQ model, DM) to design the network of sustainability-quality concerns at the software architecture level.Lago and Condori-Fernandez [21]
PRSMPrinciple; Rationale; Sustainability Quality Attribute; MetricPerforms the sustainability analysis for one concrete software architecture principle by mapping sustainability quality attributes and KPIs. (tool-agnostic model)Gupta et al. [17]
PRSM+TPrinciple; Rationale; Sustainability Quality Attribute; Metric; plus ToolExtension of the PRSM model by attaching tools necessary to capture concrete measurements for one particular KPI.
(tool-dependent model)
this present research
Table 2. Interview partners and their corresponding roles and responsibilities. ID: interviewee identifier; Role: current role of interviewee in the current company; Responsibilities: interviewee responsibilities regarding the PCS solution; Experience: interviewee industrial experience (in years).
IDRoleResponsibilitiesExperience
P#1Software ArchitectPCS Market Portal & PCS Messaging Portal16
P#2Enterprise ArchitectGeneral Architecture & PCS Core32
P#3Solution ArchitectGeneral Architecture & PCS Core27
P#4Cyber Security OfficerGovernance & Security21
P#5DeveloperPCS Core & Master Data16
Table 3. Final set of PCS conceptual architecture tiers and their descriptions, mapped to the selected architecture principles and their rationales.
Tier and DescriptionArchitecture Principle and Rationale
PCS Market Portal
Offers various options (i.e.,  communication protocols) for customers to communicate with the PCS solution and send cargo related messages. The incoming external message format will be translated into an internal format.
“Use the Airport Service Bus (ASB) for sharing/exchanging of operational data between applications and parties where routing, filtering, data transformation (integration rules) or transport transformation capabilities are needed.”
The ASB is an integration platform, as it adds functionalities to integrate two or more known systems. ASB incorporates routing, transformation, aggregation, throttling, basic reliable messaging, and user management. However, the ASB causes greater integration overheads, due to increased data exchange as the number of connected applications increases.
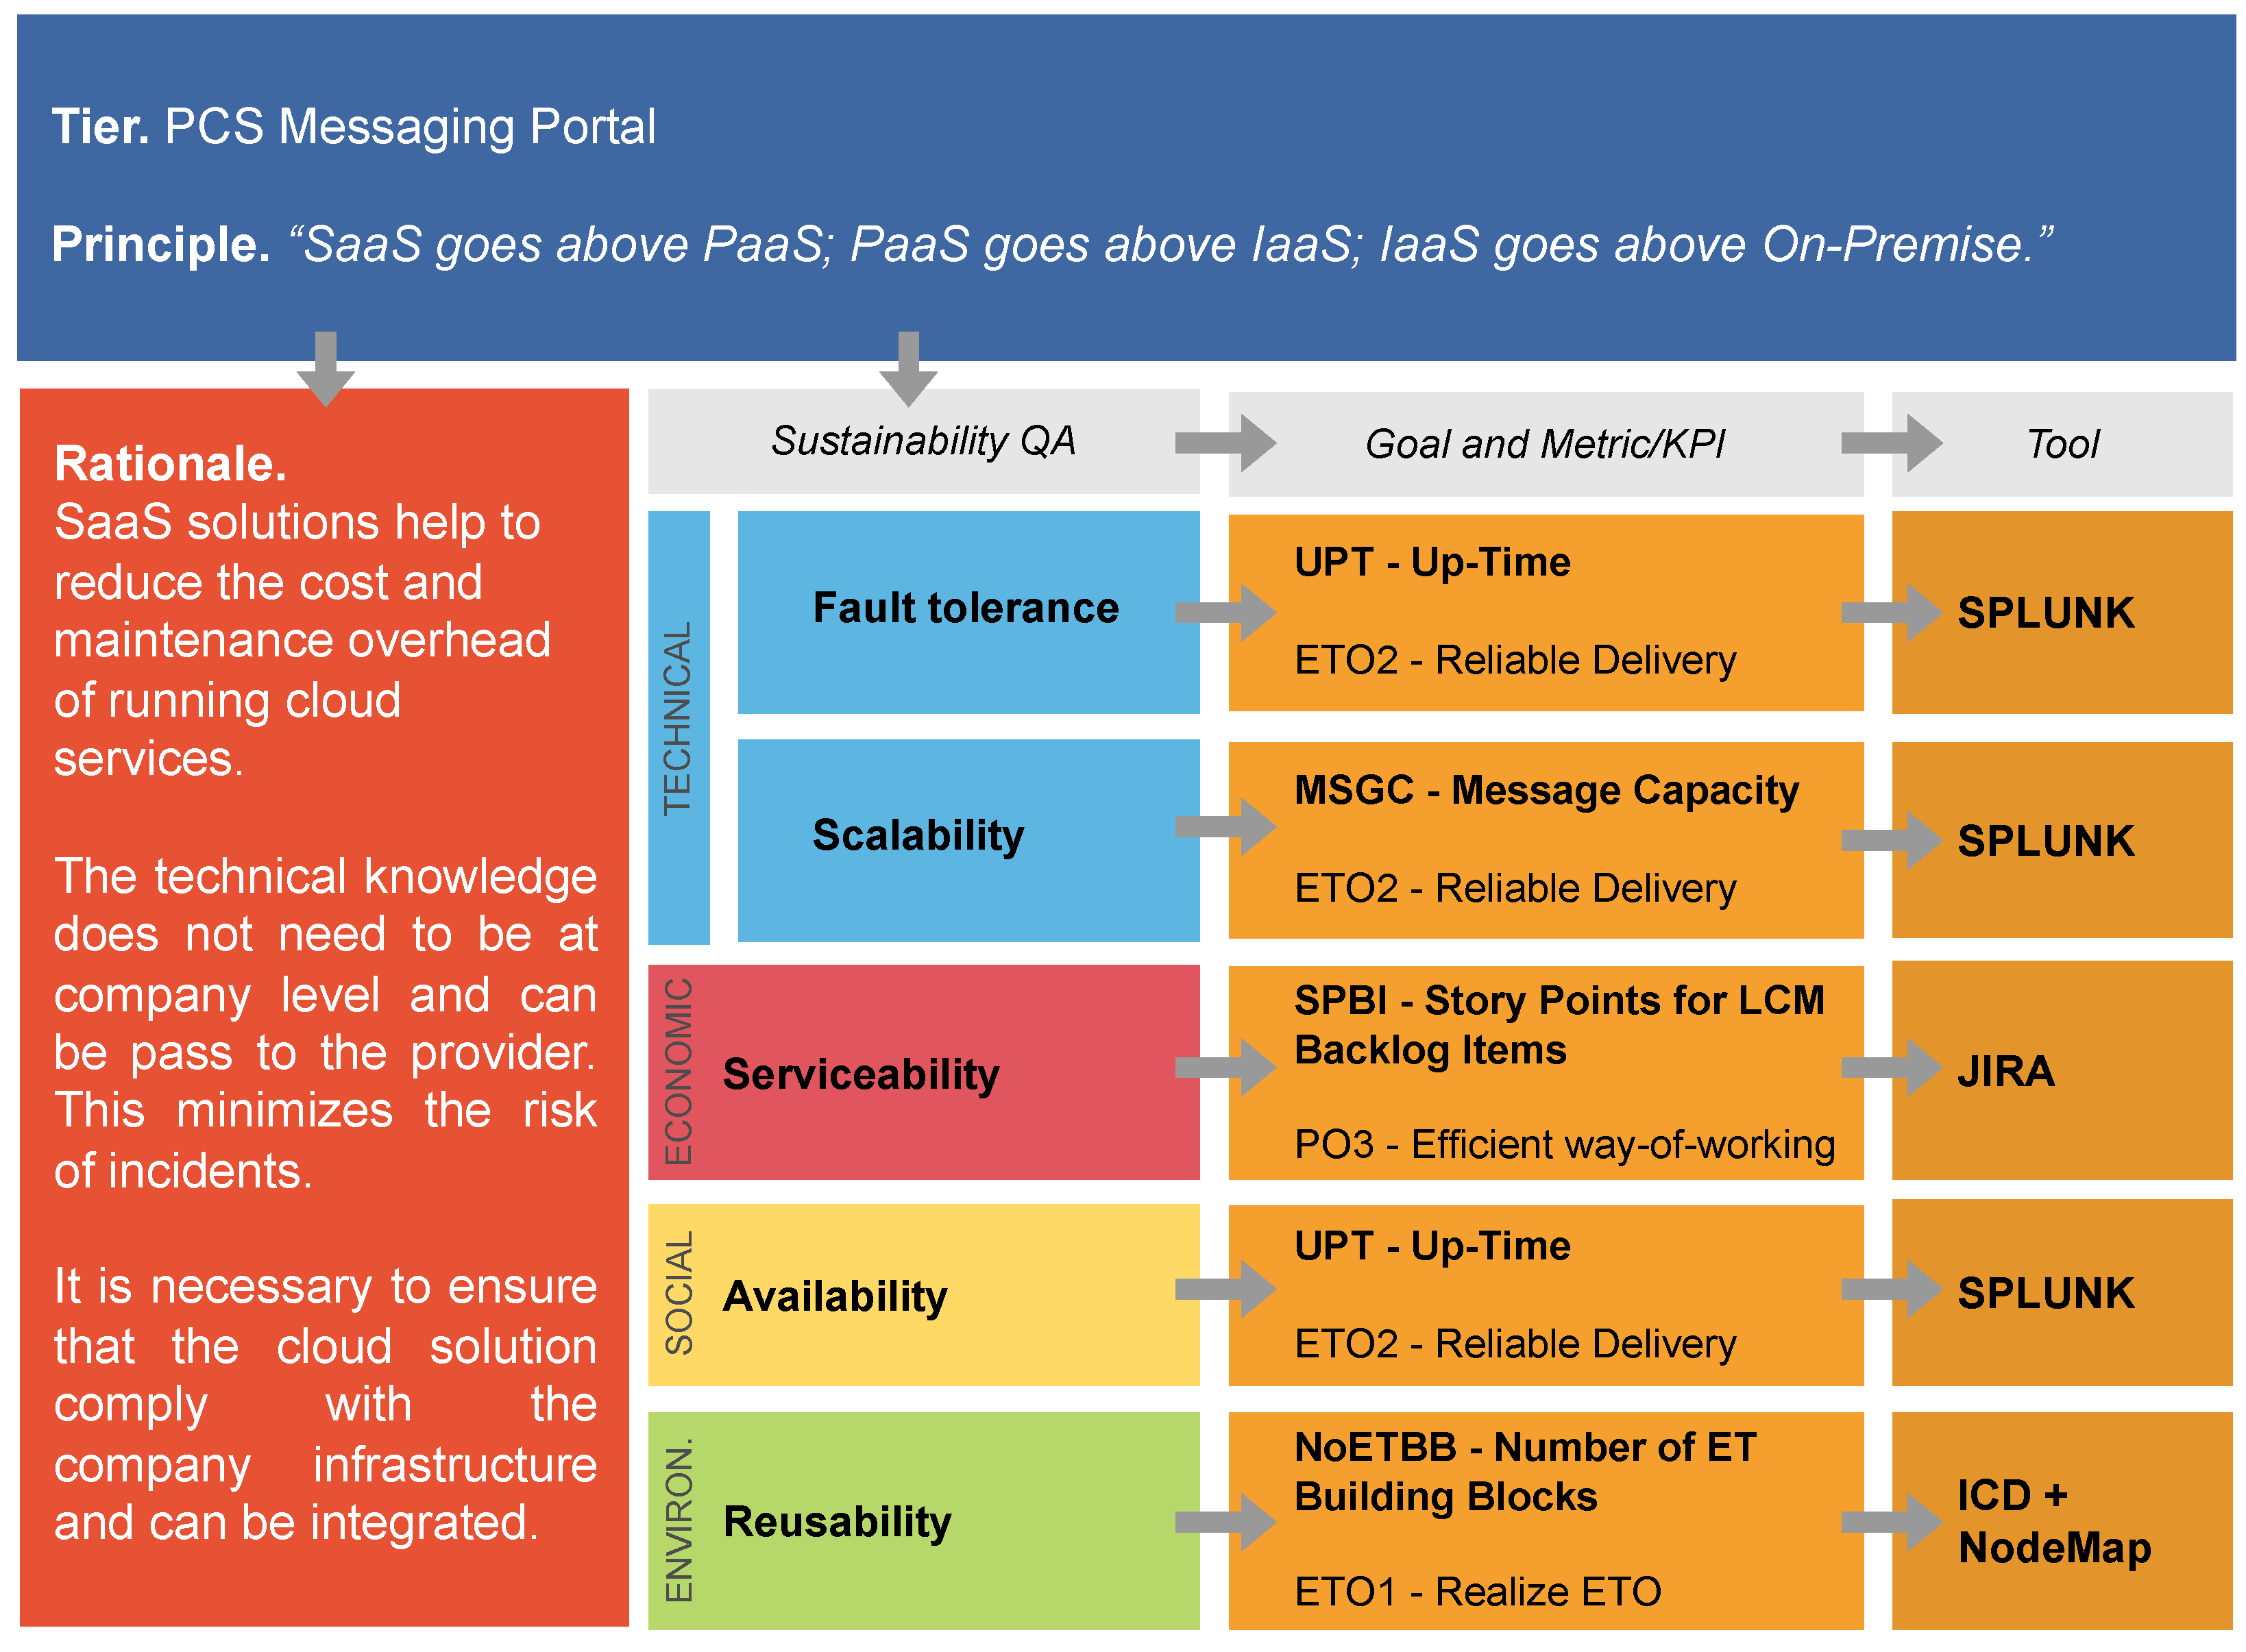
PCS Messaging Portal
Messages delivered via one of the communication protocols implemented at the PCS Market Portal are processed. An incoming message triggers the creation or an update of the cargo case.
“SaaS goes above PaaS; PaaS goes above IaaS; IaaS goes above On-Premise.”
SaaS solutions help in reducing the cost and maintenance overheads of running cloud services. The technical knowledge does not need to be at company level and can be pass to the provider. This minimizes the risk of incidents. Nevertheless, it must be ensured that the cloud solution complies with the company infrastructure and can be integrated.
PCS Core
Responsible for the use-case-management, validation, orchestration, and persistent storing of cargo cases.
“The system is made of loosely coupled components.”
Many different communication protocols are supported to deliver or request cargo-related information. To be able to handle all kinds of communication, loosely coupled components are necessary. For instance, the PCS core system is implemented in sub-components and is loosely coupled to the business engine, which is implemented outside of the core. In addition, the responsibilities of the components are distributed across different layers; messages are used for communication between these layers (i.e., API).
Governance & Security
Compliance with law regulations, Schiphol Group cyber security requirements, and Schiphol Group architecture principles to ensure security and safety across the PCS solution.
“Always authenticate data flows and information requested by internal and external users.”
The PCS implementation consists of multiple different components, which require specific authentication and authorization capabilities. By following the “need-to-know” principle, user access controls and authorization procedures can be enforced. The objective is to ensure that only authorized individuals gain access to the information or systems necessary to undertake their duties.
Table 4. Final set of implemented KPIs. S: reused Schiphol KPI; S⁎: customized Schiphol KPI; : KPI designed for Schiphol. Goal: assigned Schiphol goals (cf. Table A4). QA: mapped quality attribute(s) according to ISO/IEC 25010 Dimension: Technical; Economic; Social; Environmental Sorting: grouped by dimension and then in alphabetic order.
KPINameDefinition (Unit in Bold)GoalQA & Dimension
MSGCMessage CapacityRatio (msg/min) of total processed messages and a certain time period (i.e., one minute).ETO2Scalability
NoDaRNumber of Defects after ReleaseNumber of defects of systems other than the changed system, after a release was published.ETO2Modularity
SNoSINumber of Security IncidentsNumber of security incidents accruing to hosts which are involved into authentication.ETO2Integrity; Confidentiality
ToMThroughput of ASB MessagesTime of message delay between in-going and out-going.ETO2Time behaviour
S⁎UPTUp-TimeRatio (%) of total run-time and the total available time of the SaaS solutions.ETO2FaulttoleranceAvailability
S⁎CpCCosts per ChangeCosts (EUR) per changes per component.PR2Effectiveness
S⁎CRSCyber Risk ScoreRating (0–100) of the cyber risk based on the performed business impact analysis (BIA) and the ratio of the normalized availability, integrity, confidentiality score.CIO1Economic Risk Mitigation
SPBIStory Points for LCM Backlog ItemsNumber of story points for life cycle management (LCM) backlog items.ETO2Serviceability
NoOWNNumber of OpenShift Worker NodesNumber of OpenShift Worker Nodes (i.e., Pods) grows with required system performance.ETO2ScalabilityScalability
S⁎NoCaDFNumber of Channels and Data FormatsNumber of channels and data formats available for data exchange.ETO1Interoperability
NoTSVNumber of TLS/SSL VulnerabilitiesNumber of vulnerabilities regarding TSL or SSL.DAI3Data Privacy
SOCSOverall Customer SatisfactionRating (1–10) of the overall customer satisfaction of internal and external customers as well as testers.ASM4Usefulness
SNoETBBNumber of ET Building BlocksNumber of enabling technology (ET) building blocks that have been reused.ETO1Reusability
S⁎SRSSecurity Risk ScoreRating (1–5) of the security risk based on the vulnerabilities regarding data of relevant hosts.CIO1Health & Safety Risk Mitigation
Table 5. KPI SMART Evaluation. ⬤: in full; 🞅: in part; 🞭: not.
KPINameSMART
MSGCMessage Capacity
NoDaRNumber of Defects after Release🞅🞭🞅
NoSINumber of Security Incidents🞅
ToMThroughput of ASB Messages
UPTUp-Time
CpCCosts per Change🞅🞭🞅
CRSCyber Risk Score🞅
SPBIStory Points for LCM Backlog Items🞭
NoOWNNumber of OpenShift Worker Nodes🞅🞭🞅🞅
NoCaDFNumber of Channels and Data Formats🞅
NoTSVNumber of TLS/SSL Vulnerabilities🞅
OCSOverall Customer Satisfaction🞅
NoETBBNumber of ET Building Blocks🞭
SRSSecurity Risk Score🞅
Table 6. Final set of implemented measurement tools. Automation: ✔: Completely; 🞅: Semi; 🞭: Currently not. QA: measured quality attribute(s). Dimension: Technical; Economic; Social; Environmental Sorting: grouped by dimension.
ToolCapabilityAutomationQA & Dimension
Splunk [37]As “data-to-everything platform”, Splunk offers various capabilities for logging, monitoring, and reporting for all different kinds of data created on an application, server, and network level. We consider Splunk as a key instrument to measure KPIs, as it offers the greatest variety of possible measurements.
  • Modularity
  • Time behaviour
  • Fault-tolerance
  • Scalability
  • Interoperability
  • Availability
IBM Control Desk [38]Provides monitoring for all information system layers. Hence, calculation of the number of applicable building Blocks per software solution and security incidents can be retrieved.
  • Integrity
  • Confidentiality
  • Reusability
Business Impact AnalysisBIA is used to systematically determine potential cyber security risks of a certain information system before implementing it (planning stage). The outcome is a cyber risk score between 0 (best) and 100 (worst). Using external tools (e.g., OneTrust, LLC.), automation is possible.🞅
  • Economic Risk Mitigation
Jira Software [39]Jira itself does not consider actual financial values (e.g., € or $); instead, all values are implicitly related to financial values and indicated as story points. A story point refers to a certain number of labor hours and these, in turn, refer to an actual financial value.
  • Effectiveness
  • Serviceability
OpenShift [40]Red Hat OpenShift offers a containerization platform for cloud computing. To monitor scalability in terms of worker nodes (i.e., number of pods), the Monitoring API (i.e., Prometheus) was used.
  • Scalability
  • Scalability
Qualys Inc. [41]The tool enables auditing, cloud security, and compliance checking for IT infrastructures. We used the security risk score computed for the hosts responsible for authentication and private data.
  • Data Privacy
  • Health & Safety Risk Mitigation
SurveysUsed to systematically obtain information about the attitudes, opinions, and behaviors of the people. These can be oral or written, and structured or with open questions. Even though automatic survey tools are available, such surveys have to be created and interpreted manually.🞭
  • Usefulness
Disclaimer/Publisher’s Note: The statements, opinions and data contained in all publications are solely those of the individual author(s) and contributor(s) and not of MDPI and/or the editor(s). MDPI and/or the editor(s) disclaim responsibility for any injury to people or property resulting from any ideas, methods, instructions or products referred to in the content.

