Article

Network Motif Detection in the Network of Inflammatory Markers and Depression Symptoms among Patients with Stable Coronary Heart Disease: Insights from the Heart and Soul Study

1
College of Nursing, University of Arizona, Tucson, AZ 75243, USA
2
Department of Medicine, School of Medicine, University of California San Francisco, San Francisco, CA 94143, USA
3
San Francisco Veterans Affairs Health Care System, San Francisco, CA 94121, USA
4
School of Nursing and Health Studies, University of Washington Bothell, Bothell, WA 98195, USA
5
Department of Computing and Software Systems, University of Washington Bothell, Bothell, WA 98195, USA
*
Author to whom correspondence should be addressed.
Submission received: 8 February 2024 / Revised: 9 March 2024 / Accepted: 19 March 2024 / Published: 26 March 2024

Abstract

:
Background. Network motif analysis is a technique used to explore recurrent and statistically significant subgraphs within a network. Applying a motif analysis to the complex network of inflammation and depression may yield nuanced insight into the specific interaction mechanisms between inflammatory markers and individual depression symptoms, which is our aim. Methods. This cross-sectional study is based on patients with stable coronary heart disease (CHD). A partial correlation network was initially constructed to link inflammatory markers, including C-reactive protein (CRP), Interleukin-6 (IL-6), tumor necrosis factor-α (TNF-α), monocyte chemoattractant protein-1 (MCP-1), individual depression symptoms, and covariates. A network-centric approach searched all possible non-isomorphic subgraph patterns of size k = 4 in the network. Results. Although CRP, IL-6, and TNF-α displayed an insignificant association with specific depression symptoms, the motif analysis revealed various subgraph patterns of interactions between depression symptoms associated with MCP-1. Generally, MCP-1 formed a closed loop with psychomotor problems and sleep disturbances, and this configuration was connected in various forms with other symptoms, particularly cognitive (e.g., feelings of worthlessness, concentration difficulty, and suicidal ideation) and neurovegetative/somatic (e.g., appetite changes and fatigue) symptoms. Moreover, MCP-1 was frequently associated with a closed-loop triangle comprising cognitive and neurovegetative/somatic symptoms but not with mood symptoms (e.g., loss of interest and feelings of sadness). Conclusions. The findings provide insight into how MCP-1 may be involved in the pathology of depression among patients with stable CHD in a more precise manner. This study also proposes future directions for research on depression.

1. Introduction

A body of literature has demonstrated that depression is linked to increases in inflammatory processes among patients with coronary heart disease (CHD) [1,2,3]. However, not all investigations have confirmed these relationships [4,5]. An explanation that recently received field-wide acceptance suggests that inflammation might be differentially related to specific depression symptoms or symptom subtypes and that any significant associations would be driven by these profiles [6,7]. This interpretation has prompted the study of psychopathology at the symptom level, which thus far has demonstrated that atypical forms of depression (e.g., somatic and neurovegetative symptoms) seem to drive associations of depression with inflammatory markers in CHD patients [8,9].
A notable aspect of these recent efforts is that researchers have increasingly shifted away from the “selective approach” of separately modeling the association of inflammatory markers with each specific depression symptom/subtype and instead increasingly embrace network analysis as a means to attain a more integral perspective on inflammation–symptom associations. Network analysis is a powerful tool that simultaneously estimates the pairwise conditional connections between all variables (referred to as “nodes”) within a single mathematical framework [10]. In a network comprising inflammatory markers and depression symptoms, network analysis enables the complex interplay between variables to be revealed, identifying which specific symptom exhibits the most robust correlation with inflammatory markers while controlling for other variables (i.e., partial correlation). Studies have adopted this technique to explore dynamic inflammation–depression symptom associations involving various inflammation proteins such as C-reactive protein (CRP), Interleukin-6 (IL-6), and tumor necrosis factor-α (TNF-α) among diverse populations [11,12,13,14,15,16], which as of recently also include patients with stable CHD [9].
Network science enables us to comprehend complex systems, with a key aspect being the utilization of graph algorithms to identify and analyze unique substructures within these networks, known as ‘subgraphs’ or ‘subnetworks.’ These tools are essential for detecting patterns, such as tightly knit communities or pivotal nodes, that significantly influence the network’s overall connectivity and functionality. This, in turn, provides deeper insights into the system’s underlying properties and dynamics. There have been earlier attempts to detect these subgraphs within the network of inflammatory markers and psychiatric symptoms [17,18], primarily based on community detection algorithms (e.g., Walktrap algorithms, edge-betweenness approach, etc.), which define a subgraph as a set of nodes featuring more dense connections between its members than to the remainder of the network [19,20]. Essentially, community detection algorithms aim to identify naturally occurring groups within a network, regardless of their number or size, by dividing the network into clusters of vertices that share fewer connections with each other [20]. For instance, Santoso et al. [17] investigated the network structure of psychoneurological symptoms and stress/inflammation markers in newly diagnosed head and neck cancer patients and detected a distinct subgraph comprising a range of psychoneurological symptoms that were particularly associated with CRP and cortisol. Henneghan et al. [18] visualized a cytokine-symptom network (perceived stress, fatigue, loneliness, cognitive impairment, daytime sleepiness, sleep quality, and 13 cytokines) among breast cancer survivors and identified unique subgraphs within this network. From a network perspective, such a subgraph can pinpoint a group of nodes that may be readily influenced when a node included in the subgraph changes state [21]; for example, more densely connected variables may feature stronger mutual feedback.
To date, community detection algorithms typically offer a broader-level overview of densely connected nodes, without providing details of the structural properties or characteristics of the subgraph; however, it is probable that more intricate, higher-order connectivity patterns are present among the interconnected nodes of inflammation markers and symptoms, which may be highly informative. For uncovering these structural patterns, network motif analysis is an important tool [22]. In brief, a network motif is another concept describing local properties of a network and is defined as subgraphs or patterns of interconnections occurring in complex networks at numbers significantly higher than those in randomized networks, emphasizing statistical importance [23].
A network motif is selected based on its structural uniqueness, and the search involves counting all possible network configurations or connectivity patterns (refer to more details with Kim et al. [22]). The total number of non-isomorphic subgraphs or network motifs depends on the number of nodes being considered. For instance, for a structural motif size of k = 4, the method can detect a total of six non-isomorphic size-4 graph patterns from an undirected network, as shown in Figure 1, and recognize some patterns as network motifs after statistical analysis. Overall, the network motif analysis approach may provide a significantly more refined picture of meaningful subgraph structures in a given network than has previously been appreciated.
Network motif analysis has predominantly found application in the field of systems biology, for instance in areas such as predicting essential proteins [24], identifying breast cancer-related genes [25], and determining protein interactions [26]. However, there are no theoretical barriers to applying network motif analysis to any type of networked data. It is a versatile statistical method that can be used to identify network motifs in complex networks across many fields of science, such as social [27] or semantic networks [28]. Without exception, all these networks can be represented as graphs, which include a wide variety of subgraphs. Applying motif analysis to the network of inflammation- and depression-related factors may yield nuanced insights into the specific interaction mechanisms between inflammatory markers and individual depression symptoms.

Study Aims

In summary, this exploratory investigation used network motif analysis to identify frequent and statistically unique subgraph patterns (“network motifs”) in a network of inflammation and depression symptoms among patients with established CHD. As the first study to apply this approach to immunopsychiatry, we believe that our study can take the field a substantial step forward and ultimately help improve patient outcomes.

2. Materials and Methods

2.1. Dataset and Sample

This study is a cross-sectional analysis of baseline data from the Heart and Soul Study. The Heart and Soul Study is a prospective cohort study originally designed to investigate how psychological disorders lead to CHD events in outpatients with stable CHD. The enrollment process and methods have been previously described in another study [29]. Briefly, patients were recruited from clinics at the San Francisco Veterans Affairs (VA) Medical Center, the Palo Alto VA Health Care System, the University of California San Francisco Medical Center, and the San Francisco Community Health Network. Patients were considered eligible for study participation if they fulfilled at least one of the following criteria: a history of myocardial infarction (MI), angiographic evidence of at least 50% stenosis in one or more coronary vessels, previous evidence of exercise-induced ischemia using treadmill or nuclear testing, or a history of coronary revascularization. Exclusion criteria included a history of myocardial infarction in the past 6 months, self-perceived inability to walk for a distance of one block, or having plans to move out of the local area within 3 years. A baseline visit consisting of an in-person interview, the completion of a questionnaire, echocardiogram recordings of baseline and stress values from an exercise treadmill test, and a 12 h fasting blood draw was completed by all participants.
From September 2000 to December 2002, a total of 1024 patients enrolled in the study. Out of this initial sample, we removed participants with incomplete data (listwise deletion). Following this step, the study retained a total of 967 participants (81.9% men) who were used as the primary sources of data for analysis.

2.2. Measures

2.2.1. Inflammation Markers and Covariates

Markers of inflammation included CRP, IL-6, TNF- α, and monocyte chemoattractant protein-1 (MCP-1). Participants were instructed to fast for 12 h (except for medication consumable with water), avoid consuming aspirin for 1 week, and avoid smoking for 5 h before their appointment. Venous blood samples were obtained, and plasma and serum samples were stored at −70 °C. The laboratory technicians performing the inflammatory marker assays were blinded to the results of the depression interview. High-sensitivity CRP levels were determined using the Roche Integra or Beckman Extended Range assays. The results obtained from these two assays exhibited a highly significant correlation. (r = 0.99). To measure IL-6, TNF-α, and MCP-1 levels, the Human Serum Adipokine Panel B LINCOplex Kit (Linco Research, Inc. St. Charles, MO, USA, subsequently acquired by Millipore), was utilized. In order to account for potential confounding effects, age and body mass index (BMI) were included as covariates in the analyses.

2.2.2. Depression Symptoms

The nine-item self-reported patient health questionnaire (PHQ-9) was used to measure the following nine individual depressive symptoms listed in the Diagnostic and Statistical Manual of Mental Disorders-Fourth Edition [30]: (1) psychomotor/cognitive symptoms, including psychomotor problems, feelings of worthlessness, concentration difficulty, and suicidal ideation; (2) mood symptoms, such as loss of interest and feelings of sadness; and (3) neurovegetative/somatic symptoms, including appetite changes, fatigue, and sleep disturbance [31]. The questionnaire evaluates symptoms over the previous 2 weeks rated on a scale of 0 = not at all, 1 = several days, 2 = more than half of the days, or 3 = nearly every day.

2.3. Statistical Analysis

2.3.1. Correlation Network Construction

In the current study, a partial correlation was employed to construct networks where the coefficient was calculated based on the correlation between two variables, considering the correlation with the remaining set of variables. Prior to the network construction, the data were organized in a comma separated values (CSV) file in a tabular form, with columns representing the variables (inflammatory markers, individual depression symptoms, and covariates) and rows representing the patient records. This CSV file was uploaded to the Java-based CorrelationCalculator software (v.1.0.1; http://metscape.ncibi.org/calculator.html) accessed on 23 August 2023 for correlation analysis. As most inflammatory biomarkers exhibit an abnormal distribution and are highly skewed, the data were normalized using the “autoscale data” option. The correlation analysis was performed using a debiased sparse partial correlation (DSPC) algorithm. In the final step, the CorrelationCalculator generated a CSV file with the correlated variables in the first two columns, partial correlation coefficients in the third, unadjusted p-values in the fourth, and adjusted p-values in the fifth. We selectively included only significant correlations, setting a threshold of adjusted p-value < 0.05. Variables that met this significance criterion (identified in the first and second columns) were extracted and saved in a text (.txt) file. This file was subsequently imported into Cytoscape software (v.3.7.0; cytoscape.org) to construct the (unweighted) network, as illustrated in Figure 2. A correlation network was constructed as an undirected graph due to the cross-sectional nature of the study design. Each network “node” represents an inflammatory marker, individual depression symptom, or covariates, and each “edge” represents the partial correlation coefficient between two nodes.
Table S1 displays the significant partial correlations (r) with adjusted p-values less than 0.05, while Figure 2 visually represents the constructed correlation network. CRP, IL-6, and TNF-α did not correlate directly with individual depression symptoms. However, MCP-1 displayed significant correlations with “sleep disturbance” (r = 0.107, adjusted p = 0.022) and “psychomotor problems” (r = 0.099, adjusted p = 0.031). Interestingly, “psychomotor problems” displayed the most connections to other individual depression items and inflammatory markers within the network.

2.3.2. Network Motif Analysis

The web program NemoSuite (Network Motif Analysis in a Suite; https://bioresearch.css.uwb.edu/biores/NemoSuite/) accessed on 23 August 2023 developed by Kim et al. [32] was applied to detect and analyze network motifs. Although network motifs may provide deep insight into the network’s functional abilities, their detection is computationally challenging and not well supported by existing systems. NemoSuite is an easily accessible and highly usable tool that is available in a web-interactive and graphical user interface format [32]. It offers great efficiency that current network motif detection software programs lack, such as various input and output options, enabling users to find efficient solutions for motif detection. In addition, this is the first tool that provides both network and motif-centric approaches using two programs, Nemo and NemoMapPy. The Nemo program implements a network-centric approach using NemoLib, while the NemoMapPy program implements the NemoMap algorithm, one of the motif-centric methods. A network-centric approach, which was employed in our study, is particularly useful if the user aims to detect which patterns are network motifs. This approach searches for all possible non-isomorphic subgraph patterns within a specified size range (typically three to eight) in the target network, whereas the motif-centric method counts the occurrence of a predetermined query graph pattern in the original network [33]. The frequency of each pattern is compared in a random pool to ascertain whether the frequency is statistically high, eventually yielding statically verified frequent patterns (i.e., network motifs). The uniqueness of each pattern is determined based on the p-value or z-score. Generally, a subgraph with a p-value of less than 0.01 or a z-score higher than 2.0 is considered a network motif.
A network-centric approach requires an input network, directness, a motif size of k, and the number of random graphs to generate. We used the text (.txt) file created in the initial step (this time, without the column names) as an input network and uploaded it to the Nemo program. An “undirected graph” was chosen, given the cross-sectional nature of the study design. The motif size (k) was set to four, considering the computational efficiency, interpretability, and statistical robustness, and the random graph size was set to 10 [32]. A network-centric approach offers three output options—NemoCount, NemoProfile, and NemoCollection—whose formats were introduced by Kim and Haukap [34]. The NemoCount option returns the patterns of each detected subgraph, with its frequency in the input network and average frequency in random graphs. Finally, it demonstrates its statistical results so the user can identify which pattern is a network motif. This output is provided for all options by default. However, the NemoProfile, and NemoCollection options provide additional files. The NemoProfile option generates a SubgraphProfile file that comprises a two-dimensional matrix with i rows and j columns, where n represents the total number of nodes present in the input graph, and m corresponds to the number of subgraph patterns generated in the target network. The value at (i, j) signifies the number of occurrences of the ith node in the jth subgraph. From the SubgraphProfile, users can select the columns that correspond to network motifs, which can be used for the NemoProfile. The NemoCollection option offers a file, SubgraphCollection, which lists all instances of each subgraph pattern. From this file, users can easily generate a NemoCollection by collecting only the instances of network motifs.

3. Results

Table 1 presents the NemoCount results. We identified a total of 99 instances of “CR” size-4 subgraphs (48.8%), 8 instances of “Cr” size 4-subgraphs (3.9%), 53 instances of “CN” size-4 subgraphs (26.1%), 20 instances of “CF” size-4 subgraphs (9.9%), one instance of “C~” size-4 subgraphs (0.5%), and 22 instances of “C^” size-4 subgraphs (10.8%). The “CN,” “C~,” and “C^” patterns were identified as network motifs through statistical analysis, indicated by a p-value of less than 0.01 or a z-score greater than 2.0. Table 2 presents the NemoProfile matrix (A), where Aij represents the frequency of node i’s involvement in subgraph j; notably, MCP-1 is the most recurrently involved inflammatory marker in these motifs (“CN,” “C~,” and “C^” patterns).
Table S2 provides the NemoCollection results. Among the “CN” patterns, the one that illustrates the connections between inflammatory markers and depression symptoms includes the following: psychomotor problems, suicidal ideation, concentration difficulty, and MCP-1; psychomotor problems, suicidal ideation, MCP-1, and sleep disturbance; psychomotor problems, fatigue, appetite changes, and MCP-1; psychomotor problems, appetite changes, concentration difficulty, and MCP-1; psychomotor problems, concentration difficulty, MCP-1, and sleep disturbance; psychomotor problems, MCP-1, sleep disturbance, and feelings of worthlessness; BMI, fatigue, IL-6, and age; BMI, fatigue, IL-6, and TNF-α; BMI, IL-6, age, and appetite changes; BMI, IL-6, age, and feelings of worthlessness; fatigue, appetite changes, sleep disturbance, MCP-1; appetite changes, feelings of worthlessness, sleep disturbance, and MCP-1; and appetite changes, feelings of worthlessness, age, and IL-6]. The “C~” pattern comprises only depression symptoms. In the case of the “C^” patterns, the following motifs exhibit connections between depression symptoms and inflammatory markers: psychomotor problems, fatigue, MCP-1, and disturbance; and psychomotor problems, appetite changes, MCP-1, and sleep disturbance.
It is important to note that the NemoSuite program does not provide a graphical representation for each motif. Therefore, each motif must be inferred by referencing the constructed correlation network (Figure 2) based on the NemoCollection results. Thus, the manually drawn graphical presentation of these motifs is shown in Table 3. Generally, MCP-1 formed a closed loop with psychomotor problems and sleep disturbances, and this configuration was connected in various forms with other symptoms, particularly cognitive (e.g., feelings of worthlessness, concentration difficulty, and suicidal ideation) and neurovegetative/somatic (e.g., appetite changes and fatigue) symptoms.

4. Discussion

Using the web program NemoSuite, we detected motifs in a network of inflammatory markers and individual depression symptoms in patients with established CHD. Three non-isomorphic subgraphs of size 4, represented by the “CN,” “C~,” and “C^” patterns, were identified as network motifs through statistical analysis, with criteria such as p-values or z-scores. Notably, MCP-1 appeared most frequently in the network motifs among inflammatory markers. After visualizing all instances of individual motifs that illustrate connections between inflammatory markers and depression symptoms, we obtained encouraging results regarding the distinct pattern each motif reveals.
MCP-1 is a chemokine released by activated microglia and potentially plays a crucial role in monocyte trafficking to the brain, which could lead to excitotoxic neuronal injury that induces depression [35]. Earlier studies have reported a positive correlation between MCP-1 and the severity of depression symptoms [36], including studies involving patients with type 2 diabetes [37]. Elevated MCP-1 levels in major depressive disorders were confirmed through a meta-analysis [38] in a recent study [39] and a study involving patients with congestive heart failure [40]. Unlike previous research, we recognized specific subgraphs or patterns of symptoms of depression using a motif-inspired paradigm in which MCP-1 may confer risk in patients with stable CHD.
The preliminary results of this study revealed that MCP-1 displays significant and direct correlations with psychomotor problems and sleep disturbances. Psychomotor problems (especially psychomotor slowing) are a cardinal symptom of major depressive disorders. Inflammation exerts specific effects on the basal ganglia regions that mediate inflammation-associated decreases in motivation and motor activity [41]. These effects may be partially related to the impact of inflammation on dopamine in key basal ganglia regions, including the ventral striatum [41]. To the best of our knowledge, only studies by Goldsmith et al. [42,43] have demonstrated that MCP-1 exhibits an association with decreased psychomotor speed. Furthermore, no study has demonstrated that MCP-1 is related to specific depression symptoms, such as sleep disturbances, in patients with stable CHD. Kazmi et al. [44] recently reported findings that demonstrate significant associations between MCP-1 and sleep quality. Additionally, a recent meta-analysis highlighted the relationship between higher levels of MCP-1 and the risk of obstructive sleep apnea [45].
Notably, the motif analysis results offer a number of intriguing insights into patterns of interactions between depression symptoms associated with MCP-1. In several individual motif instances, MCP-1 formed a closed loop with psychomotor problems and sleep disturbances. Specifically, fatigue and appetite changes, commonly referred to as “sickness behaviors” in animal models of depressive illness, were associated with this closed-loop structure, forming a C^ pattern, suggesting a potential feedback or regulatory mechanism within this structure. Although the network in this study is treated as undirected, thereby omitting crucial directional information among specific symptoms in the C^ pattern, the results offer an opportunity for a more detailed understanding of MCP-1’s critical role in depression pathology.
Moreover, MCP-1 was frequently associated with a closed-loop triangle comprising cognitive and neurovegetative/somatic symptoms. For instance, in one case with a CN pattern, MCP-1 was associated with a closed-loop triangle comprising psychomotor problems, concentration difficulty, and suicidal ideation with a direct link to psychomotor problems. In other instances, such as with the CN pattern, concentration difficulty and suicidal ideation were indirectly linked to MCP-1 via psychomotor problems. While no study has reported any association between MCP-1 and concentration difficulty in patients with CHD, MCP-1 has been linked to cognitive impairments in diverse clinical populations, including first-episode psychosis [46], cognitive deficits associated with HIV [47], mild cognitive impairment, early stages of Alzheimer’s disease [48,49], and neurocognitive deficits after carotid endarterectomy [50]. Furthermore, MCP-1 exhibited increased expression in the brains of suicide victims [51]. Although it remains challenging to distinguish whether each component of the network motif acts as a moderator, mediator, or confounder, given the nature of the network analysis approach, these observations may support the results of previous studies.
In all individual motif instances, MCP-1 was not associated with mood symptoms (e.g., loss of interest and feelings of sadness; “pure depression”). The underlying etiology may vary across depression symptom constructs [52]. Given the results, MCP-1 appears to be more involved in cognitive and neurovegetative/somatic symptoms than in mood symptoms. The observed variations in specific depression symptoms related to MCP-1 in our study highlight the complex nature of depression, advocating for an approach that transcends simplistic aggregate scoring. However, it is important to recognize that empirical studies on MCP-1’s role in depression have produced mixed outcomes, including findings of decreased MCP-1 levels in individuals with major depressive disorder [39,53,54,55]. These inconsistencies underscore the intricate relationship between inflammation markers and depression, emphasizing the need for further research in this domain.
As observed in past literature [56,57,58], increased levels of IL-6 were related to age and BMI in the sample. However, CRP, IL-6, and TNF-α did not indicate any direct association with specific depression symptoms, nor were they implicated in any motif instances. Previous network studies have demonstrated that several inflammation–depression (sum score) and inflammation–symptom relationships involving CRP, IL-6, and TNF-α are often attenuated by controlling for confounders, such as age and BMI [11,12,13,15,16]. A recent study that utilized various network analyses to explore how CRP is uniquely related to specific depression symptoms in patients with stable CHD [9] found that the association between CRP levels and depression symptoms weakened after adjusting for factors like age and BMI. Expressly, BMI is acknowledged as a significant confounding factor in the correlation between inflammation and depression [59], with adipose tissue acting as a proactive endocrine organ and producing a multitude of proinflammatory cytokines [60]. Furthermore, CRP cannot cross the blood–brain barrier and directly affect emotion-regulating areas in the brain [61].
Lastly, we underscore the distinctive application of the NemoProfile as a method of feature selection. As illustrated in Table 2, the NemoProfile saves the set of subgraph instances as structural matrices so that the frequency of each node’s involvement in each subgraph pattern is recorded, while most motif-finding algorithms provide only the frequency and statistical significance of each pattern [62]. In addition, nodes frequently involved in network motifs may be more critical. If a node is involved in several distinct types of network motifs, it may potentially have multifunctional roles [63]. For example, Wang and Kim [64] found that NemoProfile can be used as a data feature to detect essential genes. By taking advantage of the NemoProfile approach, future research may replicate this study with a broader array of inflammatory markers and investigate the critical inflammatory agents that most frequently appear in the network motifs, which may be the essential feature in explaining depression.

4.1. Limitations

As mentioned in the discussion, the first and primary limitation of this study is the cross-sectional design, in which a causative link between variables in network motifs cannot be directly inferred. While our results may offer fundamental insights into the inflammatory processes underlying depression, it is important to note that for network analysis to effectively inform intervention strategies, treatment decisions, and diagnoses, longitudinal designs are necessary [65]. These designs would allow us to model changes in nodes (e.g., symptoms) over time [65]. Second, the generalizability of the findings is limited, as patient recruitment was from only one site, which predominantly comprised males. Third, there is a risk of residual confounding from factors associated with the levels of inflammatory markers and depression, including medical health status, medication use, alcohol dependence, and cigarette use, which may serve as significant sources of bias and should be addressed in future studies. Fourth, although the motif size (k) was set to four in this study, considering the computational efficiency, interpretability, and statistical robustness, the findings may have been different if we set out to measure the motif distribution of sizes greater than four. Thus, we regard this study as exploratory. Fifth, the process of identifying network motifs is based on an unweighted network, which presents a limitation in interpreting each network motif instance because it does not consider the edge weight of each association. Therefore, caution is required when interpreting the results. Finally, direct comparisons of our findings with those from earlier network analysis studies on inflammation and depression [9,11,12,13,15,16] may not be straightforward. Variations in partial correlation calculations, sample sizes, node selection, and covariate types may make these comparisons challenging. Additionally, while prior research has largely centered on CRP, our study represents the initial foray into using network motif analysis to explore the association between inflammation and depression, incorporating a wider array of inflammatory markers. Consequently, our findings should be considered highly exploratory.

4.2. Future Directions

The NemoSuite program provides the results as text output without a means of visual analysis (i.e., a visual representation of the motif structure). As Kim et al. (2020) noted, future work should add more utility programs, such as motif visualization and graph file conversion. In addition, the conclusions regarding the direction of the association were limited by the PHQ-9, as some items were double barreled. For instance, changes in psychomotor functioning (i.e., psychomotor slowing or agitation) were represented by the same criterion for depression. Accordingly, leveraging more fine-grained information on depression symptoms (through other scales) is an essential step in furthering these research efforts.

5. Conclusions

Research on depression still has much to uncover, and we believe that a network motif analysis is a promising methodology that could demystify its etiology. The motivation for this exploratory investigation is to promote this motif-inspired paradigm to uncover the mechanisms of inflammation-depression symptoms in patients with established CHD. If this study were replicated with a more diverse range of inflammatory markers and more fine-grained depression items, the findings could inform more effective anti-inflammatory strategies for more precisely managing depression.

Supplementary Materials

The following supporting information can be downloaded at: https://0-www-mdpi-com.brum.beds.ac.uk/article/10.3390/psycholint6020027/s1, Table S1: Significant partial correlations (r) with adjusted p-values less than 0.05; Table S2: NemoCollection results.

Author Contributions

Conceptualization, C.L. and W.K.; methodology, C.L. and W.K.; software, W.K.; formal analysis, C.L. and W.K.; investigation, C.L. and W.K.; resources, M.W. and W.K.; data curation, M.W.; writing—original draft preparation, C.L., W.K. and M.W.; writing—review and editing, C.L., W.K., M.W. and K.N.; visualization, C.L. and W.K.; supervision, W.K., M.W. and K.N. All authors have read and agreed to the published version of the manuscript.

Funding

This research received no external funding.

Institutional Review Board Statement

For the present secondary data analysis, the first author received the data from the principal investigator of the Heart and Soul Study after receiving approval from the University of Washington (approval no. STUDY00015032). All methods and procedures were conducted in accordance with the relevant guidelines and regulations. The Heart and Soul Study was approved by the following institutional review boards: the Committee on Human Research at the University of California, San Francisco; the Research and Development Committee at the San Francisco Veterans Affairs Medical Center; the Medical Human Subjects Committee at Stanford University; the Human Subjects Committee at the Veterans Affairs Palo Alto Health Care System; and the Data Governance Board of the Community Health Network of San Francisco.

Informed Consent Statement

Informed consent was obtained from all subjects involved in the study.

Data Availability Statement

The datasets used and analyzed during the current study are available by submitting a proposal request to the Heart and Soul Study team (https://heartandsoulstudy.ucsf.edu/).

Conflicts of Interest

The authors declare no conflicts of interest.

References

  1. Bankier, B.; Barajas, J.; Martinez-Rumayor, A.; Januzzi, J.L. Association between major depressive disorder and C-reactive protein levels in stable coronary heart disease patients. J. Psychosom. Res. 2009, 66, 189–194. [Google Scholar] [CrossRef] [PubMed]
  2. Howren, M.B.; Lamkin, D.M.; Suls, J. Associations of depression with C-reactive protein, IL-1, and IL-6: A meta-analysis. Psychosom. Med. 2009, 71, 171–186. [Google Scholar] [CrossRef]
  3. Lespérance, F.; Frasure-Smith, N.; Théroux, P.; Irwin, M. The association between major depression and levels of soluble intercellular adhesion molecule 1, interleukin-6, and C-reactive protein in patients with recent acute coronary syndromes. Am. J. Psychiatry 2004, 161, 271–277. [Google Scholar] [CrossRef]
  4. Davidson, K.W.; Schwartz, J.E.; Kirkland, S.A.; Mostofsky, E.; Fink, D.; Guernsey, D.; Shimbo, D. Relation of inflammation to depression and incident coronary heart disease (from the Canadian Nova Scotia Health Survey [NSHS95] Prospective Population Study). Am. J. Cardiol. 2009, 103, 755–761. [Google Scholar] [CrossRef]
  5. Whooley, M.A.; Caska, C.M.; Hendrickson, B.E.; Rourke, M.A.; Ho, J.; Ali, S. Depression and inflammation in patients with coronary heart disease: Findings from the Heart and Soul Study. Biol. Psychiatry 2007, 62, 314–320. [Google Scholar] [CrossRef]
  6. Fried, E.I.; Nesse, R.M.; Zivin, K.; Guille, C.; Sen, S. Depression is more than the sum score of its parts: Individual DSM symptoms have different risk factors. Psychol. Med. 2014, 44, 2067–2076. [Google Scholar] [CrossRef]
  7. Fried, E.I.; Nesse, R.M. Depression sum-scores don’t add up: Why analyzing specific depression symptoms is essential. BMC Med. 2015, 13, 72. [Google Scholar] [CrossRef]
  8. Hoen, P.W.; Whooley, M.A.; Martens, E.J.; Na, B.; van Melle, J.P.; de Jonge, P. Differential associations between specific depressive symptoms and cardiovascular prognosis in patients with stable coronary heart disease. J. Am. Coll. Cardiol. 2010, 56, 838–844. [Google Scholar] [CrossRef] [PubMed]
  9. Lee, C.; Whooley, M.A. Networks of C-reactive protein and depression symptoms in patients with stable coronary heart disease: Findings from the Heart and Soul Study. Int. J. Methods Psychiatr. Res. 2023, 32, e1968. [Google Scholar] [CrossRef]
  10. Borsboom, D.; Cramer, A.O. Network analysis: An integrative approach to the structure of psychopathology. Annu. Rev. Clin. Psychol. 2013, 9, 91–121. [Google Scholar] [CrossRef]
  11. Fried, E.I.; Von Stockert, S.; Haslbeck, J.M.B.; Lamers, F.; Schoevers, R.A.; Penninx, B.W.J.H. Using network analysis to examine links between individual depressive symptoms, inflammatory markers, and covariates. Psychol. Med. 2020, 50, 2682–2690. [Google Scholar] [CrossRef]
  12. Kappelmann, N.; Czamara, D.; Rost, N.; Moser, S.; Schmoll, V.; Trastulla, L.; Stochl, J.; Lucae, S.; Binder, E.B.; Khandaker, G.M.; et al. Polygenic risk for immuno-metabolic markers and specific depressive symptoms: A multi-sample network analysis study. Brain Behav. Immun. 2021, 95, 256–268. [Google Scholar] [CrossRef]
  13. Moriarity, D.P.; Horn, S.R.; Kautz, M.M.; Haslbeck, J.M.; Alloy, L.B. How handling extreme C-reactive protein (CRP) values and regularization influences CRP and depression criteria associations in network analyses. Brain Behav. Immun. 2021, 91, 393–403. [Google Scholar] [CrossRef] [PubMed]
  14. Lee, C.; Min, S.H. Racial differences in C-reactive protein, depression symptoms, and social relationships in older adults: A moderated network analysis. Biol. Res. Nurs. 2023, 25, 480–490. [Google Scholar] [CrossRef] [PubMed]
  15. Lee, C.; Min, S.H.; Niitsu, K. C-Reactive protein and specific depression symptoms among older adults: An exploratory investigation of multi-plane networks using cross-sectional data from NHANES (2017–2020). Biol. Res. Nurs. 2023, 25, 14–23. [Google Scholar] [CrossRef]
  16. Manfro, P.H.; Anselmi, L.; Barros, F.; Gonçalves, H.; Murray, J.; Oliveira, I.O.; Tovo-Rodrigues, L.; Wehrmeister, F.C.; Menezes, A.M.; Mondelli, V.; et al. Youth depression and inflammation: Cross-sectional network analyses of C-Reactive protein, interleukin-6 and symptoms in a population-based sample. J. Psychiatr. Res. 2022, 150, 197–201. [Google Scholar] [CrossRef]
  17. Santoso, A.M.; Jansen, F.; Peeters, C.F.; Baatenburg de Jong, R.J.; Brakenhoff, R.H.; Langendijk, J.A.; Verdonck-de Leeuw, I.M. Psychoneurological symptoms and biomarkers of stress and inflammation in newly diagnosed head and neck cancer patients: A network analysis. Curr. Oncol. 2022, 29, 7109–7121. [Google Scholar] [CrossRef]
  18. Henneghan, A.; Wright, M.L.; Bourne, G.; Sales, A.C. A cross-sectional exploration of cytokine–symptom networks in breast cancer survivors using network analysis. Can. J. Nurs. Res. 2021, 53, 303–315. [Google Scholar] [CrossRef]
  19. Mester, A.; Pop, A.; Mursa, B.E.M.; Greblă, H.; Dioşan, L.; Chira, C. Network analysis based on important node selection and community detection. Mathematics 2021, 9, 2294. [Google Scholar] [CrossRef]
  20. Smith, N.R.; Zivich, P.N.; Frerichs, L.M.; Moody, J.; Aiello, A.E. A guide for choosing community detection algorithms in social network studies: The question alignment approach. Am. J. Prev. Med. 2020, 59, 597–605. [Google Scholar] [CrossRef]
  21. Gunst, A.; Werner, M.; Waldorp, L.J.; Laan, E.; Källström, M.; Jern, P. A network analysis of female sexual function: Comparing symptom networks in women with decreased, increased, and stable sexual desire. Sci. Rep. 2018, 8, 15815. [Google Scholar] [CrossRef]
  22. Kim, W.; Li, M.; Wang, J.; Pan, Y. Biological network motif detection and evaluation. BMC Syst. Biol. 2011, 5, S5. Available online: http://0-www-biomedcentral-com.brum.beds.ac.uk/1752-0509/5/S3/S5 (accessed on 23 August 2023). [CrossRef] [PubMed]
  23. Narsis, A.; Mikko, K. Structural Analysis of Biological Networks. In Networks of Networks in Biology: Concepts, Tools and Applications; Kiani, N., Gomez-Cabrero, D., Bianconi, G., Eds.; Cambridge University Press: Cambridge, UK, 2021; pp. 35–55. [Google Scholar] [CrossRef]
  24. Kim, W.; Li, M.; Wang, J.; Pan, Y. Essential protein discovery based on network motif and gene ontology. In Proceedings of the 2011 IEEE International Conference on Bioinformatics and Biomedicine, Atlanta, GA, USA, 12–15 November 2011; pp. 470–475. [Google Scholar]
  25. Kai, S.; Lin, G.; Bo, W.B. An integrated network motif based approach to identify colorectal cancer related genes. In Proceedings of the 2015 34th Chinese Control Conference (CCC), Hangzhou, China, 28–30 July 2015; pp. 8573–8578. [Google Scholar]
  26. Jin, G.; Zhang, S.; Zhang, X.S.; Chen, L. Hubs with network motifs organize modularity dynamically in the protein-protein interaction network of yeast. PLoS ONE 2007, 2, e1207. [Google Scholar] [CrossRef] [PubMed]
  27. Duma, A.; Topirceanu, A. A network motif based approach for classifying online social networks. In Proceedings of the 2014 IEEE 9th IEEE International Symposium on Applied Computational Intelligence and Informatics (SACI), Timisoara, Romania, 15–17 May 2014; pp. 311–315. [Google Scholar]
  28. Chen, B.; Zhu, X.; Shui, H. Socio-semantic network motifs framework for discourse analysis. In Proceedings of the LAK22: 12th International Learning Analytics and Knowledge Conference, Online, 21–25 March 2022; pp. 500–506. [Google Scholar]
  29. Ruo, B.; Rumsfeld, J.S.; Hlatky, M.A.; Liu, H.; Browner, W.S.; Whooley, M.A. Depressive symptoms and health-related quality of life: The Heart and Soul Study. JAMA 2003, 290, 215–221. [Google Scholar] [CrossRef] [PubMed]
  30. Kroenke, K.; Spitzer, R.L.; Williams, J.B. The PHQ-9: Validity of a brief depression severity measure. J. Gen. Intern. Med. 2001, 16, 606–613. [Google Scholar] [CrossRef]
  31. Kendler, K.S.; Aggen, S.H.; Neale, M.C. Evidence for multiple genetic factors underlying DSM-IV criteria for major depression. JAMA Psychiatry 2013, 70, 599–607. [Google Scholar] [CrossRef] [PubMed]
  32. Kim, W.; Hsu, Y.H.; Li, Z.; Mar, P.; Wang, Y. NemoSuite: Web-based Network Motif Analytic Suite. Adv. Sci. Technol. Eng. Syst. J. 2020, 5, 1545–1553. [Google Scholar] [CrossRef]
  33. Huynh, T.; Mbadiwe, S.; Kim, W. Nemomap: Improved motif-centric network motif discovery algorithm. Adv. Sci. Technol. Eng. Syst. 2018, 3, 186–199. [Google Scholar] [CrossRef]
  34. Kim, W.; Haukap, L. Nemoprofile: Effective representation for network motif and their instances. In Proceedings of the 12th International Symposium on Bioinformatics Research and Applications (ISBRA), Minsk, Belarus, 5–8 June 2016; pp. 5–8. [Google Scholar]
  35. Najjar, S.; Pearlman, D.M.; Devinsky, O.; Najjar, A.; Zagzag, D. Neurovascular unit dysfunction with blood-brain barrier hyperpermeability contributes to major depressive disorder: A review of clinical and experimental evidence. J. Neuroinflamm. 2013, 10, 142. [Google Scholar] [CrossRef]
  36. Suarez, E.C.; Krishnan, R.R.; Lewis, J.G. The relation of severity of depressive symptoms to monocyte-associated proinflammatory cytokines and chemokines in apparently healthy men. Psychosom. Med. 2003, 65, 362–368. [Google Scholar] [CrossRef]
  37. Laake, J.P.S.; Stahl, D.; Amiel, S.A.; Petrak, F.; Sherwood, R.A.; Pickup, J.C.; Ismail, K. The association between depressive symptoms and systemic inflammation in people with type 2 diabetes: Findings from the South London Diabetes Study. Diabetes Care 2014, 37, 2186–2192. [Google Scholar] [CrossRef] [PubMed]
  38. Eyre, H.A.; Air, T.; Pradhan, A.; Johnston, J.; Lavretsky, H.; Stuart, M.J.; Baune, B.T. A meta-analysis of chemokines in major depression. Prog. Neuropsychopharmacol. Biol. Psychiatry 2016, 68, 1–8. [Google Scholar] [CrossRef] [PubMed]
  39. Proma, M.A.; Daria, S.; Nahar, Z.; Ashraful Islam, S.M.; Bhuiyan, M.A.; Islam, M.R. Monocyte chemoattractant protein-1 levels are associated with major depressive disorder. J. Basic Clin. Physiol. Pharmacol. 2022, 33, 735–741. [Google Scholar] [CrossRef] [PubMed]
  40. Xiong, G.L.; Prybol, K.; Boyle, S.H.; Hall, R.; Streilein, R.D.; Steffens, D.C.; SADHART-CHF Investigators. Inflammation markers and major depressive disorder in patients with chronic heart failure: Results from the sertraline against depression and heart disease in chronic heart failure study. Psychosom. Med. 2015, 77, 808–815. [Google Scholar] [CrossRef] [PubMed]
  41. Miller, A.; Haroon, E.; Felger, J. Inflammation Effects on Motivation and Motor Activity: Dopamine as Mediator and Treatment Target. Biol. Psychiatry 2018, 83, S62–S63. [Google Scholar] [CrossRef]
  42. Goldsmith, D.R.; Haroon, E.; Woolwine, B.J.; Jung, M.Y.; Wommack, E.C.; Harvey, P.D.; Miller, A.H. Inflammatory markers are associated with decreased psychomotor speed in patients with major depressive disorder. Brain Behav. Immun. 2016, 56, 281–288. [Google Scholar] [CrossRef] [PubMed]
  43. Goldsmith, D.R.; Massa, N.; Pearce, B.D.; Wommack, E.C.; Alrohaibani, A.; Goel, N.; Duncan, E. Inflammatory markers are associated with psychomotor slowing in patients with schizophrenia compared to healthy controls. NPJ Schizophr. 2020, 6, 8. [Google Scholar] [CrossRef] [PubMed]
  44. Kazmi, N.; Wallen, G.R.; Yang, L.; Alkhatib, J.; Schwandt, M.L.; Feng, D.; Barb, J.J. An exploratory study of pro-inflammatory cytokines in individuals with alcohol use disorder: MCP-1 and IL-8 associated with alcohol consumption, sleep quality, anxiety, depression, and liver biomarkers. Front. Psychiatry 2022, 13, 931280. [Google Scholar] [CrossRef]
  45. Imani, M.M.; Sadeghi, M.; Mohammadi, M.; Brühl, A.B.; Sadeghi-Bahmani, D.; Brand, S. Association of blood MCP-1 levels with risk of obstructive sleep apnea: A systematic review and meta-analysis. Medicina 2022, 58, 1266. [Google Scholar] [CrossRef]
  46. Martínez-Cengotitabengoa, M.; Mac-Dowell, K.S.; Leza, J.C.; Micó, J.A.; Fernandez, M.; Echevarría, E.; González-Pinto, A. Cognitive impairment is related to oxidative stress and chemokine levels in first psychotic episodes. Schizophr. Res. 2012, 137, 66–72. [Google Scholar] [CrossRef]
  47. Yuan, L.; Liu, A.; Qiao, L.; Sheng, B.; Xu, M.; Li, W.; Chen, D. The relationship of CSF and plasma cytokine levels in HIV infected patients with neurocognitive impairment. BioMed Res. Int. 2015, 2015, 506872. [Google Scholar] [CrossRef]
  48. Galimberti, D.; Fenoglio, C.; Lovati, C.; Venturelli, E.; Guidi, I.; Corrà, B.; Scarpini, E. Serum MCP-1 levels are increased in mild cognitive impairment and mild Alzheimer’s disease. Neurobiol. Aging 2006, 27, 1763–1768. [Google Scholar] [CrossRef]
  49. Westin, K.; Buchhave, P.; Nielsen, H.; Minthon, L.; Janciauskiene, S.; Hansson, O. CCL2 is associated with a faster rate of cognitive decline during early stages of Alzheimer’s disease. PLoS ONE 2012, 7, e30525. [Google Scholar] [CrossRef] [PubMed]
  50. Mack, W.J.; Ducruet, A.F.; Hickman, Z.L.; Zurica, J.; Starke, R.M.; Garrett, M.C.; Sander Connolly, E. Elevation of monocyte chemoattractant protein-1 in patients experiencing neurocognitive decline following carotid endarterectomy. Acta Neurochir. 2008, 150, 779–784. [Google Scholar] [CrossRef]
  51. Torres-Platas, S.G.; Cruceanu, C.; Chen, G.G.; Turecki, G.; Mechawar, N. Evidence for increased microglial priming and macrophage recruitment in the dorsal anterior cingulate white matter of depressed suicides. Brain Behav. Immun. 2014, 42, 50–59. [Google Scholar] [CrossRef] [PubMed]
  52. Vares, E.A.; Salum, G.A.; Spanemberg, L.; Caldieraro, M.A.; Fleck, M.P. Depression dimensions: Integrating clinical signs and symptoms from the perspectives of clinicians and patients. PLoS ONE 2015, 10, e0136037. [Google Scholar] [CrossRef]
  53. Gotlib, I.H.; Hamilton, J.P. Neuroimaging and depression: Current status and unresolved issues. Curr. Dir. Psychol. Sci. 2008, 17, 159–163. [Google Scholar] [CrossRef]
  54. Lehto, S.M.; Niskanen, L.; Herzig, K.H.; Tolmunen, T.; Huotari, A.; Viinamäki, H.; Hintikka, J. Serum chemokine levels in major depressive disorder. Psychoneuroendocrinology 2010, 35, 226–232. [Google Scholar] [CrossRef] [PubMed]
  55. Lindqvist, D.; Janelidze, S.; Erhardt, S.; Träskman-Bendz, L.; Engström, G.; Brundin, L. CSF biomarkers in suicide attempters–a principal component analysis. Acta Psychiatr. Scand. 2011, 124, 52–61. [Google Scholar] [CrossRef]
  56. Goyal, R.; Faizy, A.F.; Siddiqui, S.S.; Singhai, M. Evaluation of TNF-α and IL-6 levels in obese and non-obese diabetics: Pre-and postinsulin effects. N. Am. J. Med. Sci. 2012, 4, 180–184. [Google Scholar] [CrossRef]
  57. Maggio, M.; Guralnik, J.M.; Longo, D.L.; Ferrucci, L. Interleukin-6 in aging and chronic disease: A magnificent pathway. J. Gerontol. A Biol. Sci. Med. Sci. 2006, 61, 575–584. [Google Scholar] [CrossRef] [PubMed]
  58. Peters, M.J.; Ghouri, N.; McKeigue, P.; Forouhi, N.G.; Sattar, N. Circulating IL-6 concentrations and associated anthropometric and metabolic parameters in South Asian men and women in comparison to European whites. Cytokine 2013, 61, 29–32. [Google Scholar] [CrossRef] [PubMed]
  59. Moriarity, D.P.; Mengelkoch, S.; Slavich, G.M. Incorporating causal inference perspectives into psychoneuroimmunology: A simulation study highlighting concerns about controlling for adiposity in immunopsychiatry. Brain Behav. Immun. 2023, 113, 259–266. [Google Scholar] [CrossRef] [PubMed]
  60. Coppack, S.W. Pro-inflammatory cytokines and adipose tissue. Proc. Nutr. Soc. 2001, 60, 349–356. [Google Scholar] [CrossRef] [PubMed]
  61. Au, B.; Smith, K.J.; Gariépy, G.; Schmitz, N. Estimating the longitudinal associations between C-reactive protein and depressive symptoms: Evidence from the English Longitudinal Study of Ageing (ELSA). Int. J. Geriatr. Psychiatry 2015, 30, 976–984. [Google Scholar] [CrossRef] [PubMed]
  62. Kim, W.; Haukap, L. NemoProfile as an efficient approach to network motif analysis with instance collection. BMC Bioinform. 2017, 18, 37–45. [Google Scholar] [CrossRef] [PubMed]
  63. Wang, P.; Lü, J.; Yu, X. Identification of important nodes in directed biological networks: A network motif approach. PLoS ONE 2014, 9, e106132. [Google Scholar] [CrossRef]
  64. Wang, Y.; Kim, W. Identification of Essential Genes with NemoProfile and Various Machine Learning Models. In Bioinformatics Research and Applications: 16th International Symposium, ISBRA 2020, Moscow, Russia, 1–4 December 2020, Proceedings 16; Springer: Cham, Switzerland, 2020; pp. 319–326. [Google Scholar]
  65. Borsboom, D.; Deserno, M.K.; Rhemtulla, M.; Epskamp, S.; Fried, E.I.; McNally, R.J.; Robinaugh, D.J.; Perugini, M.; Dalege, J.; Costantini, G.; et al. Network analysis of multivariate data in psychological science. Nat. Rev. Methods Primers 2021, 1, 58. [Google Scholar] [CrossRef]
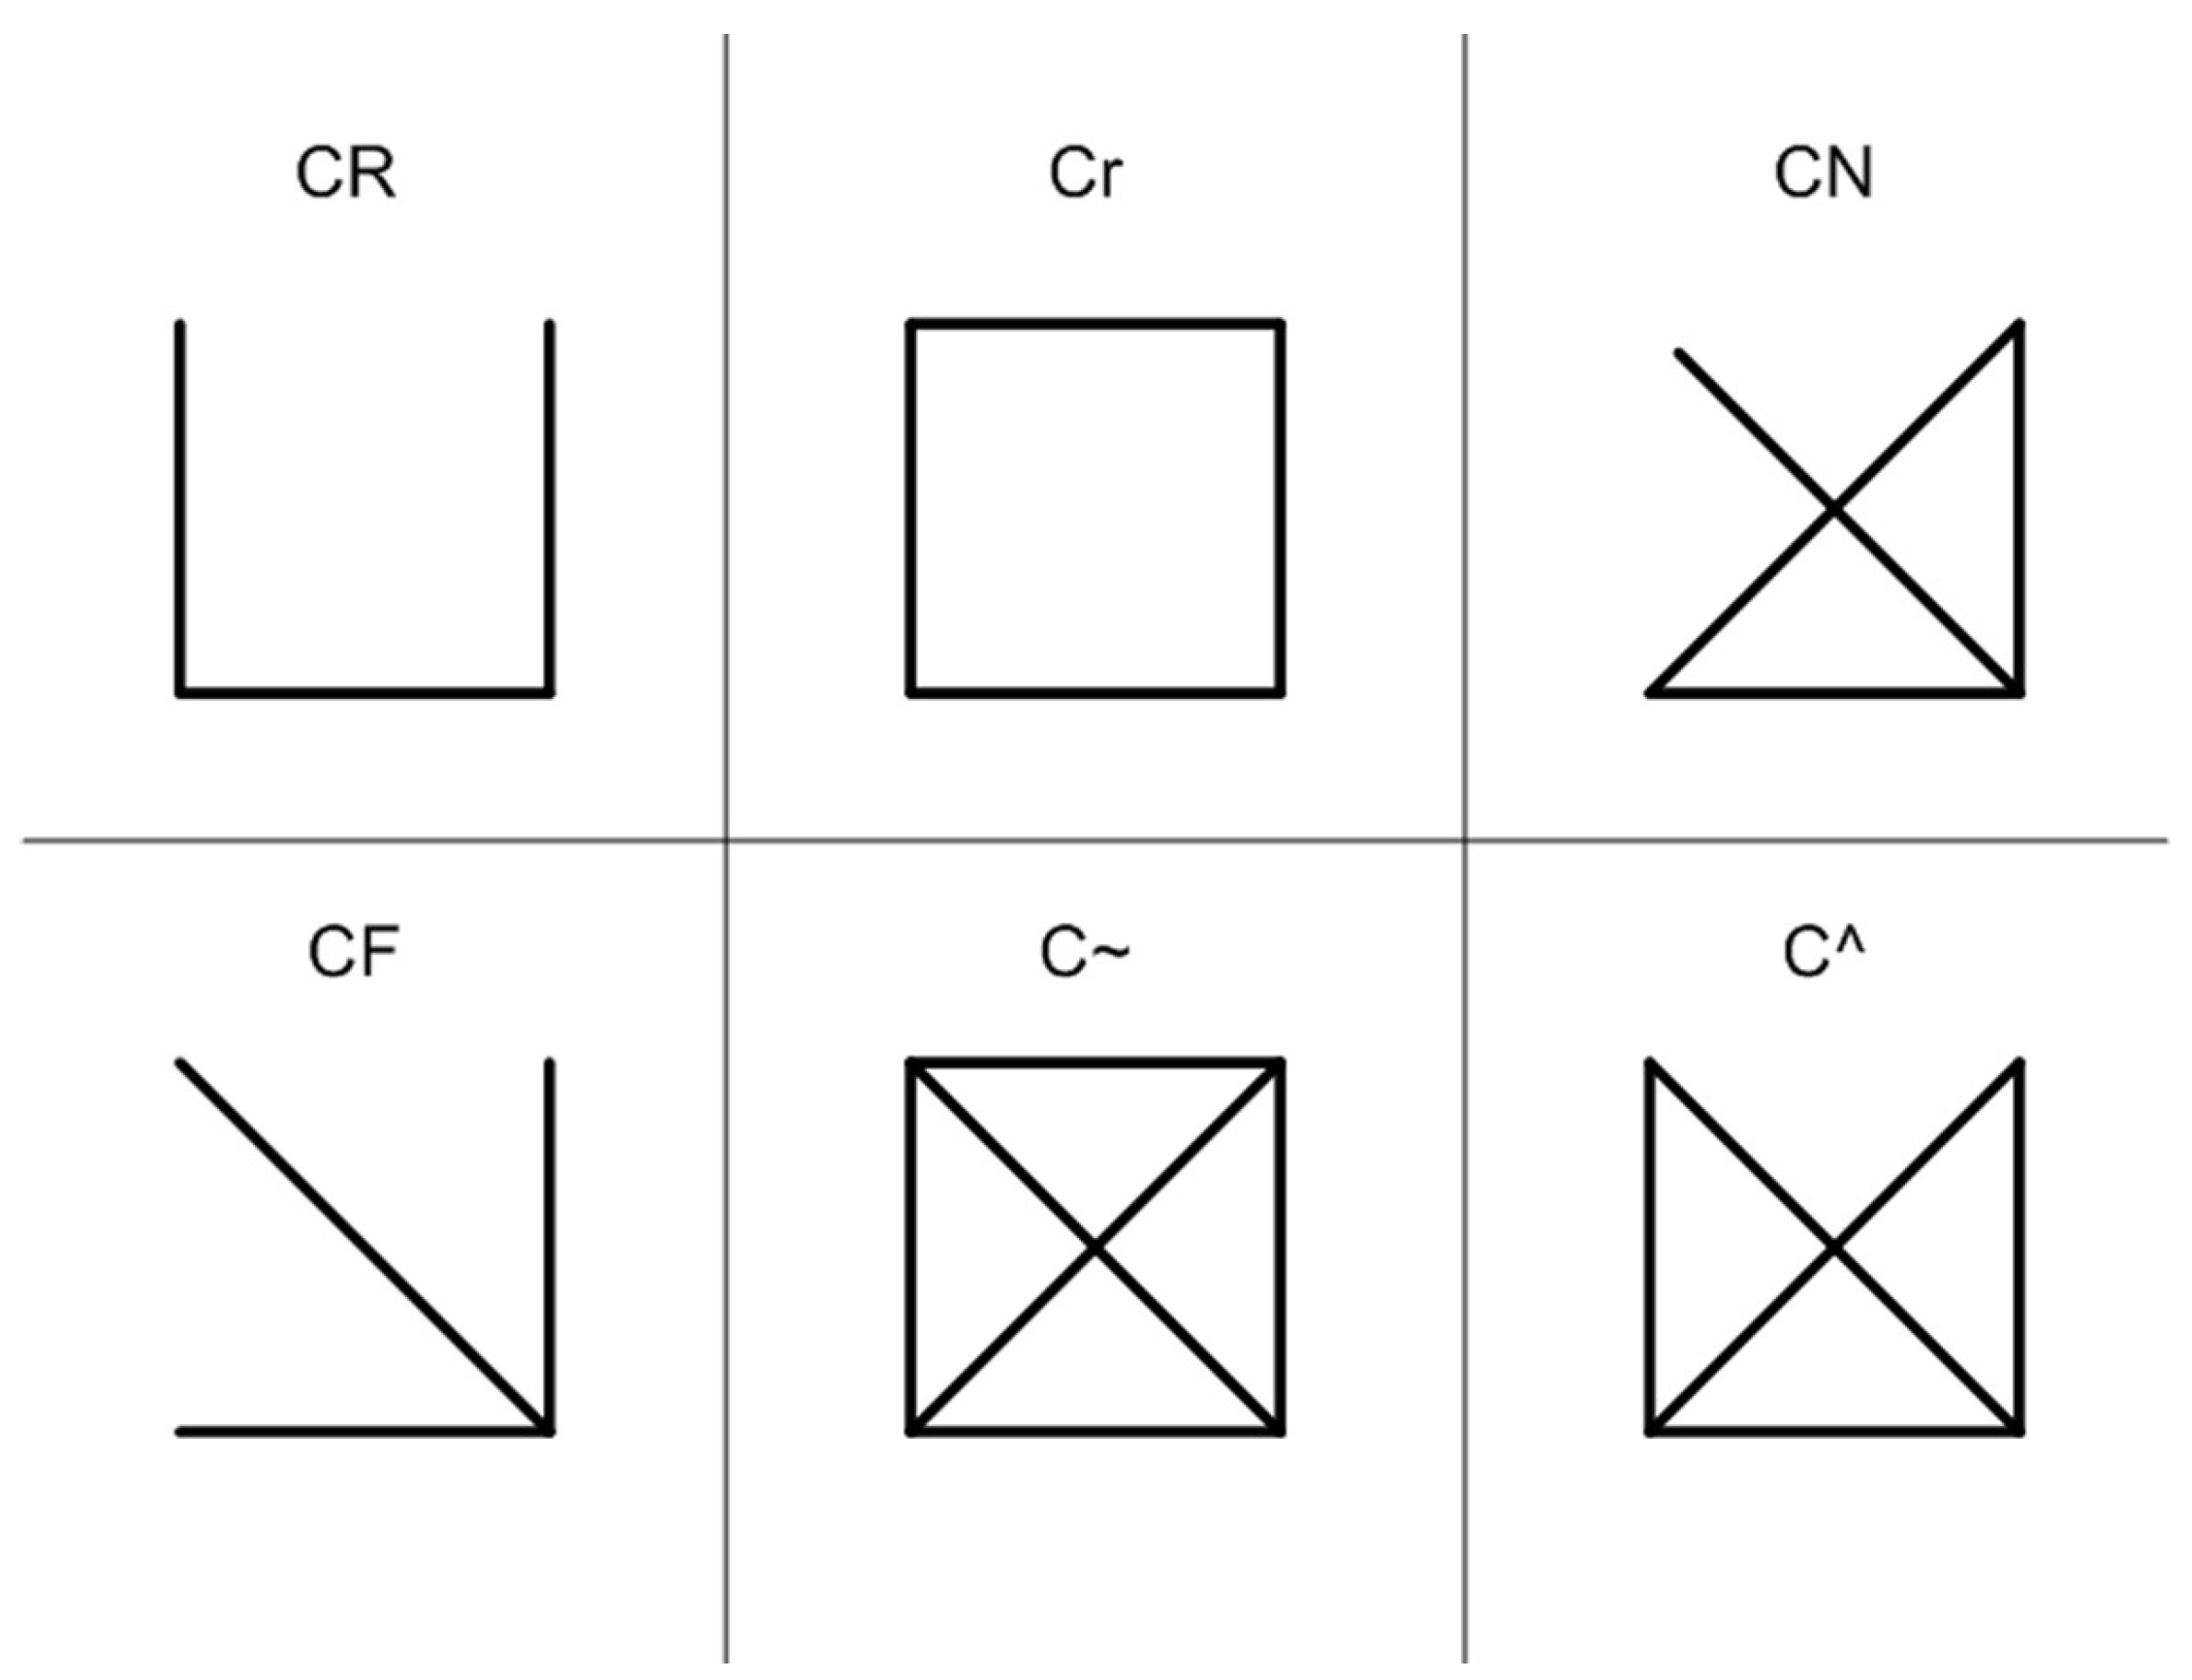
Figure 1. Shapes and labels for 4-node subgraphs in an undirected network. Note. The figure from Kim et al. [22]. There are six types for 4-node subgraph in an undirected network. CR, Cr, CN, CF, C~, and C^ are the canonical labels of each subgraph that determine whether the two graphs are isomorphic. If two graphs have the same canonical label, then they are isomorphic; otherwise, they are non-isomorphic. The canonical label is calculated by the Nauty program (https://pallini.di.uniroma1.it/).
Psycholint 06 00027 g001
Figure 2. Correlation network. Note. Lost_int, loss of interest; App, appetite changes; Conc, concentration difficulty; Suic, suicidal ideation; Fati, fatigue; Worth, feelings of worthlessness; Motor, psychomotor problems; Sad, feelings of sadness; Slp, sleep disturbance. The Inflammatory markers are color-coded in yellow. The graph was depicted as an unweighted graph; the correlation values for each can be found in the Table S1.
Psycholint 06 00027 g002
Table 1. NemoCount results.
LabelPatternFrequency [Original]Mean Frequency in the Randomized Networksz-Scorep-Value
CRPsycholint 06 00027 i00148.8%61.7%−3.541.000
Cr Psycholint 06 00027 i002 3.9% 4.1% −0.07 0.400
CNPsycholint 06 00027 i00326.1%13.9%3.870.000
CFPsycholint 06 00027 i0049.9%18.6%−2.681.000
C~Psycholint 06 00027 i0050.5%0.1%2.210.100
C^Psycholint 06 00027 i00610.8%1.8%7.330.000
Note. “CN,” “C~,” and “C^” patterns, which are labeled in bold, were determined as network motifs.
Table 2. NemoProfile results.
NodeCRCrCNCFC~C^
Psycholint 06 00027 i001Psycholint 06 00027 i002Psycholint 06 00027 i003Psycholint 06 00027 i004Psycholint 06 00027 i005Psycholint 06 00027 i006
Psychomotor problems286228111
Feelings of worthlessness374176010
Concentration difficulty252166014
Suicidal ideation25514606
Loss of interest414141008
Feelings of sadness1503300
Appetite changes344337117
Fatigue41325916
Sleep disturbance31221618
CRP302100
IL-61707101
TNF-α802201
MCP-11708402
Age 38117803
BMI32111301
Note. “CN,” “C~,” and “C^” patterns, which are labeled in bold, were determined as network motifs.
Table 3. Examples of “CN”, “C~”, and “C^” pattern inferred from the constructed correlation network.
LabelPatternExamples
CNPsycholint 06 00027 i003Psycholint 06 00027 i007Psycholint 06 00027 i008Psycholint 06 00027 i009Psycholint 06 00027 i010
Psycholint 06 00027 i011Psycholint 06 00027 i012Psycholint 06 00027 i013Psycholint 06 00027 i014
Psycholint 06 00027 i015Psycholint 06 00027 i016Psycholint 06 00027 i017Psycholint 06 00027 i018
Psycholint 06 00027 i019
C~Psycholint 06 00027 i005Psycholint 06 00027 i020
C^Psycholint 06 00027 i006Psycholint 06 00027 i021Psycholint 06 00027 i022
Note. App, appetite changes; Conc, concentration difficulty; Suic, suicidal ideation; Fati, fatigue; Worth, feelings of worthlessness; Motor, psychomotor problems; Slp, sleep disturbance. Inflammatory markers were written in bold. The NemoSuite program lacks the capability to generate graphical representations for all motifs. Consequently, each motif was manually deduced from the established correlation network illustrated in Figure 2.
Disclaimer/Publisher’s Note: The statements, opinions and data contained in all publications are solely those of the individual author(s) and contributor(s) and not of MDPI and/or the editor(s). MDPI and/or the editor(s) disclaim responsibility for any injury to people or property resulting from any ideas, methods, instructions or products referred to in the content.

