
Mining Open Government Data for Business Intelligence Using Data Visualization: A Two-Industry Case Study


Abstract
:1. Introduction
2. Business Intelligence and Open Government Data
3. Use of Topic Mining and Visualization Tools to Gather Business Intelligence
3.1. Use of Latent Dirichlet Allocation (LDA) Method for Topic Modeling
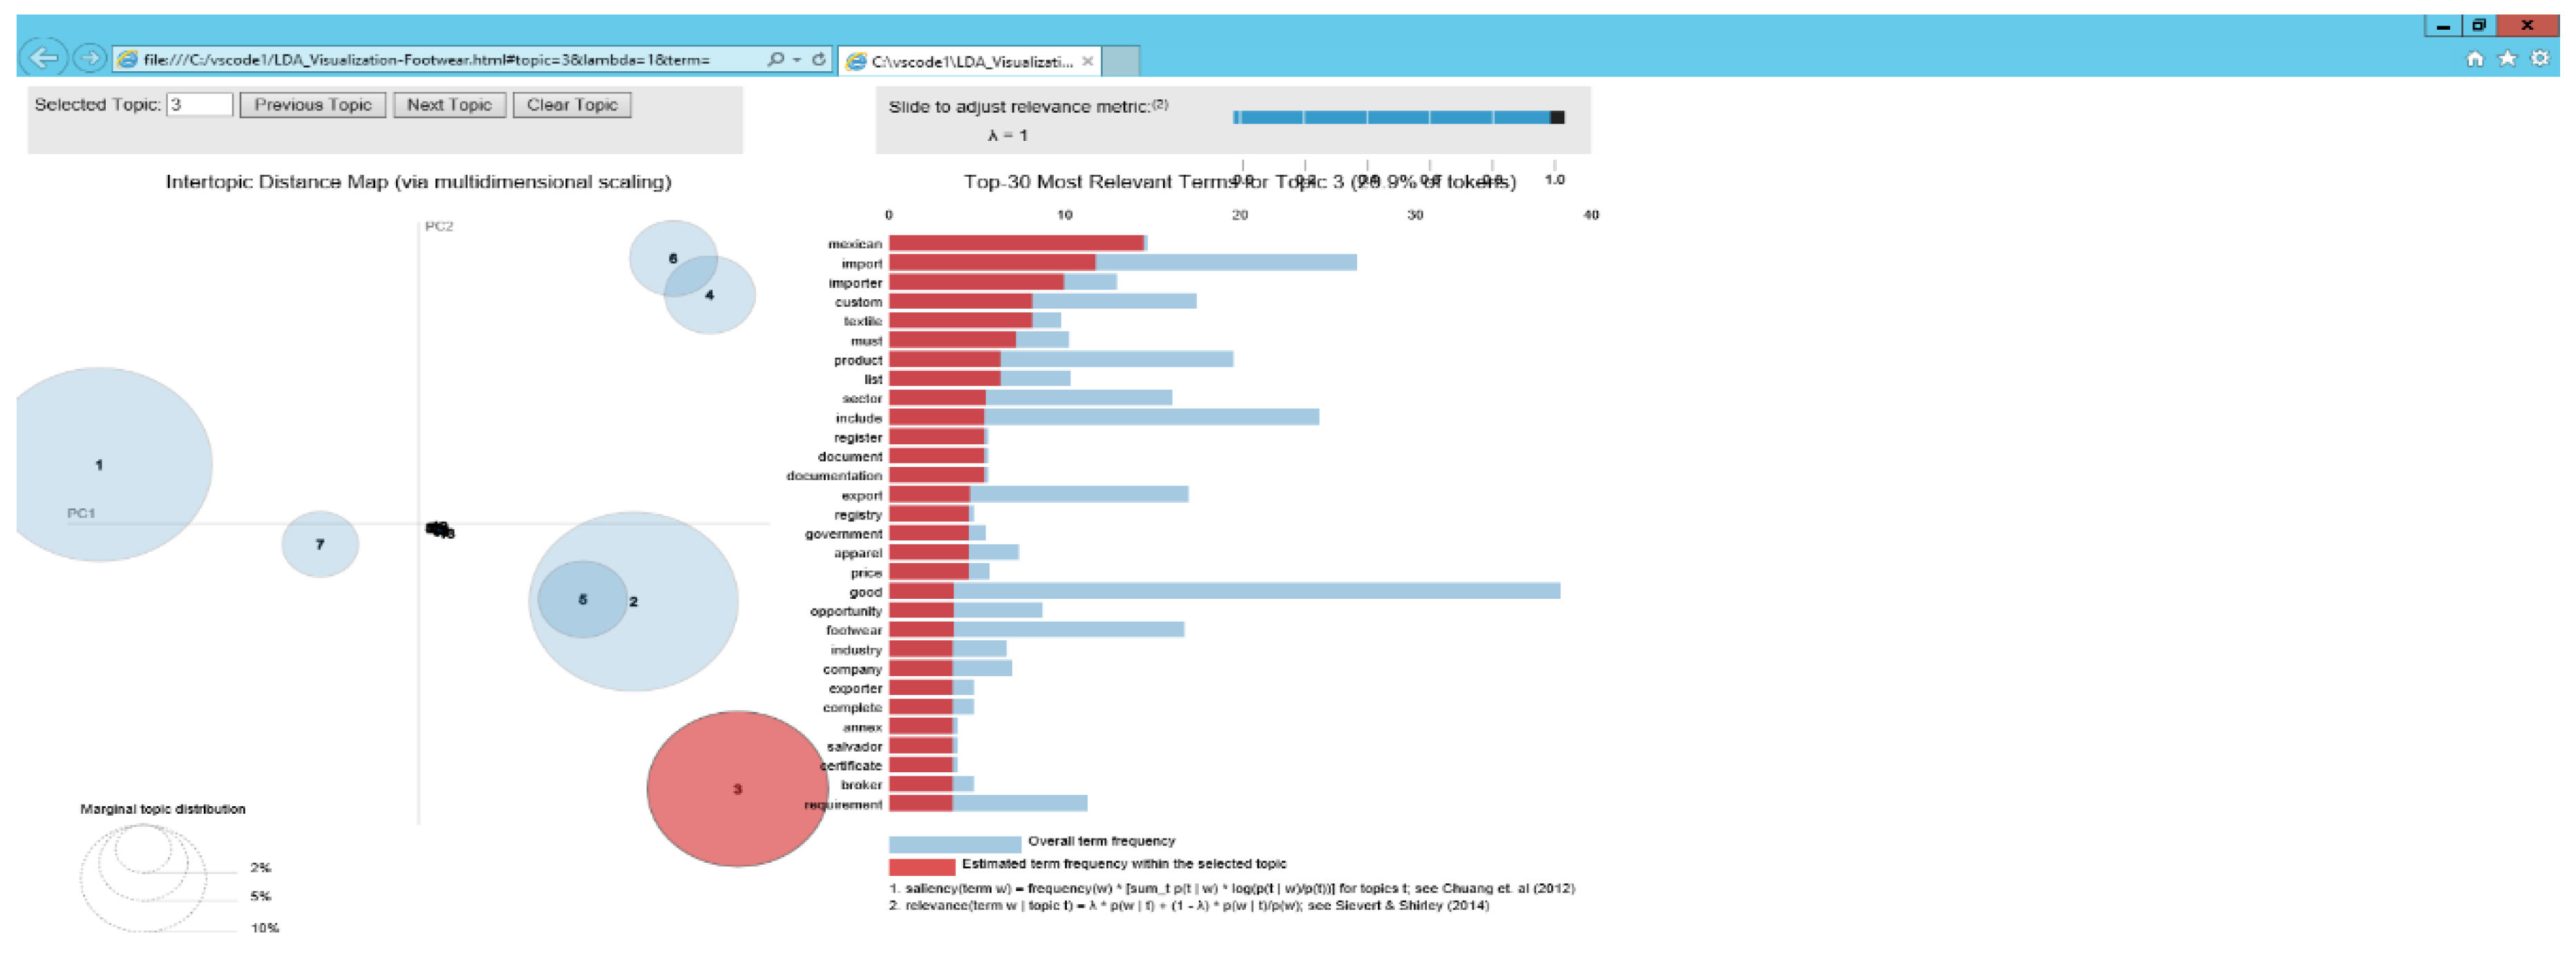
3.2. Data Visualization Using pyLDAVis
4. Research Design and Case Selection
4.1. Case Study Approach and Industry Selection
4.2. Sample
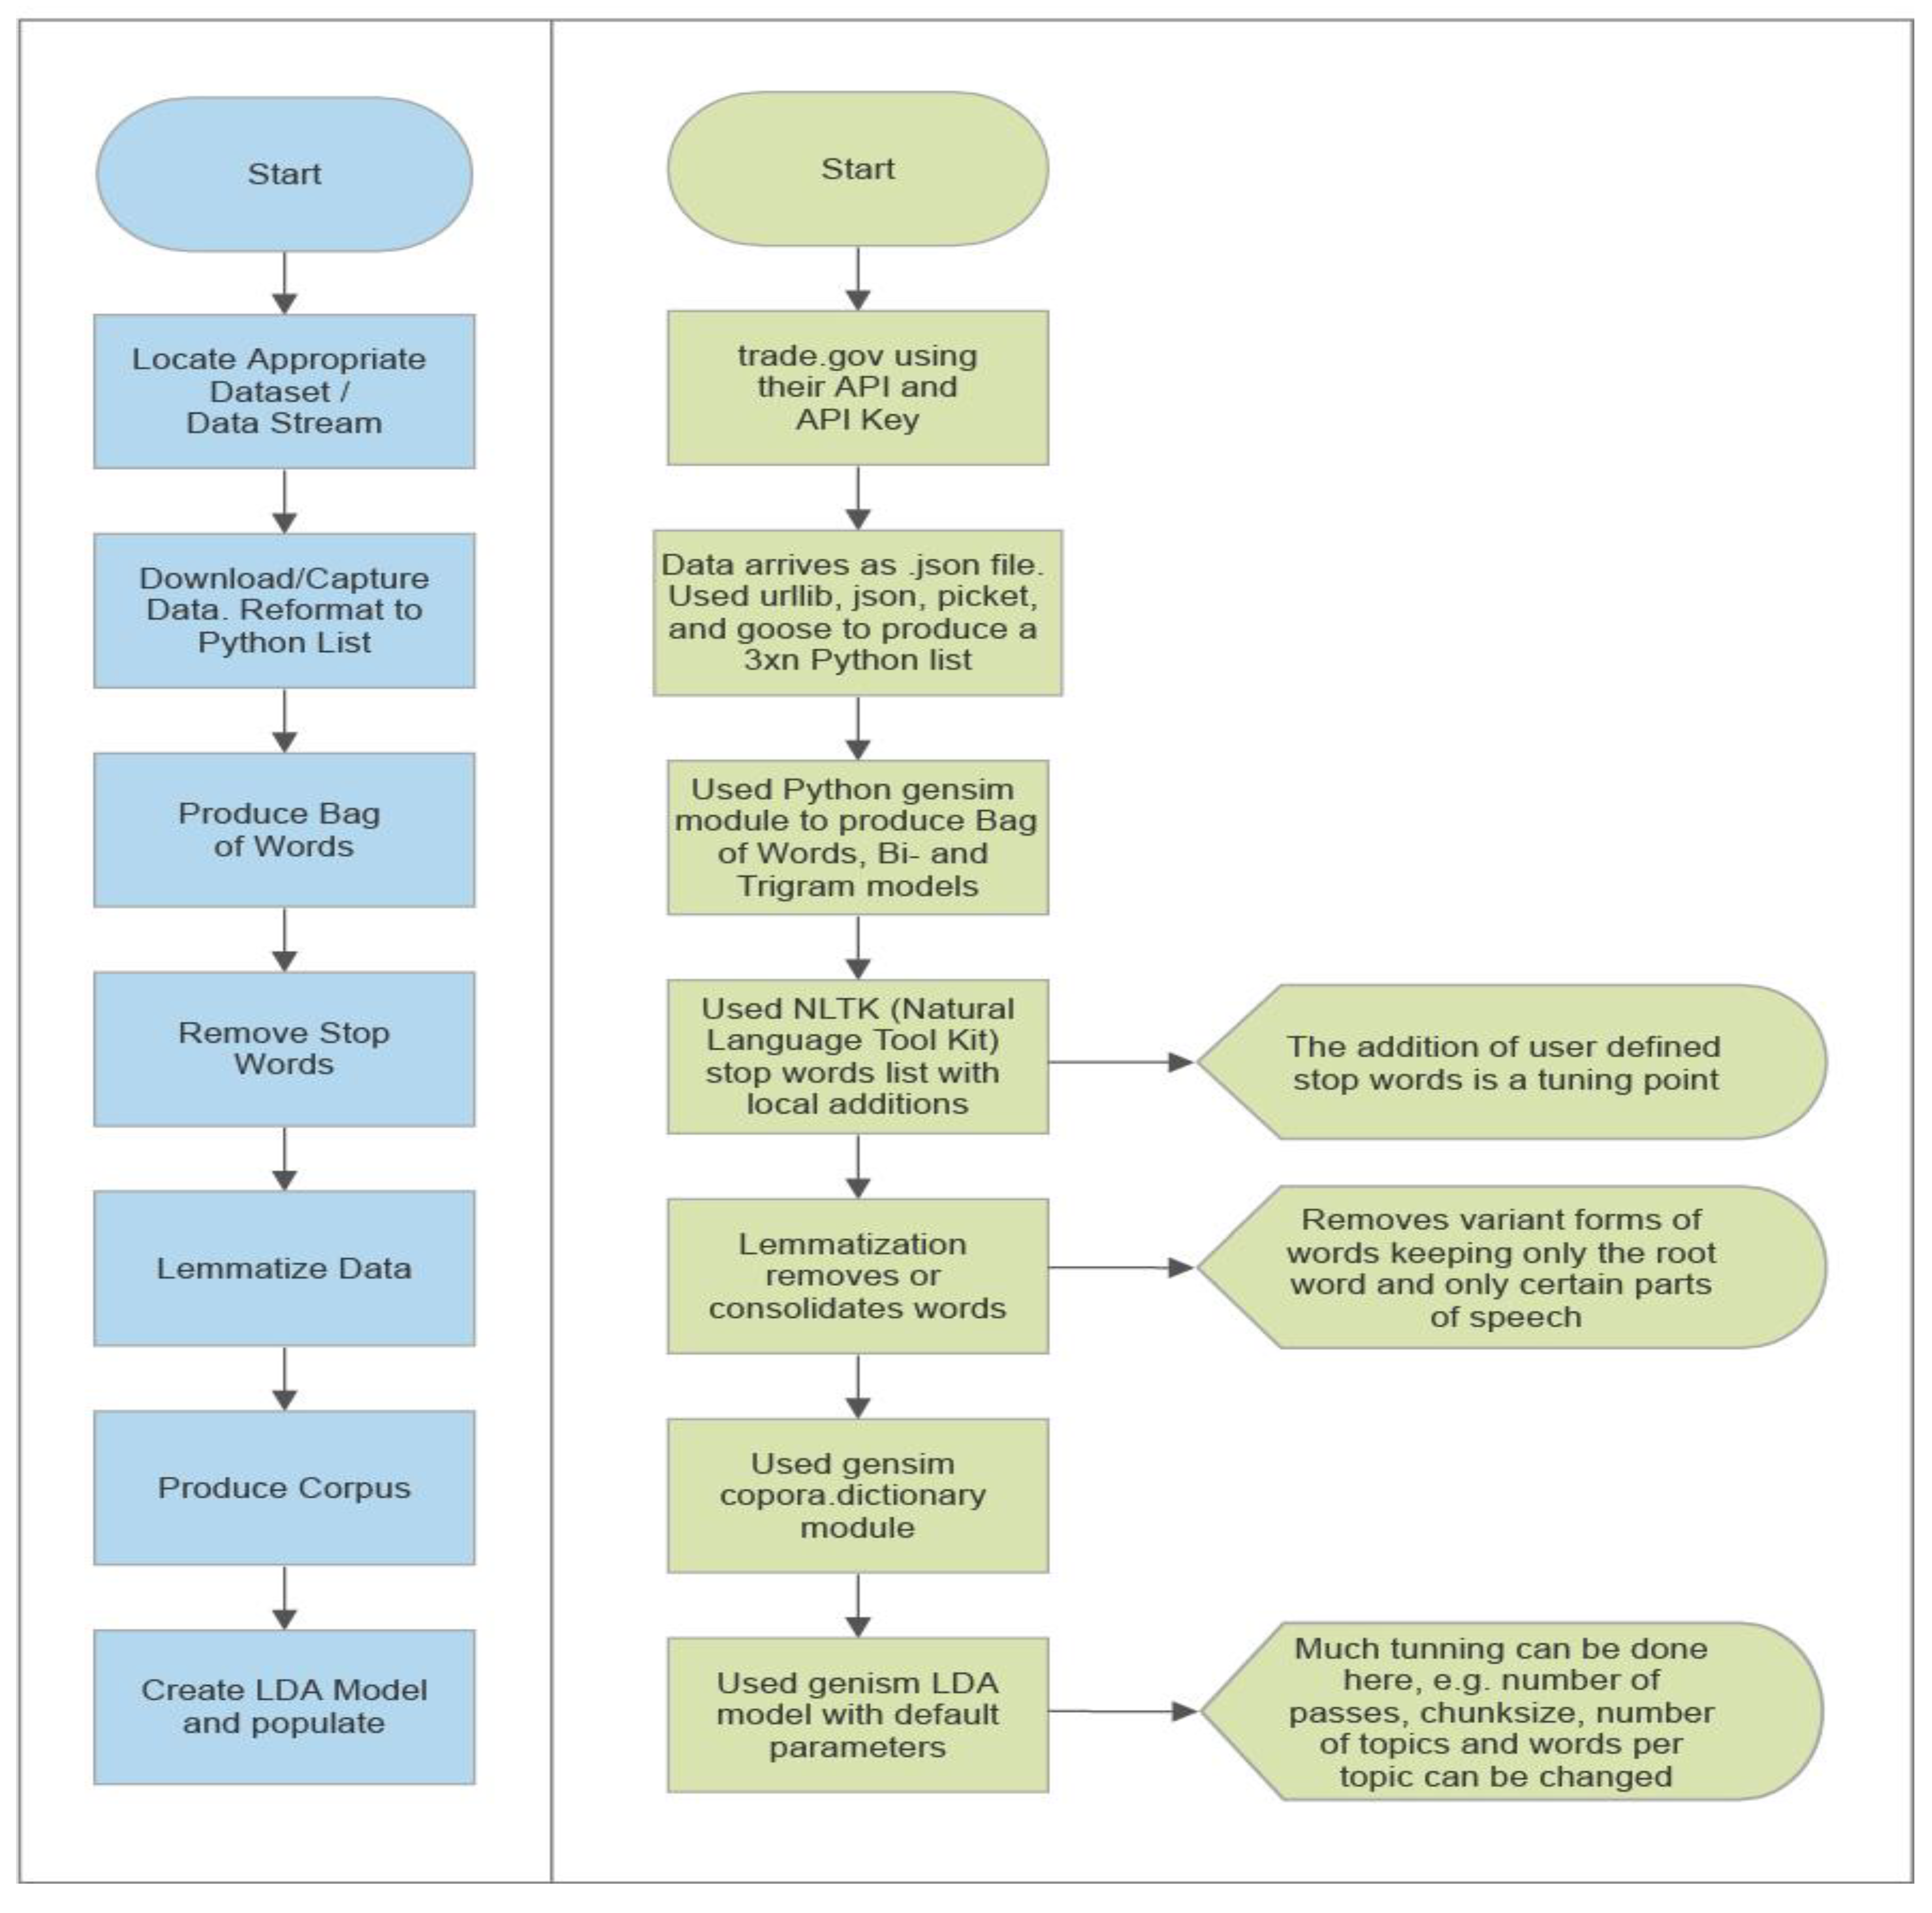
4.3. Methodology
5. Results
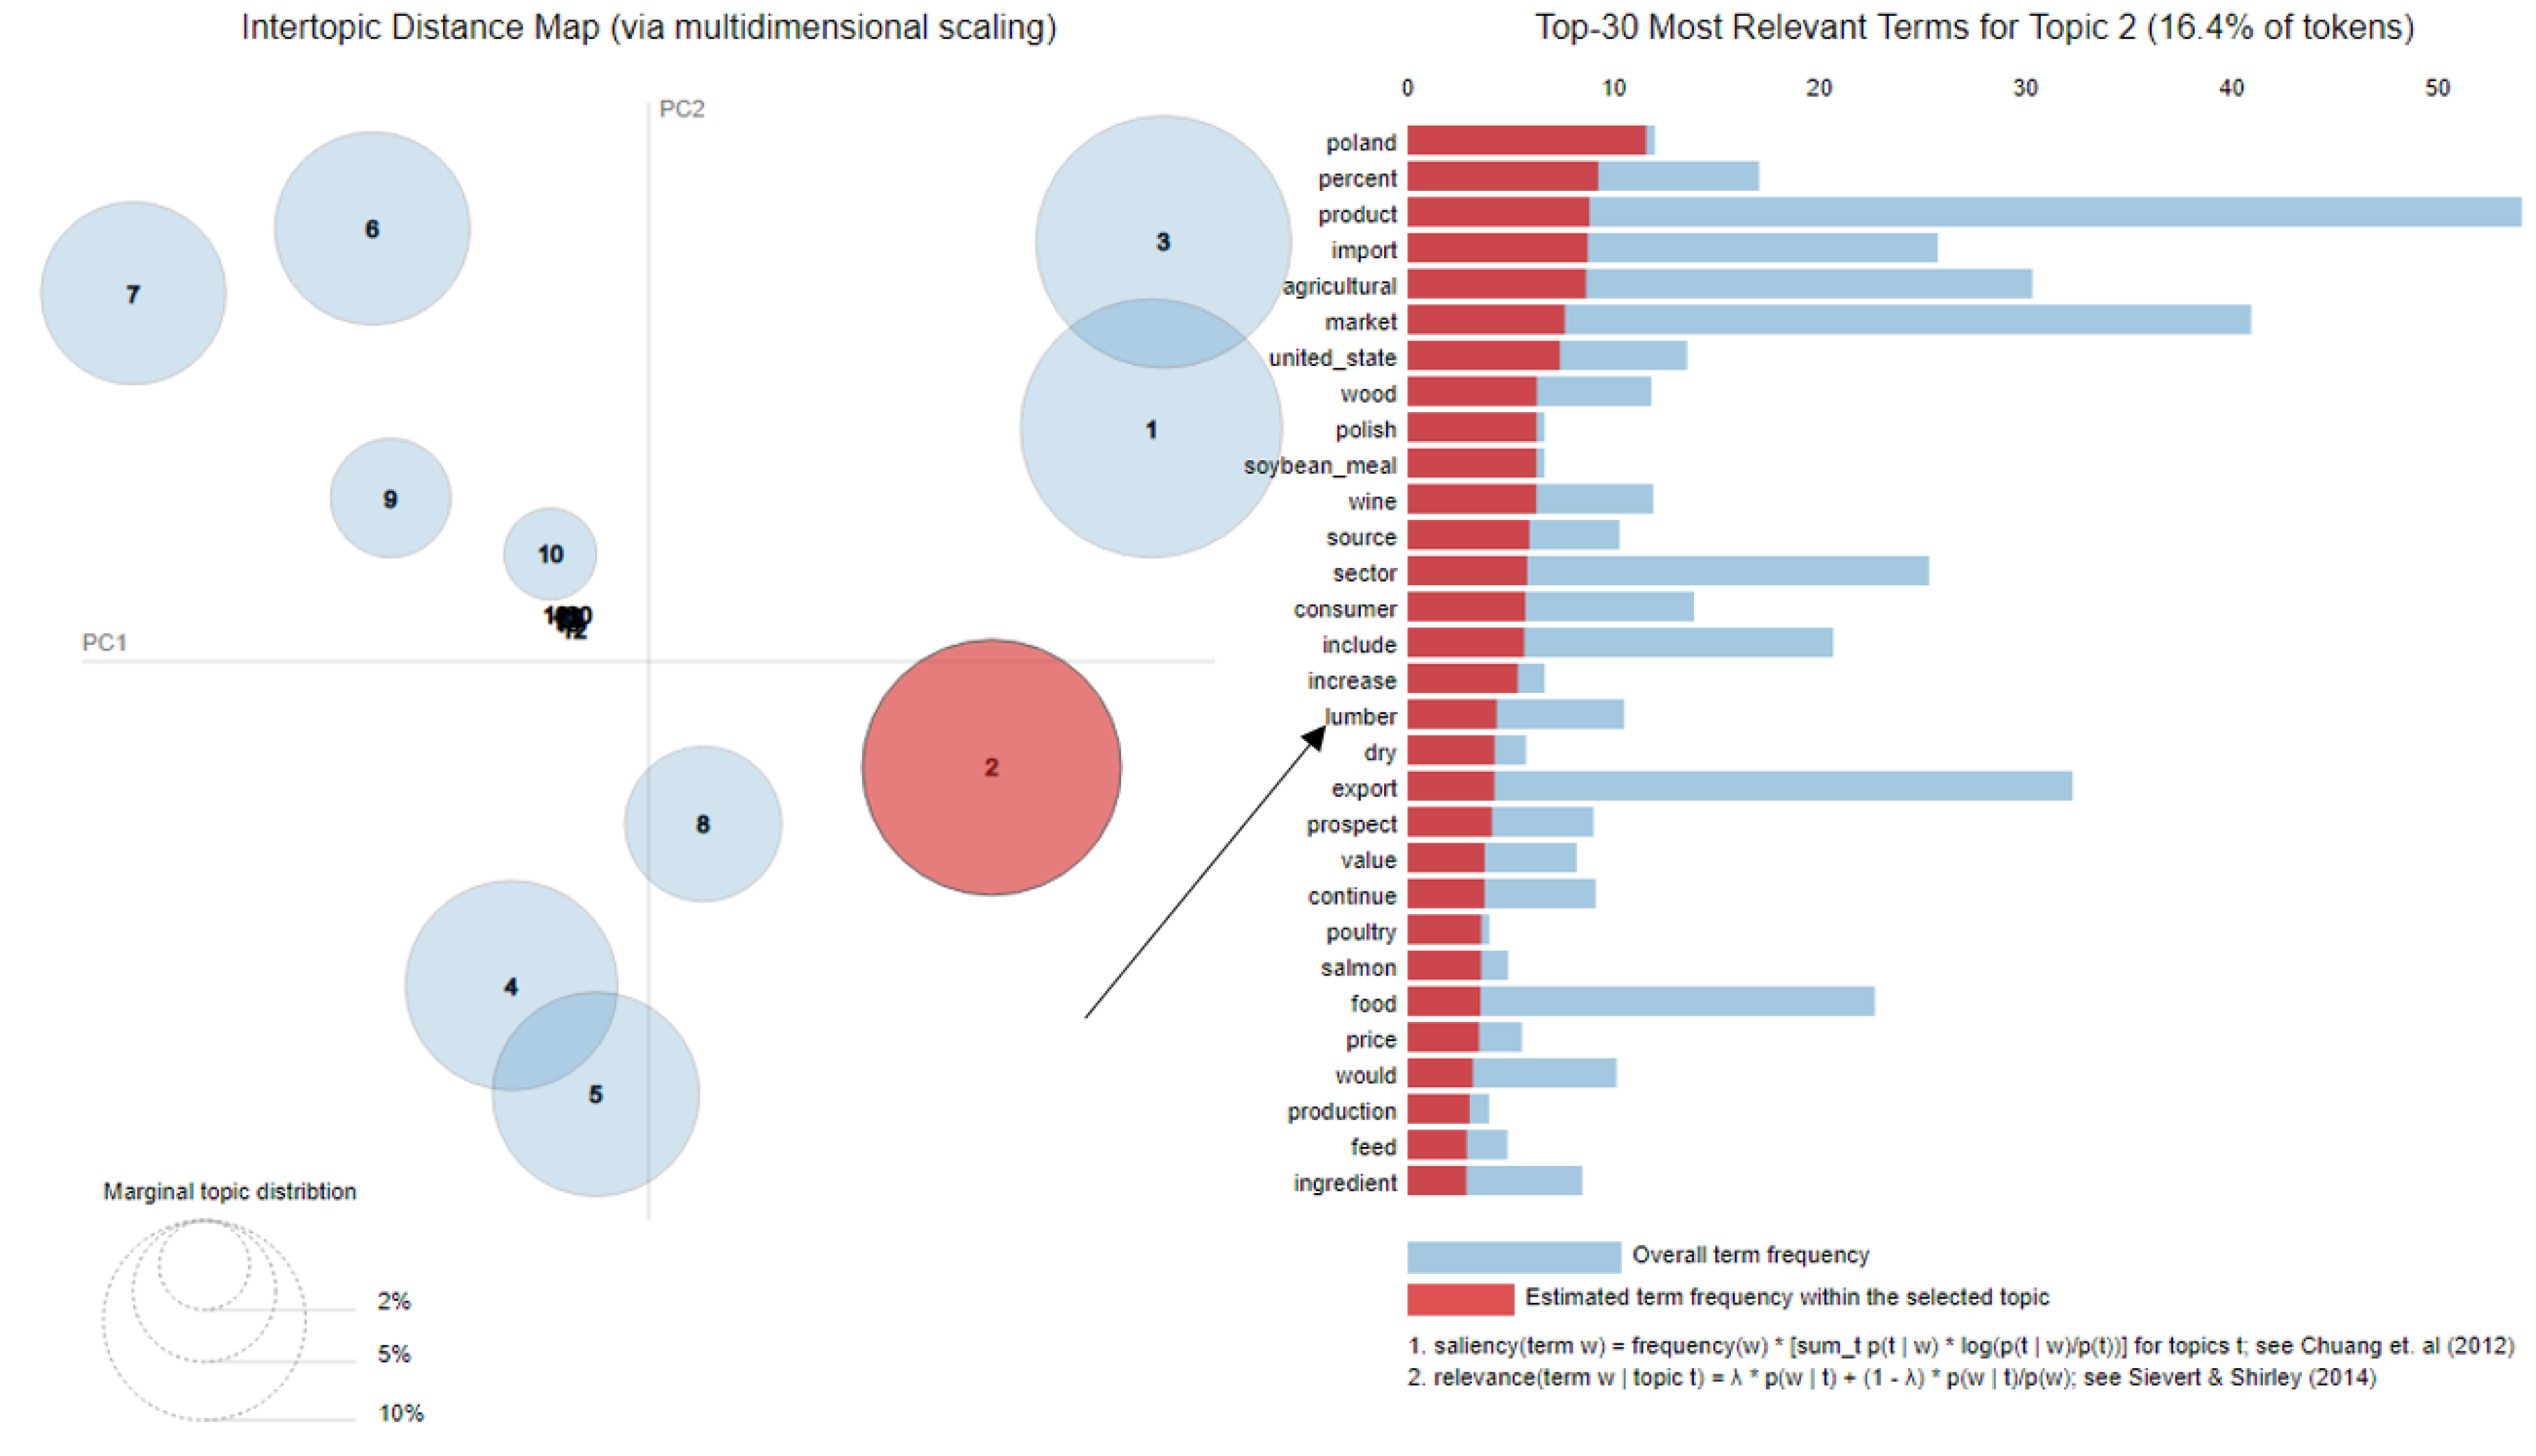
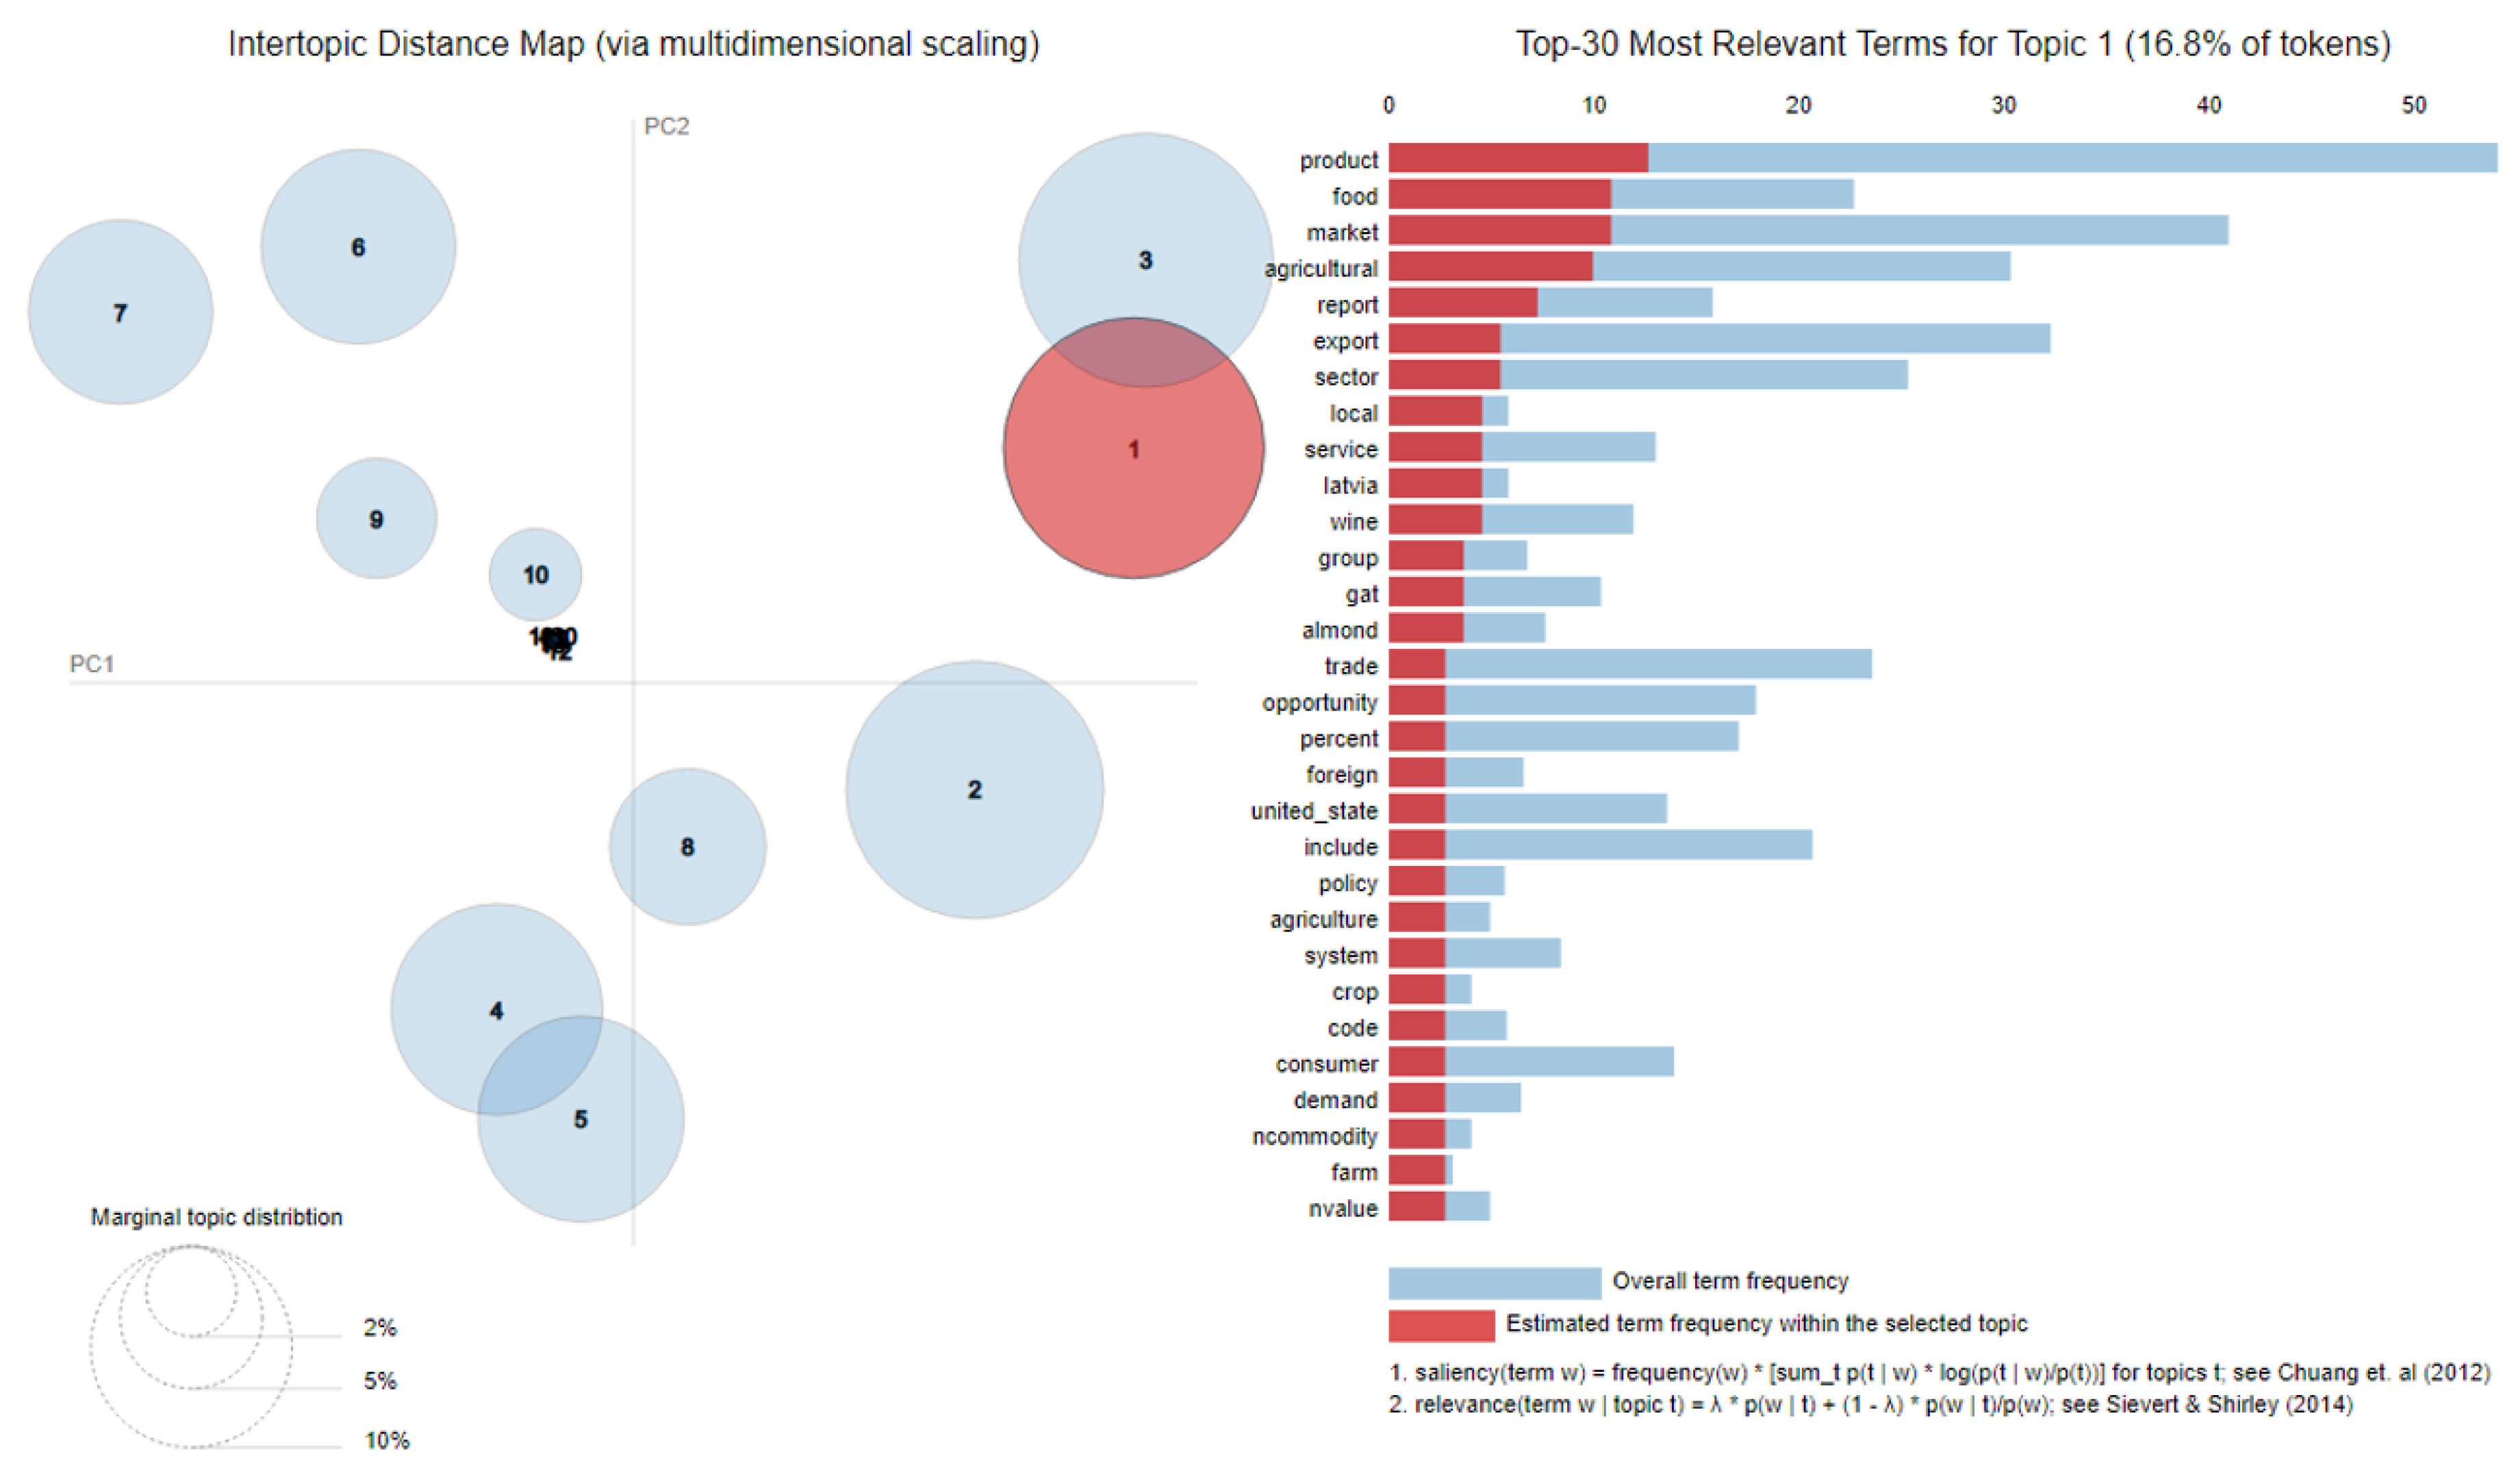
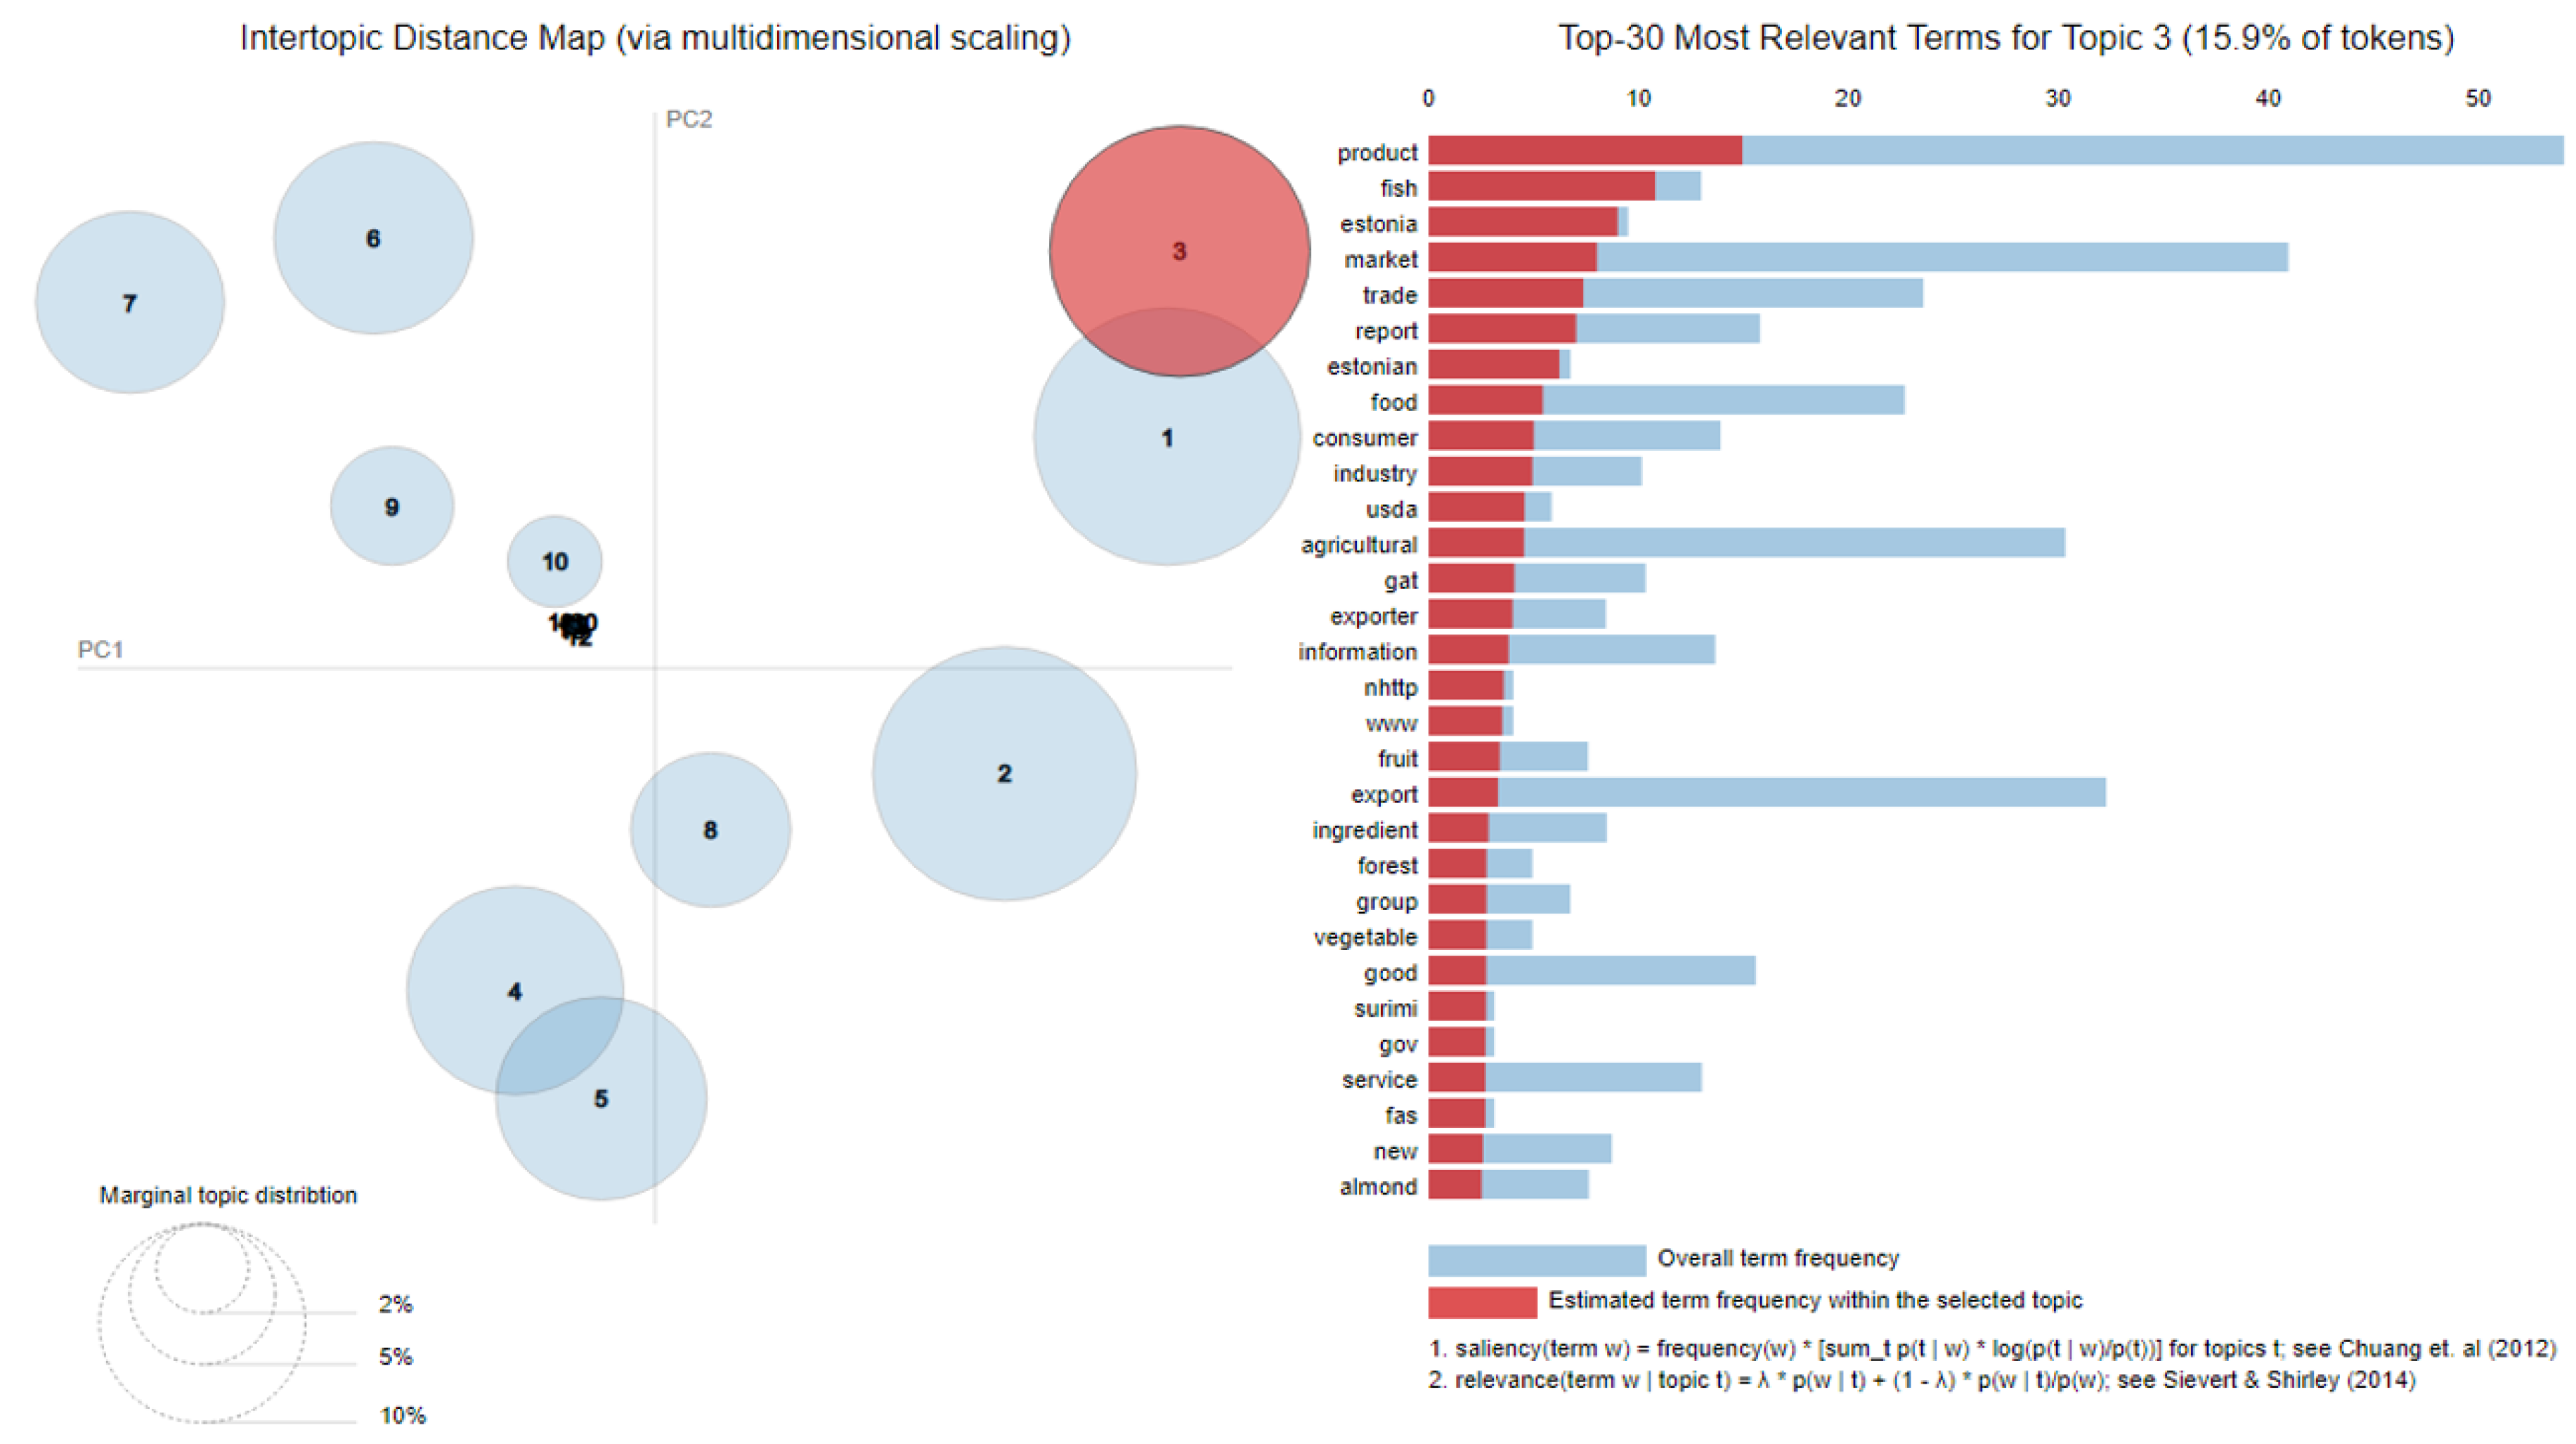
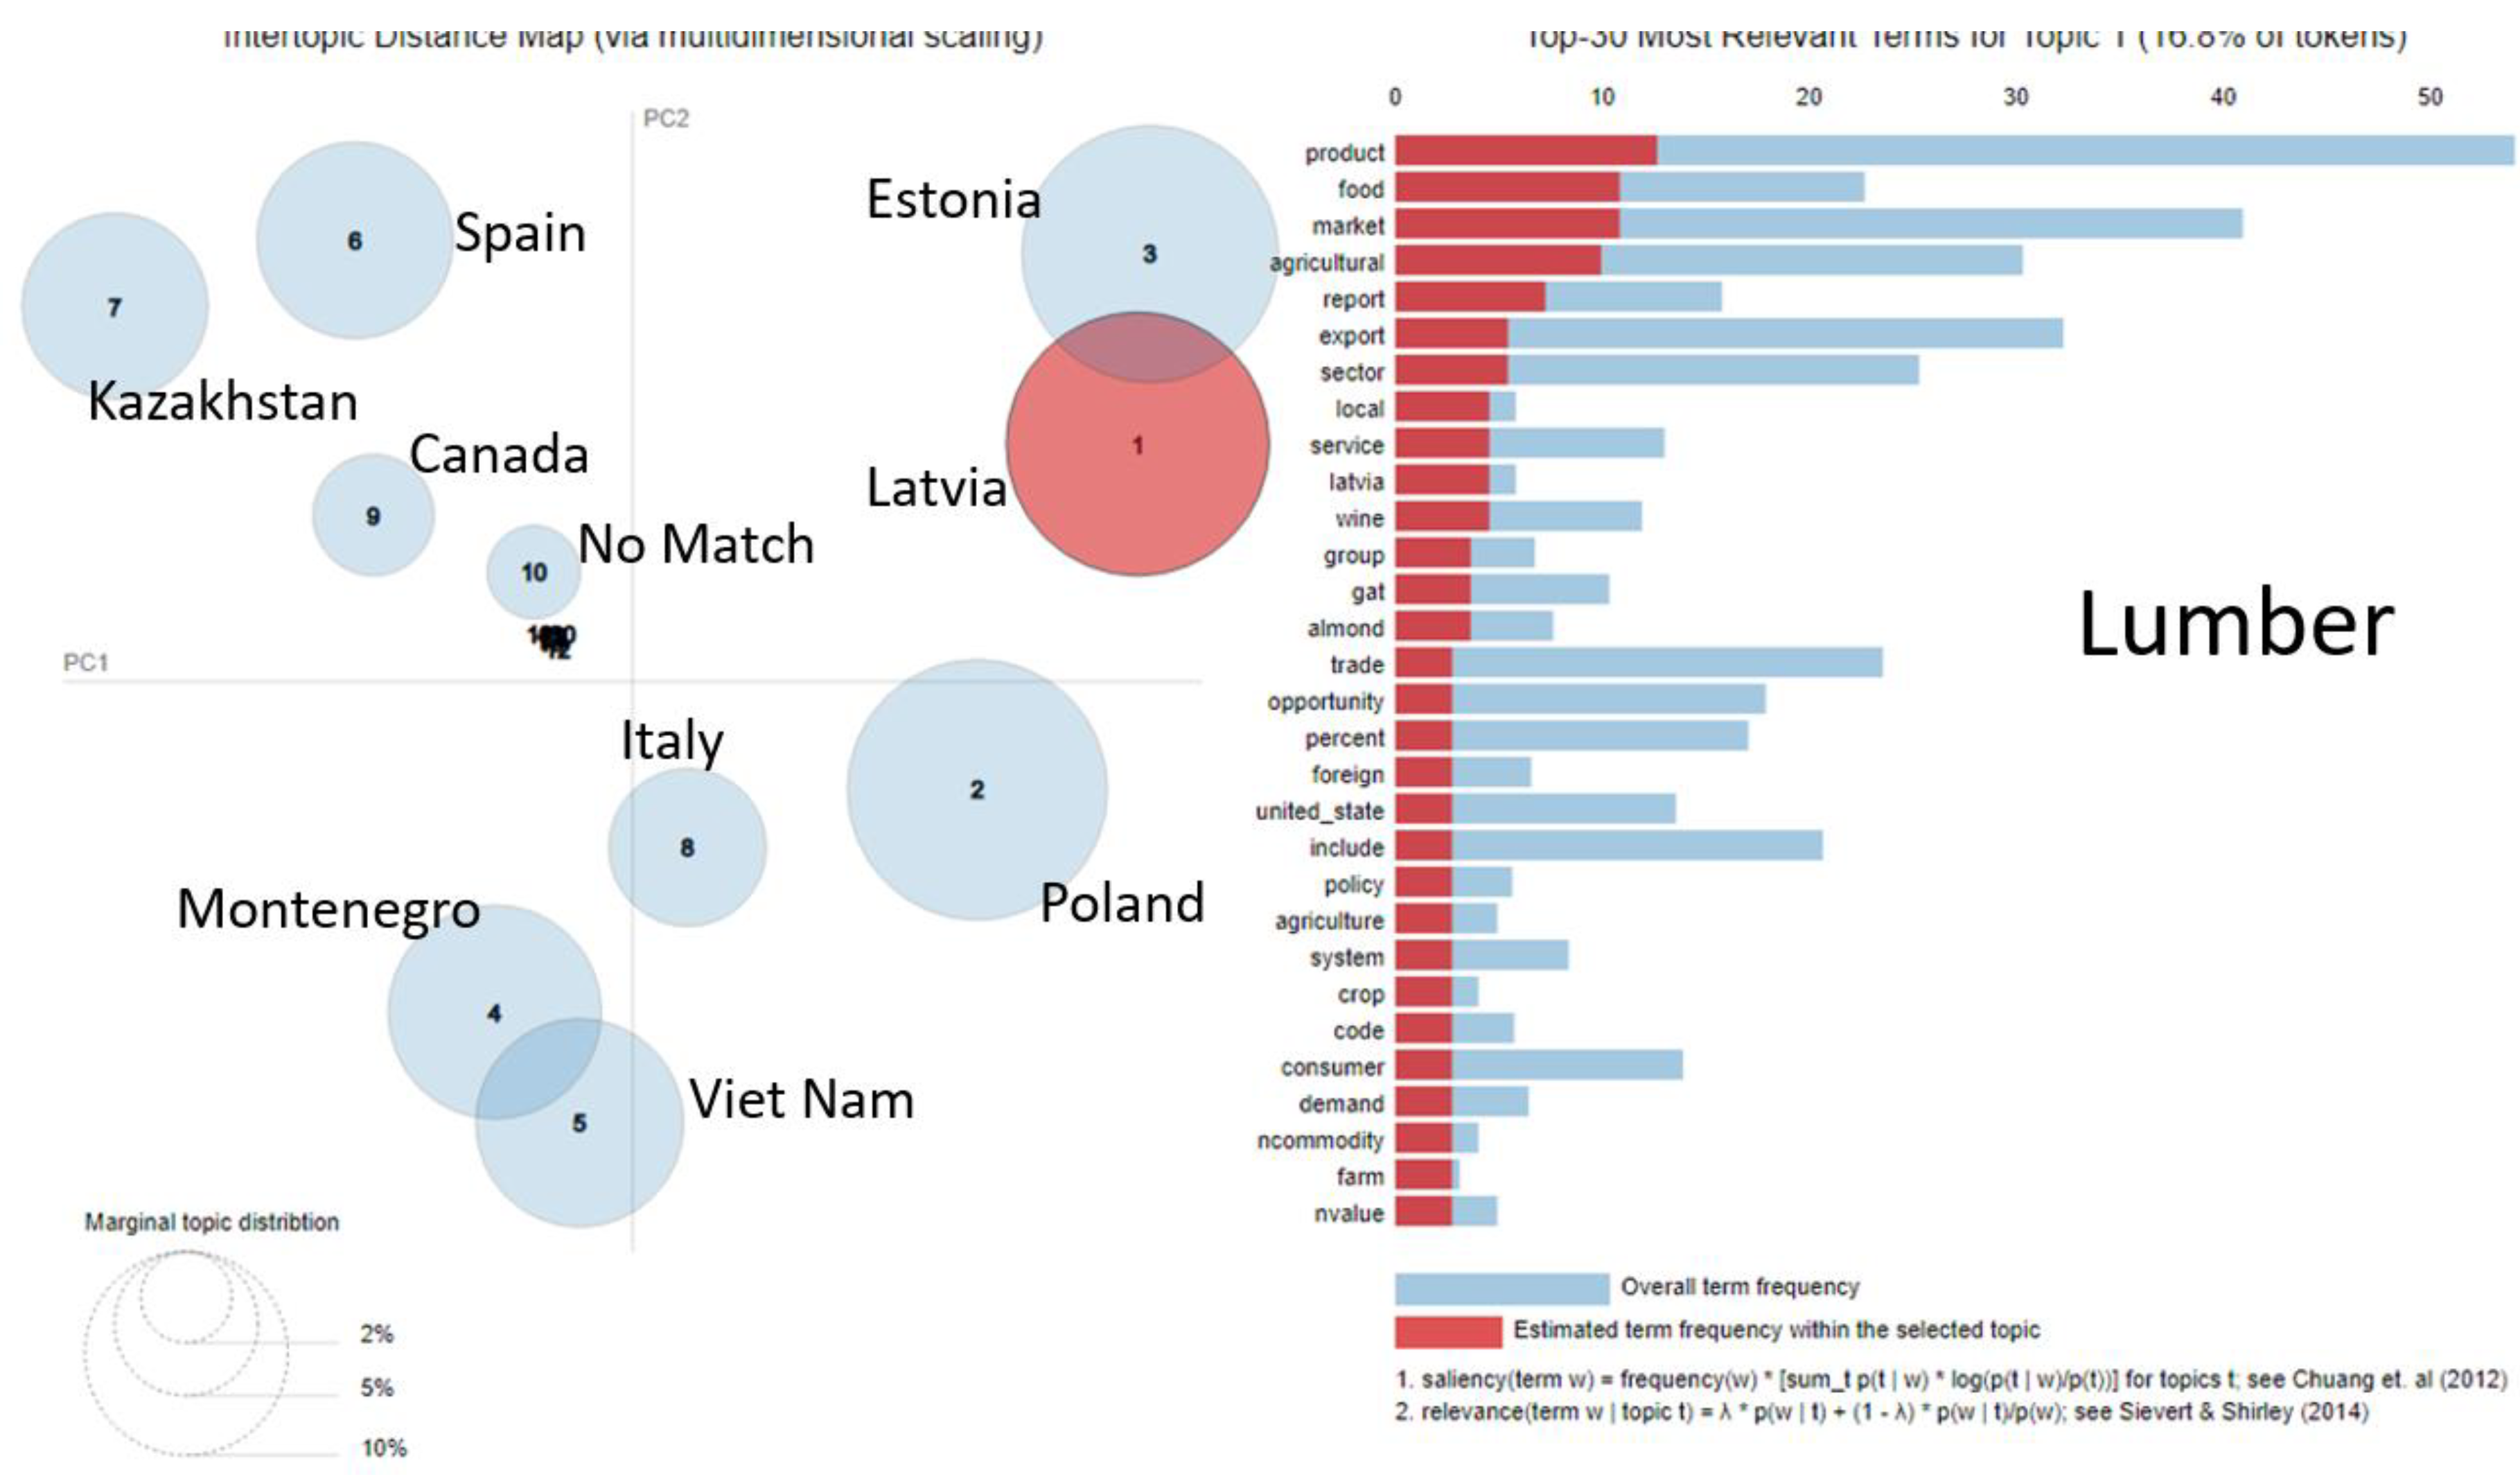
5.1. Identification of Topics in the Lumber Industry
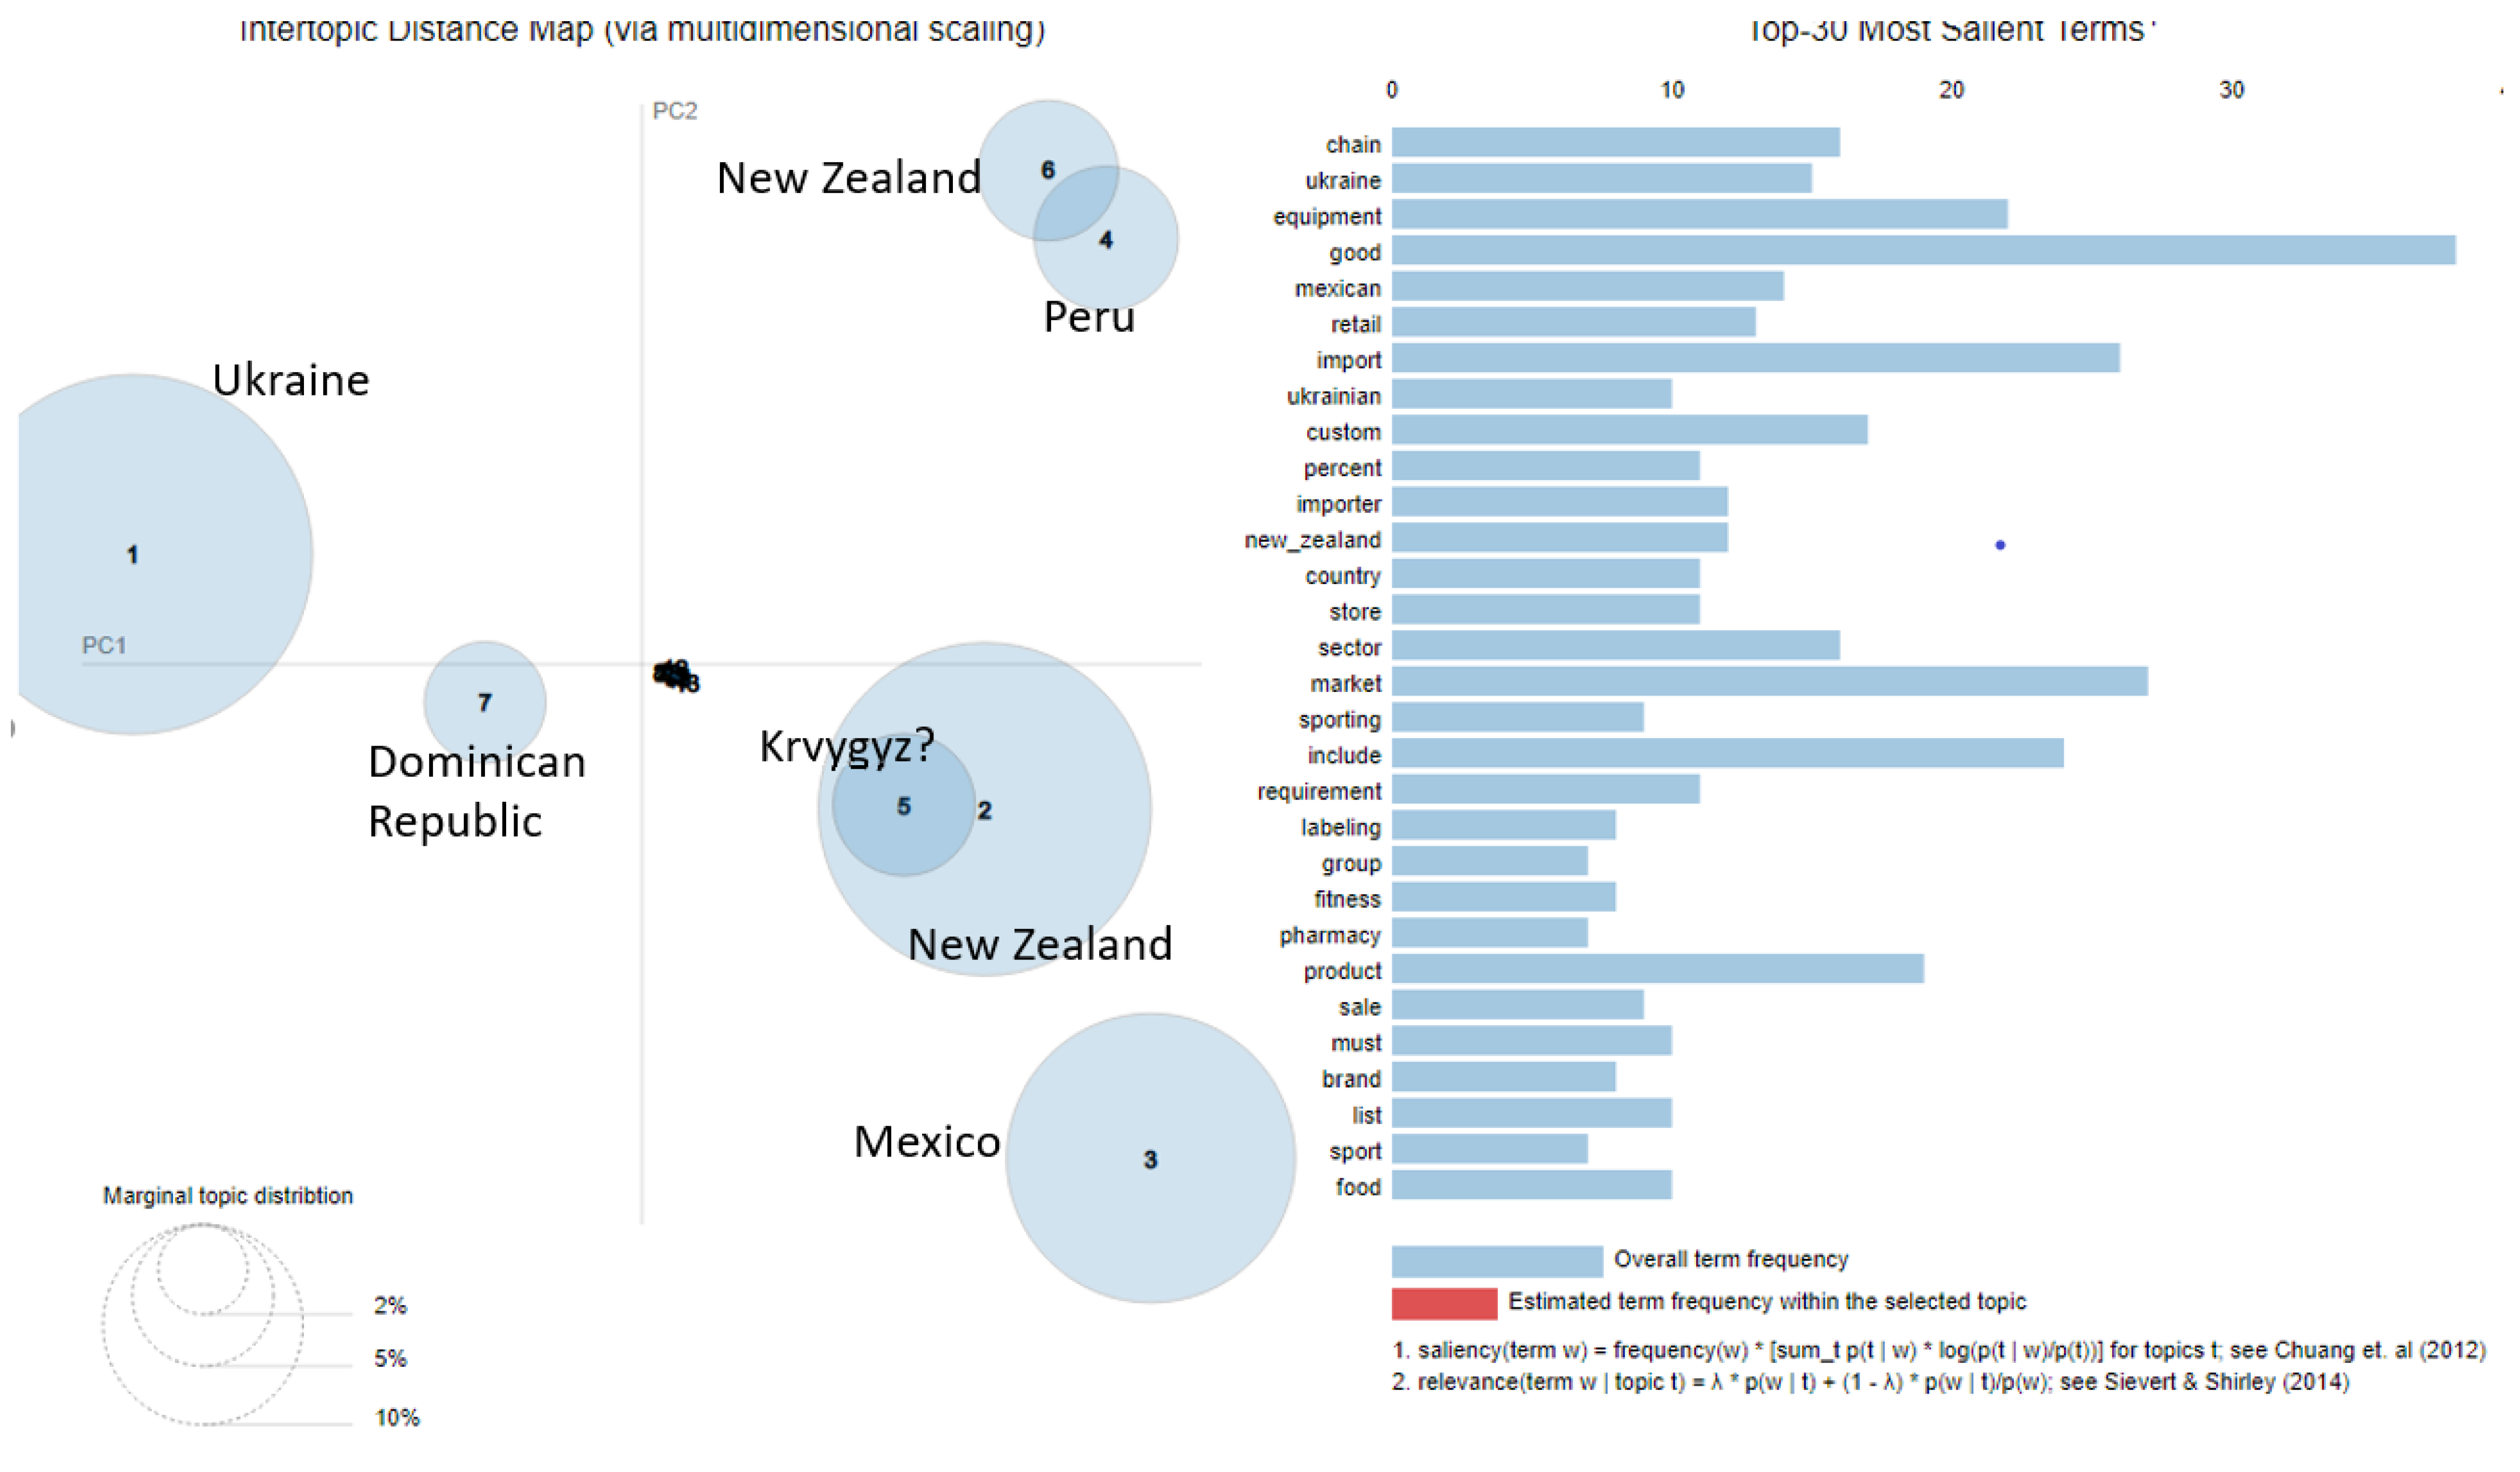
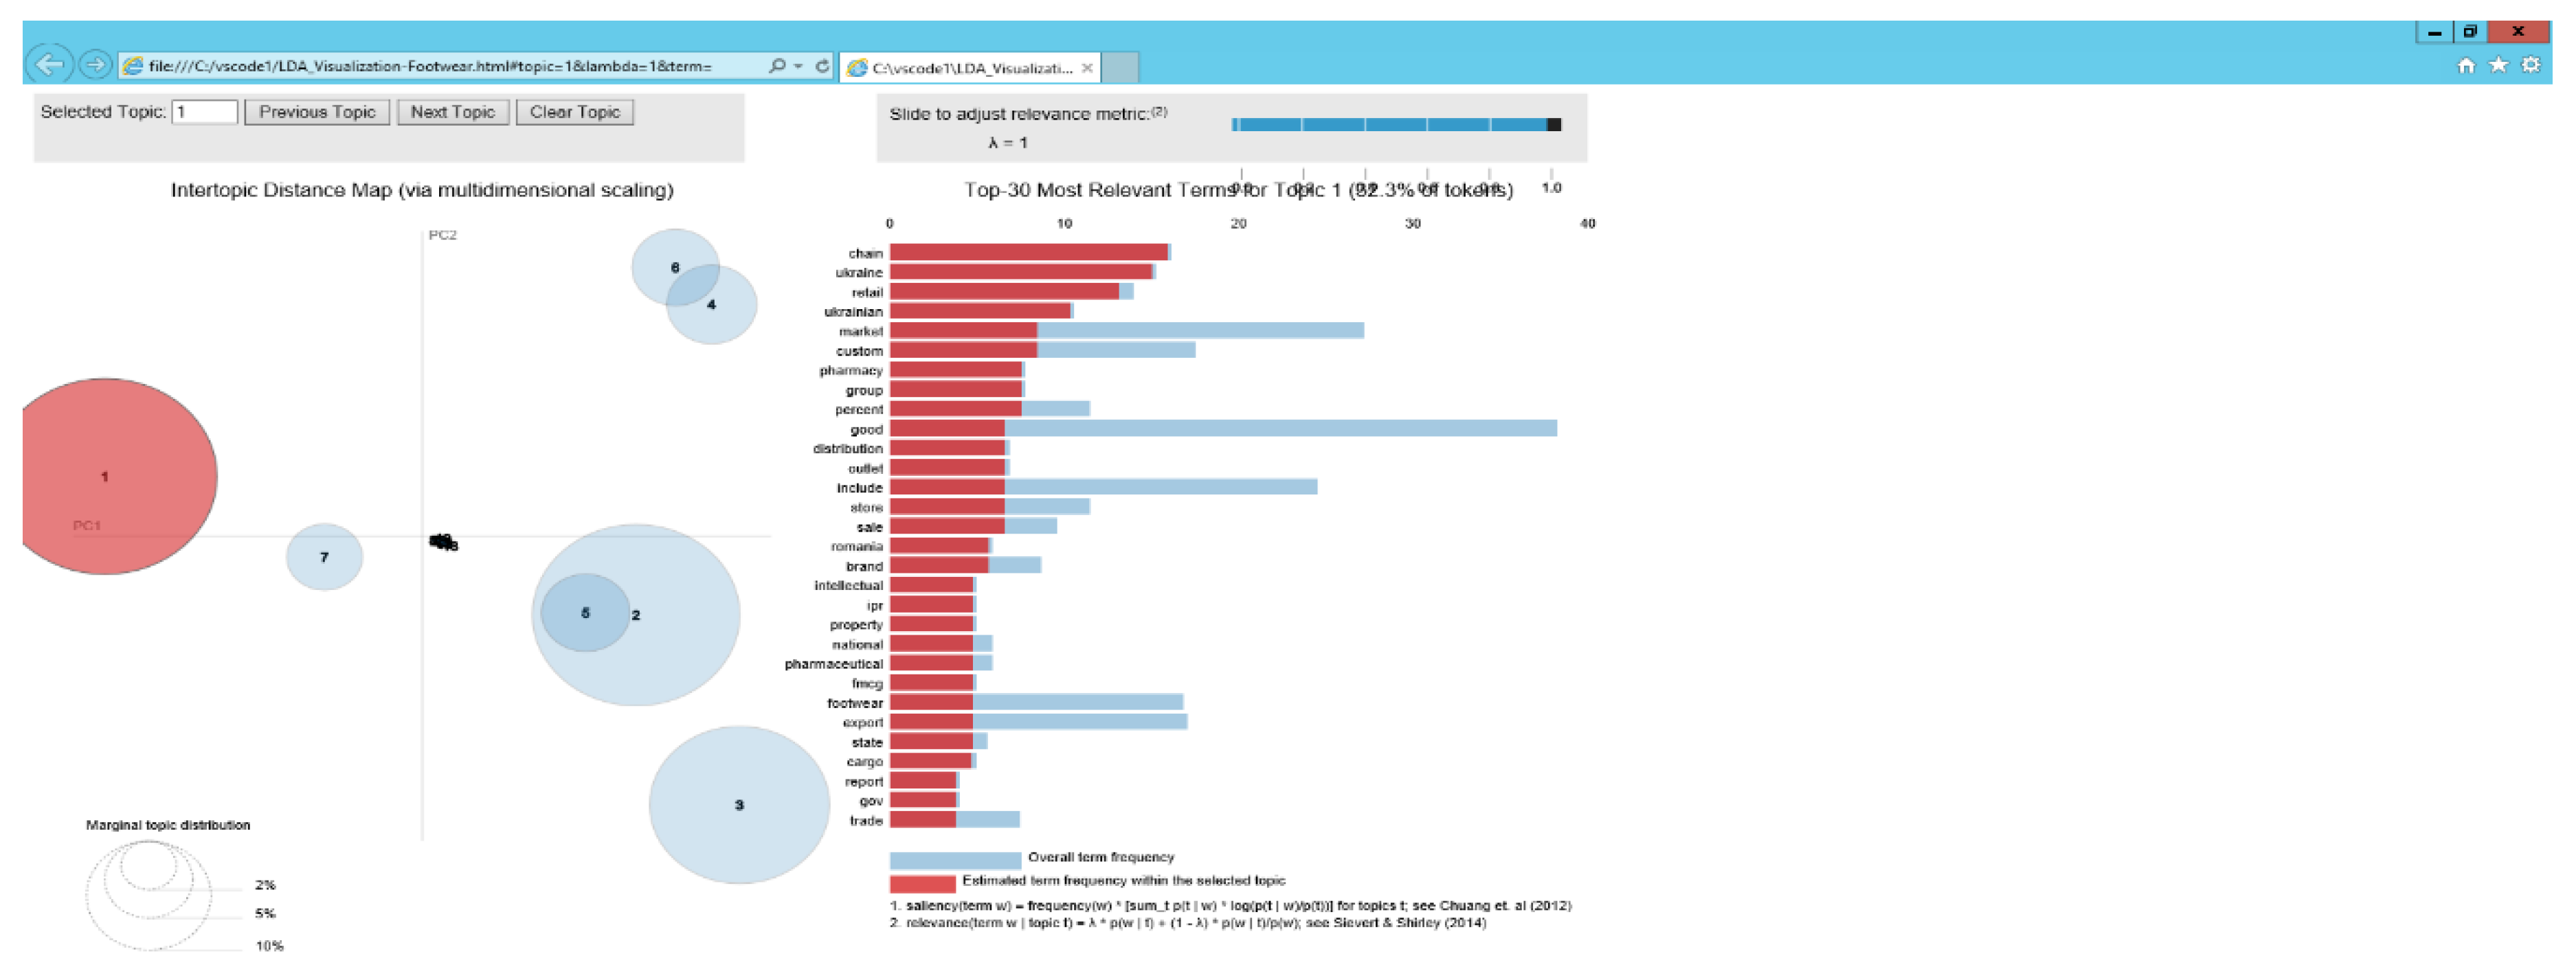
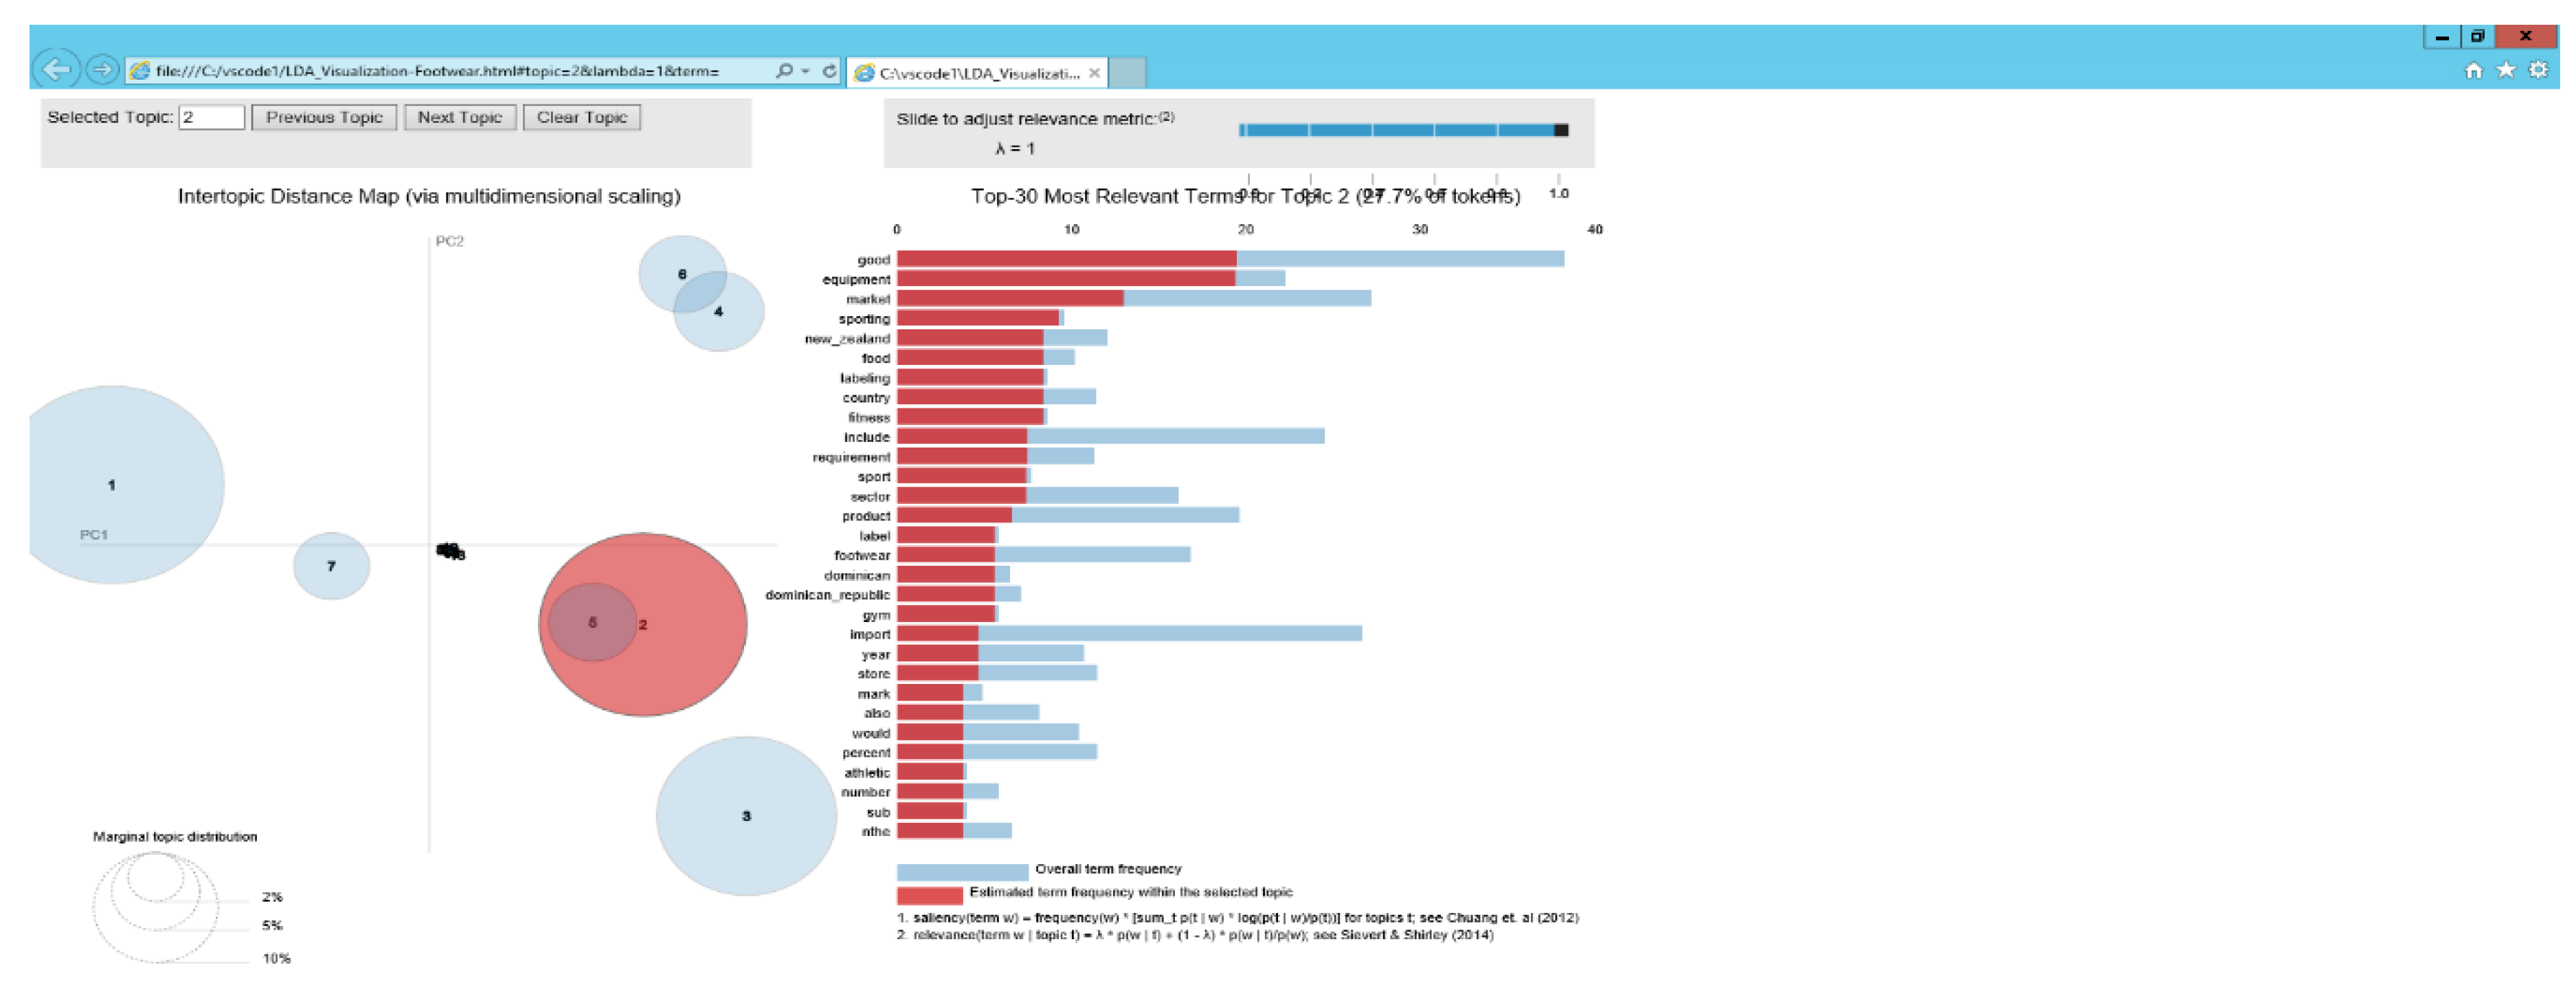
5.2. Identification of Topics in the Footwear Industry
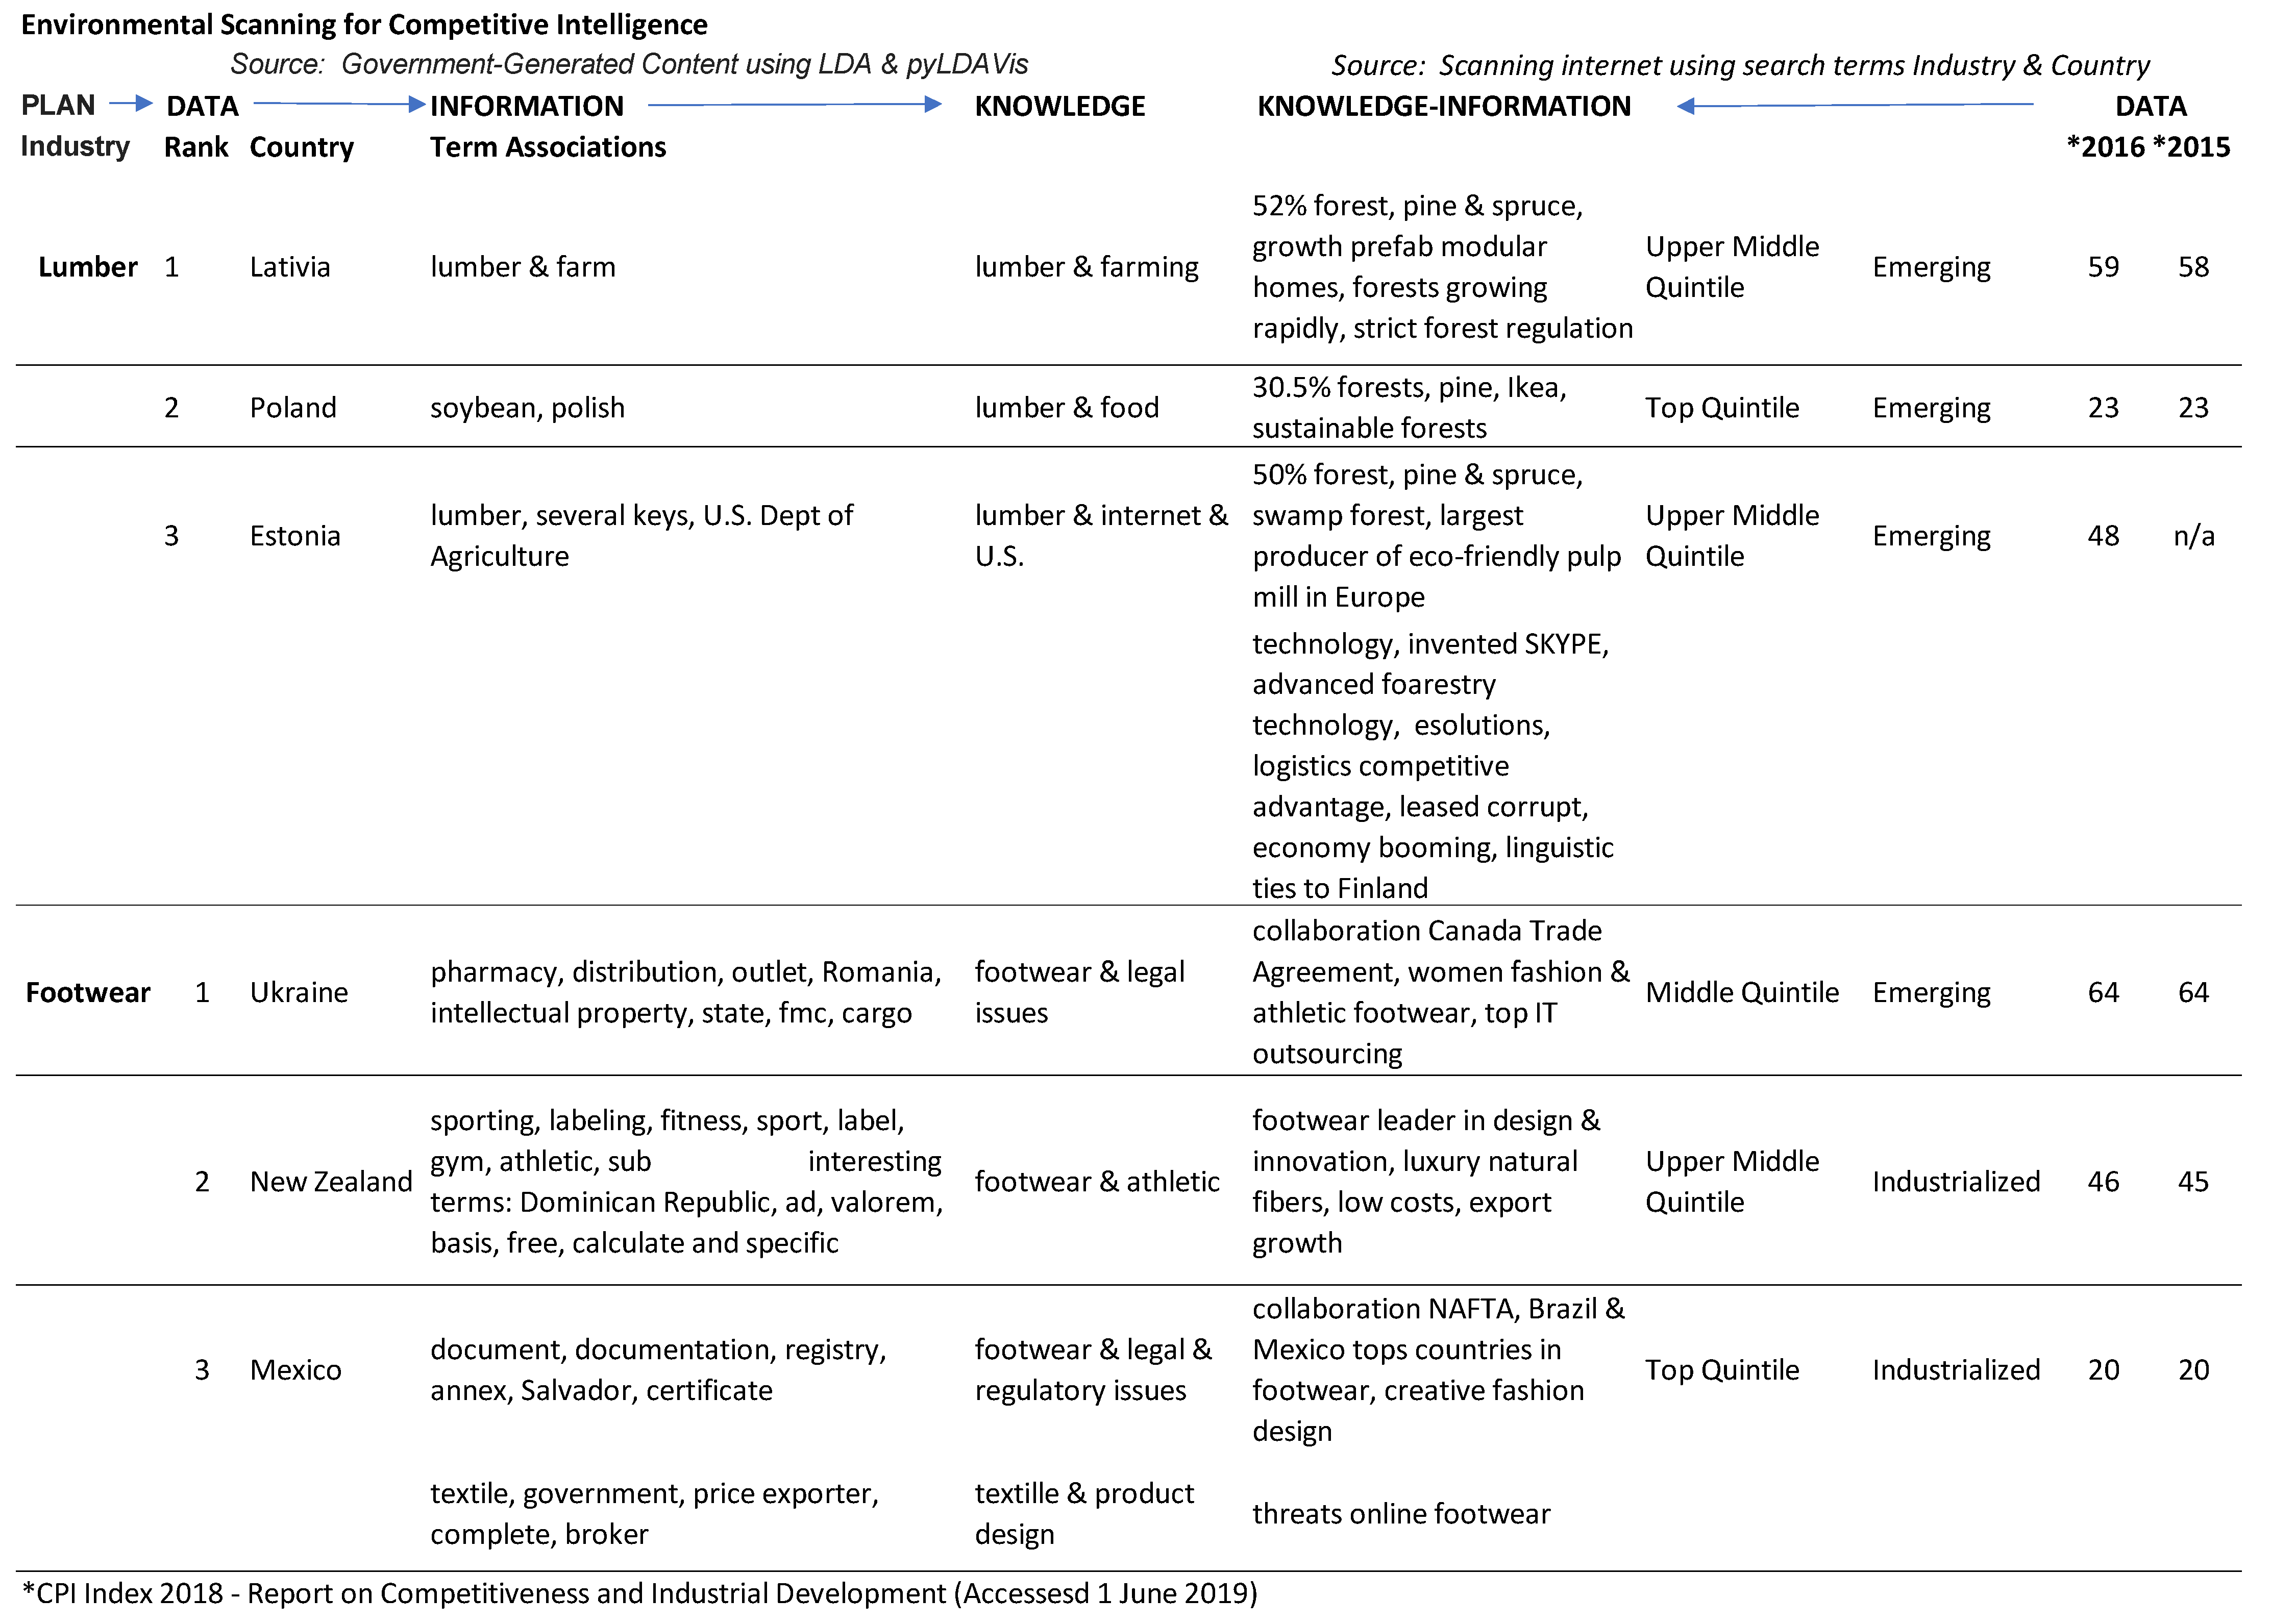
5.3. Environmental Scanning for Business Intelligence
5.3.1. Lumber Industry
5.3.2. Footwear Industry
6. Discussion and Conclusions
Author Contributions
Funding
Conflicts of Interest
Appendix A
- trade_regions
- world_regions
- first_published_date
- last_published_date
- Trade Topics
- Industries
- Countries
- World Regions
- Trade Regions
- U.S. Trade Initiatives
Appendix B

Appendix C
References
- Markets and Markets. Business Intelligence Market by Type (Platform, Software, Service), Data Type (Unstructured, Semi-structured, Structured), Business Application, Organization Size, Deployment Model, Industry Vertical, and Region-Global Forecast to 2021. March 2017. Available online: https://www.marketsandmarkets.com/PressReleases/social-business-intelligence-bi.asp (accessed on 27 July 2019).
- Dishman, L.P.; Calof, J.L. Competitive intelligence: A multiphasic precedent to marketing strategy. Eur. J. Mark. 2008, 47, 766–785. [Google Scholar] [CrossRef]
- Bergh, C.; Benghiat, G. Analytics at Amazon speed: The new normal. Bus. Intell. J. 2017, 22, 46–54. [Google Scholar]
- Thomas, P. What Role does Business Intelligence Play in the Pharma Sector? 2019. Available online: www.asmag.com/showpost/30516.aspx (accessed on 1 June 2019).
- Janssen, M.; Helbig, N. Innovating and changing the policy-cycle: Policy makers be prepared! Gov. Inf. Q. 2018, 35, S99–S105. [Google Scholar] [CrossRef]
- Hagen, L.; Keller, T.E.; Yerden, X.; Luna-Reyes, L.F. Open data visualizations and analytics as tools for policy-making. Gov. Inf. Q. 2019, 36, 101387. [Google Scholar] [CrossRef]
- Zuiderwijk, A.; Janssen, M.; Poulis, K.; van de Kaa, G. Open data for competitive advantage: Insights from open data use by companies. In Proceedings of the 16th Annual International Conference on Digital Government Research, Phoenix, AZ, USA, 27–30 May 2015. [Google Scholar]
- Jetzek, T.; Avital, M.; Bjorn-Andersen, N. Data-driven innovation through open government data. J. Theor. Appl. Electron.Commer. Res. 2014, 9, 100–120. [Google Scholar] [CrossRef] [Green Version]
- Safarov, I.; Meijer, A.; Grimmelikhuijsen, S. Utilization of open government data: A systematic literature review of types, conditions, effects and users. Inf. Polity 2017, 22, 1–24. [Google Scholar] [CrossRef] [Green Version]
- Huijboom, N.; Van den Brock, T. Open Data: An international comparison of strategies. Eur. J. Epractice 2011, 12, 1–13. [Google Scholar]
- Jetzek, T.; Avital, M.; Bjorn-Andersen, N. The Value of Open Government Data: A Strategic Analysis Framework. In Proceedings of the Pre-ICIS Workshop, Orlando, FL, USA, 16 December 2012. [Google Scholar]
- Jetzek, T.; Avital, M.; Bjorn-Andersen, N. The Generative Mechanisms of Open Government Data. In Proceedings of the ECIS 2013 Proceedings, Utrecht, The Netherlands, 5–8 June 2013. [Google Scholar]
- Hughes-Cromwick, E.; Coronado, J. The value of US government data to US business decisions. J. Econ. Perspect. 2019, 33, 131–146. [Google Scholar] [CrossRef] [Green Version]
- Kaasenbrood, M.; Zuiderwijk, A.; Janssen, M.; de Jong, M.; Bhrosa, N. Exploring the factors influencing the adoption of open government data by private organisations. Int. J. Public Adm. Digit. Age 2015, 2, 75–92. [Google Scholar]
- Magalhães, G.; Roseira, C. Exploring the barriers in the commercial use of open government data. In Proceedings of the 9th International Conference on Theory and Practice of Electronic Governance, Montevideo, Uruguay, 1–3 March 2016; pp. 211–214. [Google Scholar]
- Hagen, L. Content analysis of e-petitions with topic modeling: How to train and evaluate LDA models? Inf. Process. Manag. 2018, 54, 1292–1307. [Google Scholar] [CrossRef]
- Larson, D.; Chang, V. A review and future direction of agile, business intelligence, analytics and data science. Int. J. Inf. Manag. 2016, 36, 700–710. [Google Scholar] [CrossRef] [Green Version]
- Reisenbichler, M.; Reutterer, T. Topic modeling in marketing: Recent advances and research opportunities. J. Bus. Econ. 2019, 89, 327–356. [Google Scholar] [CrossRef] [Green Version]
- Park, J.; Fables, W.; Parker, K.R.; Nitse, P.S. The role of culture in business intelligence. Int. J. Bus. Intell. Res. 2010, 1, 1–14. [Google Scholar] [CrossRef] [Green Version]
- Moore, S. News Release. 17 February 2017. Available online: https://www.gartner.com/en/newsroom/press-releases/2017-02-17-gartner-says-worldwide-business-intelligence-and-analytics-market-to-reach-18-billion-in-2017 (accessed on 5 January 2019).
- Trieu, V.H. Getting value from Business Intelligence systems: A review and research agenda. Decis. Support Syst. 2017, 93, 111–124. [Google Scholar] [CrossRef] [Green Version]
- Haupt, R.; Scholtz, B.; Calitz, A. Using business intelligence to support strategic sustainability information management. In Proceedings of the 2015 Annual Research Conference on South African Institute of Computer Scientists and Information Technologies, Stellenbosch, South Africa, 28–30 September 2015. [Google Scholar]
- Open Government Partnership. Available online: https://www.opengovpartnership.org/about/ (accessed on 27 July 2019).
- Graves, A.; Hendler, J. Visualization tools for open government data. In Proceedings of the 14th Annual International Conference on Digital Government Research, Quebec City, QC, Canada, 17–20 June 2013. [Google Scholar]
- Janssen, K. The influence of the PSI directive on open government data: An overview of recent developments. Gov. Inf. Q. 2011, 28, 446–456. [Google Scholar] [CrossRef]
- Janssen, M.; Charalabadis, Y.; Zuiderwijk, A. Benefits, adoption barriers and myths of open data and open government. Inf. Syst. Manag. 2012, 29, 258–268. [Google Scholar] [CrossRef] [Green Version]
- Kucera, J.; Chlapek, D. Benefits and risks of open government data. J. Syst. Integr. 2014, 5, 30–41. [Google Scholar] [CrossRef]
- Albano, C.S.; Reinhard, N. Open government data: Facilitating and motivating factors for coping with potential barriers in the Brazilian context. In International Conference on Electronic Government; Springer: Berlin/Heidelberg, Germany, 2014. [Google Scholar]
- Wang, H.-J.; Lo, J. Factors influencing the adoption of open government data at the firm level. IEEE Trans. Eng. Manag. 2019, 67, 670–682. [Google Scholar] [CrossRef]
- Altayar, M.S. Motivations for open data adoption: An institutional theory perspective. Gov. Inf. Q. 2018, 35, 633–643. [Google Scholar] [CrossRef]
- Zeleti, F.A.; Ojo, A.; Curry, E. Exploring the economic value of open government data. Gov. Inf. Q. 2016, 33, 535–551. [Google Scholar] [CrossRef]
- Kalampokis, E.; Tambouris, E.; Tarabanis, K. A classification scheme for open government data: Towards linking decentralised data. Int. J. Web Eng. Technol. 2011, 6, 266–285. [Google Scholar] [CrossRef]
- Zimmerman, H.D.; Pucihar, A. Open Innovation, open data and new business models. In Proceedings of the IDIMT 2015—23rd Interdisciplinary Information and Management Talks, Poděbrady, Czech Republic, 9–11 September 2015; Doucek, P., Chroust, G., Oskrdal, V., Eds.; pp. 449–458. [Google Scholar]
- Dörre, J.; Gerstl, P.; Seiffert, R. Text mining: Finding nuggets in mountains of textual data. In Proceedings of the Fifth ACM SIGKDD International Conference on Knowledge Discovery and Data Mining, San Diego, CA, USA, 15–18 August 1999. [Google Scholar]
- Feldman, R.; Sanger, J. The Text Mining Handbook: Advanced Approaches in Analyzing Unstructured Data; Cambridge University Press: Cambridge, UK, 2007. [Google Scholar]
- Netzer, O.; Feldman, R.; Goldenberg, J.; Fresko, M. Mine your own business: Market-structure surveillance through text mining. Mark. Sci. 2012, 31, 521–543. [Google Scholar] [CrossRef] [Green Version]
- Feldman, R.; Fresko, M.; Kinar, Y.; Lindell, Y.; Liphstat, O.; Rajman, M.; Schler, Y.; Zamir, O. Text mining at the term level. In European Symposium on Principles of Data Mining and Knowledge Discovery; Springer: Berlin/Heidelberg, Germany, 1998. [Google Scholar]
- Rosa, J.A.; Spanjol, J.; Porac, J.F.; Moorman, C.; Lehmann, D.R. Text-based approaches to marketing strategy research. In Assessing Marketing Strategy Performance; Marketing Science Institute: Cambridge, UK, 2004; pp. 185–211. [Google Scholar]
- Sullivan, D. Document Warehousing and Text Mining: Techniques for Improving Business Operations, Marketing, and Sales; John Wiley & Sons, Inc.: Hoboken, NJ, USA, 2001. [Google Scholar]
- Linoff, G.S.; Berry, M.J.A. Data Mining Techniques: For Marketing, Sales, and Customer Relationship Management; John Wiley & Sons: Hoboken, NJ, USA, 2011. [Google Scholar]
- Alamsyah, A.; Rahmah, W.; Irawan, H. Sentiment Analysis Based on Appraisal Theory for Marketing Intelligence in Indonesia's Mobile Phone Market. J. Theor. Appl. Inf. Technol. 2015, 82, 335. [Google Scholar]
- Mäntylä, M.V.; Graziotin, D.; Kuutila, M. The evolution of sentiment analysis—A review of research topics, venues, and top cited papers. Comput. Sci. Rev. 2018, 27, 16–32. [Google Scholar] [CrossRef] [Green Version]
- Kherwa, P.; Bansal, P. Topic modeling: A Comprehensive review. EAI Endorsed Trans. Scalable Inf. Syst. 2019, 7, 1–16. [Google Scholar] [CrossRef] [Green Version]
- Biroscak, B.; Scott, J.E.; Lindenberger, J.H.; Bryant, C.A. Leximancer Software as a Research Tool for Social Marketers. Application to a Content Analysis. Soc. Mark. Q. 2017, 23, 223–231. [Google Scholar] [CrossRef]
- Pascual, F. Introduction to Topic Modeling (MonkeyLearn Blog). 2019. Available online: https://monkeylearn.com/blog/introduction-to-topic-modeling/#:~:text=Topic%20modeling%20is%20an%20'unsupervised,able%20to%20automatically%20analyze%20texts (accessed on 8 February 2021).
- Amado, A.; Cortez, P.; Rita, P.; Moro, S. Research trends on Big Data in Marketing: A text mining and topic modeling based literature analysis. Eur. Res. Manag. Bus. Econ. 2018, 24, 1–7. [Google Scholar] [CrossRef]
- Calheiros, A.C.; Moro, S.; Rita, P. Sentiment classification of consumer-generated online reviews using topic modeling. J. Hosp. Mark. Manag. 2017, 26, 675–693. [Google Scholar] [CrossRef] [Green Version]
- Lee, S.; Song, J.; Kim, Y. An empirical comparison of four text mining methods. J. Comput. Inf. Syst. 2010, 5, 1–10. [Google Scholar]
- Blei, D.M.; Ng, A.Y.; Jordan, M.I. Latent dirichlet allocation. J. Mach. Learn. Res. 2003, 3, 993–1022. [Google Scholar]
- Krestel, R.; Fankhauser, P.; Nejdl, W. Latent dirichlet allocation for tag recommendation. In Proceedings of the Third ACM Conference on Recommender Systems, New York, NY, USA, 22–25 October 2009. [Google Scholar]
- Sievert and Shirley. pyLDAvis. Python Library. 2015. Available online: https://pyldavis.readthedocs.io/en/latest/readme.html (accessed on 1 June 2019).
- Sanchez-Monzon, J.; Putzke, J.; Fischbach, K. Automatic generation of product association networks using latent dirichlet allocation. Procedia Soc. Behav. Sci. 2011, 26, 63–75. [Google Scholar] [CrossRef] [Green Version]
- Ma, B.; Zhang, D.; Yan, Z.; Kim, T. An LDA and synonym lexicon based approach to product feature extraction from online consumer product reviews. J. Electron. Commer. Res. 2013, 14, 304–314. [Google Scholar]
- Tirunillai, S.; Tellis, G.J. Mining marketing meaning from online chatter: Strategic brand analysis of big data using latent dirichlet allocation. J. Mark. Res. 2014, 51, 463–479. [Google Scholar] [CrossRef] [Green Version]
- Kim, Y.; Shim, K. TWILITE: A recommendation system for Twitter using a probabilistic model based on latent Dirichlet allocation. Inf. Syst. 2014, 42, 59–77. [Google Scholar] [CrossRef]
- Hejazi Nia, M. A Decision Support System for Inbound Marketers: An Empirical Use of Latent Dirichlet Allocation Topic Model to Guide Infographic Designers. In Proceedings of the AMA Summer Educators, Chicago, IL, USA, 14–16 August 2015. [Google Scholar]
- Moro, S.; Cortez, P.; Rita, P. Business intelligence in banking: A literature analysis from 2002 to 2013 using text mining and latent Dirichlet allocation. Expert Syst. Appl. 2015, 42, 1314–1324. [Google Scholar] [CrossRef] [Green Version]
- Mahajan, A.; Dey, L.; Haque, S.M. Mining financial news for major events and their impacts on the market. In Proceedings of the Web Intelligence and Intelligent Agent Technology, Sydney, NSW, Australia, 9–12 December 2008. [Google Scholar]
- Guo, Y.; Barnes, S.J.; Jia, Q. Mining meaning from online ratings and reviews: Tourist satisfaction analysis using latent dirichlet allocation. Tour. Manag. 2017, 59, 467–483. [Google Scholar] [CrossRef] [Green Version]
- Wang, W.; Feng, Y.; Dai, W. Topic analysis of online reviews for two competitive products using latent Dirichlet allocation. Electron. Commer. Res. Appl. 2018, 29, 142–156. [Google Scholar] [CrossRef]
- Sievert, C.; Shirley, K. LDAvis: A method for visualizing and interpreting topics. In Proceedings of the Workshop on Interactive Language Learning, Visualization, and Interfaces, Baltimore, MD, USA, 27 June 2014; pp. 63–70. [Google Scholar]
- April, K.; Bessa, J. A critique of the strategic competitive intelligence process within a global energy multinational. Probl. Perspect. Manag. 2006, 4, 86–99. [Google Scholar]
- Liu, G.; Wei, Y.; Li, F. Understanding Consumer Preferences—Eliciting Topics from Online Q&A Community. In Proceedings of the 18th International Conference on Electronic Business, Guilin, China, 2–6 December 2018; pp. 690–698. [Google Scholar]
- Li, F.; Du, T.C. Listen to me—Evaluating the influence of micro-blogs. Decis. Support Syst. 2014, 62, 119–130. [Google Scholar] [CrossRef]
- Davey, L. The application of case study evaluations. Pract. Assess. Res. Eval. 1990, 2, 9. [Google Scholar]
- Blichfeldt, B.S.; Andersen, J.P. Creating a wider audience for action research: Learning from case-study research. J. Res. Pract. 2006, 2, D2. [Google Scholar]
- Yin, R. Validity and generalization in future case study evaluations. Evaluation 2013, 19, 321–332. [Google Scholar] [CrossRef]
- Eisenhardt, K.M. Building theories from case study research. Acad. Manag. Rev. 1989, 14, 532–550. [Google Scholar] [CrossRef]
- Corrales-Gaaray, D.; Mora-Valentin, E.M.; Ortiz-de-Urbina-Criado, M. Open data for open innovation: An analysis of literature characteristics. Future Internet 2019, 11, 77. [Google Scholar] [CrossRef] [Green Version]
- Countants. 10 Leading Trends in Business Intelligence in the Year 2020. 18 January 2020. Available online: https://www.countants.com/blogs/10-leading-trends-in-business-intelligence-in-the-year-2020/ (accessed on 25 January 2021).
- Manyika, J.; Chui, M.; Farrell, D.; Van Kuiken, S.; Groves, P.; Doshi, E.A. Unlocking Innovation and Performance with Liquid Information; McKinsey Global Institute: Missouri, St. Louis, USA, 2013; Available online: https://www.mckinsey.com/business-functions/mckinsey-digital/our-insights/open-data-unlocking-innovation-and-performance-with-liquid-information (accessed on 20 January 2021).
- Camoinassociates Economic Development. Recent and Emerging Trends in Forestry and Lumber. 29 July 2019. Available online: https://www.camoinassociates.com/recent-and-emerging-trends-forestry-and-lumber (accessed on 29 August 2019).
- Lahtinen, K. Linking resource-based view with business economics of woodworking industry: Earlier findings and future insights. Silva Fenn. 2007, 41, 149–165. [Google Scholar] [CrossRef] [Green Version]
- Grand View Research. Footwear Market Size, Share, Global Industry Trends Report. 2025. August 2019. Available online: https://www.grandviewresearch.com/press-release/global-footwear-market (accessed on 25 June 2020).
- Scott, A. The changing global geography of low-technology, labor-intensive industry: Clothing, footwear, and furniture. Word Dev. 2006, 34, 1517–1536. [Google Scholar] [CrossRef]
- U.S. Department of Commerce. Trade.gov/Market-Intelligence/API/Enabling US Exports Through Open Data. 2018. Available online: https://developer.trade.gov/market-intelligence.html (accessed on 1 August 2018).
- Chan, C. From open data to open innovation strategies: Creating e-services using open government data. In Proceedings of the 46th Hawaii International Conference on System Sciences, Wailea, HI, USA, 7–10 January 2013. [Google Scholar]
- Li, C.; Lu, Y.; Wu, J.; Zhang, Y.; Xia, Z.; Wang, T.; Dantian, Y.; Xurui, C.; Peidong, L.; Junyu, G. LDA meets Word2Vec: A novel model for academic abstract clustering. In Proceedings of the Web Conference, Lyon, France, 23–27 April 2018. [Google Scholar]
- Kobuszynska, M. USDA Foreign Agricultural Service and Wood Sector in Latvia. 12 December 2016. Available online: https://gain.fas.usda.gov/Recent%20GAIN%20Publications/Wood%20Sector%20in%20Latvia_Warsaw_Latvia_12-12-2016.pdf (accessed on 1 June 2019).
- Kobuszynska, M. USDA Foreign Agricultural Service. Forest and Wood Products in Poland. 2017. Available online: https://gain.fas.usda.gov/Recent%20GAIN%20Publications/The%20Forestry%20and%20Wood%20Products%20in%20Poland_Warsaw_Poland_3-23-2017.pdf (accessed on 1 June 2019).
- Ikea. Wood—A Material with Many Qualities. 1999–2021. Available online: https://www.ikea.com/gb/en/this-is-ikea/people-planet/energy-resources/wood/ (accessed on 1 June 2019).
- Kobuzynska, M. Foreign Agricultural Service and Wood Sector in Estonia. 20 December 2016. Available online: https://gain.fas.usda.gov/Recent%20GAIN%20Publications/Wood%20Sector%20in%20Estonia_Warsaw_Estonia_12-20-2016.pdf (accessed on 1 June 2019).
- Estonian Timber. Digital Revolution in the Estonian Forestry and Wood Industry. 2018. Available online: https://estoniantimber.ee/best-practices/digital-revolution-in-the-estonian-forestry-and-wood-industry/ (accessed on 1 June 2019).
- Government of Canada and Trade Commissioner Service. Canada-Ukraine Trade Deal Vastly Expands Opportunities for Exporters. 2020. Available online: https://www.tradecommissioner.gc.ca/canadexport/0004892.aspx?lang=eng (accessed on 19 August 2020).
- Canada-Ukraine Trade & Investment Support Project (CUTIS). CUTIS Celebrates the First Anniversary of the CUFTA and Kicks off the CUTIS Investment Roadshow. 2018. Available online: https://www.globenewswire.com/news-release/2018/10/17/1622480/0/en/CUTIS-celebrates-the-first-anniversary-of-the-CUFTA-and-kicks-off-the-CUTIS-Investment-Roadshow.html (accessed on 1 June 2019).
- Euromonitor International. Country Report. Footwear in Ukraine. 2020. Available online: https://www.euromonitor.com/footwear-in-ukraine/report (accessed on 29 January 2021).
- Match Board. 10 Reasons You Should Consider Outsourcing to New Zealand. 2019. Available online: https://www.matchboard.com.au/10-reasons-you-should-consider-outsourcing-to-new-zealand/ (accessed on 1 June 2019).
- Transparency Market Research. North America Footwear Market. 2019. Available online: https://www.transparencymarketresearch.com/north-america-footwear-market.htm (accessed on 1 June 2019).
- Shoes from Mexico. Mexican Shoes and Globalization. 2019. Available online: https://shoesfrommexico.com/mexican-shoes-and-globalization/ (accessed on 29 January 2021).
- Pereira, G.V.; Macadar, M.A.; Luciano, E.M.; Testa, M.G. Delivering public value through open government data initiatives in a Smart City context. Inf. Syst. Front. 2017, 19, 213–229. [Google Scholar] [CrossRef] [Green Version]
- Barney, J. Firm resources and sustained competitive advantage. J. Manag. 1991, 17, 99–120. [Google Scholar] [CrossRef]
- Nassirtoussi, A.K.; Aghabozorgi, S.; Wah, T.Y.; Ngo, D.C. Text mining for market prediction: A systematic review. Expert Syst. Appl. 2014, 4, 7653–7670. [Google Scholar] [CrossRef]
- Short, J.S.; Palmer, T.B. The application of DICTION to content analysis research in strategic management. Organ. Res. Methods 2008, 11, 727–752. [Google Scholar] [CrossRef]


Publisher’s Note: MDPI stays neutral with regard to jurisdictional claims in published maps and institutional affiliations. |
© 2021 by the authors. Licensee MDPI, Basel, Switzerland. This article is an open access article distributed under the terms and conditions of the Creative Commons Attribution (CC BY) license (http://creativecommons.org/licenses/by/4.0/).
Share and Cite
Gottfried, A.; Hartmann, C.; Yates, D. Mining Open Government Data for Business Intelligence Using Data Visualization: A Two-Industry Case Study. J. Theor. Appl. Electron. Commer. Res. 2021, 16, 1042-1065. https://0-doi-org.brum.beds.ac.uk/10.3390/jtaer16040059
Gottfried A, Hartmann C, Yates D. Mining Open Government Data for Business Intelligence Using Data Visualization: A Two-Industry Case Study. Journal of Theoretical and Applied Electronic Commerce Research. 2021; 16(4):1042-1065. https://0-doi-org.brum.beds.ac.uk/10.3390/jtaer16040059
Chicago/Turabian StyleGottfried, Anne, Caroline Hartmann, and Donald Yates. 2021. "Mining Open Government Data for Business Intelligence Using Data Visualization: A Two-Industry Case Study" Journal of Theoretical and Applied Electronic Commerce Research 16, no. 4: 1042-1065. https://0-doi-org.brum.beds.ac.uk/10.3390/jtaer16040059