Article

Sentiment Analysis of Review Data Using Blockchain and LSTM to Improve Regulation for a Sustainable Market

1
School of Law, China University of Political Science and Law, Beijing 102249, China
2
Department of Computer and Information Science, University of Macau, Macau 999078, China
3
Beijing Key Laboratory of Big Data Technology for Food Safety, School of Computer, Beijing Technology and Business University, Beijing 100048, China
4
National Engineering Laboratory for Agri-Product Quality Traceability, Beijing Technology and Business University, Beijing 100048, China
5
School of Law, University of Macau, Macau 999078, China
*
Authors to whom correspondence should be addressed.
These authors contributed equally to this work.
J. Theor. Appl. Electron. Commer. Res. 2022, 17(1), 1-19; https://0-doi-org.brum.beds.ac.uk/10.3390/jtaer17010001
Submission received: 11 September 2021 / Revised: 23 November 2021 / Accepted: 25 November 2021 / Published: 22 December 2021
(This article belongs to the Special Issue Blockchain Commerce Ecosystem)

Abstract

:
E-commerce has developed greatly in recent years, as such, its regulations have become one of the most important research areas in order to implement a sustainable market. The analysis of a large amount of reviews data generated in the shopping process can be used to facilitate regulation: since the review data is short text and it is easy to extract the features through deep learning methods. Through these features, the sentiment analysis of the review data can be carried out to obtain the users’ emotional tendency for a specific product. Regulators can formulate reasonable regulation strategies based on the analysis results. However, the data has many issues such as poor reliability and easy tampering at present, which greatly affects the outcome and can lead regulators to make some unreasonable regulatory decisions according to these results. Blockchain provides the possibility of solving these problems due to its trustfulness, transparency and unmodifiable features. Based on these, the blockchain can be applied for data storage, and the Long short-term memory (LSTM) network can be employed to mine reviews data for emotional tendencies analysis. In order to improve the accuracy of the results, we designed a method to make LSTM better understand text data such as reviews containing idioms. In order to prove the effectiveness of the proposed method, different experiments were used for verification, with all results showing that the proposed method can achieve a good outcome in the sentiment analysis leading to regulators making better decisions.

1. Introduction

With the development of e-commerce, a large number of product reviews have been generated. The analysis of reviews data can provide a basis for regulation. In addition, it solves many problems such as descriptions about the product on the website when it does not match the actual object [1]. Due to the fact that the reviews contain emotional information, the sentiment analysis of reviews not only provides references for consumers [2], but also enables merchants to objectively recognize the advantages and disadvantages of their products [3]. Thus, the sentiment analysis of reviews has great commercial value as well as playing an important role in many researches [4,5].
Sentiment analysis is also called review mining or opinion mining [6], which aims at identifying, extracting and organizing sentiments contained in text data collected from social networks, blogs and others. Most traditional sentiment analysis methods are based on sentiment knowledge, which uses some existing sentiment dictionaries and language knowledge to classify the sentiment tendencies of reviews. It is a kind of natural language processing method. However, the ambiguity, dynamics and non-standard nature of natural language brings great challenges to sentiment analysis. The appearance of deep learning technologies can meet these challenges well. It has powerful computational models that improve the many tasks of sentiment analysis including sentiment classification of sentences [7], sentiment extraction and lexicon learning [8]. However, it still cannot solve some problems that currently exist in data analysis, such as weak data source reliability, data being easily tampered with, and asymmetric permissions for data access. These problems will greatly affect the accuracy of the analysis results.
Blockchain provides a possibility to solve these problems. The distributed feature of the blockchain network means each node has equal permission and can share the data. This means that every transaction information can be recorded in the blockchian after the transaction is finished, where it cannot be tampered with and it is open to all nodes in the entire network. The data recorded on it can be considered as a reliable source of reference information, because of the transparent feature. In addition, the blockchain network can also record the information of every link involved in the whole transaction process, which provides an effective basis for the implementation of regulation.
Motivated by these, we propose a sentiment analysis method for review text combining blockchain and a deep learning model to provide regulatory basis and stratgies. The blockchain is used to record transactions information and review data after the transactions have finished. Review data like some containing idioms may cause analysis errors can also be well stored in the blockchain. Its features such as complete, non-tamperable and fully shared can provide reliable data for sentiment analysis. Here, sentiment analysis is conducted by a Long Short-Term Memory (LSTM) network since it has great performance in text analysis, and has been verified in the experiments. The highlights of this research can be divided into three parts.
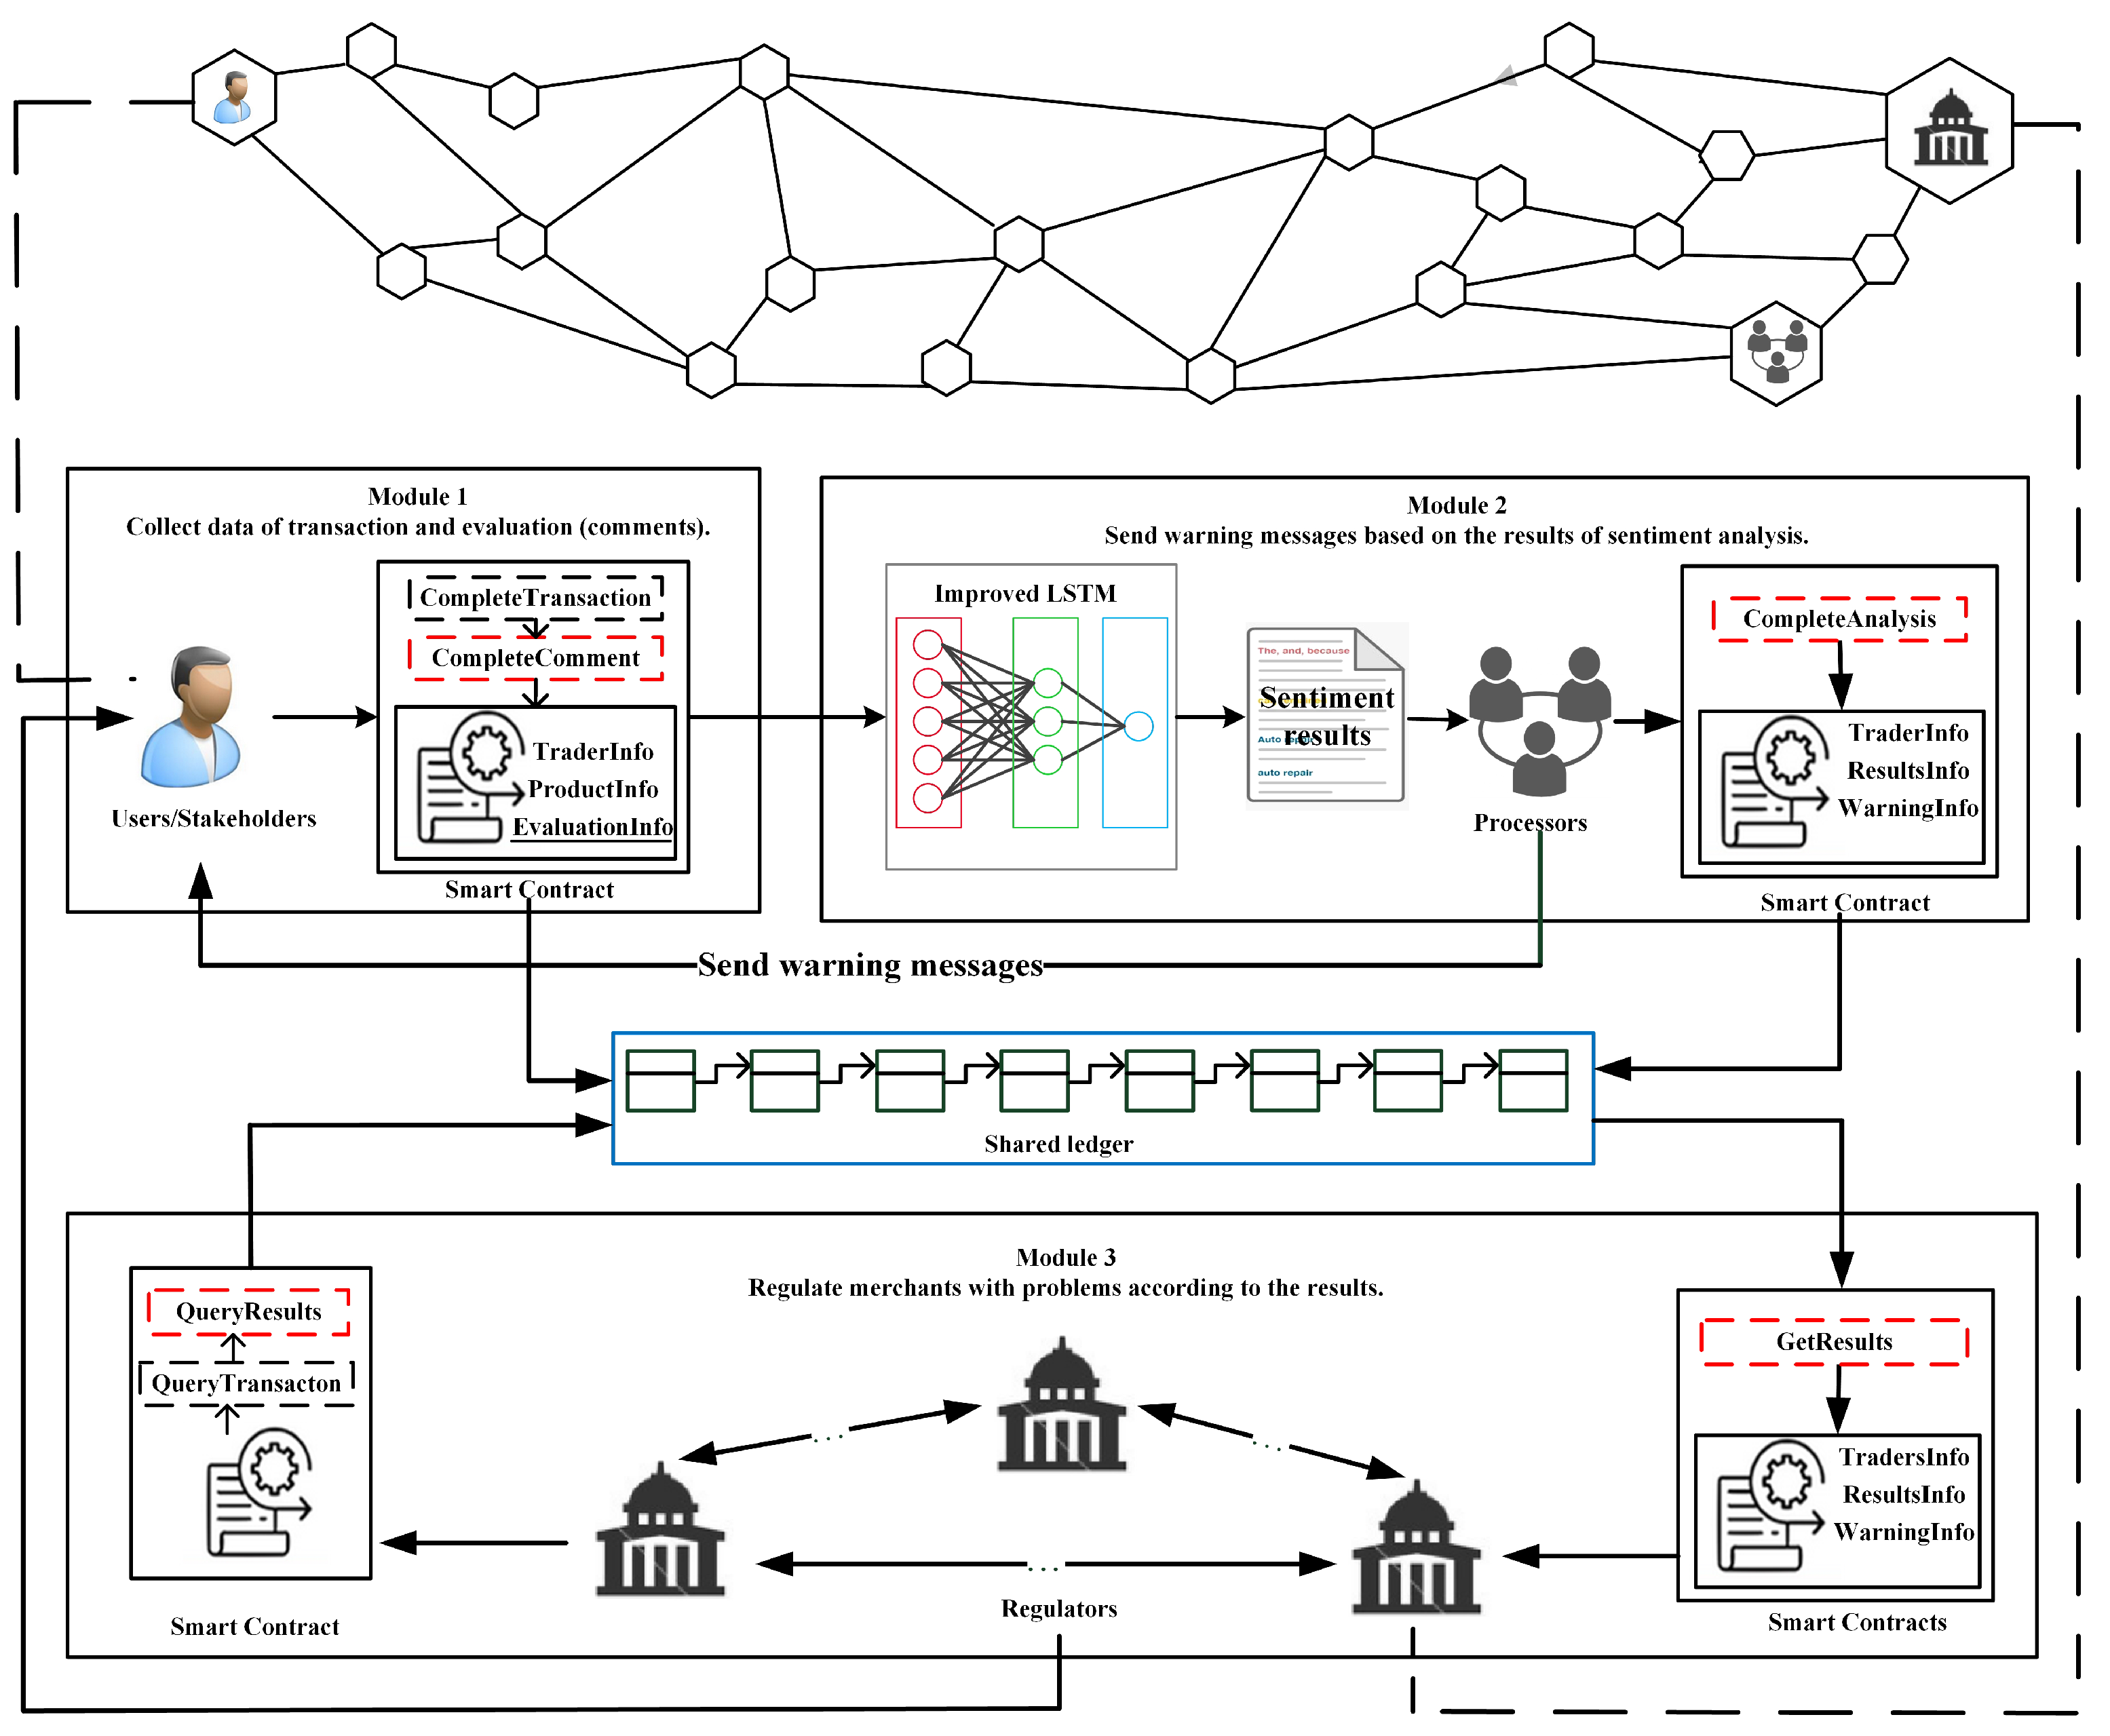
  • In order to ensure the authenticity and validity of the data, a platform based on blockchain has been developed for data storage. Users can make transactions and post related review information through this platform.
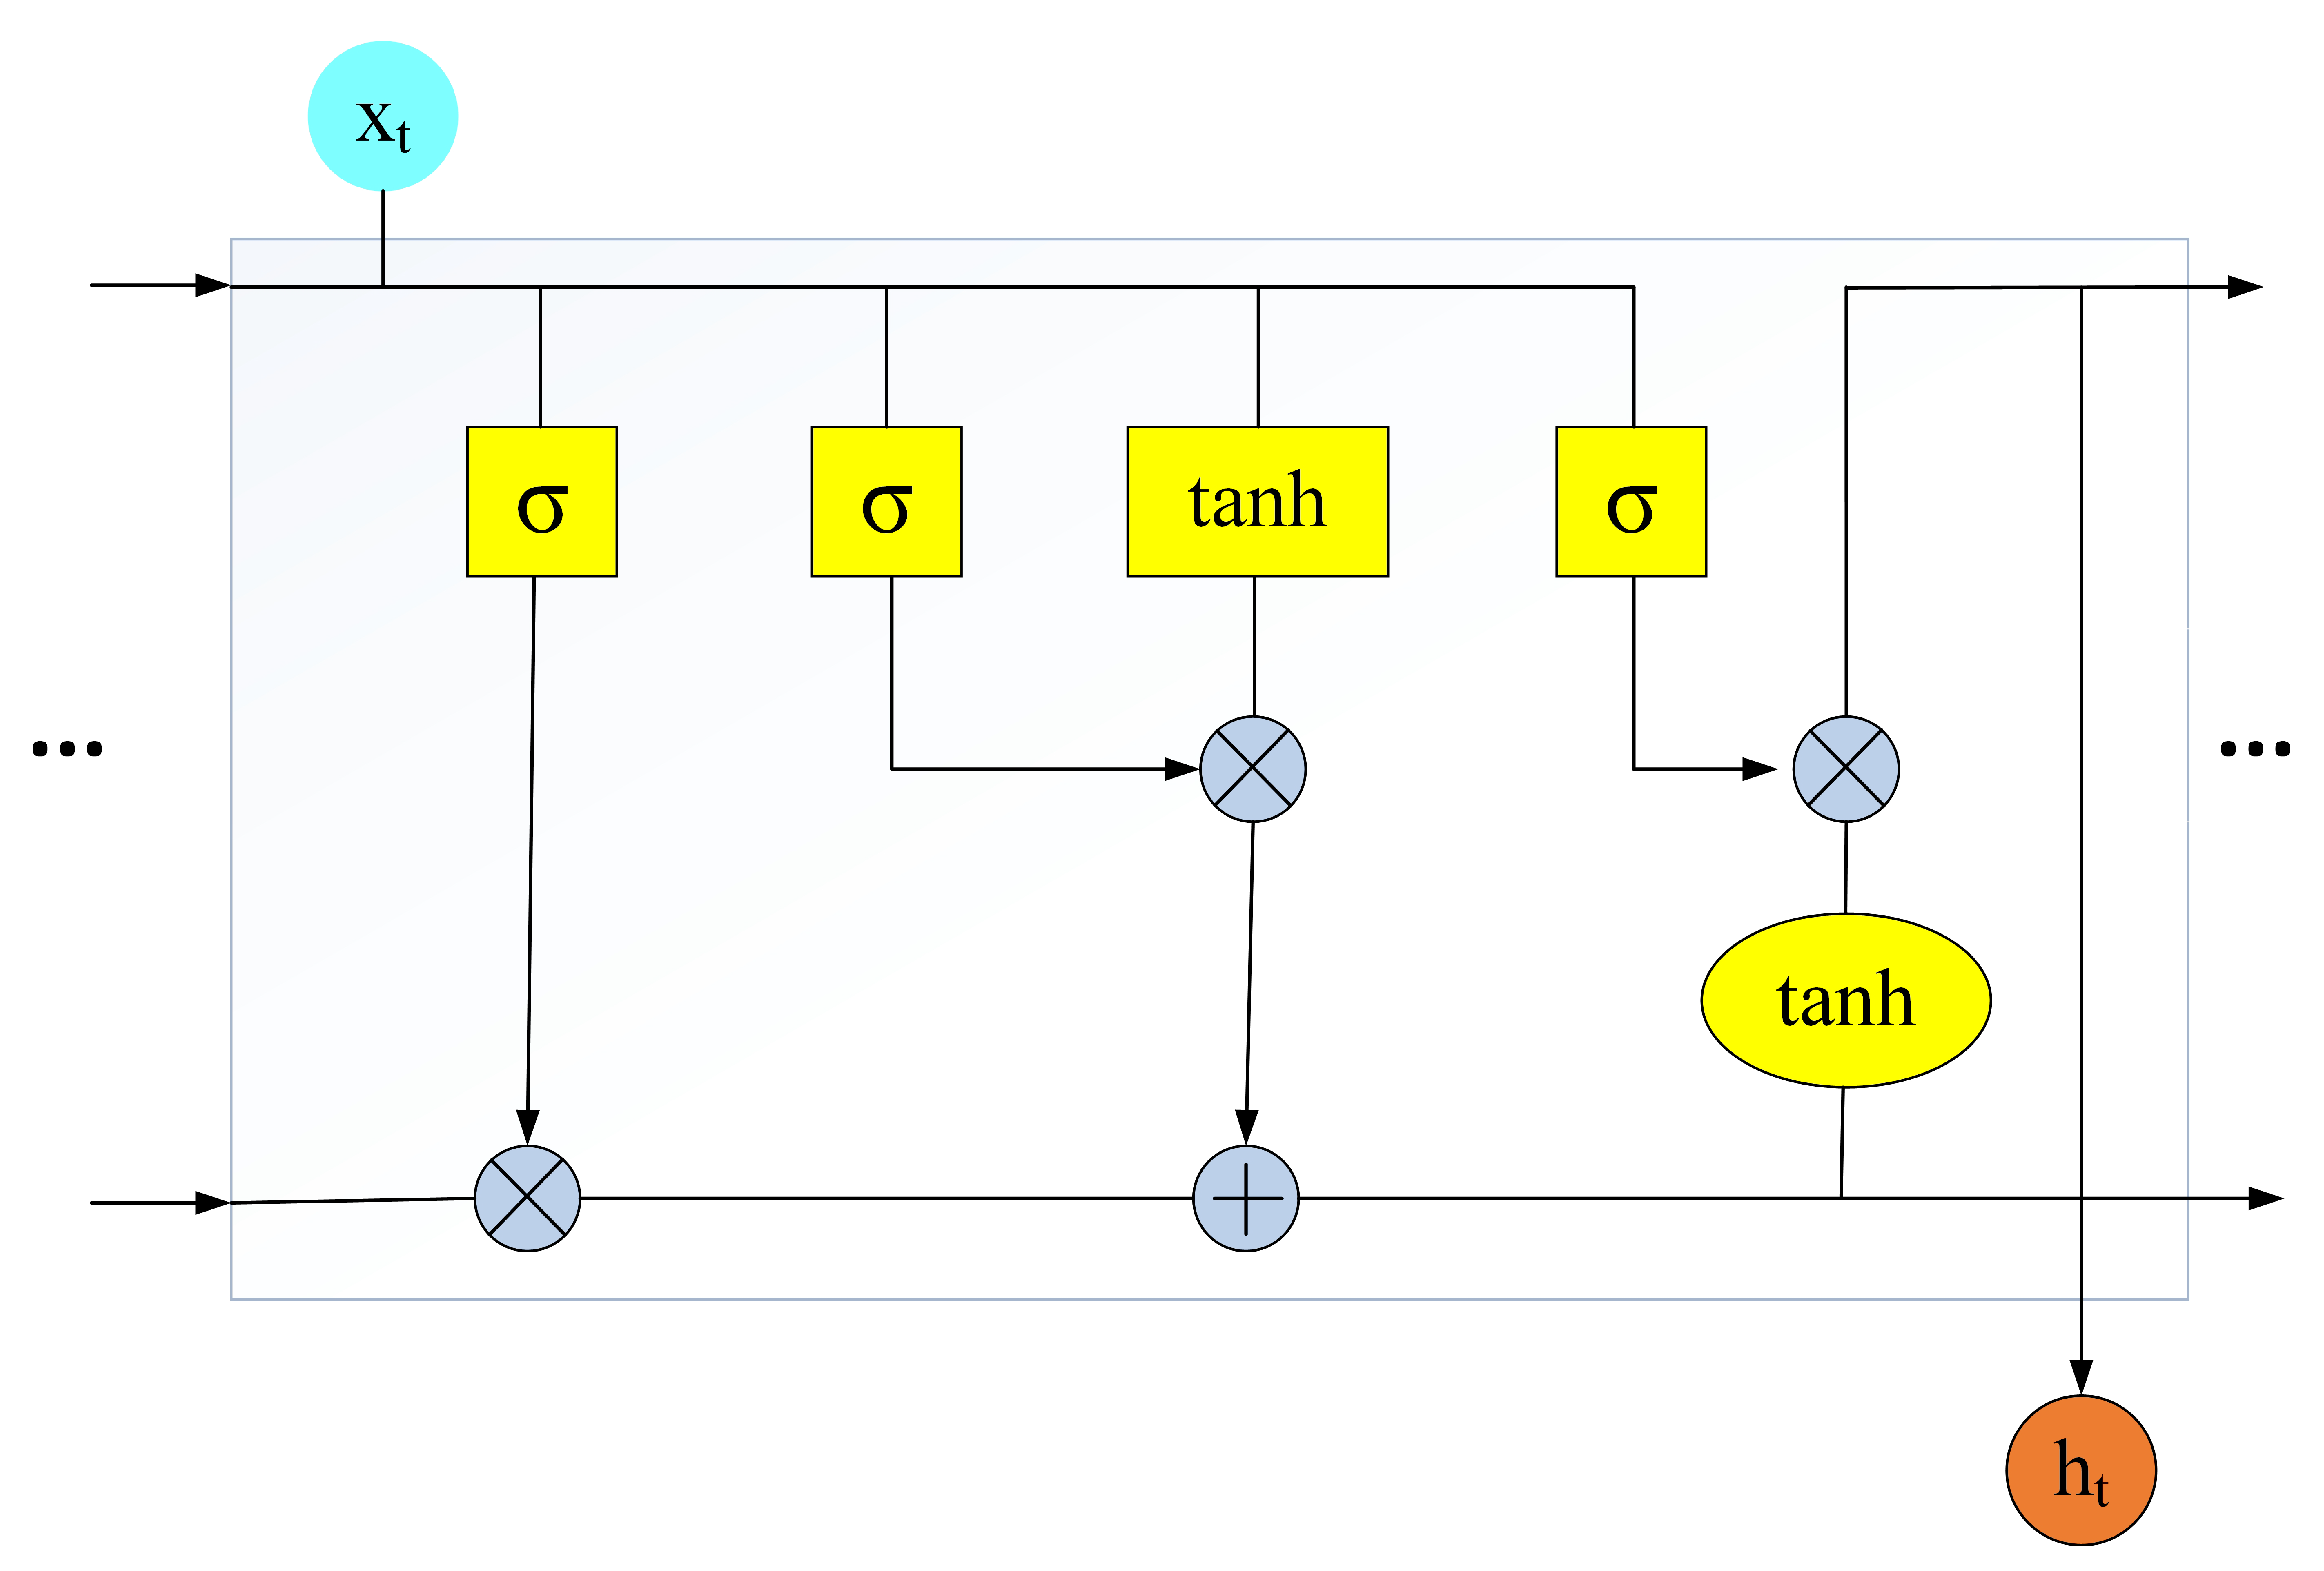
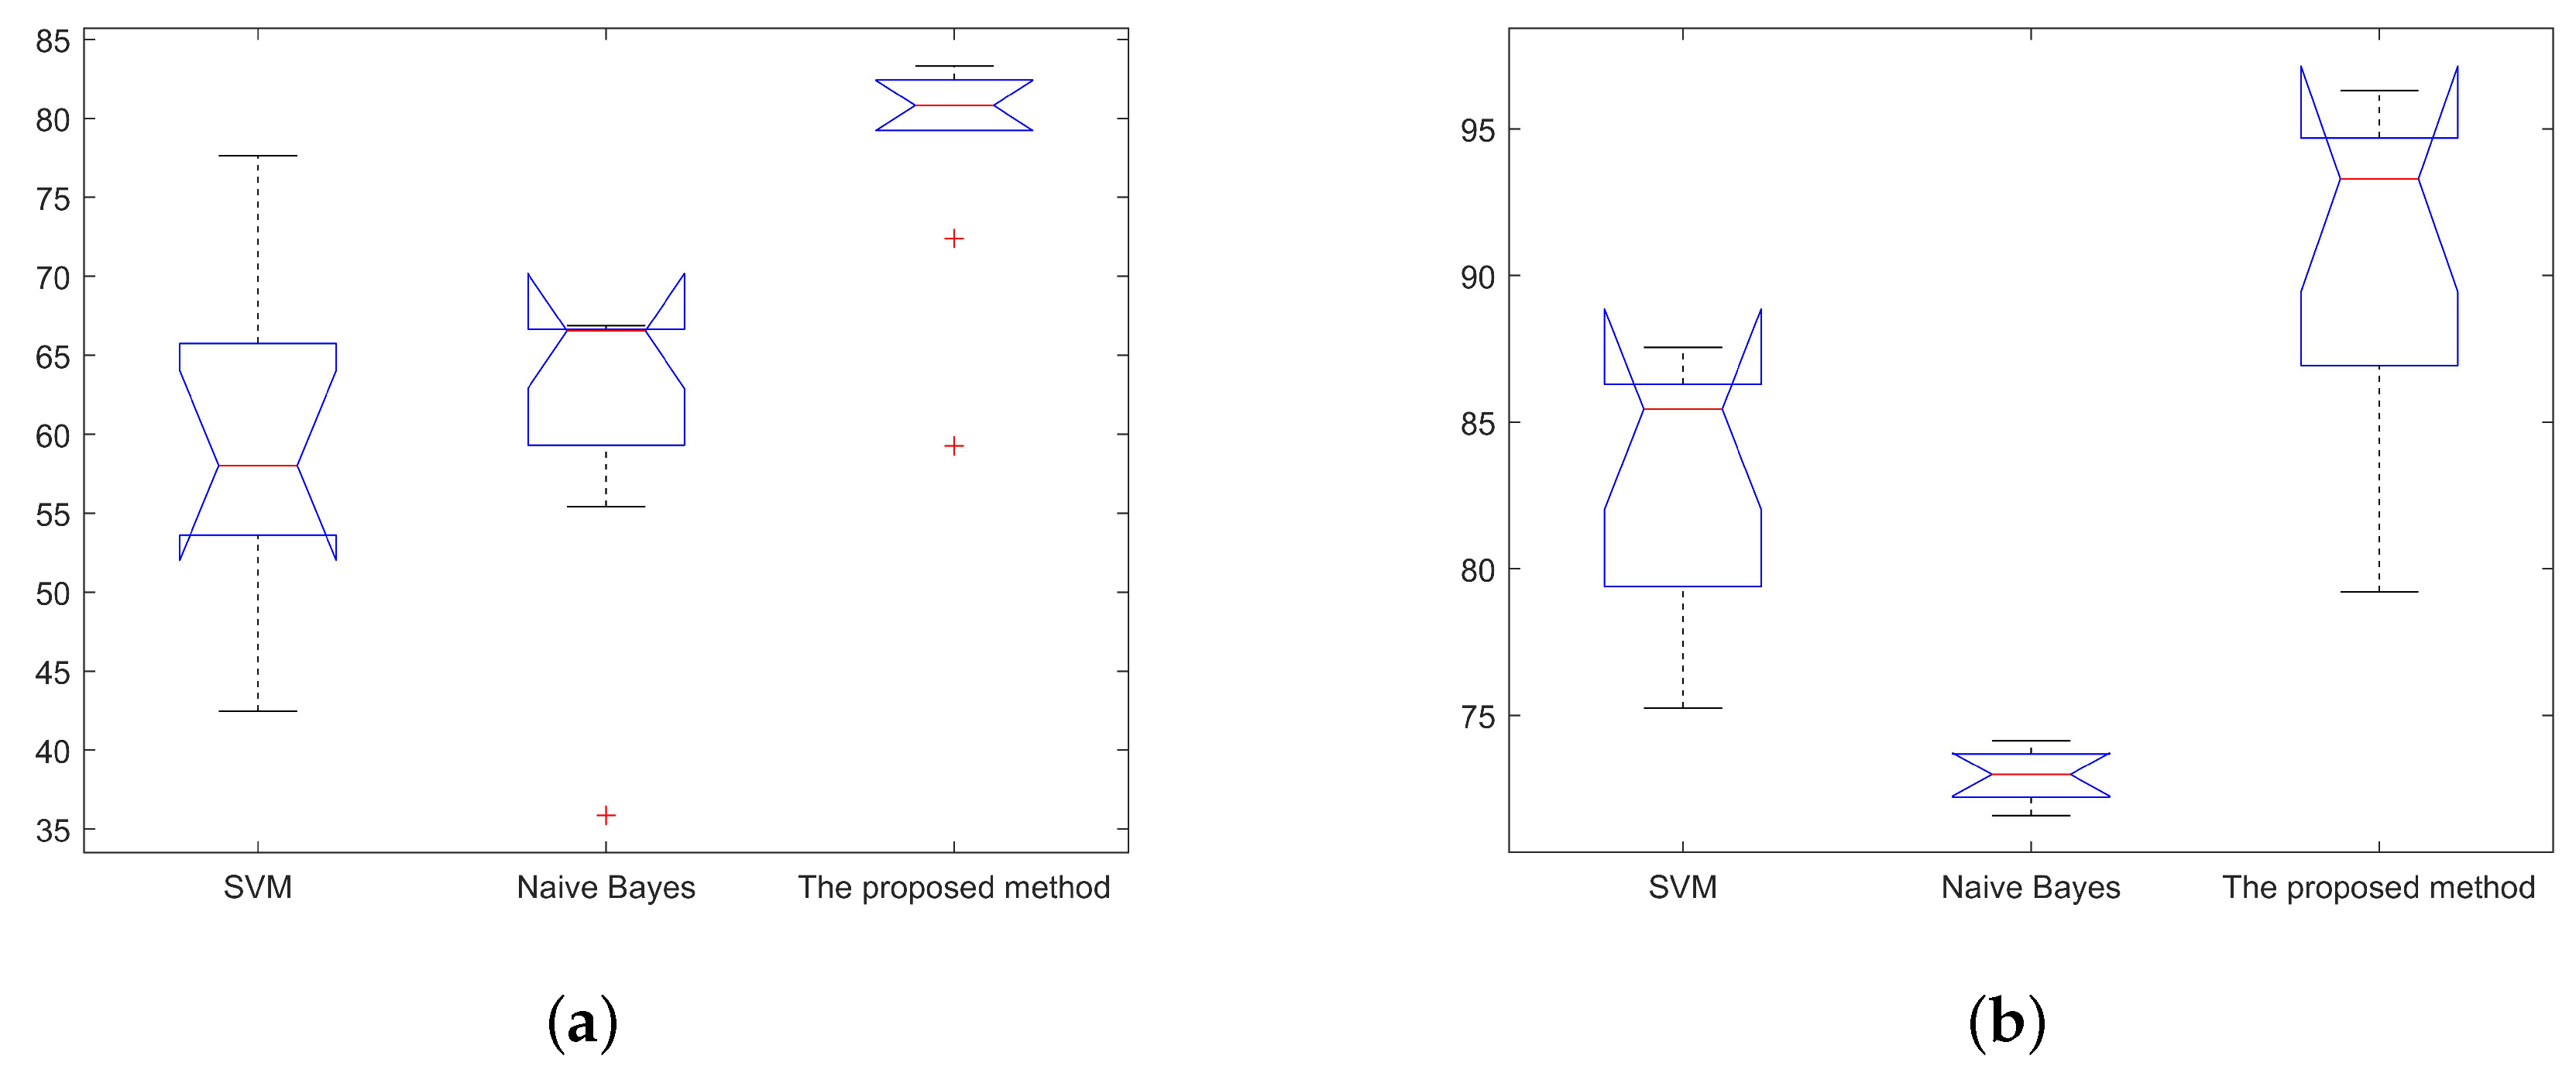
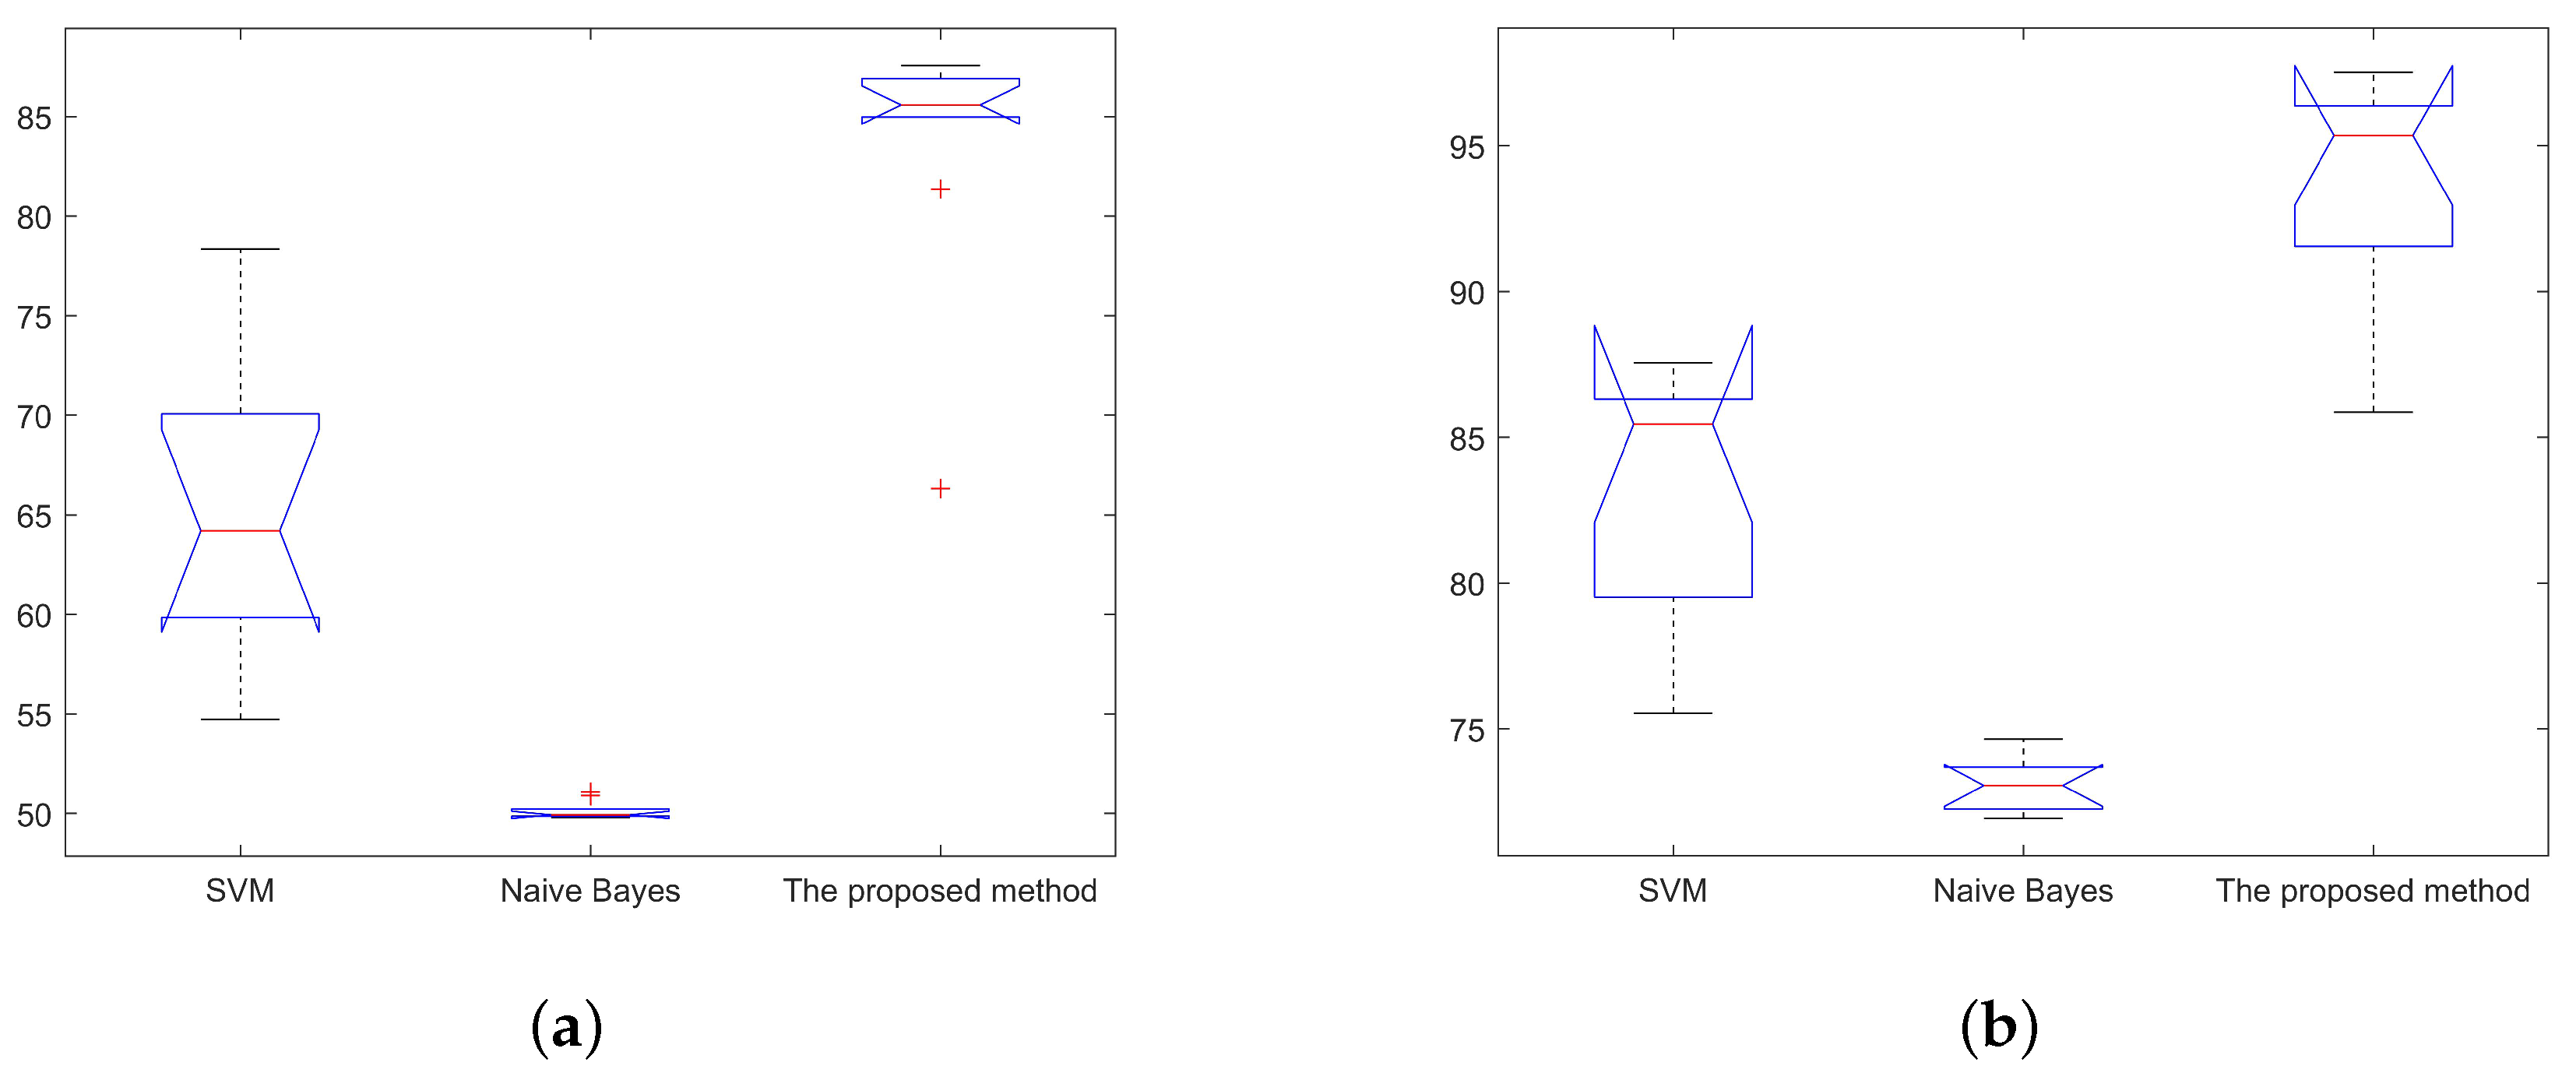
  • In order to improve the precision of sentiment analysis, the LSTM model has been improved by an external memory component to process review data containing idioms. Compared with the currently widely used models such as Support Vector Machine (SVM) and Naive Bayes (NB), the improved model shows better performance.
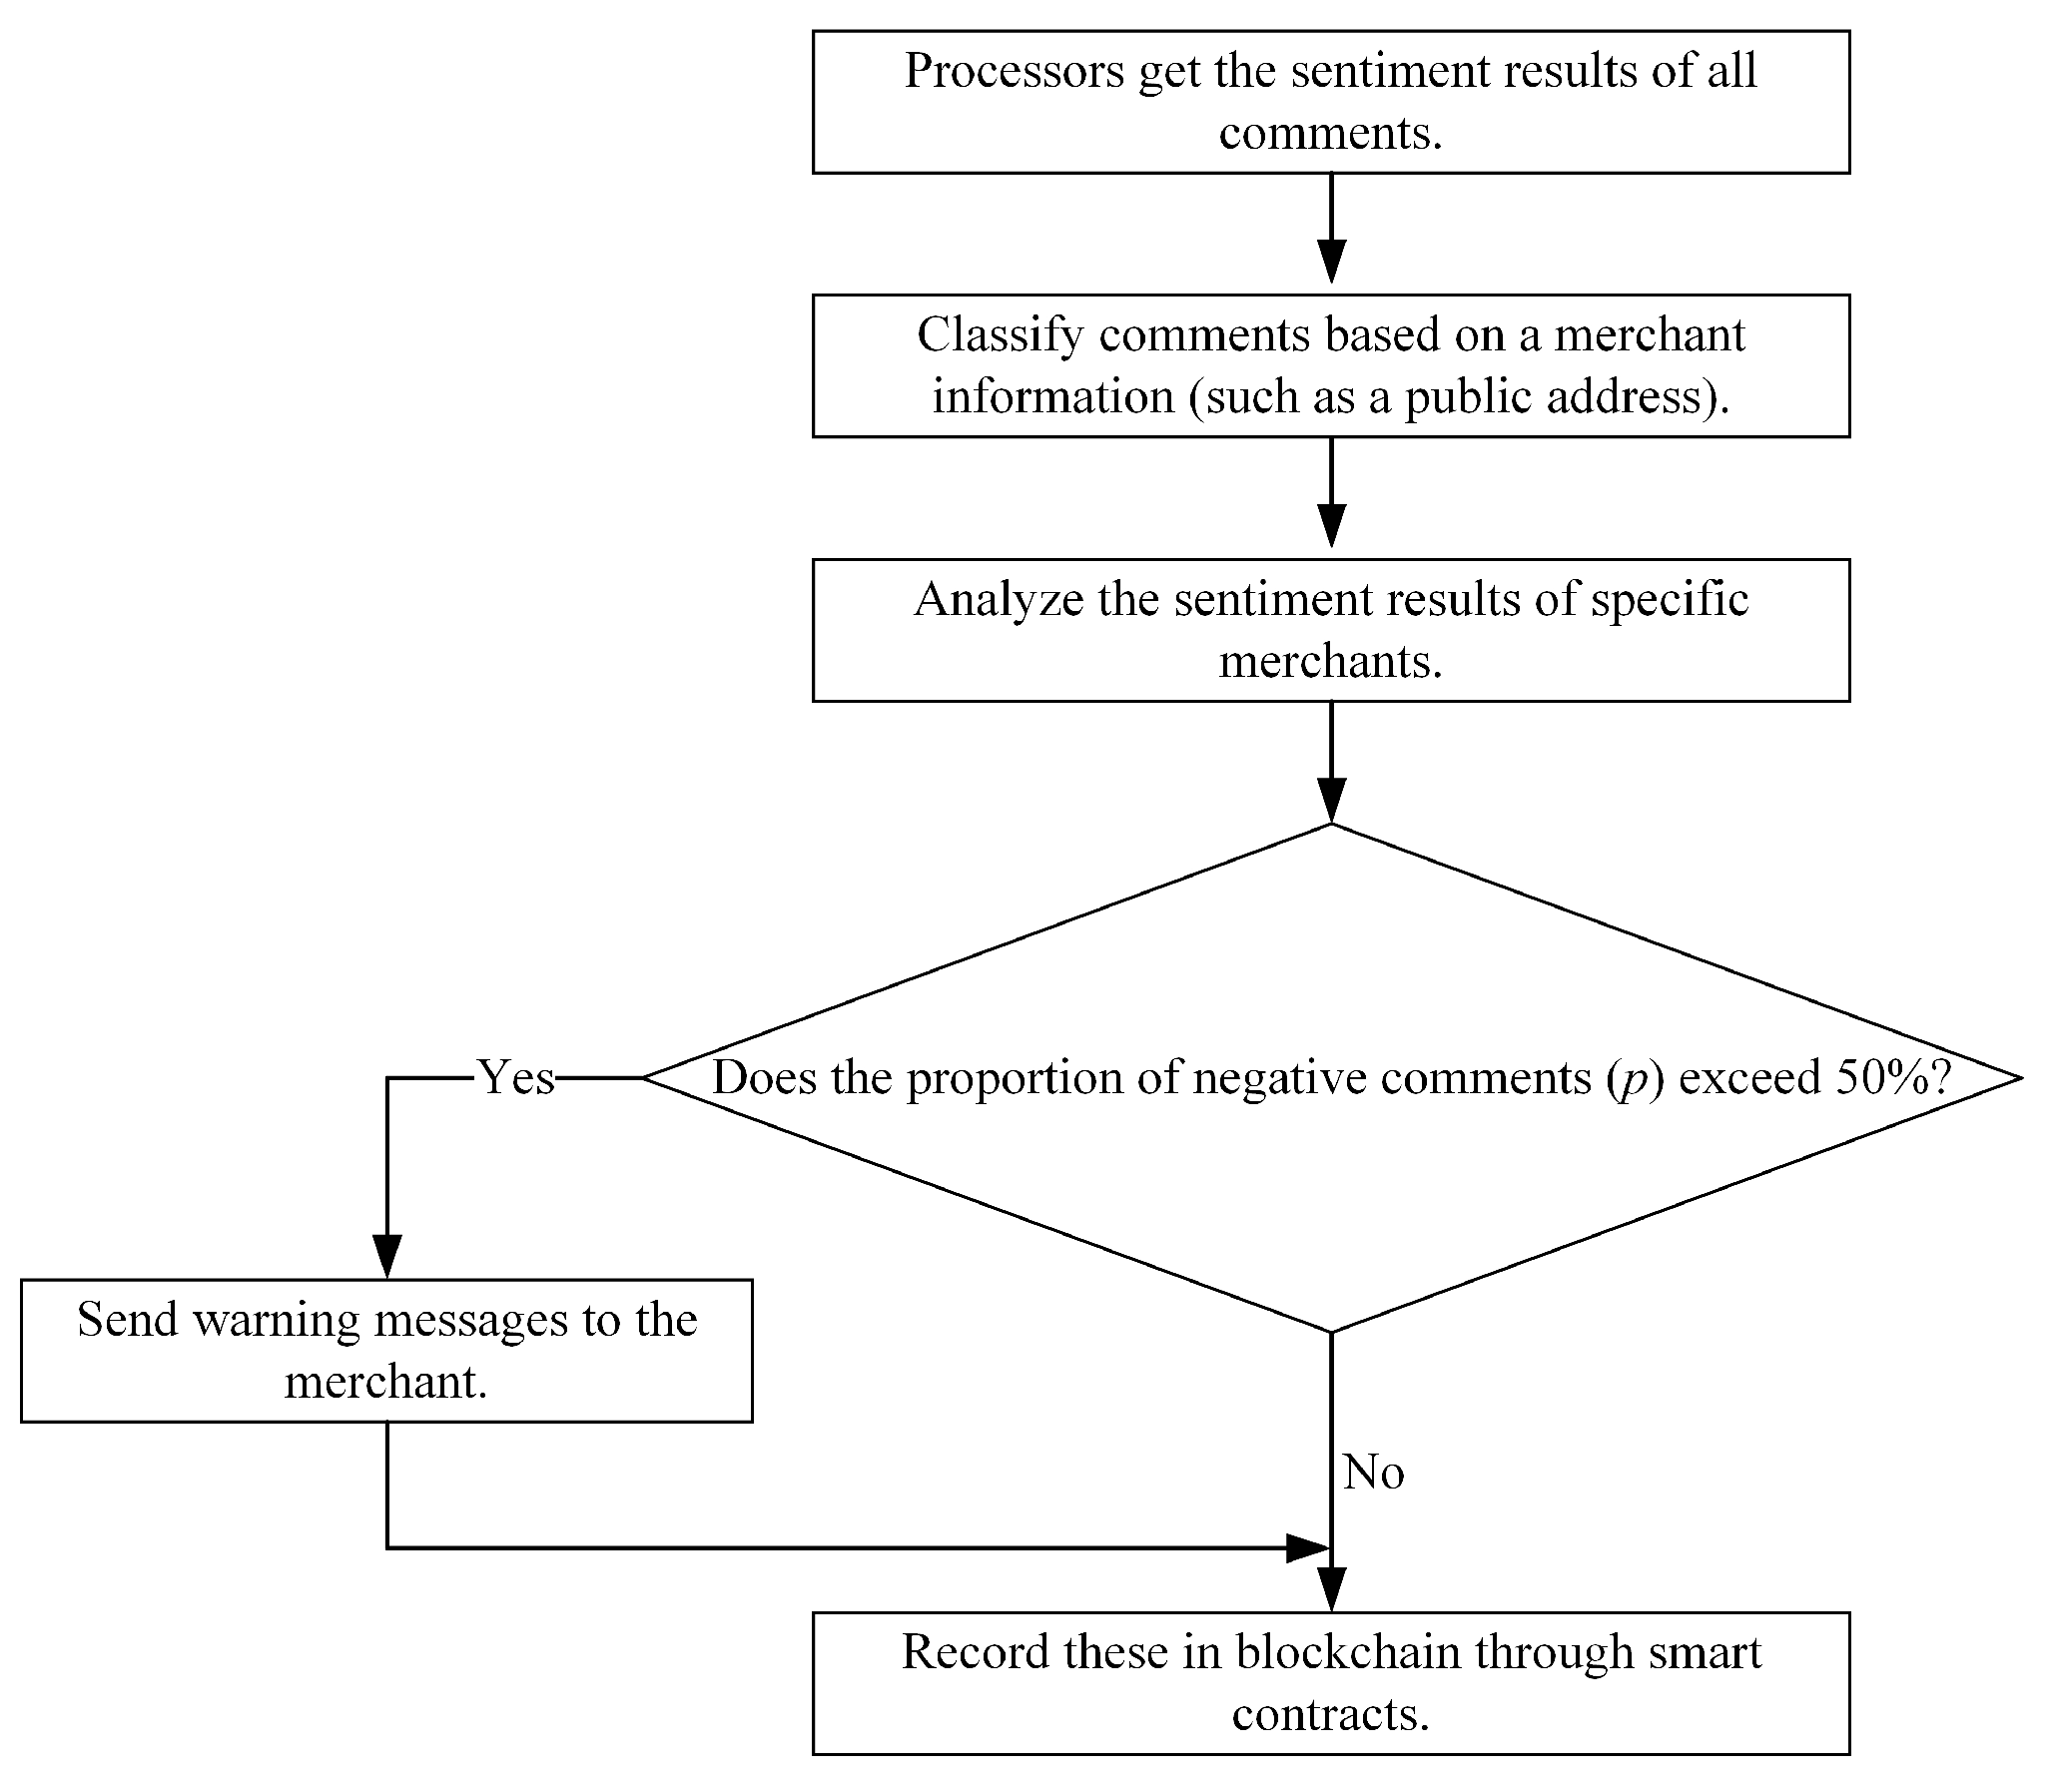
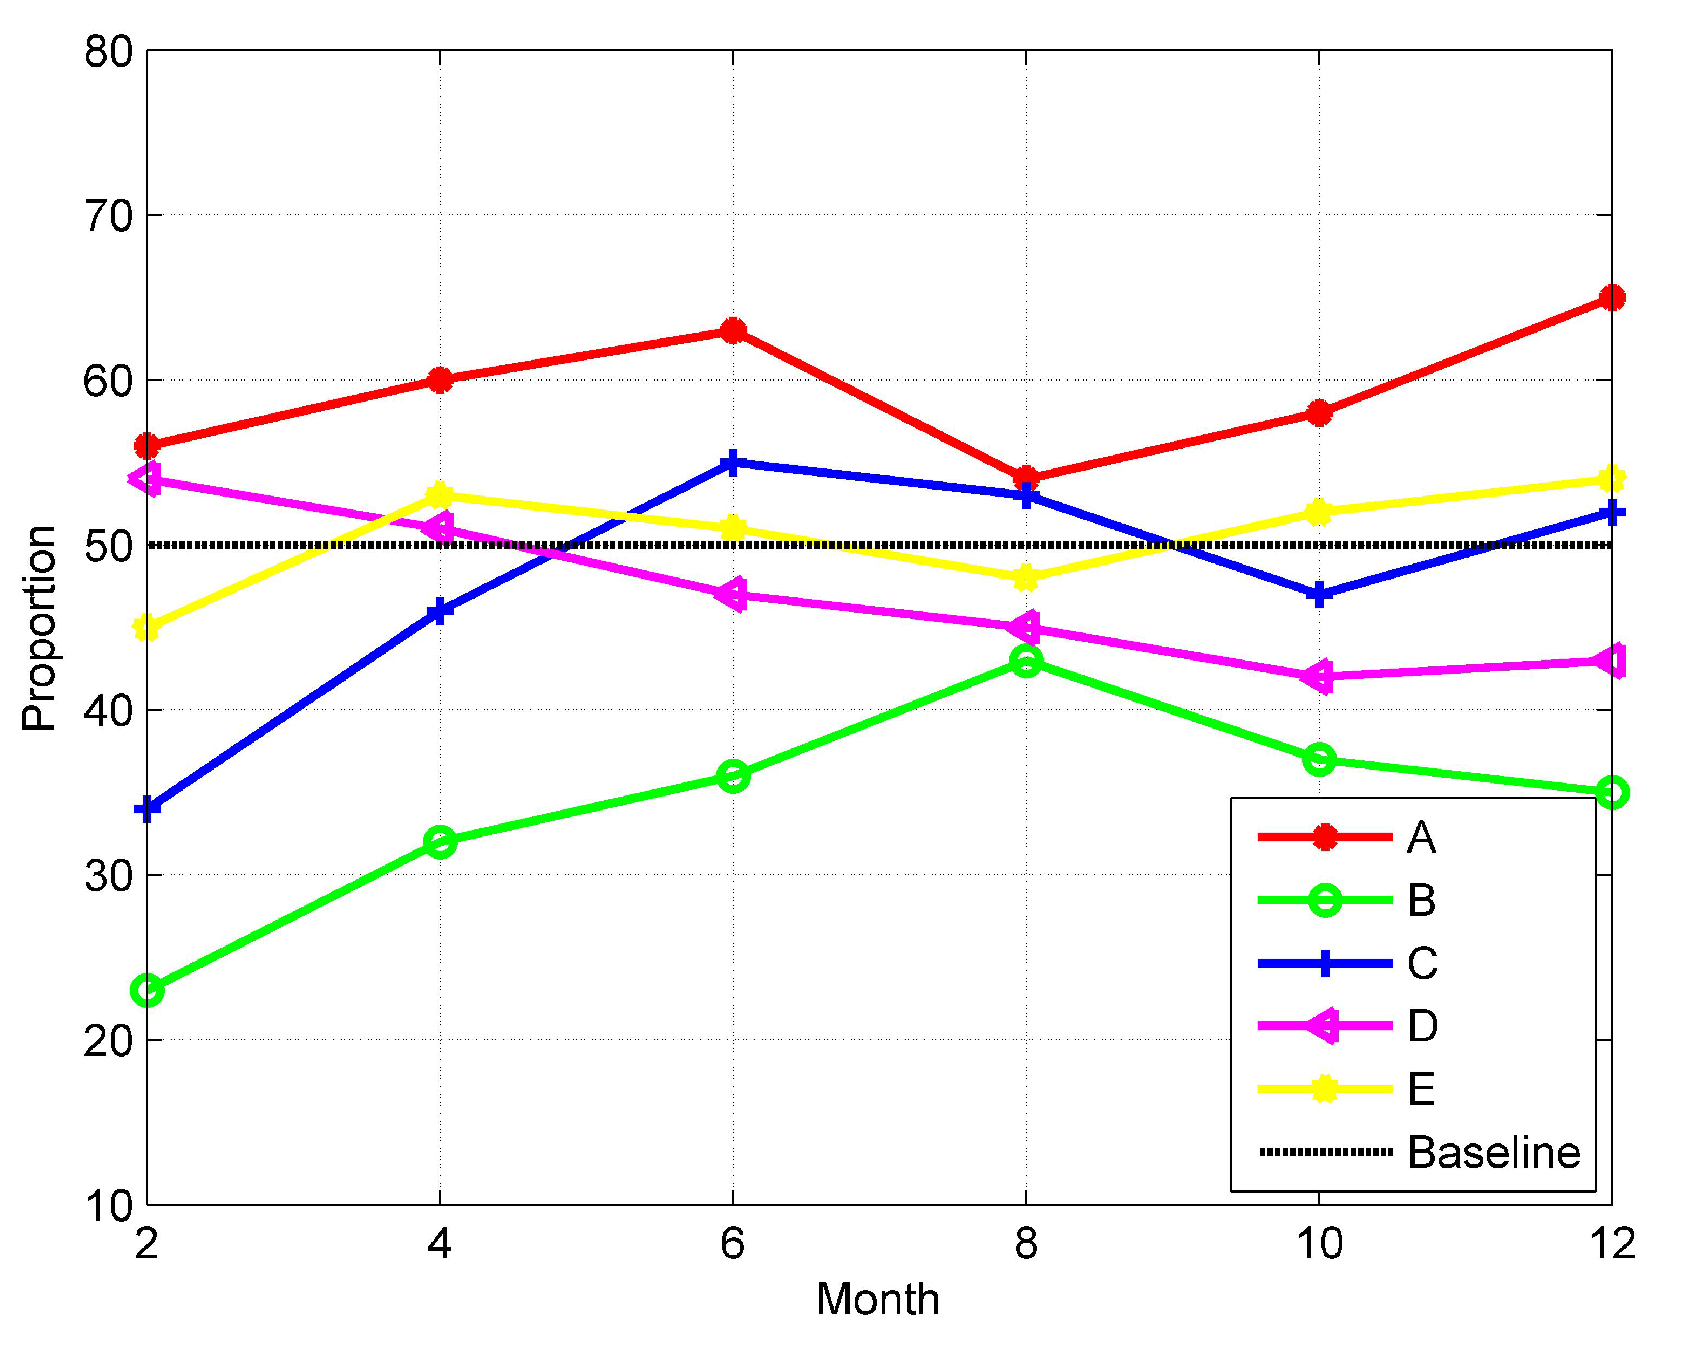
  • According to the results of sentiment analysis, the proportion of negative reviews can provide a basis and strategy for regulation. The case study proves the effectiveness of the method used for market regulation.
The remaining structure of the paper is organized as follows. The related work is discussed in Section 2. Section 3 presents the framework. Method implementation is described in Section 4, while Section 5 shows the results analysis of the experiments and a case study followed by a conclusion (see Section 6).

2. Related Work

Blockchain technology is considered a trustworthy technology due to its distributed and non-tamperable characteristics, such that it can be used to improve data credible. For example, Wang et al. [9] designed a smart contract that can be used for public cloud storage audits to ensure data integrity. In addition, since the use of blockchain replaces third-party auditors (TPA), this method can not only improve audit efficiency, but also ensure fair payments between users. Due to the great potential in trustability, it also has many applications such as privacy preservation [10], healthcare [11], the food industry [12,13], market [14,15] and so on. All of these used blockchain to ensure data reliability and security, where it can be used to improved regulations [16].
As a widely used existing data form, text data has received more and more attention from researchers because of its potential to reveal public opinion or social emotional trends. The data in social networks is the most used in researches. For example, Wang et al. [17] designed an interactive visualization system like [18], which can analyze public sentiment on popular topics. In order to obtain a better performance in sentiment analysis based on the data collected from Twitter, Wang et al. [19] focused on the fusion of textual information and sentiment propagation patterns using Twitter messages. Since sentiment analysis is a challenging new task related to text mining and natural language processing (NLP), it has quickly become a hot research topic in the field of deep learning. The application of deep learning in fields like speech recognition [20] and graphs [21] have made great breakthroughs, and the applications in NLP has also attracted more attention [22]. Collobert et al. [23] proved that a simple deep learning framework outperforms better approaches in multiple NLP tasks.
As part of NLP, deep learning models have also made great progress in sentiment analysis. The main idea of traditional machine learning methods (such as NB [24], SVM [25], etc.) is to train a part of the labeled text data in advance to obtain an emotional tendency classifier, and modify the model by continuously adjusting parameters to achieve a better performance. Then, the trained sentiment classifier can be used to classify the sentiment polarity of all texts. Different from this, Mahajan et al. [26] used Recurrent Neural Network (RNN) to analyze the sentiment tendencies in text data and Google Translate to improve accuracy. However, the traditional RNN has problems such as the disappearance of gradient and long-term dependence. In order to solve these problems, Hochreiter et al. [27] proposed LSTM, which is a special RNN with a chain structure that can accurately analyze sentiments. For example, Li et al. [28] used LSTM to effectively obtain complete sequence information, thereby achieving multi-classification of sentiment contained in text. In addition, LSTM also showed a good performance in sentiment classification on different language texts such as Chinese [29], Arabic [30] and so on. Moreover, idioms also play an important role in sentiment analysis. Features based on idioms can significantly improve the results of sentiment classification [31]. Spasi c ´ et al. [32] developed automated methods for sentiment analysis based on the characteristics of idioms and the effectiveness of the method has been proved. The use of idioms in different languages has also been tried. Pelosi [33] developed semantic-oriented sentiment analysis methods using Italian idioms. Ibrahim et al. [34] used idioms to analyze the sentiments contained in Arabic. The results obtained can show that these are all useful attempts.
Therefore, due to the remarkable features of blockchain technology, the excellent performance of LSTM and the unique effect of idioms in many research works, the combination of these can be used to provide a valid basis for regulation and improve sustainable development of the market.

3. Framework

As a data hosting platform, blockchain can ensure the reliability of data due to its distributed and non-tamperable features. Therefore, these trustworthy data can be used to feed the improved LSTM for data analysis to obtain creditable results, which is very important for regulation. In essence, the blockchain relies on modern P2P technology to achieve decentralized data sharing and storage. This feature enables any node in the network to view and access the data in the blockchain. According to this, the architectures for the proposed method include the following entities, as shown in Figure 1.
As shown in Figure 1, the proposed method mainly involves three types of entities: users/stakeholders, processors and regulators. Based on these three types of entities, the method mainly includes three modules, which are transaction execution and review completion, sentiment analysis and regulation based on the results. Based on these modules, the details of these entities can be described as follows.
Every transaction between nodes consists of a consensus among stakeholders. This function provides a more flexible and easier framework for the system we want to develop. The decentralized system runs on a blockchain-based virtual machine, allowing users to independently evaluate transactions and receive feedback about transactions through smart contracts triggered by the transactions. It can meet the needs of the users more quickly, and can integrate the work of regulatory agencies into existing systems at the lowest cost, which is more effective. Below, we will explain the proposed mechanism in more detail.
(1) Users are the main body of the transaction. They can implement transactions in the blockchain network, and then make reviews. After the transactions are completed, the relevant information is stored in the blockchain. Because the data in the blockchain is open and transparent, it can be viewed by all nodes in the network.
(2) Processors can use the improved LSTM model for sentiment analysis of the reviews information. According to the analysis results, they can send warning messages to problematic users. The related information about the warning messages and analysis results will be stored in the blockchain.
(3) Regulators can regulate the stakeholders. For problematic users, they can regulate them based on the information recorded in the blockchain, such as the number of warnings messages and the proportion of corresponding negative reviews.
All these roles exist in the blockchain network as nodes. The decentralized system allows user nodes to independently evaluate transactions and receive feedback about transactions through smart contracts. This can meet the various needs of different users more quickly and integrate the work of the regulatory agencies into the systems at a low cost. Every transaction between nodes consist of a consensus process among stakeholders. This function provides a more flexible framework for the proposed system, and the operations involved are transparent, which is conducive to efficient management and regulations, in order to reduce transaction risks such as fraud.
Based on these three types of objects, the proposed system consists of specific modules as follows.
Stakeholders participate in the transaction process as traders. After the transaction is completed, the trader can evaluate the transaction and make reviews, as shown in Module 1 of Figure 1. In this process, the trader’s information and related information are stored in the shared ledger. Once the evaluation is completed, sentiment analysis is required, as shown in Module 2. This is mainly aimed at the processors, who regularly collect information from the ledger, and use the trained the improved LSTM model to analyze the hidden sentiment tendencies from the review information. According to the analysis result of the emotional tendency, processors can send warning messages to remind the users to make improvements. Module 3 is implemented for the regulation. Regulators can regulate users according to the warning messages and sentiment analysis results. Through this method, it can strengthen regulation and ensure the fairness of the market, it also saves a lot of work and time costs.

4. Method Implementation

The system includes two main components and entities as we mentioned above. Both, the platform for the components and entities are based on Ethereum, which is an open source public blockchain platform with smart contract functions. The simplicity of the protocol and the modular design of different parts ensure that the development and maintenance costs of Ethereum are low. Therefore, it is considered one of the most popular blockchain development platforms [35]. It implements different methods, functions, and variables in the executing process by smart contract, where the entities of traders and regulators acquire different authentication and permission.

4.1. Transactions and Reviews Based on the Blockchain Network

Blockchain technology simplifies the process to transfer values through its network architecture and its virtual electronic currency. More specifically, let N = { n 1 , , n j } represents the number of transactions. Users can be defined as u such that u i represents the user with number i and the ledger state of u can be expressed as S u . In a blockchain network, a completion of transaction is divided into the three steps.
  • u 1 sends a message to the blockchain network and defines a transaction n j in the message;
  • u 2 accept the n j by broadcasting;
  • Participants in the blockchain verify the legitimacy of the transaction and the transaction is committed.
Here, the state function of transaction N can be defined as γ . The execution of the transaction will change the ledger state S u to S u for user u, as shown in Equation (1).
S u = γ ( S u , N )
A valid transaction decision needs to meet the conditions as Equation (2) shows.
u ( N ) = S u [ u ( N ) ] n o n c e n S u [ u ( n ) ] b a l a n c e
u ( N ) and u ( n ) are initiators of transactions N and n , n o n c e can be considered as the number of transactions recorded. It is used to guarantee the orderliness of the transactions. Thus, S u [ u ( N ) ] n o n c e is the current state for u ( N ) . If the transaction n is successful and the transaction information is recorded in the ledger, the state can be considered to have reached a b a l a n c e . In contrast, if the transaction n fails, it is necessary to implement the rollback. These operations will facilitate the next transaction.
After the transaction is completed, participants trigger the smart contract to review based on their subjective feelings about the product or the transaction process. After that, the review from the transaction participants will be written in the block, and become a part of the ledger after passing the consensus process between nodes in the network. The transaction N is assumed to have been successfully completed. Then, the review should be collected from users u 1 and u 2 . This process is implemented through smart contracts, as shown in Algorithm 1.
Algorithm 1: Participants to finish the review of the transaction.
Jtaer 17 00001 i001
After the users complete the operation about the review, processors need to perform further processing according to these reviews to obtain the proportion of emotions hidden. The result of the proportion can provide a basis for the sending of warning messages from the processor and the regulation from the regulators. The process for the processor to obtain the corresponding results is shown in Algorithm 2.
In Algorithm 2, the improved LSTM is used as a tool to conduct sentiment analysis of the reviews. Compared with traditional methods, it not only considers the text content, but also includes content characteristics, which is suitable for text data analysis.
Algorithm 2: Obtaining sentiment analysis results.
Jtaer 17 00001 i002

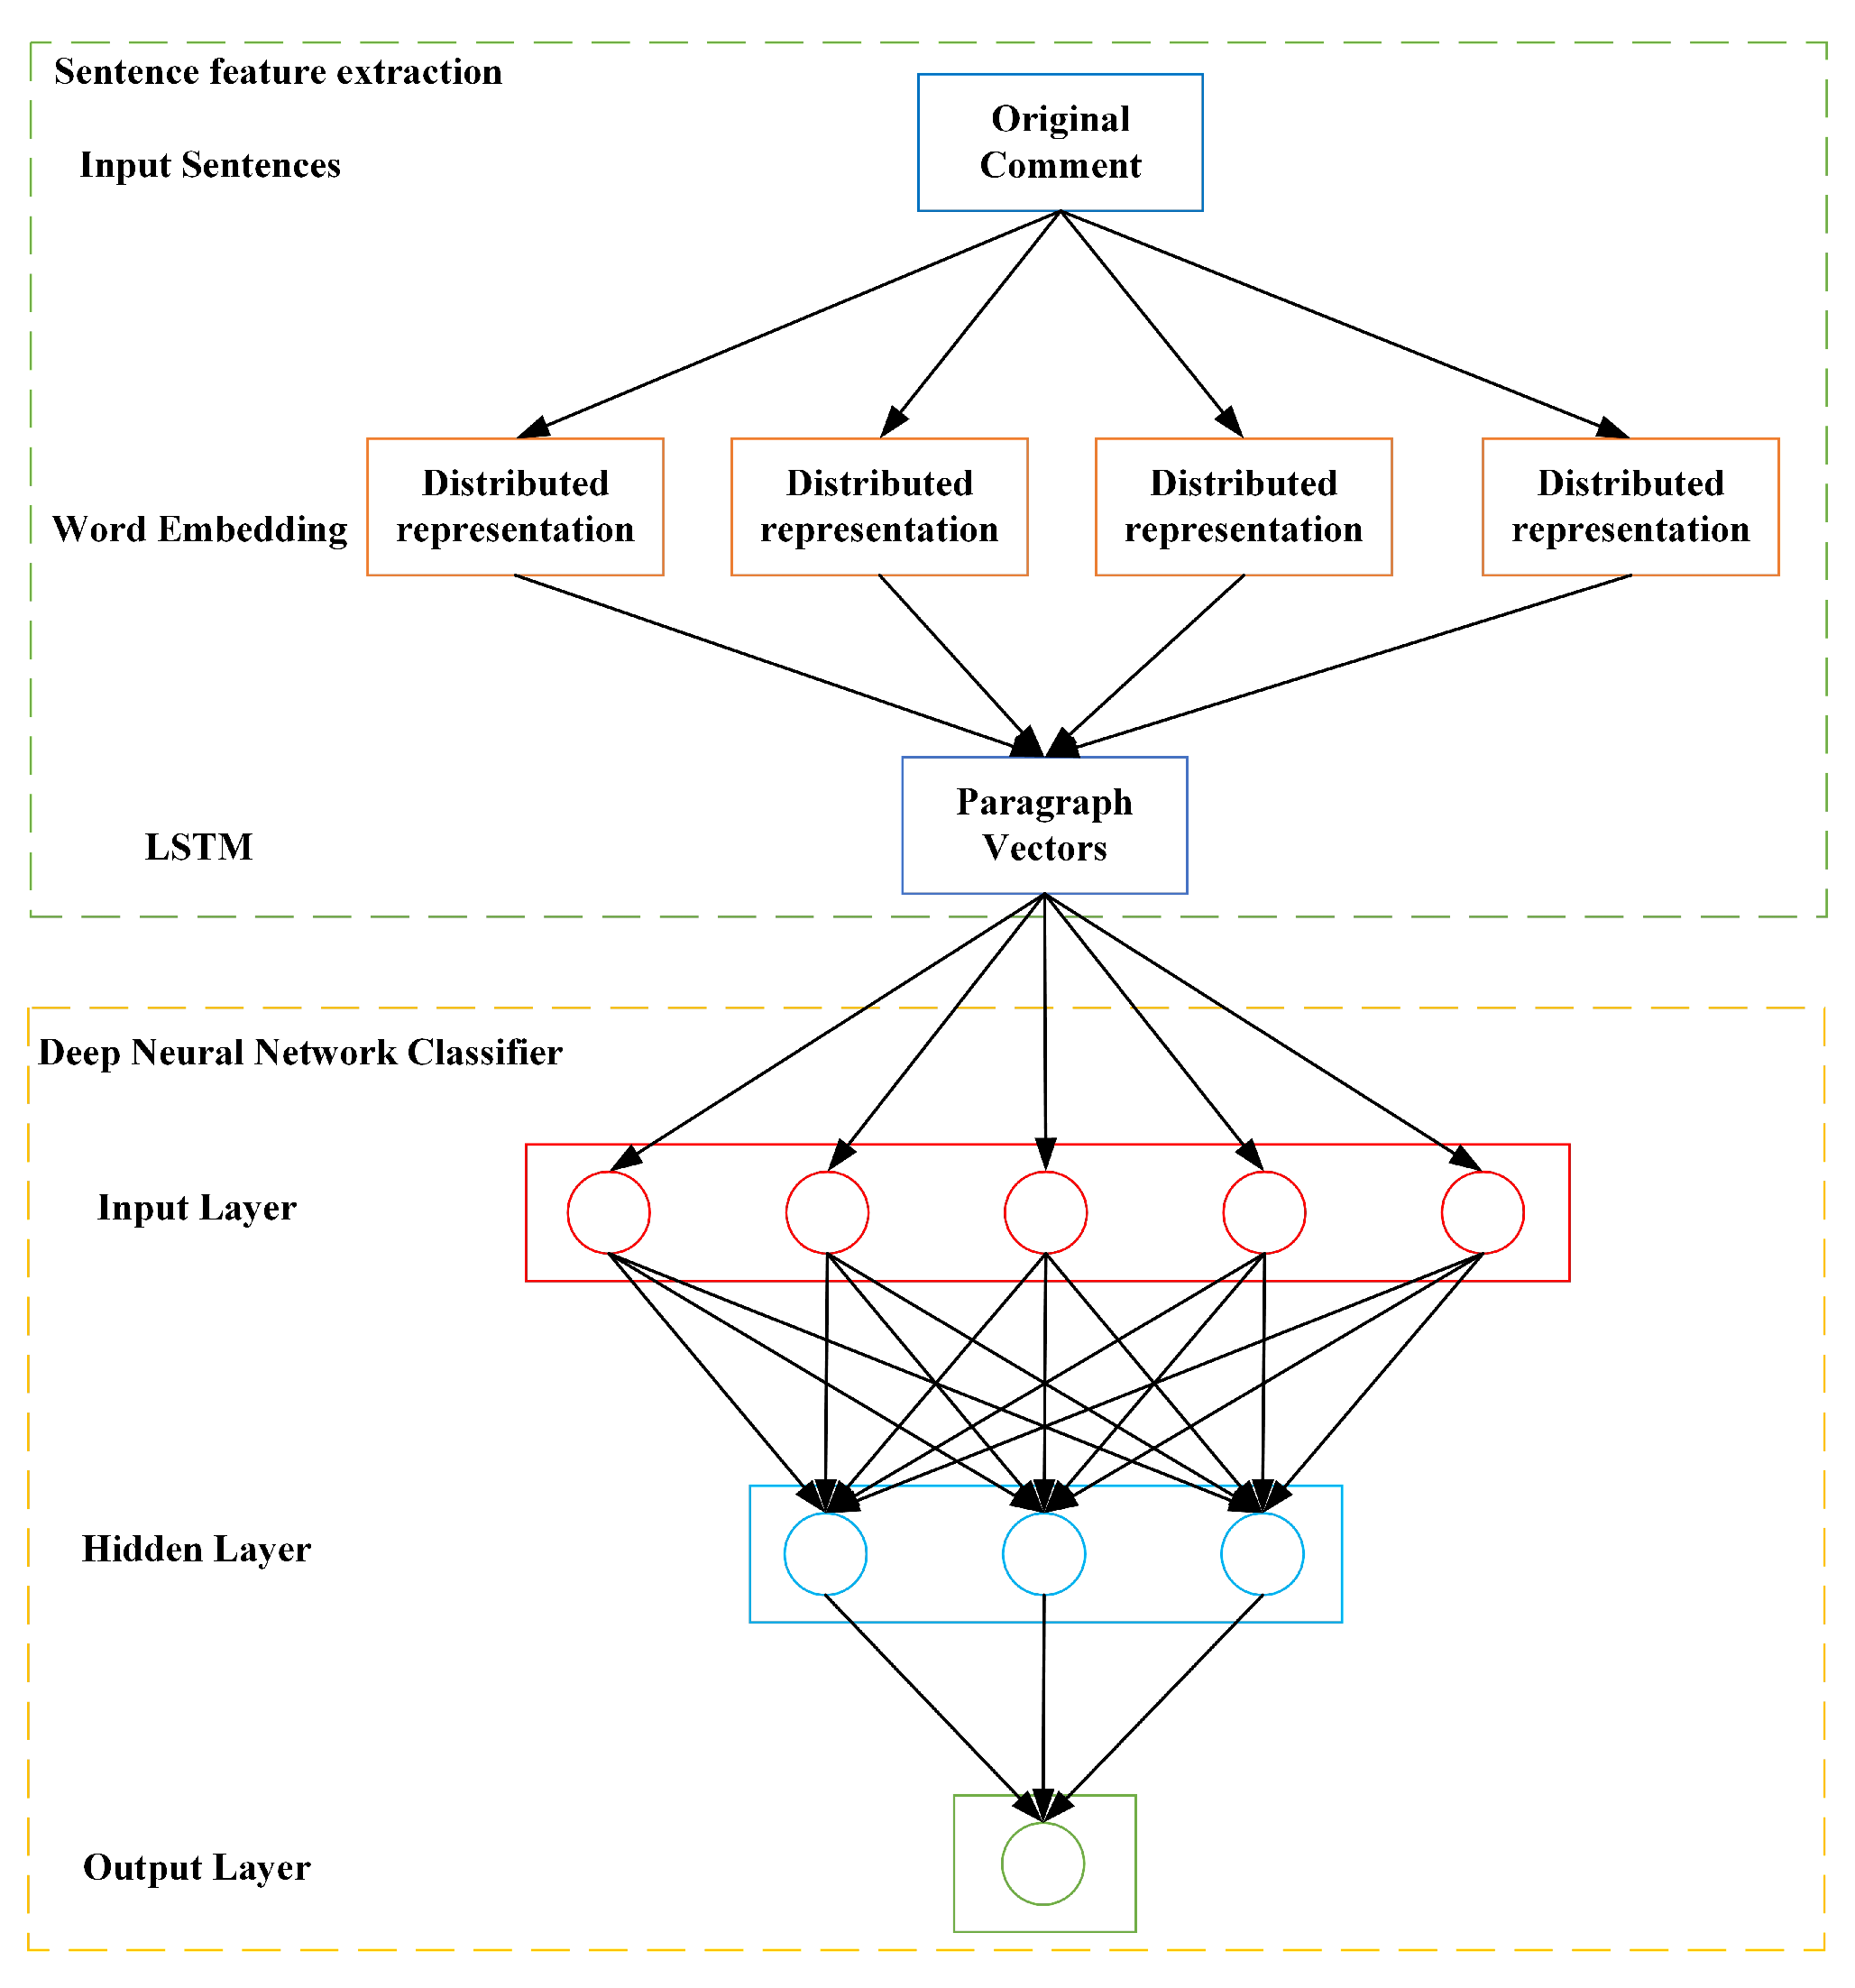
4.2. Sentiment Analysis

The improved model is based on LSTM, which has four neural network layers, and each network layer interacts with others in a special way. The schematic diagram of the LSTM network structure is shown in Figure 2.
LSTM has three kinds of gates, which are the input gate, forget gate and output gate, respectively. These gates can be used to protect and control the state of the cell. Here, i t , f t , o t and c t can be represented as the gate structures and units of the states at time t. The first step is to decide which information from the previous unit needs to be discarded, which is determined by a sigmoid output layer (forget gate). This means that the input x t of the current layer and the output h t 1 of the previous layer need to be taken as input, and then the cell state output f t at time t 1 is shown in Equation (3). Here, the sigmoid function model is shown in Equation (4).
f t = σ ( W f · x t + W f · h t 1 + b f )
σ ( x ) = ( 1 + e x ) 1
It is necessary to decide which new information needs to be stored. This can be divided into two parts. First, a sigmoid layer determines which values need to be updated (input gate). Then, a vector is created by the tanh layer, where it contains the new information to be added that can be added to the new cell state. Afterwards, cell states can be updated by combining these two parts. As shown in Equation (5), the result i t of the input gate is used as the information to be updated, where the vector c ˜ t created by the tanh will be added in the cell state like Equation (6) shows. Multiplying the old cell state c t 1 by f t can be used to forget the information. This completes the update of the cell status together with the new candidate information i · c ˜ t in Equation (7).
i t = σ ( W i · x t + W i · h t 1 + b c )
c t ˜ = tanh ( W c · x t + W c · h t 1 + b c )
c t = f t · c t 1 + i · c t ˜
The output gate is used to decide the information about the state of the cell to be outputted like Equation (8) shows. Then, using tanh to process the cell state, the product of the two parts from the information is the information to be outputted, as shown in Equation (9).
o t = σ ( W o · x t + W o · h t 1 + b o )
h t = o t · tanh ( c t )
The sentiment classification model can be built based on LSTM to process reviews text, and its structure is shown in Figure 3. The main features of the LSTM model can be divided in two parts, which are sentence feature extraction and deep neural network classifier, respectively.
Sentence feature extraction. LSTM supports a dataset consisting of formats such as text and image. For the proposed method, this part focuses on the extraction of features from the data, which is collected by Algorithm 1. By extracting the features, the arbitrary text data can be transformed into numerical features usable for machine learning through the LSTM model.
Deep Neural Network Classifier. The implementation of sentiment analysis for text in the LSTM model depends on the LSTM cell. The classifier uses the feature extraction of the reviews data as input in the system. And the output gate controls the extent to which the value in the cell is used to compute the output activation of the LSTM.
Since the review is mostly short text, and each user’s language habits are very different. Before text classification, pre-processing is required to remove a large number of irrelevant symbols, and at the same time to count the word frequency. The statistical results show that the most frequent occurrences in the text are adverbs, which have nothing to do with emotional expression. Therefore, word segmentation tools such as NLTK [36] has been used to remove irrelevant stopwords after part-of-speech tagging. The corresponding stop word list is shown in Table 1. The pre-processed text is used as input, and the text is changed into a distributed stored word vector. In order to prevent the model from overfitting, Dropout is used in the LSTM network for optimization [37]. It averages the results from different models with certain weights. In the training process of each batch, because the hidden layer nodes that are randomly ignored each time are different, the network used for training is different, such that it can be regarded as a different model. Different models are trained on different training sets (each batch of training data is randomly selected), where each model is processed with the same weight to reduce overfitting. Through this procedure, the model not only processes complex reviews, but also increases its applicability.
In reality, idioms are used in reviews to express certain emotions like Table 2 shows. Since the model considers that the meaning of any phrase can be synthesized from the words composed of it when modeling the sentence, for non-synthetic phrases such as idioms, the model may cause sentiment analysis errors due to unreasonable analysis. Based on this, we propose an LSTM network that can be integrated into the idiom information. An external memory component is introduced to memorize idioms, which is a matrix and each row corresponds to the semantics of the idioms. In the process of recursive synthesis of sentences, if a certain phrase is an idiom, its corresponding representation can be retrieved directly from the external memory. For phrases that are not idioms, they are still processed according to the original synthesis method. For a phrase τ in a sentence, h τ is used to represent its corresponding vector. As shown in Equation (10),
h t = h τ i d , if τ is idiom i d h τ o r i g i n a l , otherwise
where h τ o r i g i n a l represents the vector obtained by τ through the original synthesis method, and h τ i d represents the vector of an idiom meaning directly read from the external memory. This dual-channel structure has many advantages. On the one hand, it makes the model have a more powerful representation capability, while on the other hand, it enhances the expansibility of the model to facilitate the introduction of external knowledge.

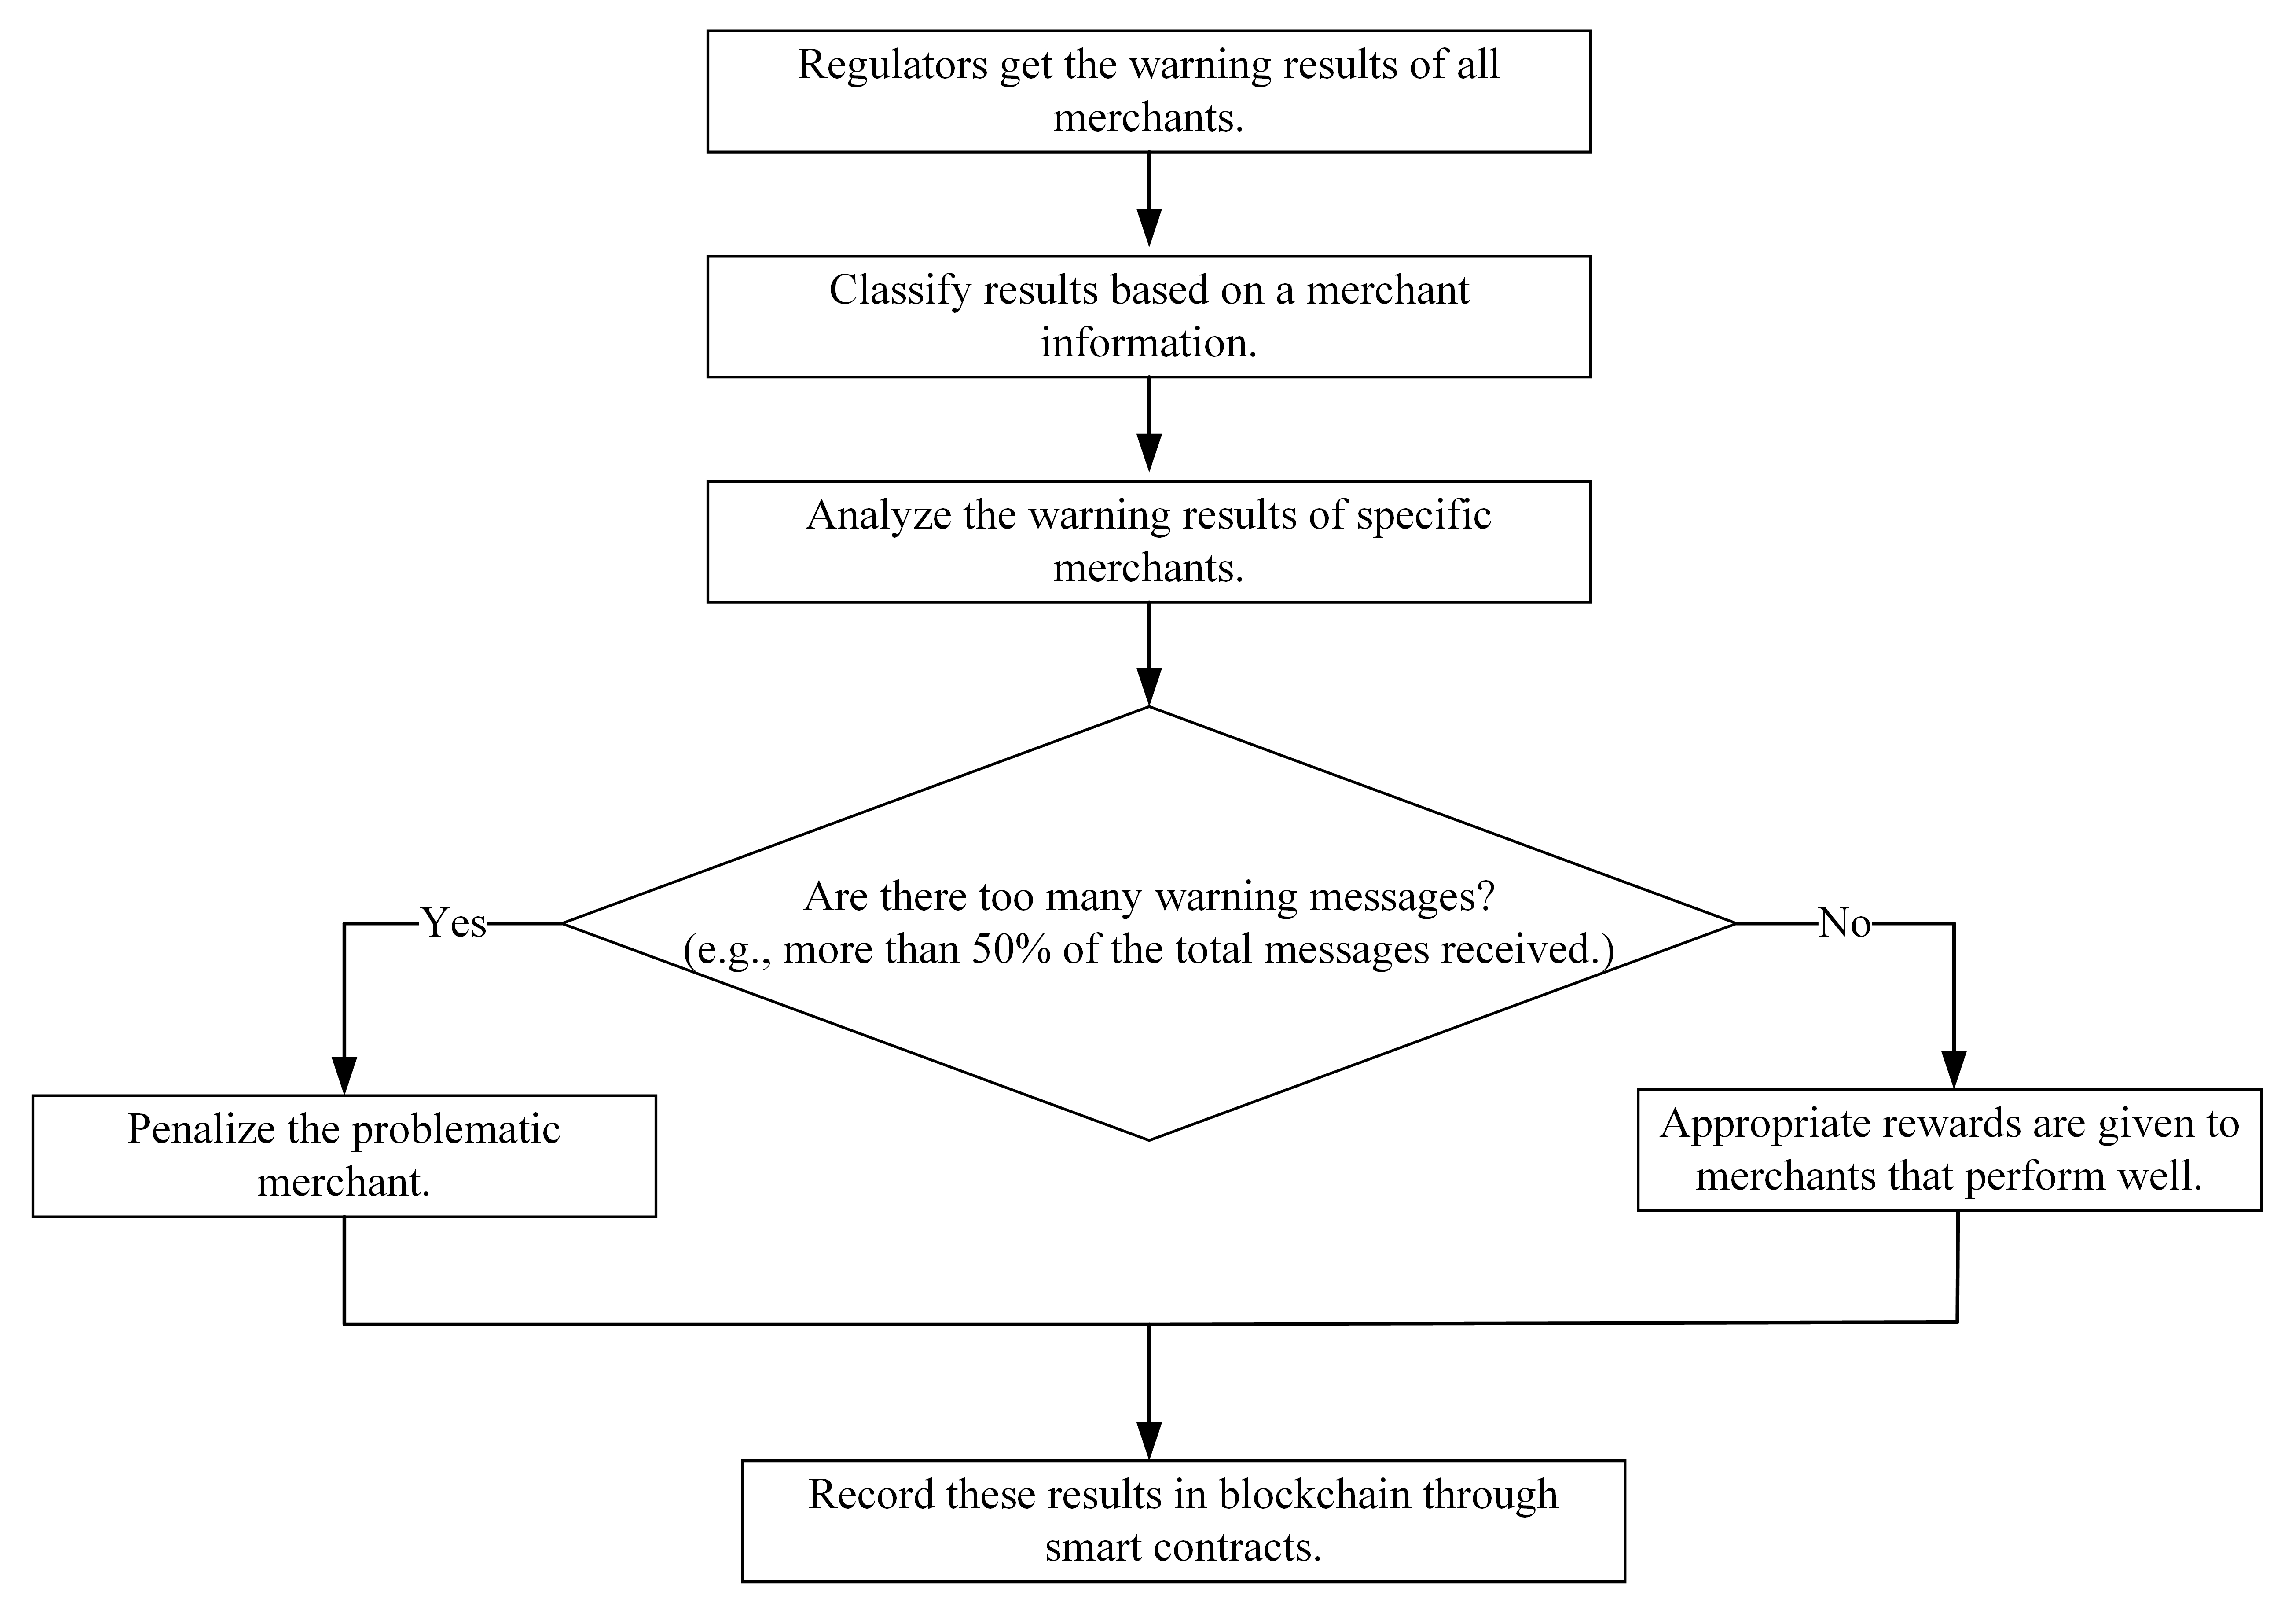
4.3. The Process of Warning and Regulation for Problematic Merchants

After processing the reviews information, processors will collect the results of the sentiment analysis that occurred in a certain period of time (the sending period is set by the processors, e.g., warning messages can be sent every two months). Here, warning messages can be sent to the problematic merchants based on Equation (11). N n e g signifies the number of negative messages and N n e g represents the number of positive messages. The proportion is p. The detailed process is shown in Figure 4. The warning message is mainly composed of three parts, which are the sending time, the product information and the proportion of related reviews. Merchants can manage products related to negative reviews based on the warning information to improve their reputation and reduce negative reviews that will occur in the next period of time.
p = N n e g N n e g + N p o s × 100 %
The warning messages can provide a basis for the regulation. Since the system is set to send warning messages every two months, the processor will send warning messages six times within a year. Hence, whether the merchant is improving can be determined by the number of occurrences and the trends of the warning messages received by merchants. Merchants with more warning messages can be regulated to ensure a fair market environment. The detailed process is shown in Figure 5.

5. Experiments

5.1. Experimental Environment and Data

Since there are different entities in the regulation process in reality, some nodes with different permissions are required. Therefore, the nodes in the blockchain network can be divided like [8]. The nodes set s in the blockchain network can be divided into three groups s 1 , s 2 and s 3 , which correspond to the functions of traders, processors and regulators, respectively. The Ethereum blockchain is used as the infrastructure for executing smart contracts. It has provided related tools to build the platform and can be deployed on multiple virtual machines running Ubuntu Linux v16.04 in an Openstack environment. Each virtual machine is given 1 virtual CPU core, 2 GB of memory, and 10 GB of persistent storage to meet the minimum hardware requirement for running Ethereum, and all virtual machines are linked together in a low-latency local network. Every node uses a single Gigabit Ethernet switch, and a communication round-trip time between every two nodes is less than 1 ms on average due to this setup. The Python Web3 Library was used to monitor the network behaviour and block-related information was accomplished using Elastic Search. In addition, Geth v1.6.4 10 has been used for empirical evaluations. In order to get a stable and fully-connected P2P network of blockchain, the feature of auto-discovery supported by Geth needs to be disabled and manually configured to overlay the network. In order to obtain appropriate parameters, the system needs to be stabilized for several hours before the actual experiment. Moreover, smart contracts can be used as carriers for reviews data, with the programming language being Solidity. A Remix integrated development environment (IDE), Ganache and Metamask were used to evaluate the performance. Remix is used to compile and test smart contracts. Ganache is used to provide predefined cryptocurrencies and to deduct the cryptocurrency from the accounts that finish the transactions. Each account corresponds to a node in the network. Metamask as an extension in the browser acts as a bridge between Ganache and Remix IDE to help them connect.
In order to verify the performance of the proposed method, the reviews data generated by nodes in the simulated blockchain network are used in the experiments. The data set can be divided into English and Chinese, where its use can test the adaptability of the method in the review data coming from different languages. The English data set comes from [38,39,40], and the Chinese data set is collected by [41,42]. After filtering the raw data set, there are a total of 179,396 pieces collected. In order to reduce the error occurring in the experiments, the number of Chinese and English data sets are set to be the same (both are 89,698). The data are stored in the blockchain before being used. In the dataset, a review may include many emotional features. The review’s emotional information can be considered as dualistic here, that is, positive and negative. In the experiments, positive reviews are marked as 1 and negative reviews are marked as 0. All of these have been tagged before the experiments were conducted. For the Chinese and English data set, the number of positive reviews is 47,250 and the number of negative reviews is 42,448.
The improved LSTM model is used to analyze sentiment. The experiment used the Keras [43] as the structure of the proposed model. Keras is a deep learning library for Python, and it provides a large number of deep learning models. It basically realizes the current popular deep learning models, where Python is used to perform data operations for sentiment analysis. For the improved LSTM model, the dataset is randomly divided into training and validation sets. The ratio of the training data set to the validation data set will affect the experimental results. Therefore, in order to obtain better training results, the ratio is set to 7:3. In addition, data preprocessing is required. All reviews data can be defined as a set S, which consists of a separate evaluation text sentence [ s 1 , s 2 , s 3 , …, s a ]. A vocabulary is required to construct the reviews text data set, such that the word segmentation, is needed to divide the text sequence into individual words. It has the advantage of an user-defined dictionary to add words that are not in the lexicon such as idioms. After that, using the Google open source tool Word2vec to build a dictionary of word vectors to realize the data vectorization, the word vectors for each sentence is expressed as [ v 1 , v 2 , v 3 , …, v a ]. The size of the vocabulary is 32,987, which is the number of different words in the data set, and the word vector dimension is 100. Using the Tensorflow [44] framework to achieve the establishment of the improved LSTM model, the main structure includes the Embedding layer, LSTM layer and Dense layer.
The Embedding layer allows 32,987 vocabularies to be entered. After processing such as dimensionality reduction, the dimension of the word vector finally outputted in the Embedding layer is 100, that is, the input dimension of the next LSTM layer is determined to be 100. In addition, the size of the hidden layer state of the LSTM layer is 64 and the Dense layer uses 1 neuron to fully connect with the LSTM layer. The input and output of the Embedding layer determines the shape of the LSTM layer and the Dense layer. The weight between each layer matrix U, W, V of the input layer sequence ( x t ), output layer sequence ( o t ), hidden layer state (hidden state ( h t ) and cell state ( c t )) of the improved LSTM neural network model can be expressed by Equations (12) and (13) respectively.
x t R 100 o t R 100 h t R 128 c t R 128
U R 64 × 100 W R 64 × 64 V R 100 × 64

5.2. Experimental Results and Discussion

5.2.1. Metrics for Evaluation

In order to test the performance of the LSTM network in sentiment analysis. First, the training data set can be used to train the LSTM model for the results of sentiment analysis. In order to verify the validity of the model and evaluate its performance, the model is then tested using the validation data set. Four metrics can be used to evaluate the results of sentiment analysis, which are Accuracy, F1-score, AUC and loss value, respectively. Accuracy is a ratio of correctly predicted observations to the total observations as shown in Equation (14).
A c c u r a c y = T P + T N T P + F P + F N + T N
F1-score is the harmonic average of the recall and precision as shown in Equations (15) and (16). It reaches its best value at 1 (perfect precision and recall) and worst at 0. As shown in Equation (17), it considers both false positives and false negatives.
p r e c i s i o n = T P + T N T P + T N + F P
r e c a l l = T P + T N T P + T N + F N
F 1 s c o r e = 2 ( T P + T N ) 2 ( T P + T N ) + ( F N + F P )
TP (True Positives) and TN (True Negatives) represent the correct training results, that is, the obtained emotional result is the same as the actual emotional tendency contained in the data. FP (False Positives) and FN (False Negatives) represent the incorrect result, for example, the tendency of sentiment in the data is negative (positive), but the prediction result is positive (negative).
Area Under the ROC Curve (AUC) is a numerical representation of the Receiver Operating Characteristic (ROC) curve. The x axis of the ROC curve is True Positive Rate (TPR) and the y axis is False Positive Rate (FPR). They can be calculated by Equations (18) and (19).
T P R = T P T P + F P
F P R = F P T N + F P
TPR represents the probability that the model classifies the samples that are actually true, and FPR represents the probability that the samples that are actually false are predicted to be true. ROC curve is a commonly used evaluation index in classification problems. However, because the ROC curve does not directly represent the performance of the model, it is necessary to use the AUC value to quantify the area under the ROC curve to more intuitively observe the model performance of the binary classification problem. The AUC value ranges from 0.5 to 1.0, the larger the value, the higher the accuracy.
The process of training a network needs to find the parameters that can minimize a loss function. Loss usually occurs during the training process to find the best parameters, such that it needs to be constantly updated to optimize it. The cost function is essentially binary cross entropy. For a target T and an output O, it can defined as Equation (20).
f ( T , O ) = [ ( 1 T ) log ( 1 O ) + T log O ]
In the training process, the smaller the loss the lower the prediction error and the better the performance. The average loss value can be obtained by the loss values from the training model at each stage.

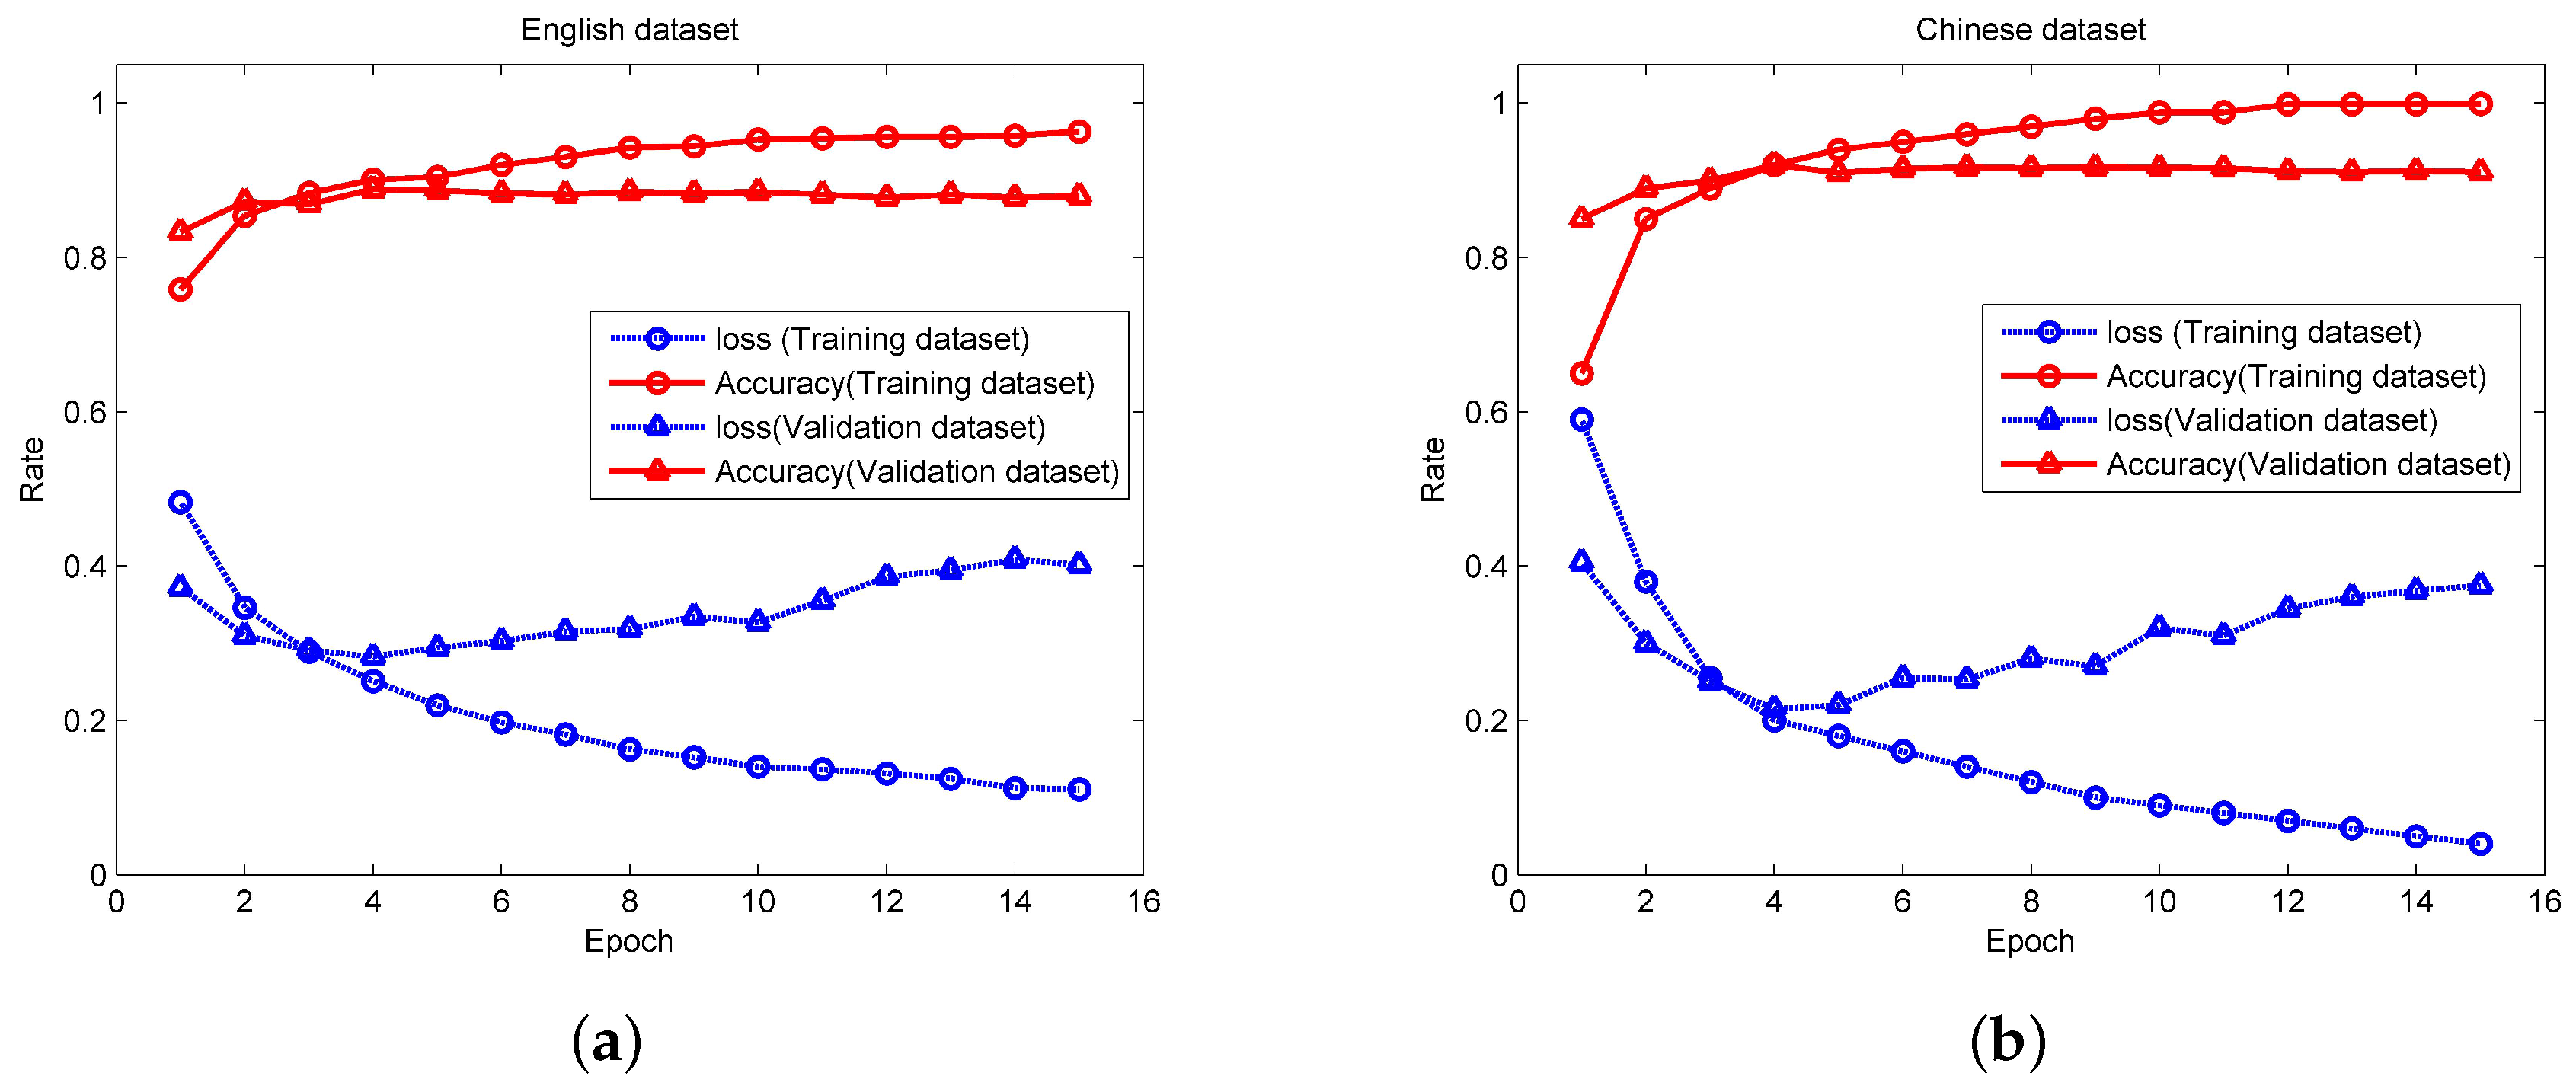
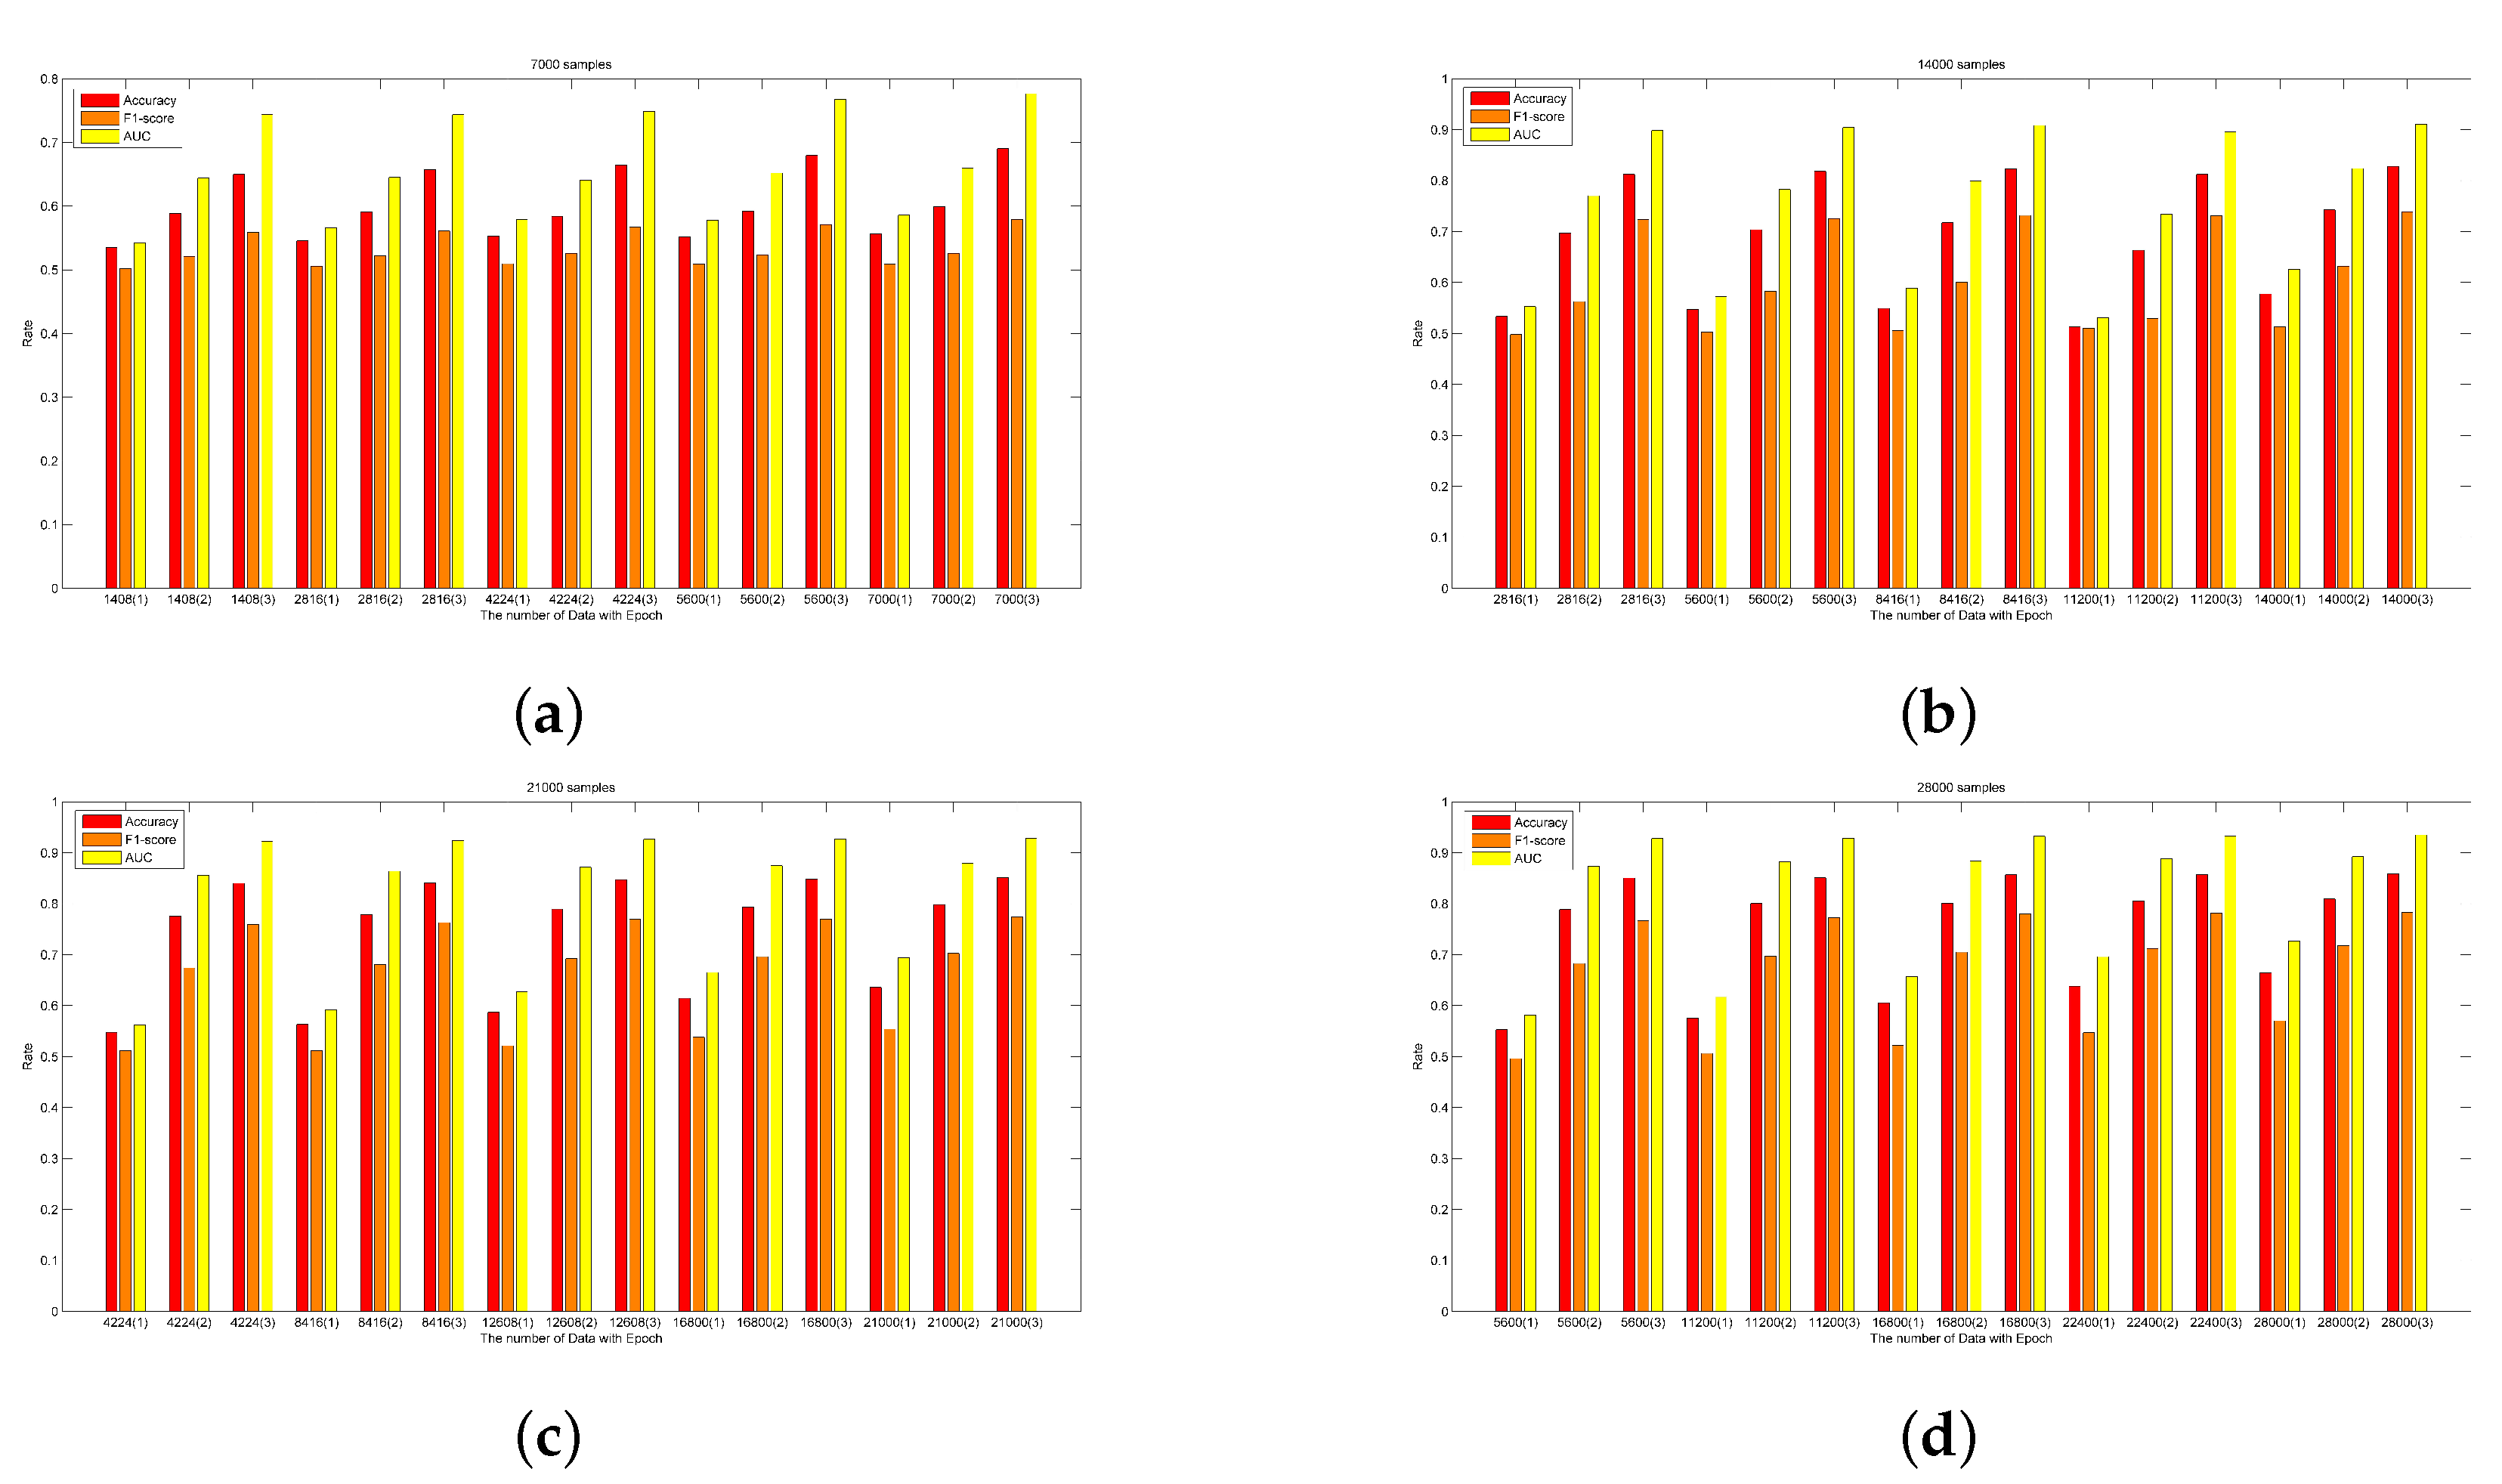
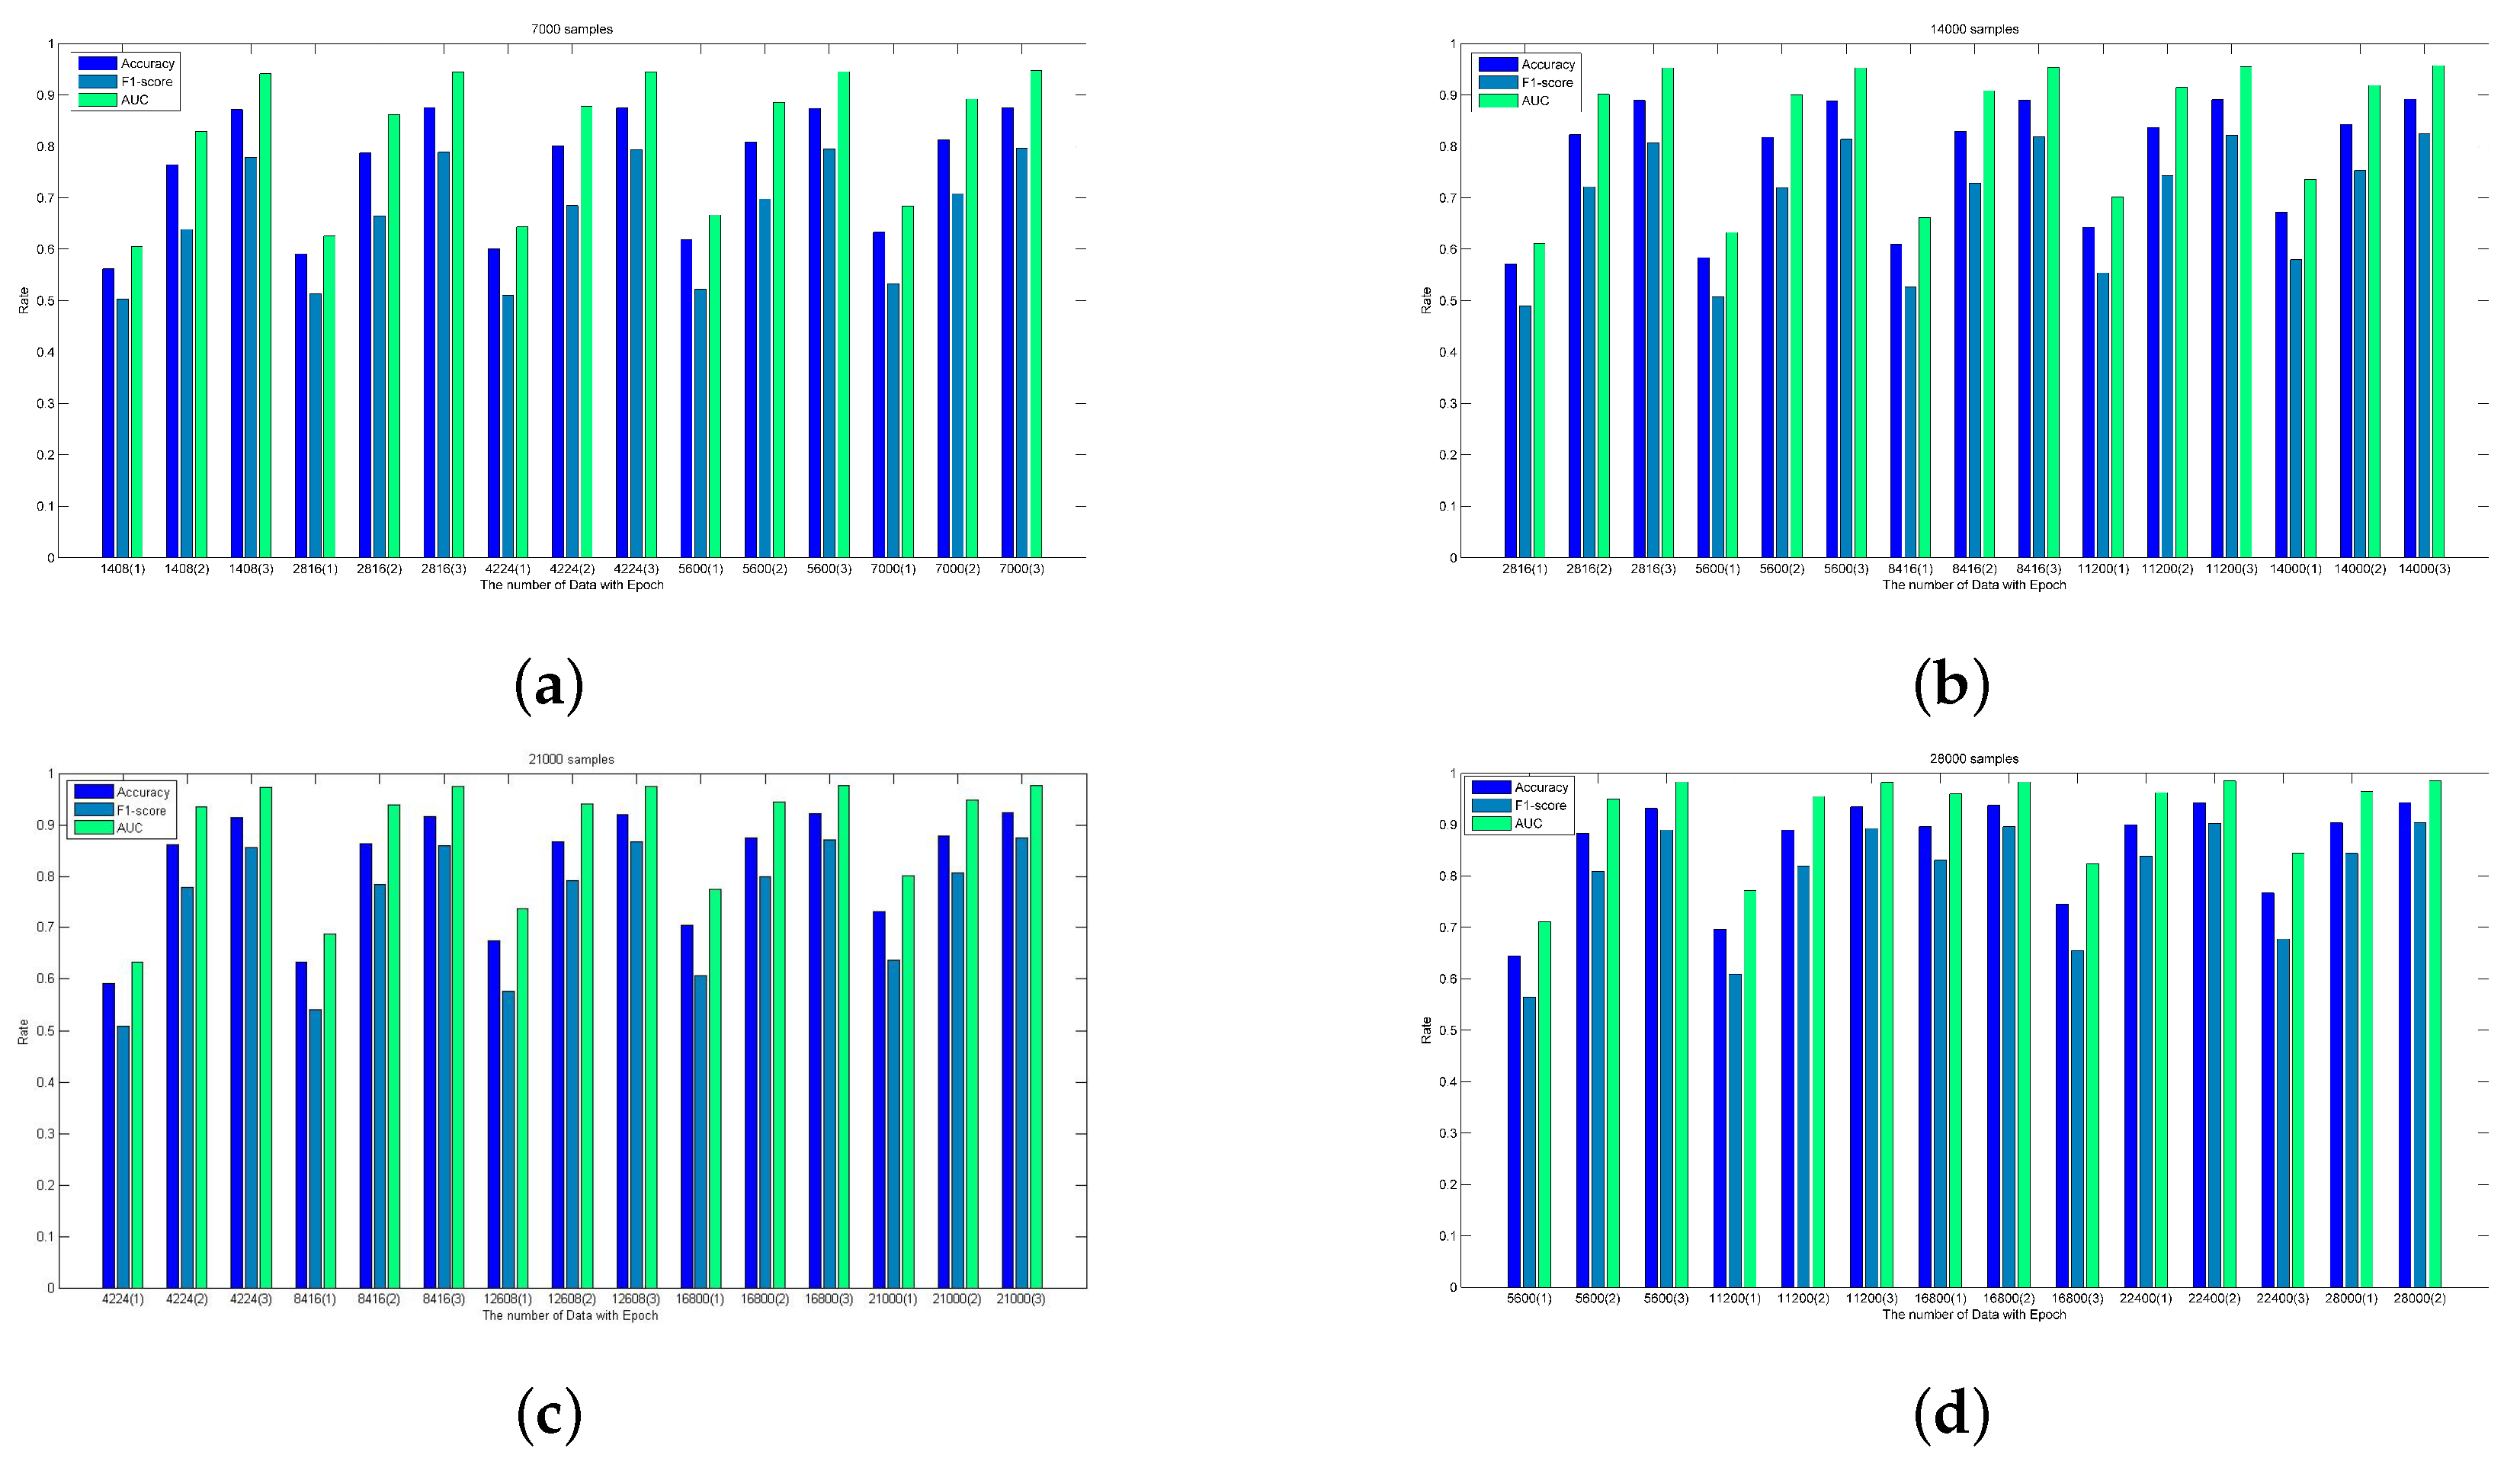
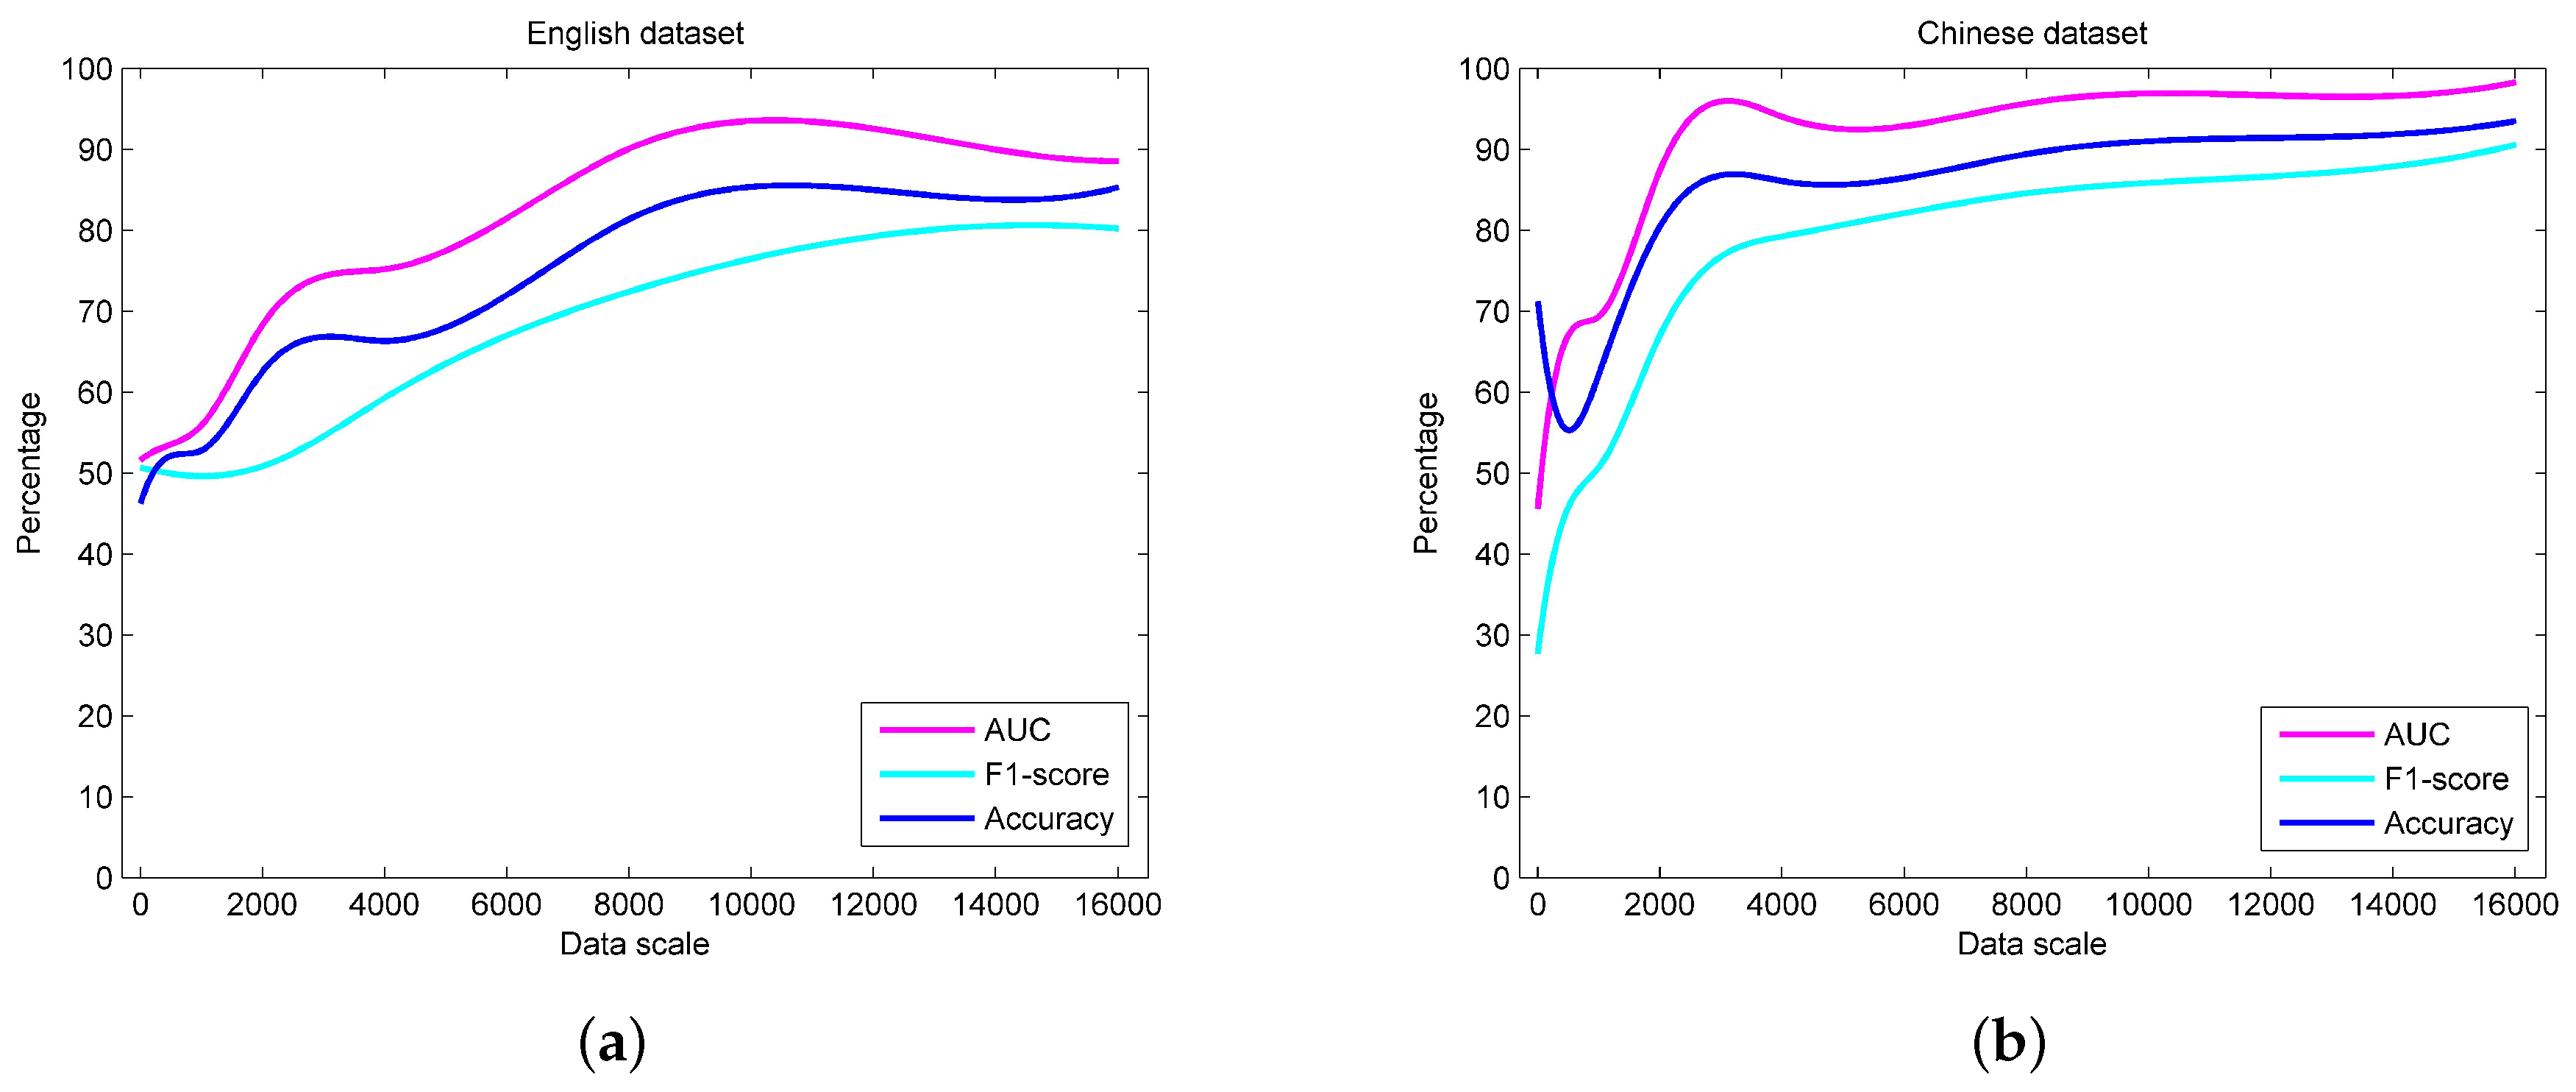
5.2.2. Performance Analysis

In order to optimize the epoch selection required for training the proposed model (that is, the number of learning times in the entire training process). It is necessary to test the accuracy and loss in different epochs. The results are shown in Figure 6. It can be seen from Figure 6 that the accuracy gradually improves and the loss line shows a downward trend with the epoches increasing. However, when the epoch exceeds 3, the loss value of using the validation data set will increase (especially significant in the Chinese data set). This will lead to an increase in the result bias which is not conducive to sentiment analysis. Therefore, the model has better performance when the epoch is 3. At this epoch, the accuracy of using the training data set and the validation data set can be close to 90% regardless of the Chinese data set or the English data set.
To further observe the efficiency when the epoch is 3, AUC and F1-score are introduced. Here, the Chinese and English training data sets with scales of 7000, 14,000, 21,000 and 28,000 are selected for analysis. The data set processed in the training process can be divided according to the scales, and each group displays the corresponding results under the conditions of epoch 1, 2 and 3, as shown in Figure 7 and Figure 8. Each scale on the horizontal axis corresponds to the amount of training data and the corresponding epoch (the value outside the brackets is the amount of data, and the value inside the brackets corresponds to the epoch). It can be seen from Figure 7 and Figure 8 that when the epoch is the same, the changes in Accuracy, AUC and F1-score show a slow upward trend as the amount of data increases. However, in the case of the same training data set, the corresponding result increased significantly with the increase of epoch. In particular, when the epoch is 3, the Accuracy, AUC and F1-score all show the best results on different training datasets.
In reality, the scale of the data set is very large, making it also a factor that affects the proposed method. Therefore, it is important to observe the performance of the method on large-scale data sets. In order to find the effect of the data set size on the proposed model performance, it is necessary to test the Accuracy, Loss and F1-score changes using different data set sizes under the condition of an epoch being 3. Here, the proposed model is trained under the condition that the scales of the Chinese and English data sets are 100, 500, 1000, 2000, 4000, 8000, 12,000, and 16,000. In order to ensure that the results are more accurate, we trained multiple times under these different data sets and obtained the average value. The trend of the results is shown in Figure 9. It can be seen that AUC, F1-Score and Accuracy all show an upward trend as the data set scale increases. As shown in Figure 9a, under the condition of the English data set used, the corresponding curves of AUC, F1-Score and Accuracy all rise slowly and gradually approach 90%. In contrast, under the condition of the Chinese data set used, as the data set scale increases, the Accuracy of the method gradually increases after a decline, and it gradually approaches 90% after the data set scale exceeds 3000, and finally exceeds 90% after the data set scale exceeds 10,000 (as shown in Figure 9b). In addition, F1-score and AUC also showed an upward trend that eventually reached 90% and 100%, respectively. This illustrates that the performance of the method increases with the scale of the data set increasing. Therefore, it can be concluded that the proposed method shows good performance in processing large-scale review data.
In order to further test the performance, we compared the implementation of the proposed method with other methods, SVM and NB in data set processing. Here, F1-score and Accuracy have been chosen due to its intuitiveness. The three methods were run multiple times under the conditions of the data set scale of 4000, 8000, 12,000, 16,000, 20,000, 24,000, 28,000, 32,000, 36,000 and 40,000, respectively and obtained the average results to avoid deviations (as shown in Table 3). It can be concluded from Table 3 that compared with SVM and NB, the proposed method has a better performance in sentiment analysis due to the fact that its Accuracy and F1-score are much higher than the other two models. Unlike SVM and NB the proposed model can learn text features more effectively and capture the long-term dependence of this text based on time series, which is conducive to long-term memory of the review semantics. In addition, the use of the proposed model solves the problem of text sentiment analysis bias caused by the lack of text features semantics in traditional sentiment analysis methods.
In order to avoid sampling errors causing inaccuracies of the analysis results, statistical significance tests have been performed according to Table 3. We respectively tested the differences of the three models SVM, Naive Bayes and the proposed method corresponding to different data sets under the two indicators of F1-score and Accuracy. Here, Matlab 2020b has been used because it is equipped with a complete package for significance test analysis. The analysis results show that the total degree of freedom is 29, and the degree of freedom of the groups is 2. Therefore, according to the F distribution table for α = 0.05, F s t a t i s t i c 0.05 = 3.3690. This value can be used to compare with the F-statistic generated by software analysis. Once it is greater than this value, it can be considered as a significant difference. Based on these, the F-statistics corresponding to F1-score are 12.34 and 48.05 in the English and Chinese datasets, respectively. And the accuracy of the F-statistics in the English and Chinese datasets are 91.20 and 98.43, correspondingly. It can been seen that all generated F-statistics are greater than F s t a t i s t i c 0.05 , therefore, significant differences between the three models exist. In addition, Figure 10 and Figure 11 can be used to further analyze the differences between the models. It can be seen from Figure 10a,b that the median line of the proposed method is significantly higher than that of SVM and NB regardless of whether it is the English or Chinese data sets. This shows that the F1-score of the proposed method is generally high, such that the the model is more stable than others. Moreover, Figure 11a,b also show that the median line of the proposed method is the highest, which implies that the model usually has a high accuracy rate. Therefore, after comprehensive analysis, it can be proven that the proposed method is effective.

5.2.3. A Case Study

Analyzing the warning message amount that merchants receive can facilitate the regulation of regulators. We conducted a case study to verify the validity of the proposed method. First, we set the system to send warning messages every two months based on the proportion of negative reviews. Then, we analyzed the number of warnings received by the merchant. Here, we selected the number of messages received by 38 merchants selling a specific product M within a year. Afterwards, we selected five representative merchants for explanation, as shown in Figure 12. In order to protect the privacy of the merchant, the name of the merchant is replaced by A, B, C, D and E. It can be seen that the proportion of negative reviews that Merchant B has received in a year is below the baseline (as it did not receive any warning messages), which indicates that Merchant B has a relatively good reputation. In contrast, Merchant A received six warning messages during the year, which shows that customers are not very satisfied with the products sold by Merchant A. Hence, A needs to be regulated (such as appropriate fines). The proportion of negative reviews of Merchant C and Merchant E fluctuated around the baseline, and the overall percentage number of warning messages occurrences reached 50% and 66.7%. Therefore, it is recommended that regulators pay more attention to C and E. In addition, although the number of times that merchant D’s negative reviews proportion is higher than the baseline appears twice (receiving two warning messages), the overall trend thereafter declines, which means that merchant D pays attention to improving his/her products and enhanced their credibility. Therefore, it can be shown that the proposed method is effective.

6. Conclusions

In order to implement a sustainable market, we proposed a method that combines blockchain and improved LSTM to analyze the sentiment of reviews data in providing an effective basis for regulations. All the roles involved in the transaction process can correspond to nodes with different permissions in the blockchain network. Unlike traditional LSTM networks, an external storage unit is used to process idioms to improve the accuracy of the analysis results. In order to verify the effectiveness of the method, the performance of the proposed method was evaluated in the experiments. Here, we found that it was not only better than some models like SVM and NB, but also is superior to some similiar methods. Moreover, the case study proved that it is beneficial for regulators to make reasonable and accurate regulation strategies by analyzing the sentiment proportions about the participants. Therefore, the application of the proposed method can help to regulate the behavior of traders, thereby creating a fair and healthy trading environment, and a market’s sustainable development can be realized in the end. This paper is an effective exploration of combining blockchain and deep learning in sustainable development. However, the current research has some restrictions due to the issues of blockchain throughput, block generation speed and others. In addition, the difference of the proposed method performance when processing review data in different languages also needs attention. All these will be the focus of our future research work.

Author Contributions

Conceptualization, Z.Z. and Z.H.; methodology, Z.H.; software, Z.H.; validation, Z.H. and G.W.; formal analysis, Z.H.; investigation, Z.H.; data curation, Z.H.; writing—original draft preparation, Z.H.; writing—review and editing, Z.Z., Z.H., B.Z. and D.M.; visualization, Z.H.; supervision, B.Z., D.M., J.Y., G.T. and Z.Z.; project administration, D.M. and M.Z.; funding acquisition, B.Z., D.M. and M.Z. All authors have read and agreed to the published version of the manuscript.

Funding

This work was supported by the Research and Innovation Project of China University of Political Science and Law under Grant 10820363; National Social Science Fund of China under Grant 18BGL202; the Beijing Municipal Philosophy and Social Science Foundation under Grant 19GLB036; National Key Technology R&D Program of China under Grant 2019YFC1605306; the National Natural Science Foundation of China Grant 61877002; the Open Research Fund of Beijing Key Laboratory of Big Data Technology for Food Safety, Beijing Technology and Business University (Project No. BTBD-2021KF05); the University of Macau (File no. MYRG2019-00006-FST) and the FDCT project reference number(0091/2020/A2).

Conflicts of Interest

Zhihua Zhao and Zhihao Hao are the co-first authors of this paper. The authors declare no conflict of interest.

References

  1. Yadav, A.; Vishwakarma, D.K. Sentiment analysis using deep learning architectures: A review. Artif. Intell. Rev. 2020, 53, 4335–4385. [Google Scholar] [CrossRef]
  2. Zhang, J.; Zhang, A.; Liu, D.; Bian, Y. Customer preferences extraction for air purifiers based on fine-grained sentiment analysis of online reviews. Knowl.-Based Syst. 2021, 228, 107259. [Google Scholar] [CrossRef]
  3. Jain, P.K.; Pamula, R.; Srivastava, G. A systematic literature review on machine learning applications for consumer sentiment analysis using online reviews. Comput. Sci. Rev. 2021, 41, 100413. [Google Scholar] [CrossRef]
  4. Zhao, W.; Guan, Z.; Chen, L.; He, X.; Cai, D.; Wang, B.; Wang, Q. Weakly-supervised deep embedding for product review sentiment analysis. IEEE Trans. Knowl. Data Eng. 2017, 30, 185–197. [Google Scholar] [CrossRef]
  5. Serrano-Guerrero, J.; Olivas, J.A.; Romero, F.P.; Herrera-Viedma, E. Sentiment analysis: A review and comparative analysis of web services. Inf. Sci. 2015, 311, 18–38. [Google Scholar] [CrossRef]
  6. Sun, S.; Luo, C.; Chen, J. A review of natural language processing techniques for opinion mining systems. Inf. Fusion 2017, 36, 10–25. [Google Scholar] [CrossRef]
  7. Abdi, A.; Shamsuddin, S.M.; Hasan, S.; Piran, J. Deep learning-based sentiment classification of evaluative text based on multi-feature fusion. Inf. Process. Manag. 2019, 56, 1245–1259. [Google Scholar] [CrossRef]
  8. Tang, D.; Qin, B.; Liu, T. Deep learning for sentiment analysis: Successful approaches and future challenges. Wiley Interdiscip. Rev. Data Min. Knowl. Discov. 2015, 5, 292–303. [Google Scholar] [CrossRef]
  9. Wang, H.; Qin, H.; Zhao, M.; Wei, X.; Shen, H.; Susilo, W. Blockchain-based fair payment smart contract for public cloud storage auditing. Inf. Sci. 2020, 519, 348–362. [Google Scholar] [CrossRef]
  10. Gong, Y.; van Engelenburg, S.; Janssen, M. A reference architecture for blockchain-based crowdsourcing platforms. J. Theor. Appl. Electron. Commer. Res. 2021, 16, 937–958. [Google Scholar] [CrossRef]
  11. Ray, P.P.; Dash, D.; Salah, K.; Kumar, N. Blockchain for IoT-based healthcare: Background, consensus, platforms, and use cases. IEEE Syst. J. 2020, 15, 85–94. [Google Scholar] [CrossRef]
  12. Mao, D.; Hao, Z.; Wang, F.; Li, H. Innovative blockchain-based approach for sustainable and credible environment in food trade: A case study in shandong province, china. Sustainability 2018, 10, 3149. [Google Scholar] [CrossRef] [Green Version]
  13. Mao, D.; Hao, Z.; Wang, F.; Li, H. Novel automatic food trading system using consortium blockchain. Arab. J. Sci. Eng. 2019, 44, 3439–3455. [Google Scholar] [CrossRef]
  14. Hao, Z.; Wang, G.; Mao, D.; Zhang, B.; Li, H.; Zuo, M.; Zhao, Z.; Yen, J. A novel method for food market regulation by emotional tendencies predictions from food reviews based on blockchain and saes. Foods 2021, 10, 1398. [Google Scholar] [CrossRef]
  15. Bodziony, N.; Jemiolo, P.; Kluza, K.; Ogiela, M.R. Blockchain-based address alias system. J. Theor. Appl. Electron. Commer. Res. 2021, 16, 1280–1296. [Google Scholar] [CrossRef]
  16. Hao, Z.; Mao, D.; Zhang, B.; Zuo, M.; Zhao, Z. A novel visual analysis method of food safety risk traceability based on blockchain. Int. J. Environ. Res. Public Health 2020, 17, 2300. [Google Scholar] [CrossRef] [Green Version]
  17. Wang, C.; Xiao, Z.; Liu, Y.; Xu, Y.; Zhou, A.; Zhang, K. Sentiview: Sentiment analysis and visualization for internet popular topics. IEEE Trans.Hum.-Mach. Syst. 2013, 43, 620–630. [Google Scholar] [CrossRef]
  18. Mao, D.; Hao, Z. A novel sketch-based three-dimensional shape retrieval method using multi-view convolutional neural network. Symmetry 2019, 11, 703. [Google Scholar] [CrossRef] [Green Version]
  19. Wang, L.; Niu, J.; Yu, S. Sentidiff: Combining textual information and sentiment diffusion patterns for twitter sentiment analysis. IEEE Trans. Knowl. Data Eng. 2019, 32, 2026–2039. [Google Scholar] [CrossRef]
  20. Taylor, S.; Kim, T.; Yue, Y.; Mahler, M.; Krahe, J.; Rodriguez, A.G.; Hodgins, J.; Matthews, I. A deep learning approach for generalized speech animation. ACM Trans. Graph. 2017, 36, 1–11. [Google Scholar] [CrossRef] [Green Version]
  21. Zhang, Z.; Cui, P.; Zhu, W. Deep learning on graphs: A survey. IEEE Trans. Knowl. Data Eng. 2020. [Google Scholar] [CrossRef] [Green Version]
  22. Young, T.; Hazarika, D.; Poria, S.; Cambria, E. Recent trends in deep learning based natural language processing. IEEE Comput. Intell. Mag. 2018, 13, 55–75. [Google Scholar] [CrossRef]
  23. Collobert, R.; Weston, J.; Bottou, L.; Karlen, M.; Kavukcuoglu, K.; Kuksa, P. Natural language processing (almost) from scratch. J. Mach. Learn. Res. 2011, 12, 2493–2537. [Google Scholar]
  24. Tang, B.; He, H.; Baggenstoss, P.M.; Kay, S. A bayesian classification approach using class-specific features for text categorization. IEEE Trans. Knowl. Data Eng. 2016, 28, 1602–1606. [Google Scholar] [CrossRef]
  25. Goudjil, M.; Koudil, M.; Bedda, M.; Ghoggali, N. A novel active learning method using svm for text classification. Int. J. Autom. Comput. 2018, 15, 290–298. [Google Scholar] [CrossRef]
  26. Mahajan, D.; Chaudhary, D.K. Sentiment analysis using rnn and google translator. In Proceedings of the 2018 8th International Conference on Cloud Computing, Data Science & Engineering (Confluence), Noida, India, 11–12 January 2018; IEEE: Piscataway, NJ, USA, 2018; pp. 798–802. [Google Scholar]
  27. Hochreiter, S.; Schmidhuber, J. Long short-term memory. Neural Comput. 1997, 9, 1735–1780. [Google Scholar] [CrossRef]
  28. Li, D.; Qian, J. Text sentiment analysis based on long short-term memory. In Proceedings of the 2016 First IEEE International Conference on Computer Communication and the Internet (ICCCI), Wuhan, China, 13–15 October 2016; IEEE: iscataway, NJ, USA, 2016; pp. 471–475. [Google Scholar]
  29. Wang, J.; Cao, Z. Chinese text sentiment analysis using lstm network based on l2 and nadam. In Proceedings of the 2017 IEEE 17th International Conference on Communication Technology (ICCT), Chengdu, China, 27–30 October 2017; IEEE: iscataway, NJ, USA, 2017; pp. 1891–1895. [Google Scholar]
  30. Alayba, A.M.; Palade, V.; England, M.; Iqbal, R. A combined cnn and lstm model for arabic sentiment analysis. In Proceedings of the International Cross-Domain Conference for Machine Learning and Knowledge Extraction, Hamburg, Germany, 27–30 August 2018; Springer: New York, NY, USA, 2018; pp. 179–191. [Google Scholar]
  31. Williams, L.; Bannister, C.; Arribas-Ayllon, M.; Preece, A.; Spasić, I. The role of idioms in sentiment analysis. Expert Syst. Appl. 2015, 42, 7375–7385. [Google Scholar] [CrossRef] [Green Version]
  32. Spasić, I.; Williams, L.; Buerki, A. Idiom-based features in sentiment analysis: Cutting the Gordian knot. IEEE Trans. Affect. Comput. 2017, 11, 189–199. [Google Scholar]
  33. Pelosi, S. Semantically Oriented Idioms for Sentiment Analysis. A Linguistic Resource for the Italian Language. In Proceedings of the International Conference on Advanced Information Networking and Applications, Caserta, Italy, 15–17 April 2020; Springer: New York, NY, USA; pp. 1069–1077. [Google Scholar]
  34. Ibrahim, H.S.; Abdou, S.M.; Gheith, M. Sentiment analysis for modern standard Arabic and colloquial. arXiv 2015, arXiv:1505.03105. [Google Scholar] [CrossRef]
  35. Zarir, A.A.; Oliva, G.A.; Jiang, Z.M.; Hassan, A.E. Developing Cost-Effective Blockchain-Powered Applications: A Case Study of the Gas Usage of Smart Contract Transactions in the Ethereum Blockchain Platform. ACM Trans. Softw. Eng. Methodol. 2021, 30, 1–38. [Google Scholar] [CrossRef]
  36. Yao, J. Automated sentiment analysis of text data with NLTK. J. Phys. Conf. Ser. 2019, 5, 1187. [Google Scholar] [CrossRef]
  37. Merity, S.; Keskar, N.S.; Socher, R. Regularizing and optimizing lstm language models. arXiv 2017, arXiv:1708.02182 2017. [Google Scholar]
  38. McAuley, J.J.; Leskovec, J. From amateurs to connoisseurs: Modeling the evolution of user expertise through online reviews. In Proceedings of the 22nd International Conference on World Wide Web, Rio de Janeiro, Brazil, 13–17 May 2013; pp. 897–908. [Google Scholar]
  39. Prettenhofer, P.; Stein, B. Cross-language text classification using structural correspondence learning. In Proceedings of the 48th Annual Meeting of the Association for Computational Linguistics, Uppsala, Sweden, 11–16 July 2010; pp. 1118–1127. [Google Scholar]
  40. McAuley, J.; Targett, C.; Shi, Q.; Van Den Hengel, A. Image-based recommendations on styles and substitutes. In Proceedings of the 38th International ACM SIGIR Conference on Research and Development in Information Retrieval, Santiago, Chile, 9–13 August 2015; pp. 43–52. [Google Scholar]
  41. Zhang, W.; Xu, H.; Wan, W. Weakness finder: Find product weakness from chinese reviews by using aspects based sentiment analysis. Expert Syst. Appl. 2012, 39, 10283–10291. [Google Scholar] [CrossRef]
  42. Zhang, Y.; Zhang, M.; Zhang, Y.; Lai, G.; Liu, Y.; Zhang, H.; Ma, S. Daily-aware personalized recommendation based on feature-level time series analysis. In Proceedings of the 24th International Conference on World Wide Web, Florence, Italy, 18–22 May 2015; pp. 1373–1383. [Google Scholar]
  43. Manaswi, N.K. Understanding and working with Keras. In Deep Learning with Applications Using Python; Apress: Berkeley, CA, USA, 2018; pp. 31–43. [Google Scholar]
  44. Abadi, M.; Agarwal, A.; Barham, P.; Brevdo, E.; Chen, Z.; Citro, C.; Corrado, G.S.; Davis, A.; Dean, J.; Devin, M.; et al. Tensorflow: Large-scale machine learning on heterogeneous distributed systems. arXiv 2016, arXiv:1603.04467. [Google Scholar]
Figure 1. The framework of the proposed method.
Jtaer 17 00001 g001
Figure 2. The structure of LSTM.
Jtaer 17 00001 g002
Figure 3. The architecture of the sentiments analysis model.
Jtaer 17 00001 g003
Figure 4. The process of sending warning messages to problematic merchants.
Jtaer 17 00001 g004
Figure 5. The regulation process for problematic merchants.
Jtaer 17 00001 g005
Figure 6. Performance test with the increase of epoches for the proposed model. (a) English dataset. (b) Chinese dataset.
Jtaer 17 00001 g006
Figure 7. Results of the model when Epoch = 3 (English dataset). (a) data samples = 7000. (b) data samples = 14,000. (c) data samples = 21,000. (d) data samples = 28,000.
Jtaer 17 00001 g007
Figure 8. Results of the model when Epoch = 3 (Chinese dataset). (a) data samples = 7000. (b) data samples = 14,000. (c) data samples = 21,000. (d) data samples = 28,000.
Jtaer 17 00001 g008
Figure 9. Performance of the proposed model with different data set scales. (a) English dataset. (b) Chinese dataset.
Jtaer 17 00001 g009
Figure 10. Statistical significance test of F1-scores for different models. (a) English dataset (F-statistics is 12.34). (b) Chinese dataset (F-statistics is 48.05).
Jtaer 17 00001 g010
Figure 11. Statistical significance test of Accuracy for different models. (a) English dataset (F-statistics is 91.20). (b) Chinese dataset (F-statistics is 98.43).
Jtaer 17 00001 g011
Figure 12. The negative reviews proportions of different merchants.
Jtaer 17 00001 g012
Table 1. Stopwords obtained after using the tool.
ToolStopwords
NLTKa,about,above,after,again,against,all,am,an,and,any,are,aren’t,as,at,be,because,been,before,
being,below,between,both,but,by,can’t,cannot,could,couldn’t,did,didn’t,do,does,doesn’t,doing,
don’t,down,during,each,few,for,from,further,had,hadn’t,has,hasn’t,have,haven’t,having,he,he’d,
he’ll,he’s,her,here,here’s,hers,herself,him,himself,his,how,how’s,i,i’d,i’ll,i’m,i’ve,if,in,
into,is,isn’t,it,it’s,its,itself,let’s,me,more,most,mustn’t,my,myself,no,nor,not,of,off,on,once,
only,or,other,ought,our,ours,ourselves,out,over,own,same,shan’t,she,she’d,she’ll,she’s,should,
shouldn’t,so,some,such,than,that,that’s,the,their,theirs,them,themselves,then,there,there’s,these,
they,they’d,they’ll,they’re,they’ve,this,those,through,to,too,under,until,up,very,was,wasn’t,we,we’d,
we’ll,we’re,we’ve,were,weren’t,what,what’s,when,when’s,where,where’s,which,while,who,who’s,
whom,why,why’s,with,won’t,would,wouldn’t,you,you’d,you’ll,you’re,you’ve,your,yours,
yourself,yourselves
Table 2. Examples of reviews with idioms.
ReviewsReviews Containing Idioms
This cake looks nice. (positive)This cake looks nice, but it cost an arm and a leg! (negative)
This product does not look very good. (negative)This product does not look very good, but it is my cup of tea. (postive)
Table 3. The performance of different methods on the Chinese and English datasets.
DatasetData Set ScaleF1-ScoreAccuracy
SVMNaive BayesThe Proposed MethodSVMNaive BayesThe Proposed Method
English dataset400053.6221959.3107759.2734559.8333350.9027866.31944
800061.2407535.8546972.4084765.7291751.0763981.35417
12,00058.5495855.4081179.2372563.5324149.8472284.97685
16,00050.5639466.8638780.1849758.9722250.2222285.27778
20,00054.3199266.4808281.4605661.2666749.7916785.72500
24,00071.9021766.5635380.0022574.1041749.8842685.43981
28,00057.4923166.7456082.1485264.8492150.0892986.90079
32,00065.7392066.6402682.4385270.0659749.9704986.64410
36,00077.6472066.5372382.4627578.3580249.8549487.04167
40,00042.4425666.5427083.3160754.7361149.8611187.54583
Chinese dataset400075.2419774.1319679.2165775.5326574.6391885.85567
800079.3950871.5875284.5497979.5138971.9236189.57639
12,00078.3099473.1201486.9324678.3703773.1990791.55093
16,00082.4086773.683790.7776182.4930673.6840393.67361
20,00084.8822872.7900492.7478184.8916772.7944494.99167
24,00086.0000372.2035493.8371986.0138972.2430695.7037
28,00086.2926173.1965794.4160886.3035773.2182596.31548
32,00086.0185172.097194.6856786.0763972.1927196.36806
36,00087.5462872.8471795.7460387.5478472.9135897.18056
40,00087.3620673.9497596.3178487.3750073.9791797.51806
Publisher’s Note: MDPI stays neutral with regard to jurisdictional claims in published maps and institutional affiliations.

