1. Introduction
Landscape toponyms (also called geographical names or place names) are the aspect of the landscape that reflects the link between a physical space and human perception; toponyms also convey the understanding and interpretation of this space and offer a unique approach for studying landforms and the cultural heritage of particular regions. Some toponyms are derived from natural landscapes as well as human perceptions and reflect the relationships between humans and the environment, such as water resources and landforms. Other toponyms are human-centric geography names, which merely reflect human entities, such as settlements and civil constructions. Toponyms are not only linguistic forms but also cultural and societal artefacts that offer insights into the history, settlements, habitats, water and environmental perceptions of a certain culture [
1–
6]. Consequently, the interpretation of toponyms and the analysis of their spatial arrangements can help us examine the spatial characteristics of the geographical name landscape.
Hubei Province has a total of 14 prefecture-level cities. Each prefecture-level city has its own administrative subdivisions that include districts, counties, autonomous counties, county-level cities and subordinate villages. There are 80 county-level administrative districts in total. Besides, Hubei Province is known for having abundant water sources and a local mountainous area. As the largest province located in the middle of China, Hubei Province also has a large population. In this paper, we analyse the statistics of toponyms of the 80 county-level administrative districts and select the 49 words that are used most frequently. We then use query language to determine how many times these words appear in each county-level administrative district. These words are classified into five types based on their linguistic meaning (mountain, water, plain, settlement or construction). And then the geodatabase is created which contains the numbers of words of each type that happen to every county. Through visualisation, we can more clearly determine the dimensions and density of the toponym landscape by showing the distribution probability of the landscape-related words of toponyms in Hubei Province in a thematic map.
On this basis, we extract certain environmental factors that are related to the formation of toponyms from topographic data. Specifically, elevation and slope factors are extracted to study the correlativity between mountain-related and plain-related toponyms and landscape. In addition, we calculate the information entropy of all types of geographical names such as water features, plain features, mountain features, settlement features and urban features in each county in Hubei province. From the result we can know that the density of place names in central region is much smaller than eastern and western of Hubei province.
By applying spatial analysis and statistical analysis, we figure out the regularity of the spatial arrangement of the geographical names in Hubei Province and that allowed draw out the main conclusions of the research. Geographical names do represent responses to the cultural landscape and physical environment and the distribution of geographical names is correlated with the landscape to some extent. However, toponyms are also an important part of the cultural heritage, which means the formation of geographical names is a historical process and may develop with changes in people’s perceptions. We calculate the information entropy from place names of each county, and find that the bigger information entropy, the more uniform the place names types of distribution.
The application of geographic information systems (GIS) technology represents a major advancement of toponymic studies because GIS enables the systematic examination of spatial patterns of geographical names as well as their association with other human and environmental factors. In this study, ArcGIS 10 software, ENVI 4.7 software, and the SPSS 19 statistical program were used as analysis tools for spatial management, data manipulation and thematic mapping.
The main goals of the research are to figure out the regularity of distribution of toponyms and the relationship between geographical names and landscape types through GIS and spatial analysis. And information entropy can reflect the uncertainty and diversity of place names in Hubei province. By comparing the information entropy, we can conclude the place names’ distribution and types of place names.
2. Previous Work
Previous work has been performed on the application of GIS in toponymic studies. Wang used GIS to examine the spatial patterns of particular Tai toponyms and their relationship with terrain characteristics in South China and Southeast Asia [
7]. Wang analysed the spatial characteristics of a place names landscape based on GIS technology in Guangdong Province, China [
8]. Wang built a GIS database of place names in Guangxi, China, analysed how the spatial distributions of Zhuang and Han place names were linked to manmade and physical environments, and analysed how the patterns changed over time [
9]. Jung studied the Korean perceptions of the environment based on an examination of the toponymic terms used in conjunction with Korean village names during the early twentieth century [
10]. To establish the relationship between field names and physical spaces, Seidl analysed field names in a select area and determined if and how they can be used in the planning and management of contemporary landscapes [
11]. In an analysis of geographic names in Zhongwei County based on the character frequency, origin and cultural landscape of names using quantitative and statistical methods, Jian-hua Li concluded that the distribution of the landscape toponyms was consistent with the topography [
12]. Yan-bo suggested that the origin and development of each place name had a close relationship with the historical geography and culture background [
13]. A large amount of interior and exterior cultural information is available on the distributions of environments, geographies and various frontiers. O’Connor examined the landscape terminology and place names in the Chontal region in the state of Oaxaca in southern Mexico by focusing on terms from the Lowland Chontal, which is a highly endangered language spoken near the Pacific Coast [
14]. In addition to the linguistic analysis, O’Connor presented a general description of the physical geography of the area and how it relates to settlement patterns and subsistence activities.
Boillat
et al. deepened the search for ecosystem-like concepts in indigenous societies by highlighting the importance of place names used by Quechua indigenous farmers in the Central Bolivian Andes [
15]. Čargonja
et al. investigated how toponyms for which the names of the plants can be recognised mostly represent the local climazonal vegetation of an area as well as the ethno-linguistic and socio-cultural motives embedded in the lives of the people [
16]. Senft studied landscape terms and place names in the Trobriand Islands—the Kaile’ una subset—and presented a critical discussion of the landscape terms and the proposed typology for place names [
17]. Vasardani
et al. reviewed the current literature on geographic information retrieval based on place names. They focused on three interrelated research areas: (1) the use of place names in gazetteers, (2) the use of formal models to explain spatial relationships and the spatial extent of place names in linguistic place descriptions, and (3) web-harvesting and crowd-sourcing techniques for identifying place names and their spatial extension from public and volunteer sources, such as social networks and photo-sharing sites [
18–
20].
Freitas
et al. research was designed mainly to: (i) propose an original hydrotoponymical classification based on historical hydrogeography, hydrogeology and hydrohistorical inventories; (ii) analyse a dynamic assessment of the evolution of hydrotoponymy in the Porto urban region throughout the time; and (iii) stresses the importance of the hydrotoponymical role had in improving the hydrogeological conceptual modelling for old large urbanised areas [
3].
Burenhult depicted the relationship of linguistic categories of landscape terms and place names based on first-hand data [
21]. Many researchers are using GIS and information technology to study the relationship of place names and landscapes in many fields, such as linguistics, anthropology, epistemology, ontology, and environmental theory [
22–
29].
The main difference between this study and the approaches described in the aforementioned publications is the combined use of spatial analysis of GIS data and a data mining module. Through comparisons, most of the previous selected toponymical works studied geographical names through qualitative description. However, in this paper, we count the words in toponyms via statistics and classify them into five types based on linguistic and semantic analysis. Besides, quantitative study is another specific aspect of our research. Through factors extraction and correlation analysis, the correlation between landscape and toponyms are studied.
3. Study Area
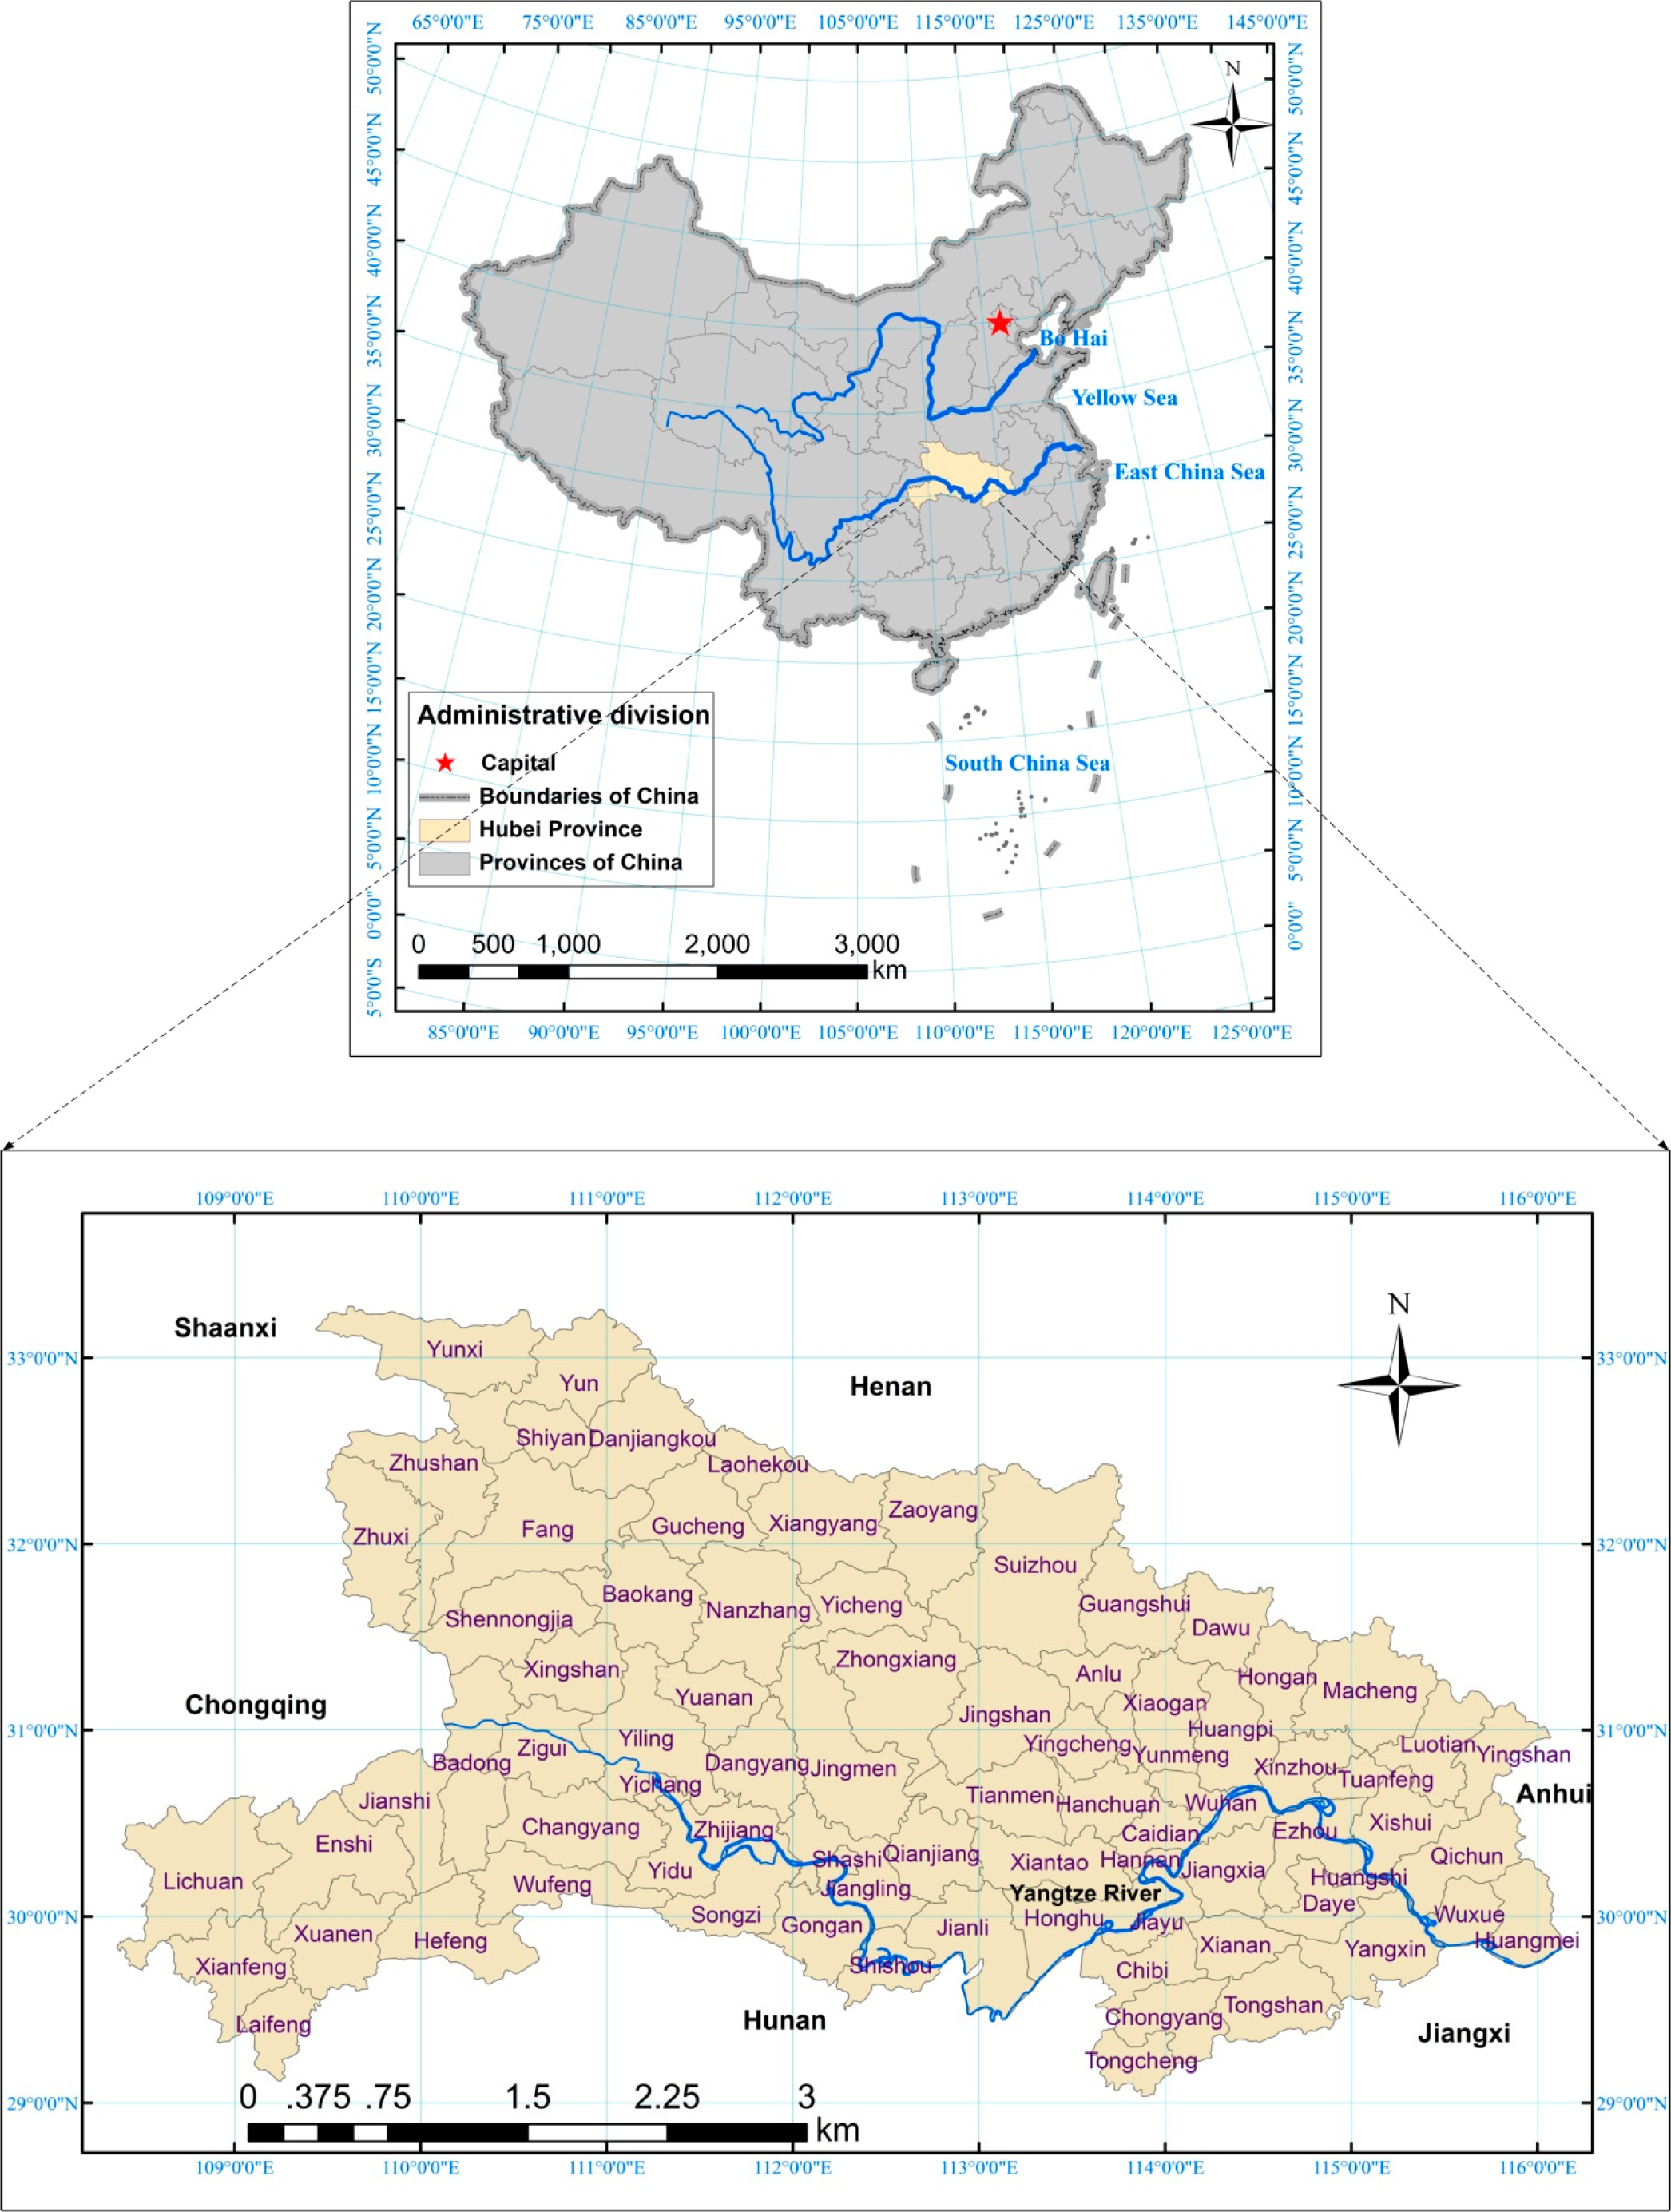
Hubei Province (
Figure 1) is located in Central China (29°05′–33°20′S, 108°21′–116°07′E) and extends across the Yangtze River. Hubei Province covers an area of 185,900 km
2, which accounts for 1.94% of the total area of China. The province has developed Archean-Cenozoic strata and ultrabasic, basic, medium acidic, acidic, alkaline igneous rocks and various metamorphic rocks. The proportions of strata areas are as follows: sedimentary rocks, 61%; metamorphic rocks, 32%; and igneous rocks, 7%. The proportions of various landforms of the total provincial area are as follows: mountains, 55.5%; hills and hillocks, 24.5%; and plains and lake areas, 20%. Consisting of 14 prefecture-level cities, Hubei Province has a permanent population of 57.79 million. Hubei Province is a multiracial province. The minority nationalities account for 4.31% of the total population in the province, and the autonomous area of minority nationalities is approximately 30,000 km
2, accounting for nearly one-sixth of the total area.
The eastern, western and northern areas of Hubei Province are surrounded by mountains, such as Wuling Mountain, Daba Mountain, Wudang Mountain, and Dabie Mountain. The Jianghan Plain crosses central and southern Hubei Province where the terrain is relatively flat. The Yangtze River flows across 26 counties and cities in Hubei Province from west to east and flows a total distance of 1041 km. The tributaries of the Yangtze River within Hubei Province include the Han River, Zhang River, Qing River, Dongjing River, Lu River, and Fu River.
Among these tributaries, the Han River, which flows a distance of 858 km, is the largest tributary along the midstream of the Yangtze River. From northwest to southeast, the Han River flows across 13 counties and cities and flows into the Yangtze River at Wuhan City, the capital of Hubei Province. Furthermore, Hubei Province is called “The Province of Thousand Lakes” due to its abundant water resources. The lakes within the province have a total area of 2983.5 km2. Lakes Honghu, Changhu, Liangzi and Futou each cover more than 100 km2.
4. Data Preparation and Processing
4.1. Data Sources
The toponyms dataset of Hubei Province that was surveyed by the Department of Civil Affairs of Hubei Province was used to conduct the statistical analysis. The dataset contains the attribute data of place names of the 80 county-level administrative districts in Hubei Province. The toponyms dataset was recorded in a geodatabase for subsequent analysis.
Vector data of the administrative districts of Hubei Province acquired from the National Fundamental Geographic Information System (NFGIS) were used for clipping features and the base map. This map of the study area is crucial for the visualisation process.
The vector data spatial arrangement of the rivers greater than 4th order were acquired from the National Fundamental Geographic Information System. The data were used to display the spatial arrangement of rivers during the process of visualisation and to extract water-related factors while analysing the spatial correlation.
A digital elevation model (DEM) with a spatial resolution of 30 m was downloaded from the ASTER GDEM distribution site (
http://gdem.ersdac.jspacesystems.or.jp/). The data processing of the DEM involved mosaicking and clipping. The hillshade of Hubei Province was generated from the DEM. The elevation and slope factors were extracted for the analysis of the spatial correlation.
4.2. Toponyms Data
To obtain a record of the words that appear most frequently in the 80 county-level administrative districts in Hubei Province, we developed a program to obtain statistics of the first-hand data [
30]. Some researchers combine place names and the ecological environment to study landscapes and social-ecological systems [
31–
34]. After selecting the 49 words that are used most frequently, we applied these words to each county record and obtained 80 records that show how many times these words appear in each county. After classifying these words into five types (mountain, water, plain, settlement or construction) based on their linguistic meanings, we added these five types to the fields of the geodatabase and applied the numbers of words of each type to the records of the counties. Finally, we obtained 80 records that show how many times the words of each type appear in every county. During the spatial analysis, this statistical result played an important role because the main objective of this analysis was to determine how the landforms affect the spatial arrangement of geographical names. The classification of the 49 words used most frequently in the geographical names of Hubei Province is shown in
Table 1.
4.3. Creating the Geodatabase
During data processing, we classified the 49 words that were used most frequently in the geographical names into five types: mountain, water, plain, settlement or construction. We then added these five types to the fields of the geodatabase and added the numbers of words of each type to the records of the counties. Finally, we obtained 80 records showing how many times the words of the five types appeared in every county (
Table 2). We then entered these data into the attribute table of the administrative district map of Hubei Province at the county level. The spatial correlation analysis was performed based on these results.
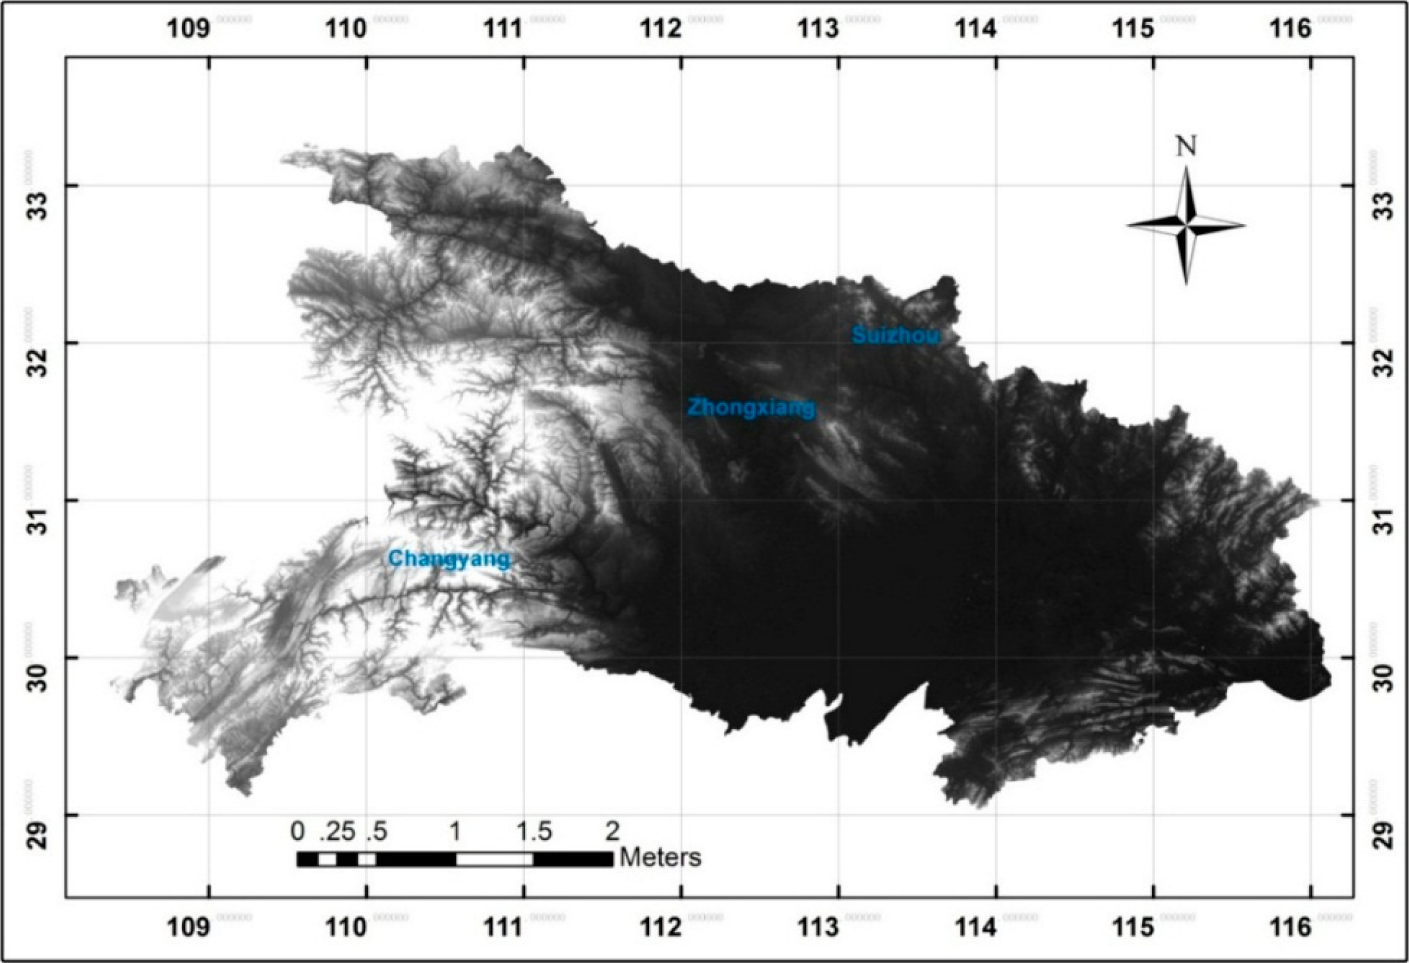
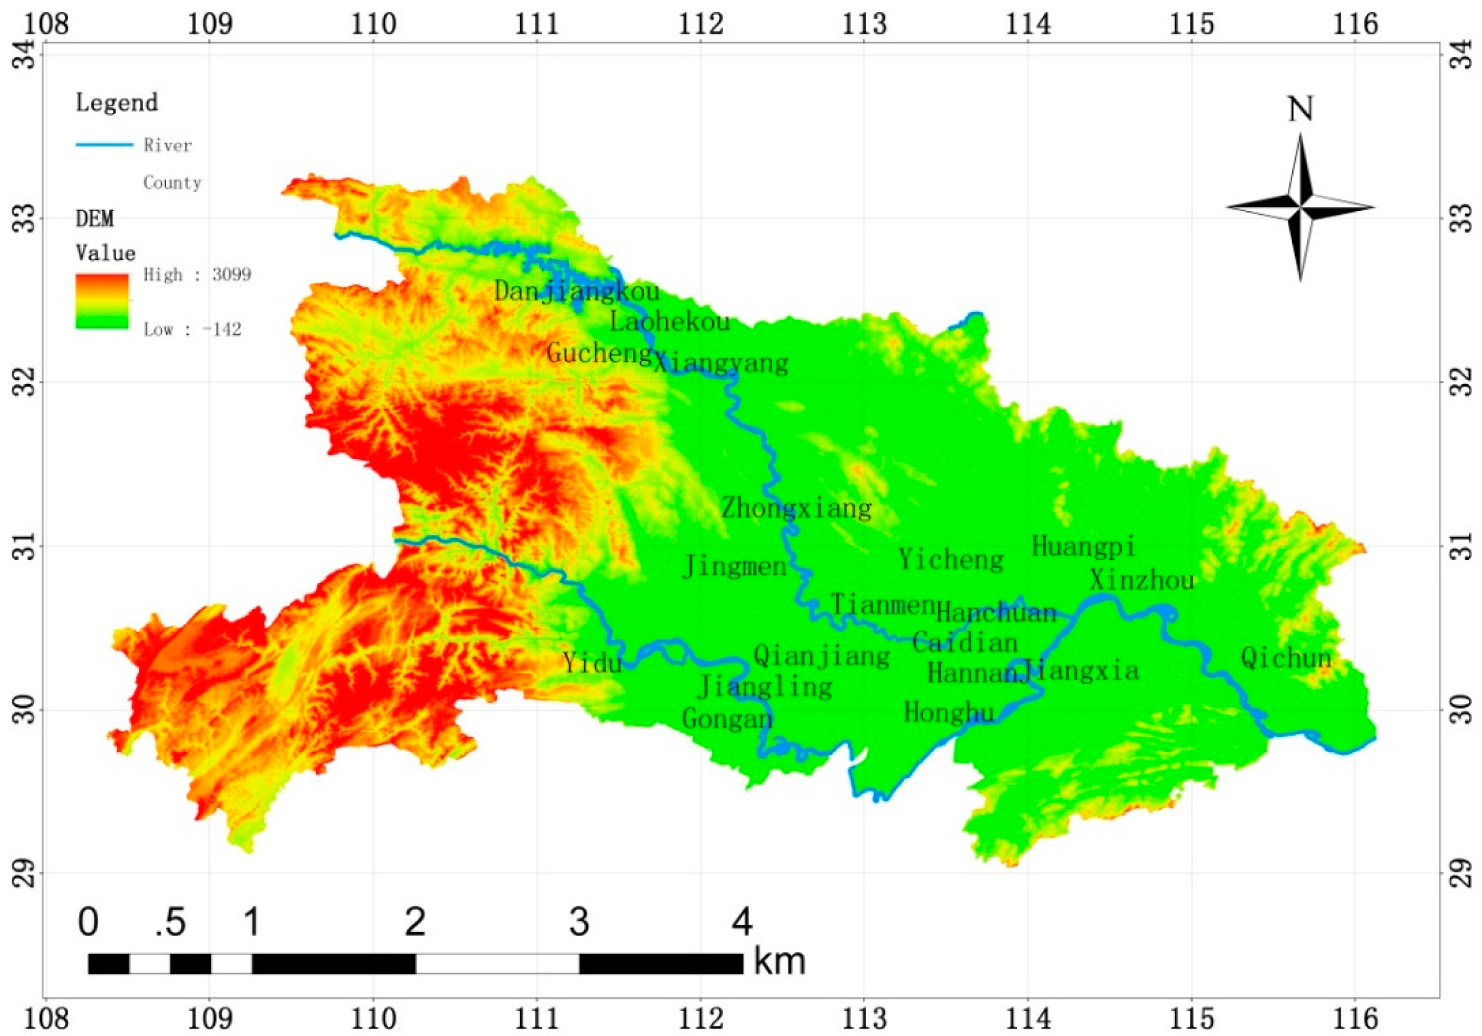
4.4. DEM Data
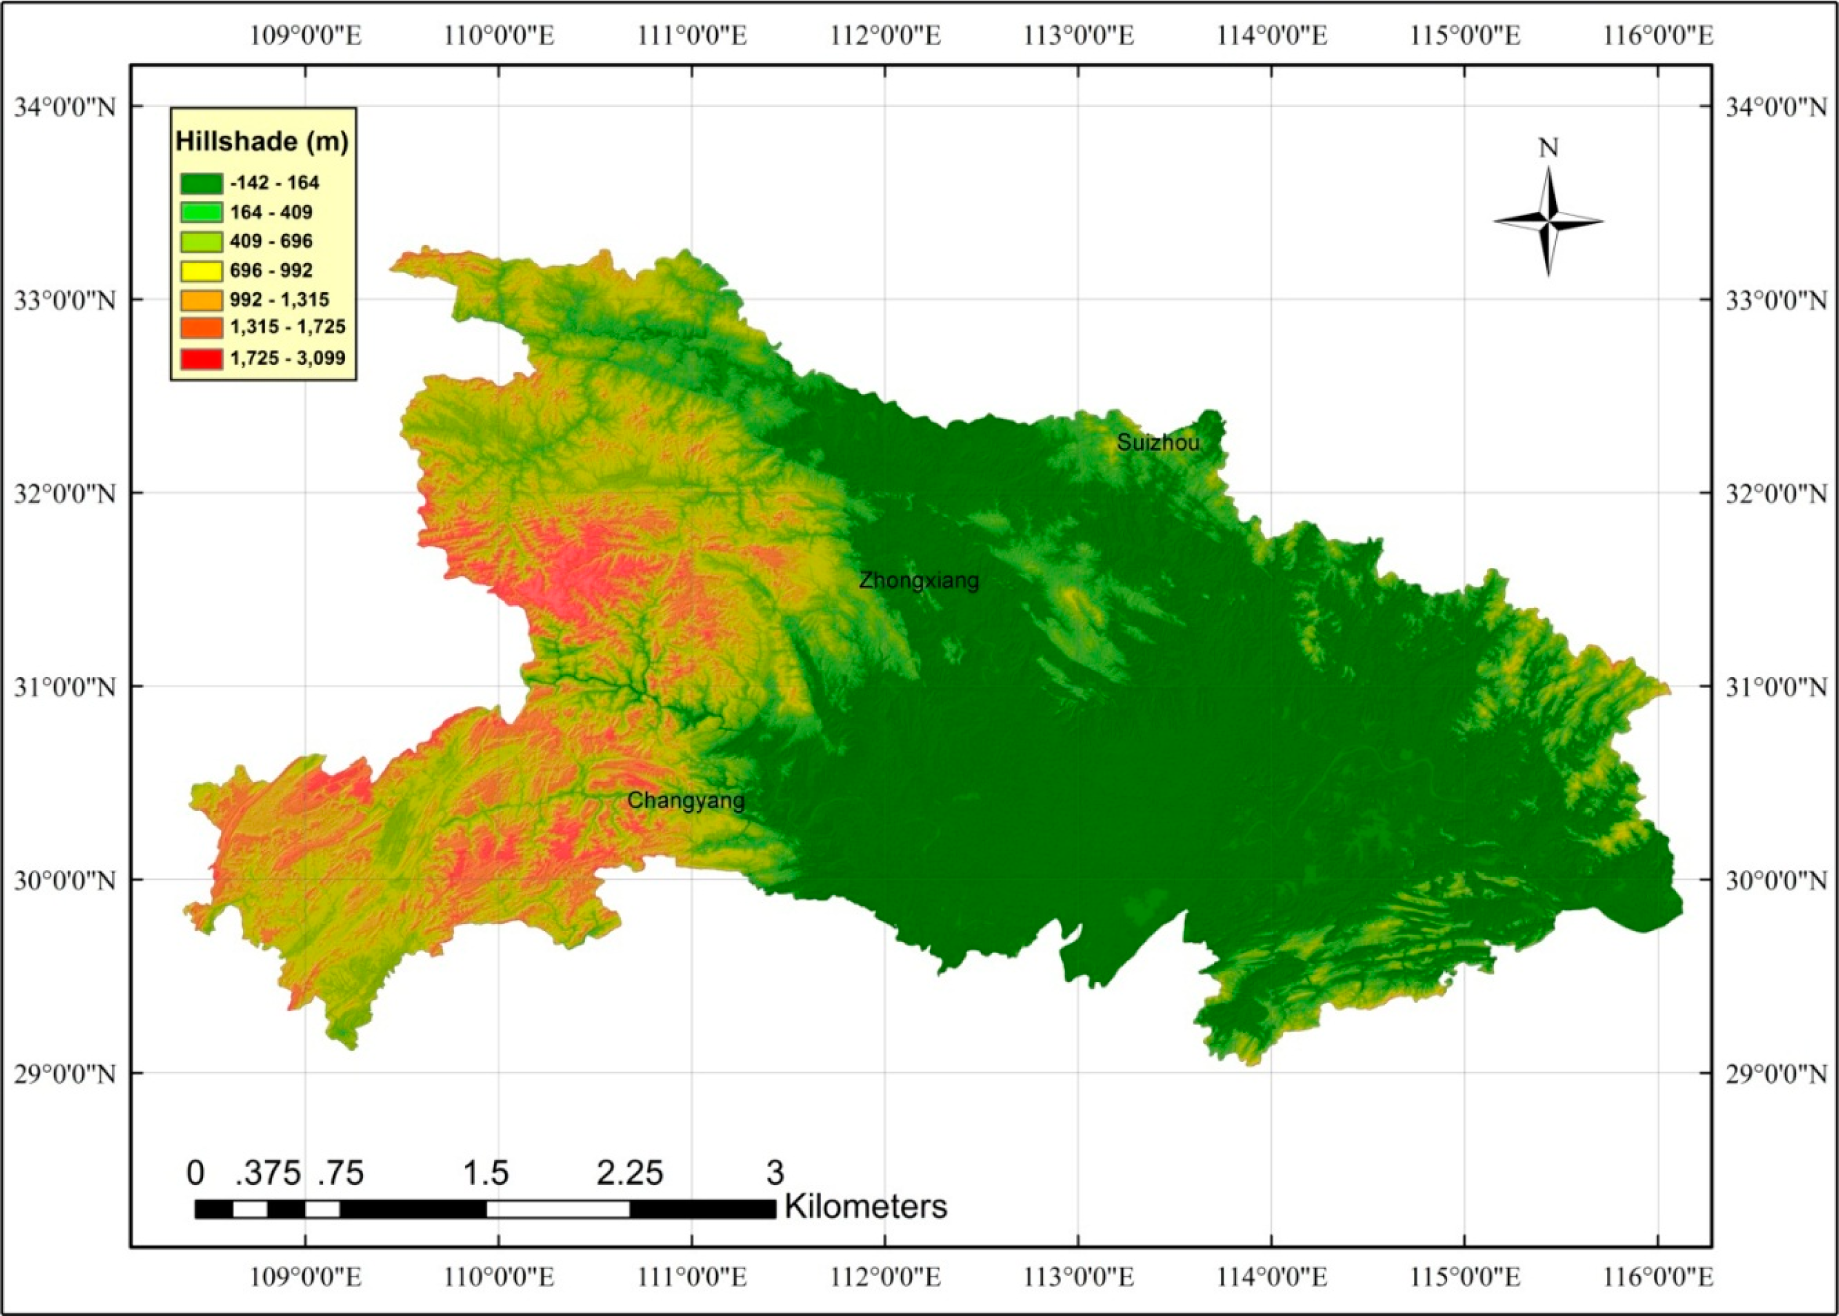
An image of the DEM mosaic with a spatial resolution of 30 m was generated after processing the mosaic with Envi software. The image contained the entire dimensions of Hubei Province, although the limits extended beyond the precise boundary of Hubei Province. We then added the image data and the vector data of the administrative district of Hubei Province using ArcMap 10 software. By applying the vectors as a clip feature using a geoprocessing function, we obtained the DEM of Hubei Province with a spatial resolution of 30 m (
Figure 2).
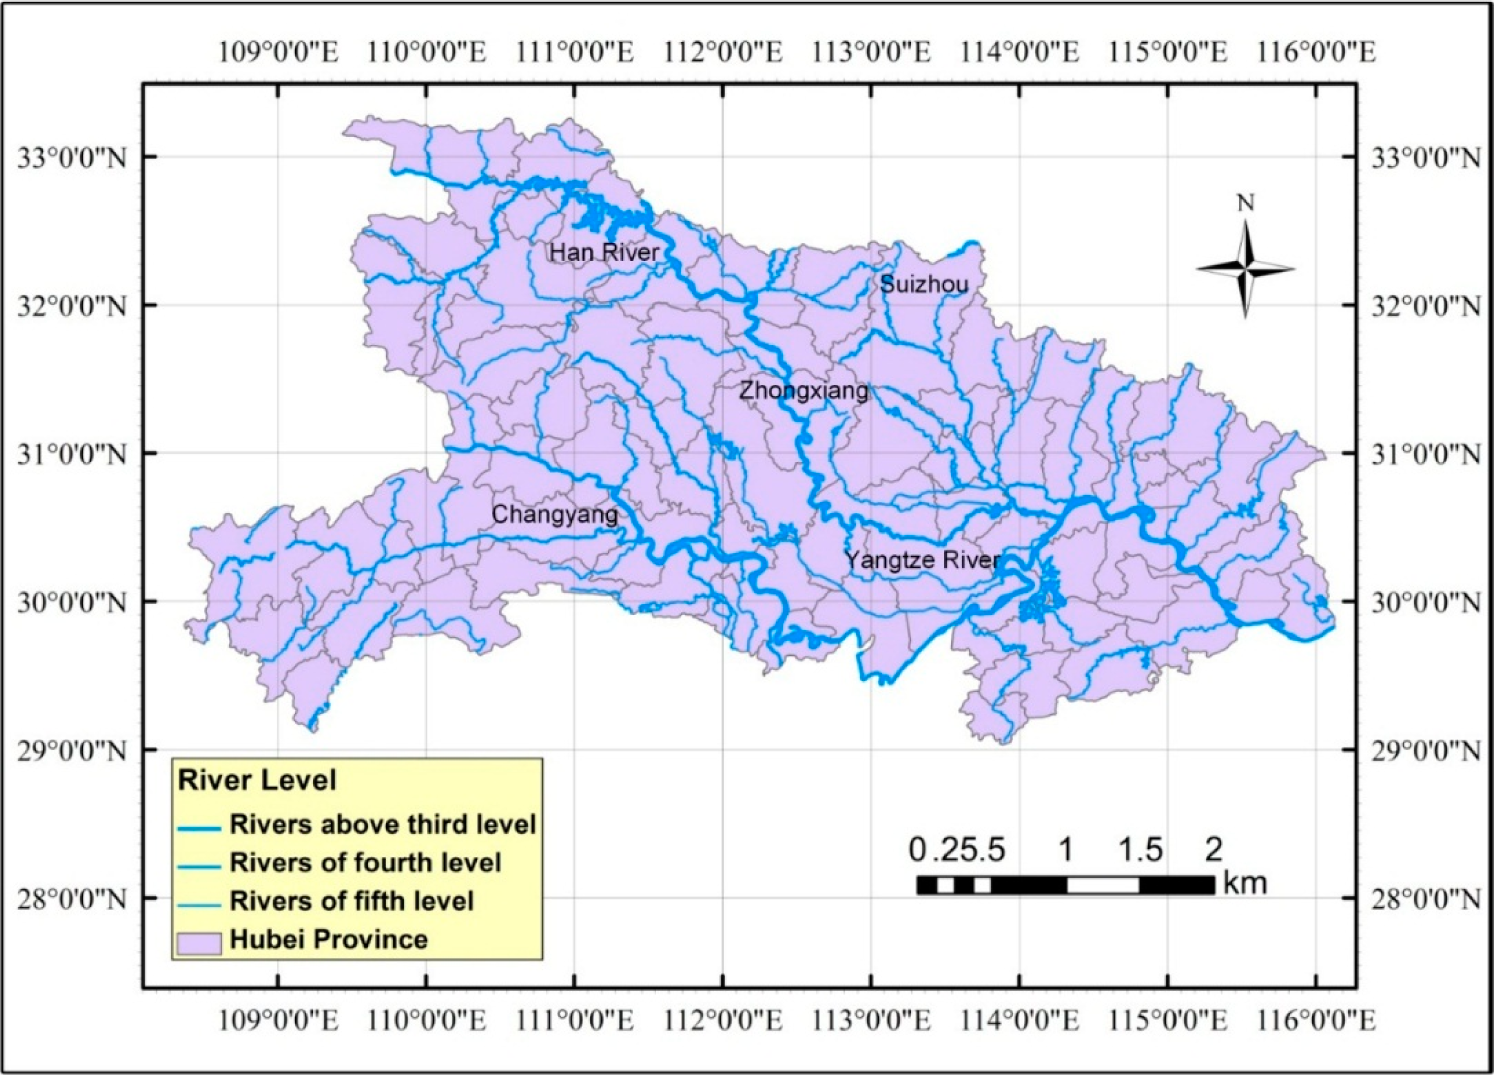
4.5. The Spatial Arrangement of Rivers
To guarantee the accuracy of the analysis, we chose a layout of rivers that are greater than 4th order; the Yangtze River is a 1st order river that flows across Hubei Province. Again, the vector data of the administrative district of Hubei Province were added to ArcMap10 and used as the clip feature during geoprocessing. The resulting figure (
Figure 3) shows the spatial arrangement of the rivers greater than 4th order in Hubei Province. As shown in
Figure 3, some counties include or are bordered by rivers, whereas others are not located near rivers. However, the resulting figure only provides a visual representation rather than a quantitative analysis. Therefore, water-related factors were extracted from the data; these factors are crucial for further analysis of the spatial correlation.
5. Experimental Section
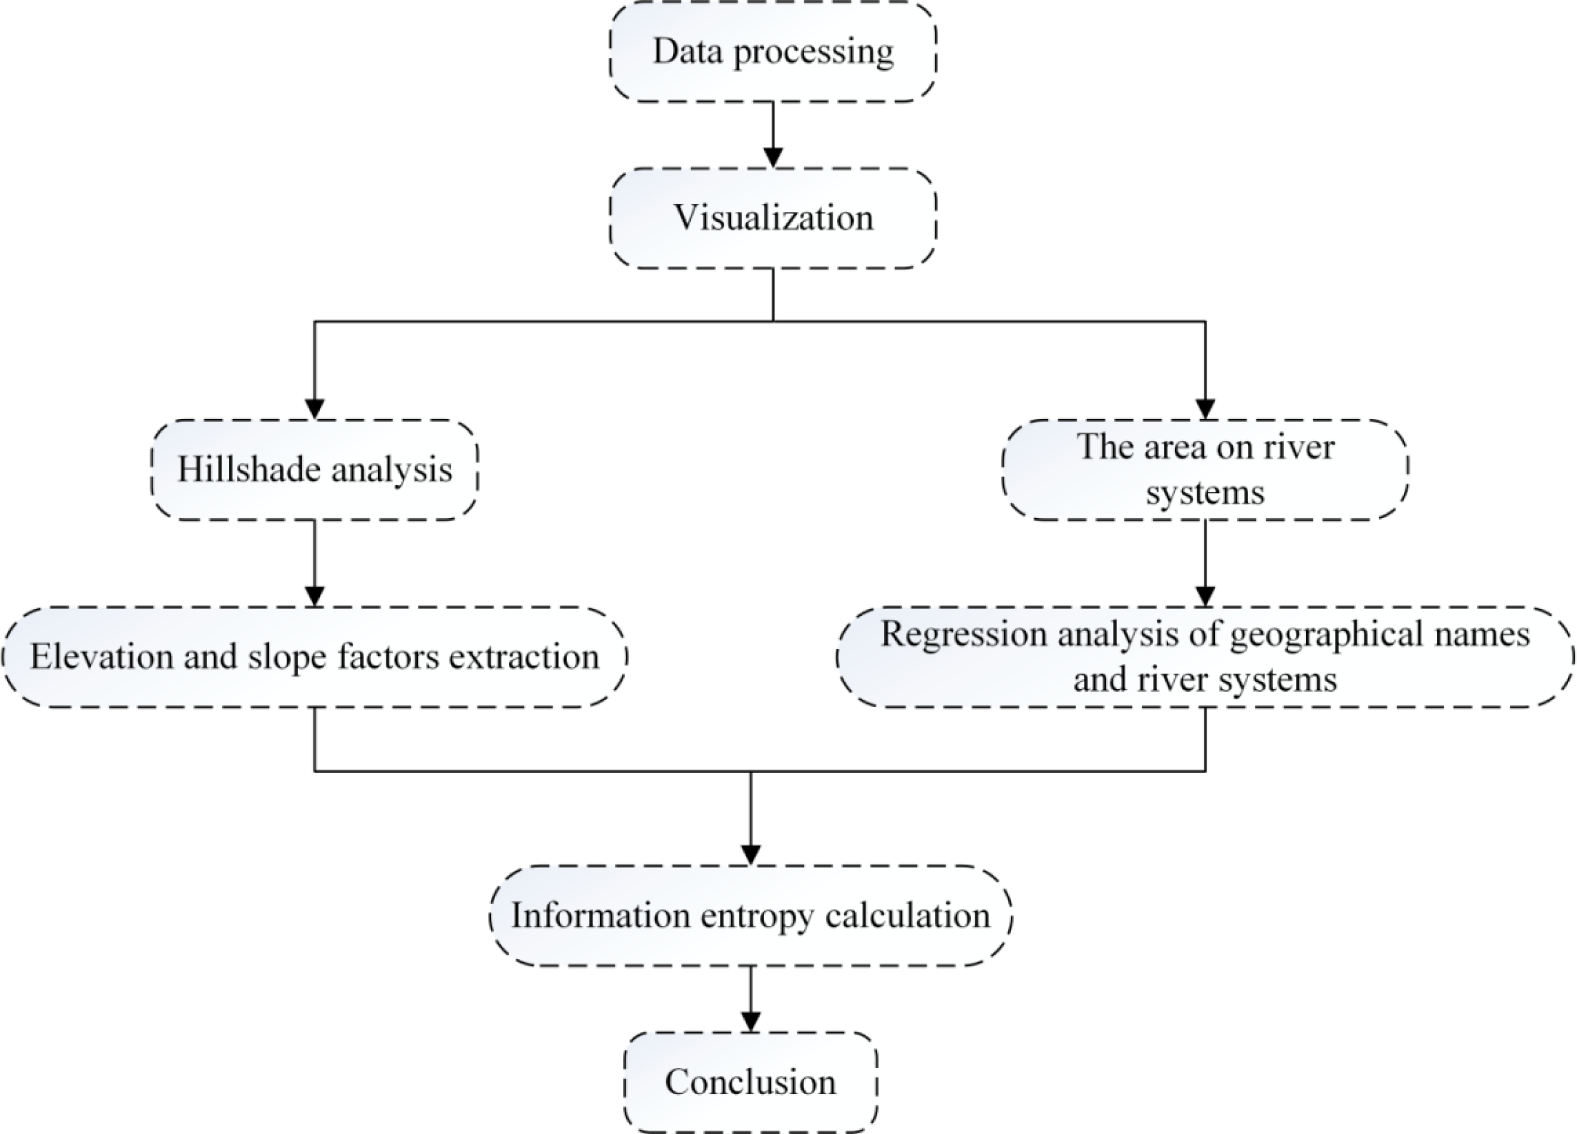
5.1. Flowchart
The flowchart for landscape analysis of geographical names is shown in
Figure 4. It presents the data processing, visualization, hillshade analysis, regression analysis, information analysis and the conclusion. Data preparation and processing was introduced above, and the section analysis the relationship of geographical names and its natural landscape by visualization, hillshade analysis, regression analysis and information entropy.
5.2. Visualisation
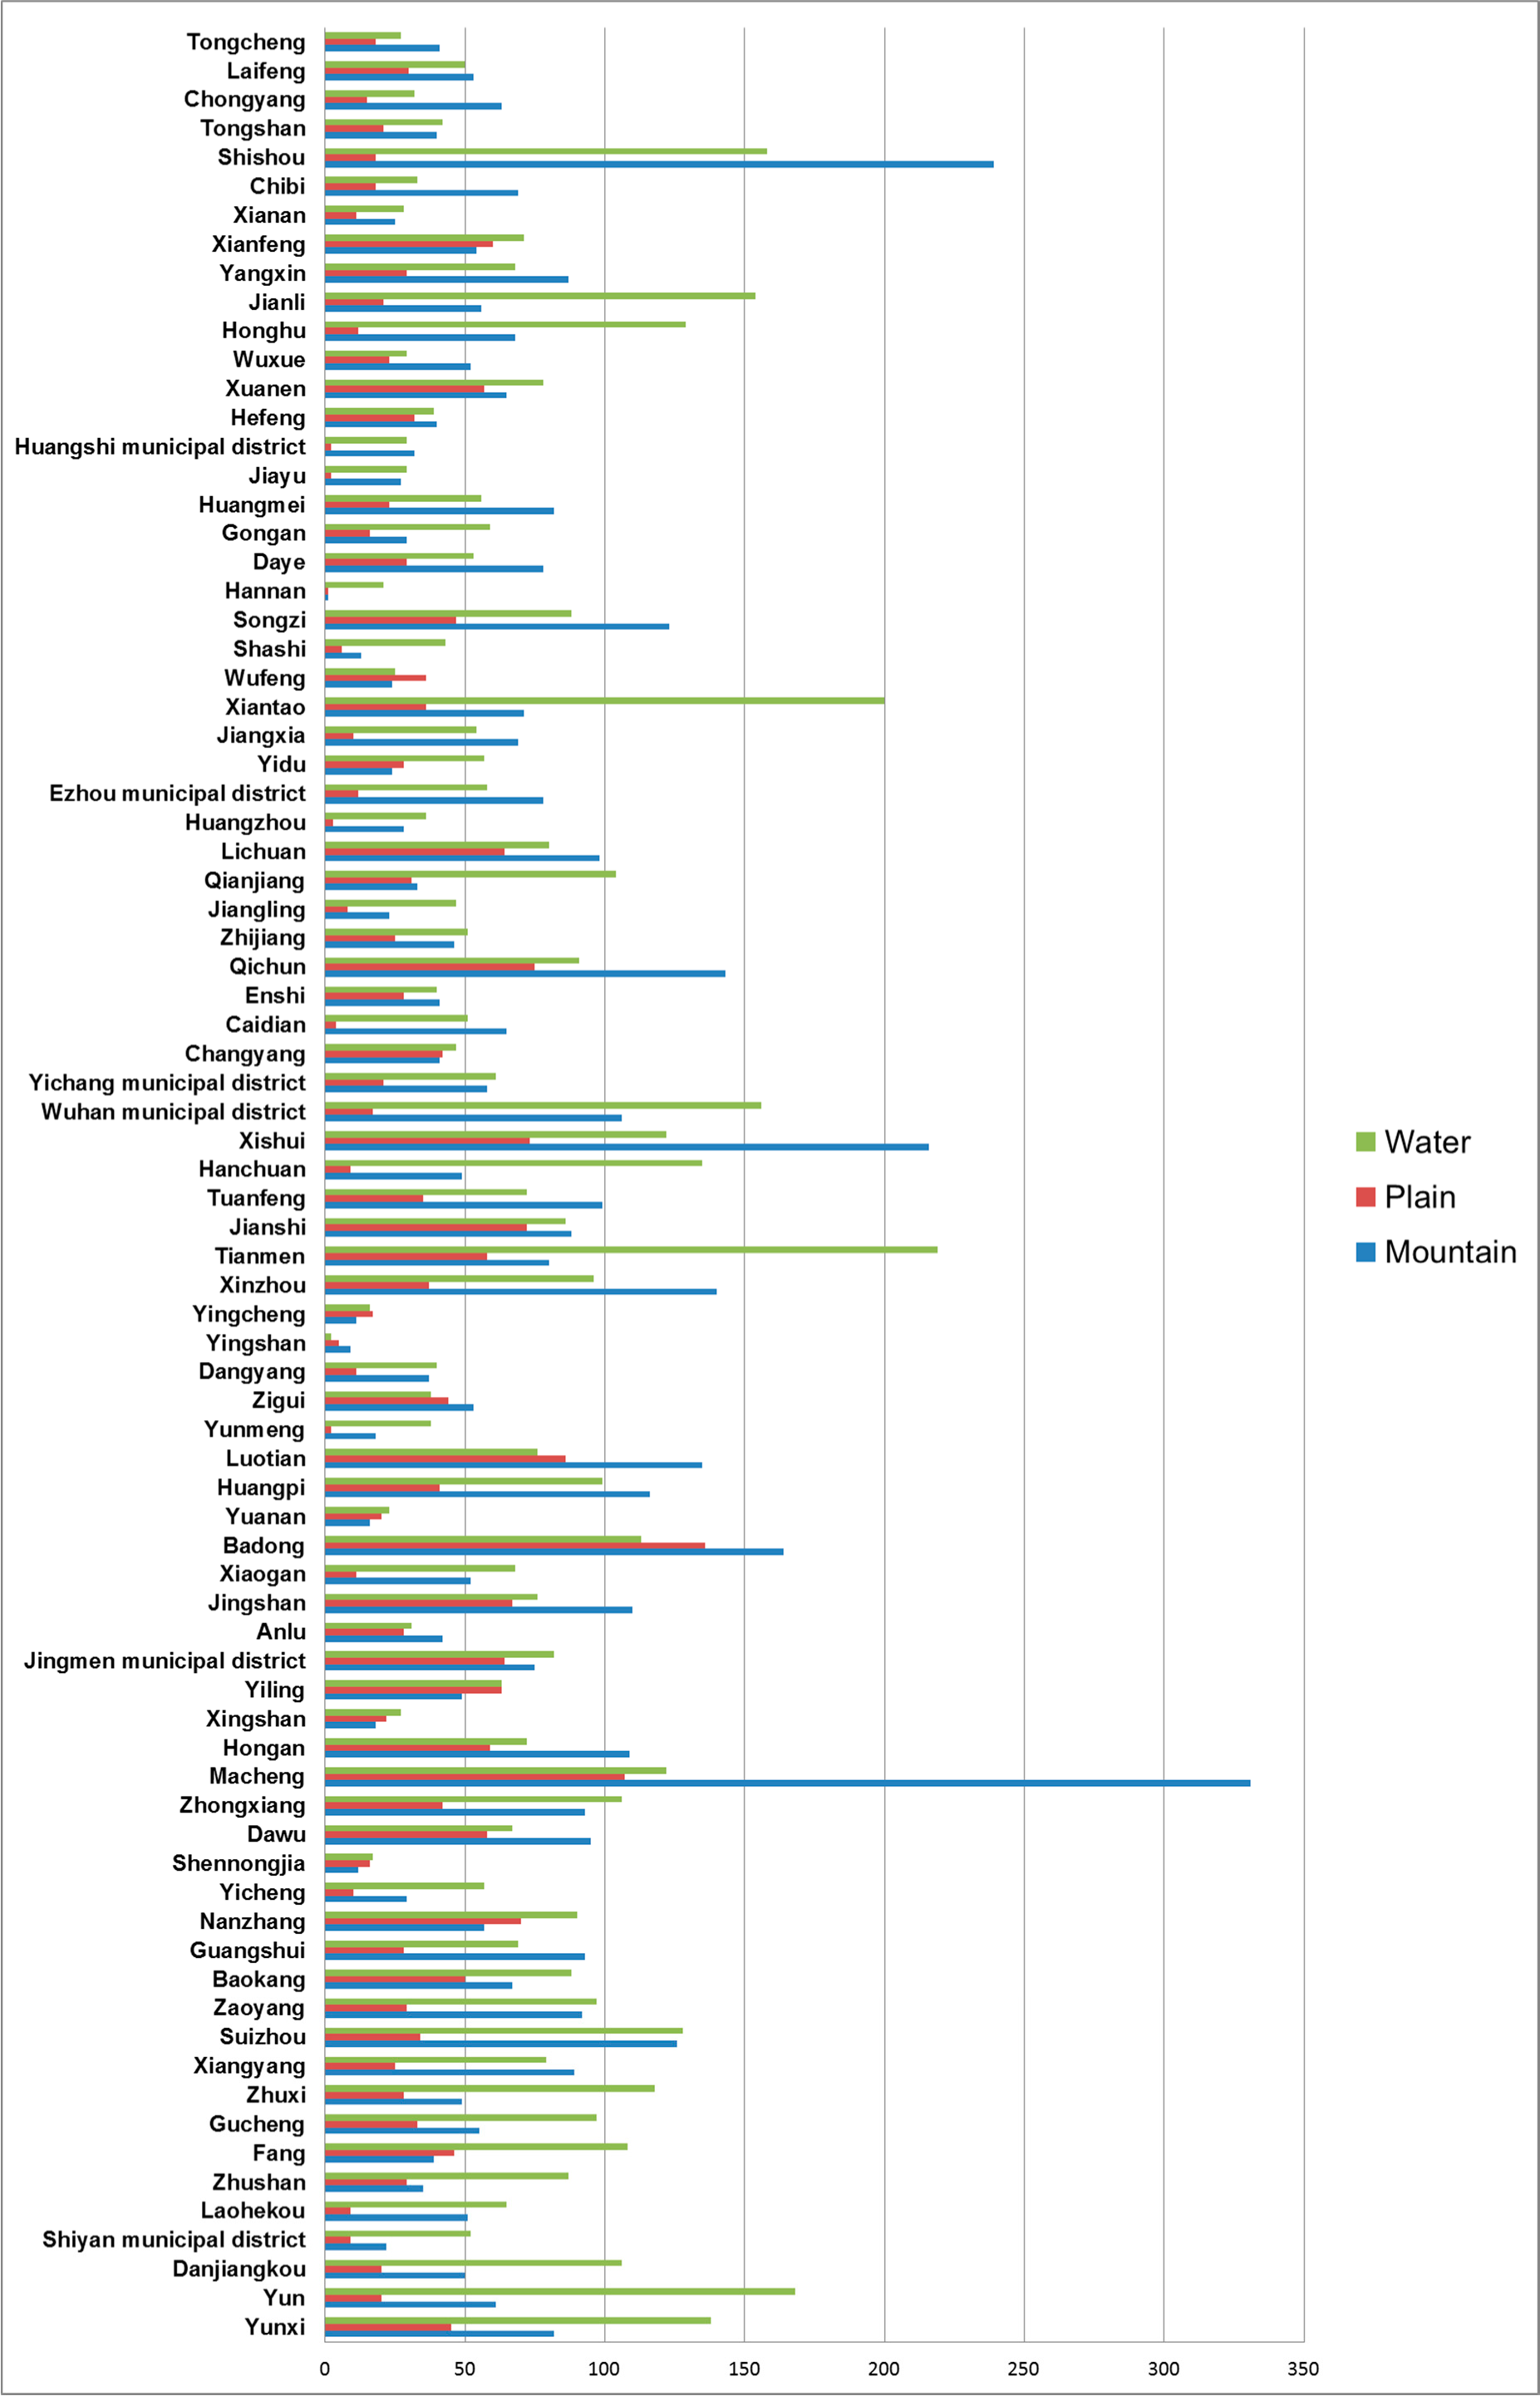
Because the statistics were recorded and digitised, the figures below show the absolute counts of landscape-related toponyms (mountain, plain and water) in the 80 county-level administrative districts (
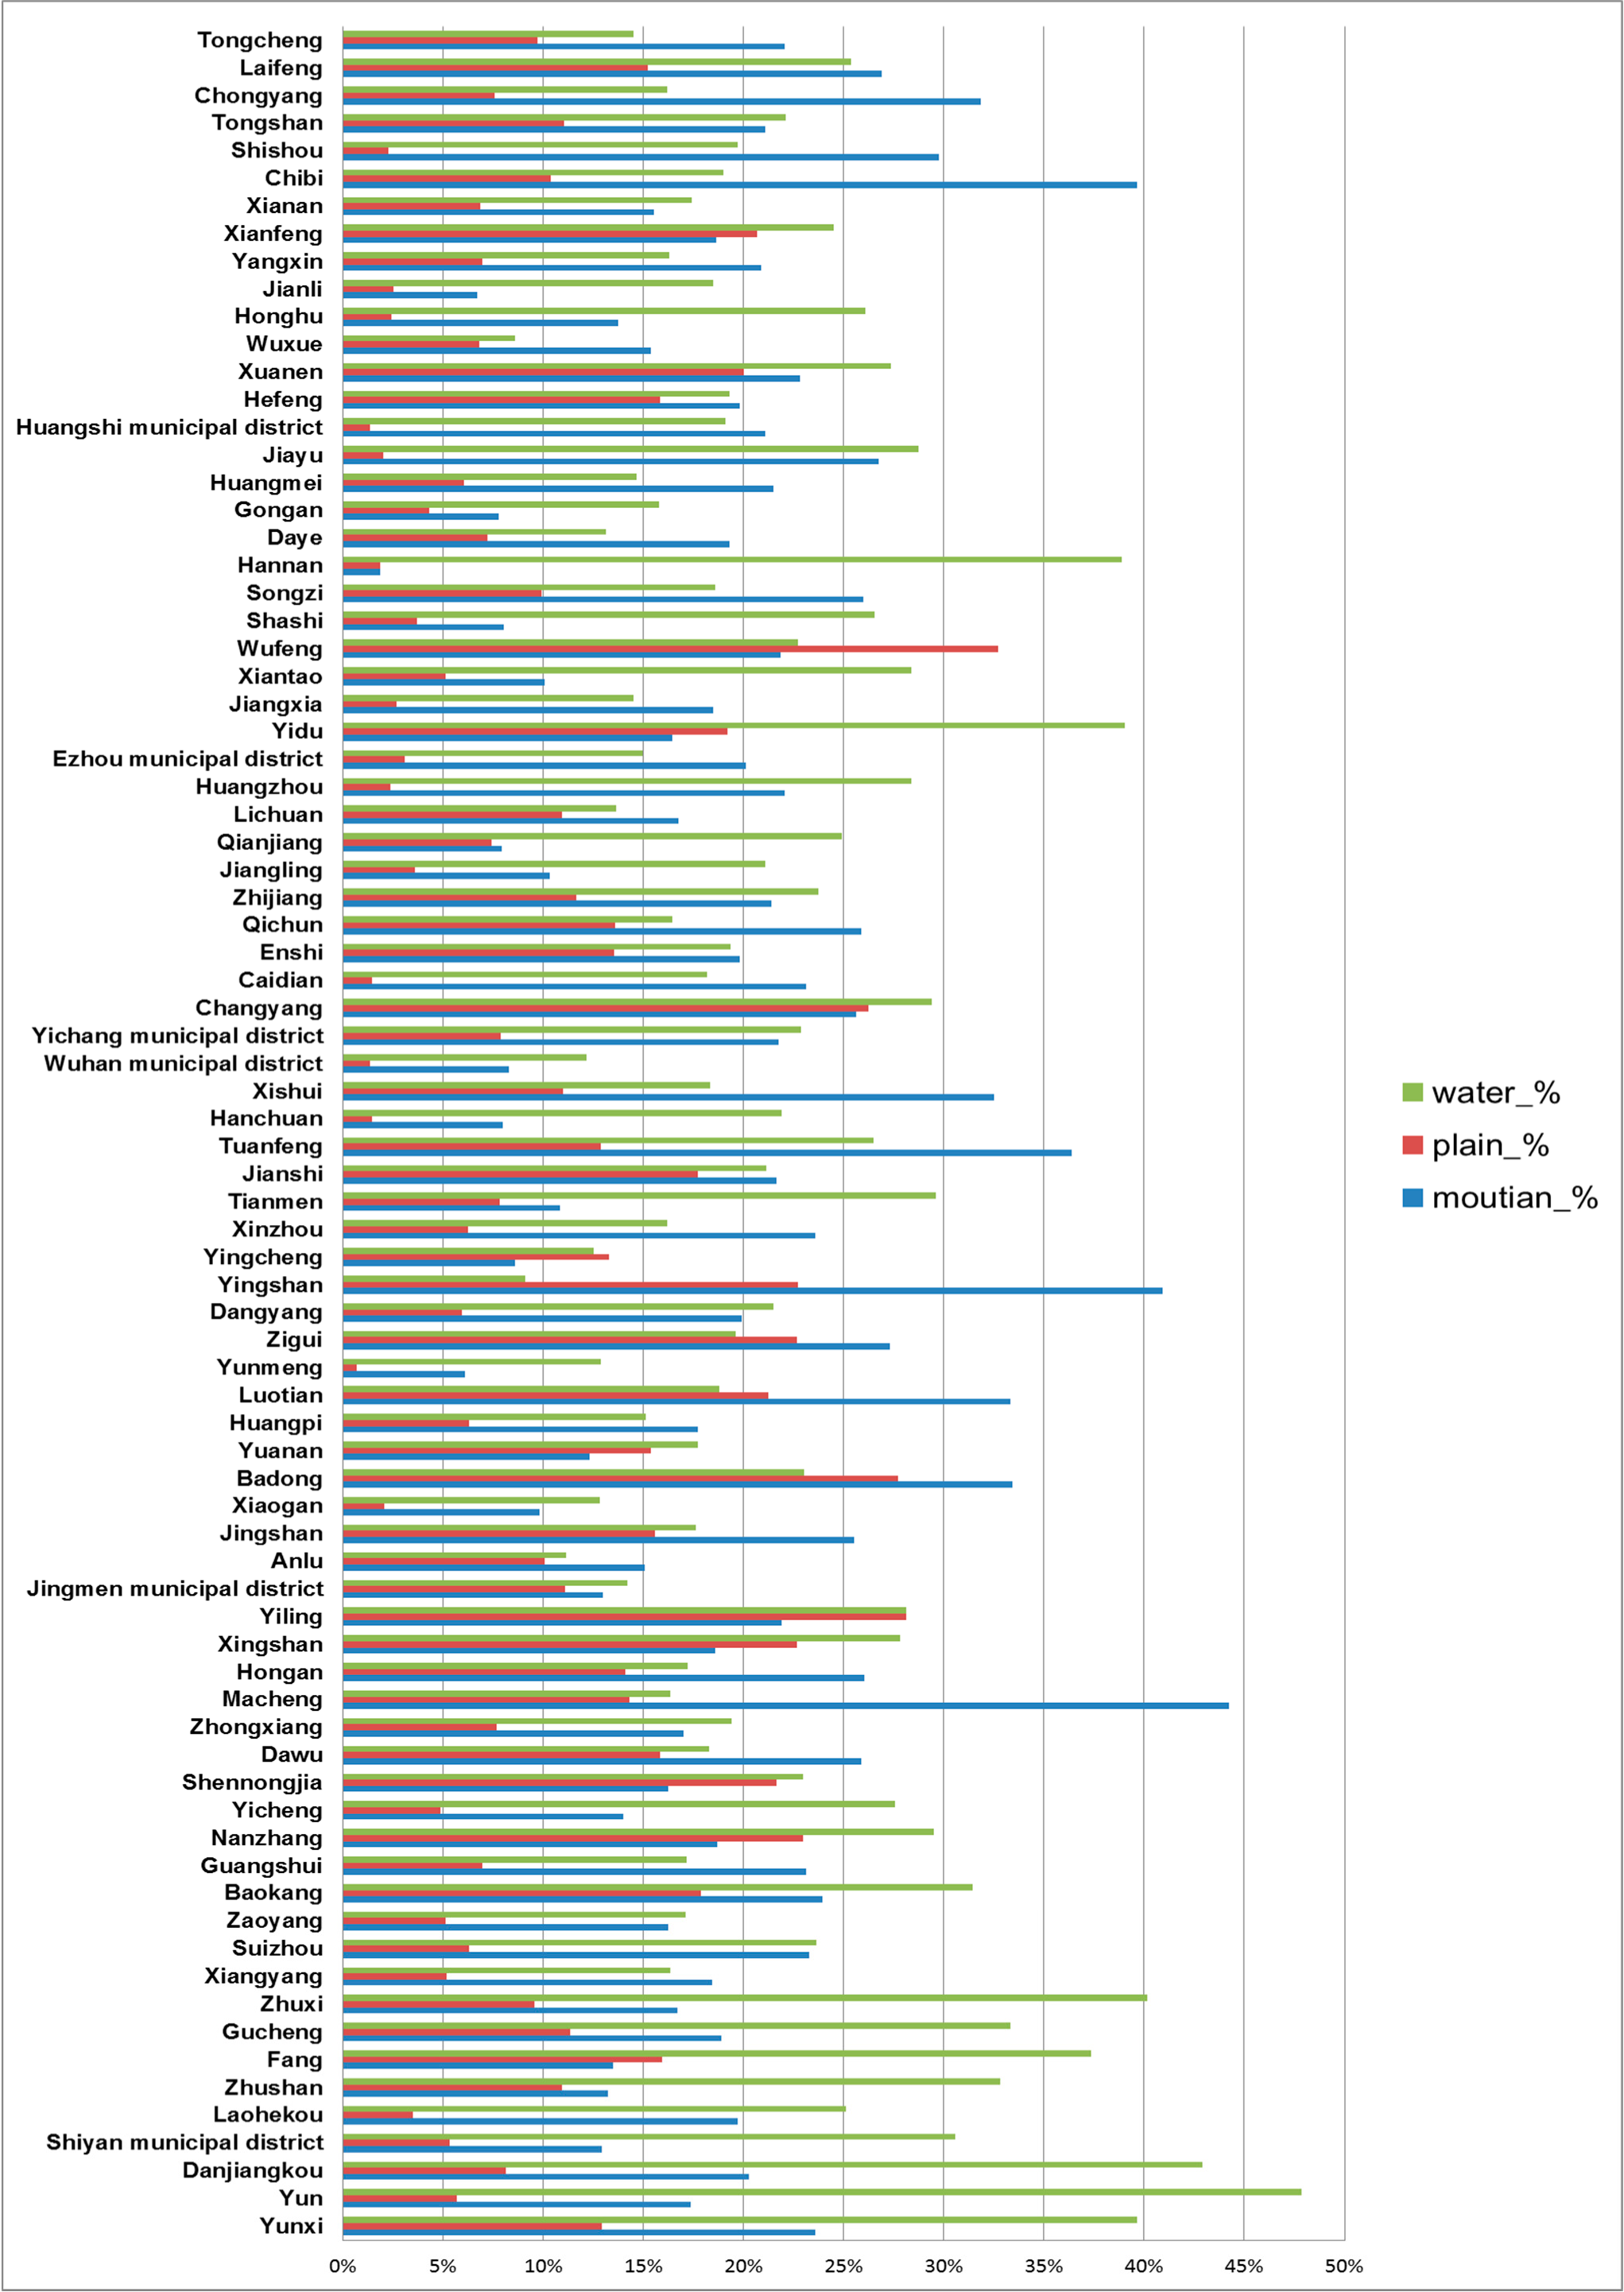
Figure 5). In general, the trends of these three types were coincident, meaning that the counts of the three types of landscape-related toponyms showed a parallel trend. However, because the total number of toponyms of each county varied, the absolute numbers were not appropriate. Consequently, another figure was created in which the relative values were expressed as percentages. The relative abundances of landscape-related toponyms (mountain, plain and water) of the 80 county-level administrative districts are shown in
Figure 6. This figure is much better suited for explaining differences in the quantity of the landscape-related toponyms in the 80 counties.
6. Conclusions
A geographical name is a reflection of the regional culture. Thus, geographical names are also an important part of the cultural heritage. Using statistical and GIS methods, this study directly and clearly demonstrated the correlation of geographical names at the county and landscape levels in Hubei Province. In addition, were determined that there are relationships between geographical names and landscape types. Geographical names are one of the oldest linguistic cultures in human history. The formation of geographical names is a historical process and may develop with changes in people’s perceptions. Thus it’s still reasonable and valuable of our research though it can’t explain for every single case.
Geographical names remain important cultural sources and spatial records of past generations. Because they are distinctly associated with the rural landscape, further research should be directed at the possibility of applying geographical names when reorganising agricultural land; this process is likely to occur in the near future.
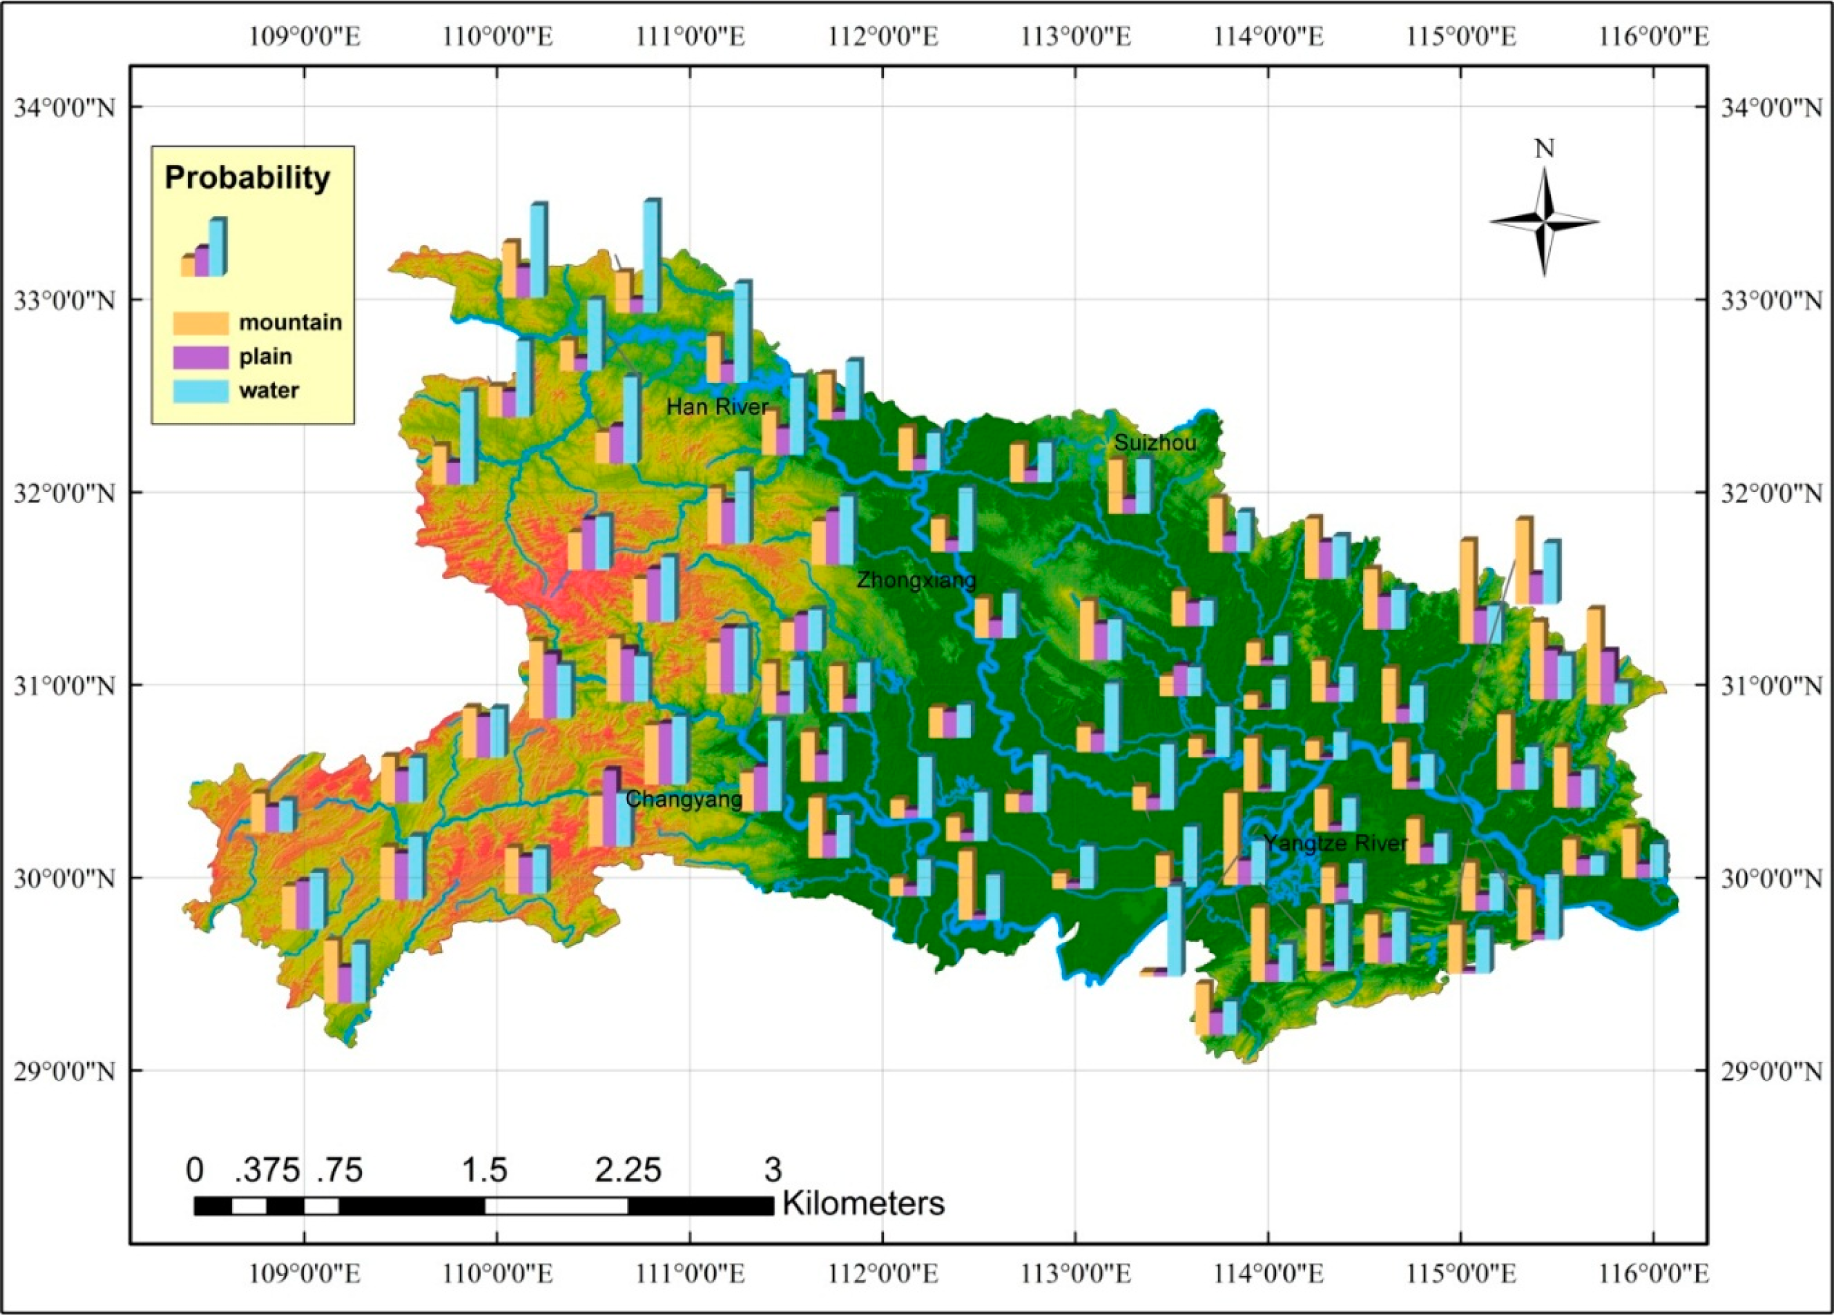
This study analysed the landscape of place names in Hubei Province. Through GIS-based mapping, we clearly illustrated the probability distribution of landscape-related words of toponyms in Hubei Province. GIS-based mapping are becoming more important tools in landscape analysis for its powerful spatial analysis and display function [
46]. Geographical names represent responses to the cultural landscape and physical environment. Combined with elevation and slope features, geographical names are more interesting in specific landscapes like mountains. There is a strong relationship between the river systems density and the ratio of geographical names with water features in all geographical names with statistical significance. In Hubei Province, the conclusion can be draw from the regression analysis: the more rivers, the more geographical names with water features. In some case, the geographical names are a reflection of the natural geographical landscape features. We calculate the information entropy from place names of each county, and find that the bigger the information entropy, the more uniform the types of place name distribution. Information entropy can reflect the uncertainty and diversity of place names in Hubei Province. By comparing the information entropy, we can conclude the place names distribution and types of place names. From the result we can know that the density of place names in the central region is much smaller than in eastern and western Hubei Province.
Acknowledgments
We thank the Department of Civil Affairs of Hubei Province for providing the toponyms dataset for Hubei Province used in this experiment. This project was funded by the Fund for Fostering Talents in Basic Science of the National Natural Science Foundation of China (No. J1103409) and the National Natural Science Foundation of China (Project No. 41271455/D0108).
Author Contributions
Xixi Chen, Tao Hu, Fu Ren, Lan Li, Nan Gao, and Deng Chen all contributed to this study. Xixi Chen conducted the main experiments and cartography and provided partial analysis of the results. Tao Hu conducted the statistical analyses using programming and correlation analysis of geographical names and river systems. Fu Ren proposed the idea, organised the content, reviewed the literature and provided research funding for the study. Lan Li, Nan Gao and Deng Chen collected and pre-processed data for the experiments and participated in the discussion of the results. All authors have read and approved the final manuscript.
Conflicts of Interest
The authors declare no conflict of interest.
References
- Jett, S.C. Place-naming, environment, and perception among the Canyon de Chelly Navajo of Arizona. Prof. Geogr 1997, 49, 481–493. [Google Scholar]
- Campbell, J.C. Stream generic terms as indicators of historical settlement patterns. Names 1991, 39, 333–365. [Google Scholar]
- Freitas, L.; Afonso, M.J.; Devy-Vareta, N.; Marques, J.M.; Gomes, A.; Chaminé, H.I. Coupling hydrotoponymy and GIS cartography: A case study of hydrohistorical issues in urban groundwater systems, Porto, NW Portugal. Geogr. Res 2014, 52, 182–197. [Google Scholar]
- Hudson, B.J. The naming of waterfalls. Geogr. Res 2013, 51, 85–93. [Google Scholar]
- Kitson, P.R. British and European river-names. Trans. Philol. Soc 1996, 94, 73–118. [Google Scholar]
- Nicolae, I. Camino de Santiago: Place names and street names as border posts in the collective memory. Hum. Geogr. J. Stud. Res. Hum. Geogr 2010, 4, 17–31. [Google Scholar]
- Wang, F.; Hartmann, J.; Luo, W. GIS-based spatial analysis of Tai place names in southern China: An exploratory study of methodology. Geogr. Inf. Sci 2006, 12, 1–9. [Google Scholar]
- Wang, B.; Situ, S. Analysis of spatial characteristics of place names landscape based on GIS technology in Guangdong Province. Geogr. Res 2007, 2, 238–248. [Google Scholar]
- Wang, F.; Wang, G.; Hartmann, J. Sinification of Zhuang place names in Guangxi, China: A GIS-based spatial analysis approach. Trans. Inst. Br. Geogr 2012, 37, 317–333. [Google Scholar]
- Jung, C. Korean perceptions of the environment as viewed through village names. Korea J 2012, 52, 74–104. [Google Scholar]
- Seidl, N.P. Significance of toponyms, with emphasis on field names, for studying cultural landscape. Acta Geogr. Slov 2008, 48, 33–56. [Google Scholar]
- Li, J.; Mi, W.; Feng, C.; Yang, X. An analysis on toponym cultural landscape based on GIS application in Zhongwei County, Ningxia Municipality. Hum. Geogra 2011, 1, 100–104. [Google Scholar]
- Guan, Y. Placename and geographical distribution of nationality. J. Guizhou Norm. Univ 2007, 3, 13–19. [Google Scholar]
- O’Connor, L.; Kroefges, P.C. The land remembers: Landscape terms and place names in Lowland Chontal of Oaxaca, Mexico. Lang. Sci 2008, 30, 291–315. [Google Scholar]
- Boillat, S.; Serrano, E.; Rist, S. The importance of place names in the search for ecosystem-like concepts in indigenous societies: An example from the Bolivian Andes. Environ. Manag 2013, 51, 663–678. [Google Scholar]
- Čargonja, H.; Đaković, B.; Alegro, A. Plants and geographical names in Croatia. Coll. Antropol 2008, 32, 927–943. [Google Scholar]
- Senft, G. Landscape terms and place names in the Trobriand Islands—the Kaile’una subset. Lang. Sci 2008, 30, 340–361. [Google Scholar]
- Vasardani, M.; Winter, S.; Richter, K.F. Locating place names from place descriptions. Int. J. Geogr. Inf. Sci 2013, 27, 2509–2532. [Google Scholar]
- Luo, W.; Hartmann, J.; Li, J. GIS mapping and analysis of Tai linguistic and settlement patterns in southern China. Geogr. Inf. Sci 2000, 6, 129–136. [Google Scholar]
- Radding, L.; Western, J. What’s in a name? Linguistic, geography, and toponyms. Geogr. Rev 2010, 100, 394–412. [Google Scholar]
- Burenhult, N.; Levinson, S.C. Language and landscape: A cross-linguistic perspective. Lang. Sci 2008, 30, 135–150. [Google Scholar]
- Sandred, K.I. English stead—A changeable place-name element in a changing community. Stud. Neophilol 2001, 73, 164–170. [Google Scholar]
- Bohnemeyer, J.; Burenhult, N.; Enfield, N.J. Landscape terms and place names elicitation guide. Field Man 2004, 9, 75–79. [Google Scholar]
- Enfield, N.J. Linguistic categories and their utilities: The case of Lao landscape terms. Lang. Sci 2008, 30, 227–255. [Google Scholar]
- Hirsch, E.; OHanlon, M. The Anthropology of Landscape: Perspectives on Place and Space; Oxford University Press: Oxford, UK, 1995. [Google Scholar]
- Hunn, E. Columbia Plateau Indian place names: What can they teach us? J. Linguist. Anthropol 1996, 6, 3–26. [Google Scholar]
- Levinson, S.C. Space in Language and Cognition: Explorations in Cognitive Diversity; Cambridge University Press: Cambridge, UK, 2003. [Google Scholar]
- Majid, A.; Bowerman, M.; Kita, S. Can language restructure cognition? The case for space. Trends Cogn. Sci 2004, 8, 108–114. [Google Scholar]
- Mark, D.M.; Turk, A.G. Landscape categories in Yindjibarndi: Ontology, environment, and language. In Spatial Information Theory. Foundations of Geographic Information Science, Proceedings of COSIT 2003, Kartause Ittingen, Switzerland, 24–28 September 2003.Kuhn, W.; Worboys, M.F.; Timpf, S. (Eds.) Lecture Notes in Computer Science; Volume 2825, Springer: Berlin/Heidelberg, Germany, 2003; pp. 28–45.
- Rogerson, P. Statistical Methods for Geography; Sage: New York, NY, USA, 2001. [Google Scholar]
- Davidson-Hunt, I.; Berkes, F. Learning as you journey: Anishinaabe perception of social-ecological environments and adaptive learning. Conserv. Ecol 2003, 8, 5. [Google Scholar]
- Glaser, M. The social dimension in ecosystem management: Strengths and weaknesses of human-nature mind maps. Hum. Ecol. Rev 2006, 13, 122. [Google Scholar]
- Hunn, E.S.; Meilleur, B.A. Toward a theory of landscape ethno ecological classification. In Landscape Ethnoecology: Concepts of Physical and Biotic Space; Berghahn Books: New York, NY, USA, 2010; pp. 15–26. [Google Scholar]
- Pretty, J. Interdisciplinary progress in approaches to address social-ecological and ecocultural systems. Environ. Conserv 2011, 38, 127–139. [Google Scholar] [Green Version]
- Li, B.; Pan, B.; Han, J. Basic terrestrial geomorphological types in China and their circumscriptions. Quat. Sci 2008, 28, 535–543. [Google Scholar]
- The Land Use Updating Investigation Technical Regulations; Ministry of Land and Resources of the People’s Republic of China: Beijing, China, 2003.
- Shannon, C.E. A mathematical theory of communication. Bell Syst. Tech. J 1948, 27. [Google Scholar]
- Sukhov, V.I. Information capacity of a map entropy. Geod. Aero Photogr 1967, 10, 212–215. [Google Scholar]
- Neumann, J. The topological information content of a map/an attempt at a rehabilitation of information theory in cartography. Cartographica 1994, 31, 26–34. [Google Scholar]
- Li, Z.; Huang, P. Quantitative measures for spatial information of maps. Int. J. Geogr. Inf. Sci 2002, 16, 699–709. [Google Scholar]
- Shinde, K.A. Place-making and environmental change in a Hindu pilgrimage site in India. Geoforum 2012, 43, 116–127. [Google Scholar]
- Tuan, Y.F. Space and Place: The Perspective of Experience; University of Minnesota Press: Minneapolis, MN, USA, 1977. [Google Scholar]
- Rose-Redwood, R.; Alderman, D.; Azaryahu, M. Geographies of toponymic inscription: New directions in critical place-name studies. Prog. Hum. Geogr 2010, 34, 453–470. [Google Scholar]
- Njoh, A.J. Toponymic inscription, physical addressing and the challenge of urban management in an era of globalization in Cameroon. Habitat Int 2010, 34, 427–435. [Google Scholar]
- Sweeney, S.; Jurek, M.; Bednar, M. Using place names to interpret former floodplain connectivity in the Morava River, Czech Republic. Lands. Ecol 2007, 22, 1007–1018. [Google Scholar]
- Smith, D.A.; Herlihy, P.H.; Viera, A.R. Using participatory research mapping and GIS to explore local geographic knowledge of indigenous landscapes in Mexico. Focus Geogr 2012, 55, 119–124. [Google Scholar]
© 2014 by the authors; licensee MDPI, Basel, Switzerland This article is an open access article distributed under the terms and conditions of the Creative Commons Attribution license (http://creativecommons.org/licenses/by/4.0/).


