Article

Entropy-Based Incomplete Cholesky Decomposition for a Scalable Spectral Clustering Algorithm: Computational Studies and Sensitivity Analysis

1
ESAT-STADIUS, Katholieke Universiteit Leuven, Kasteelpark Arenberg 10, B-3001 Leuven, Belgium
2
Department of Computer Science, Katholieke Universiteit Leuven, Celestijnenlaan 200A, B-3001 Leuven, Belgium
*
Author to whom correspondence should be addressed.
Submission received: 3 February 2016 / Revised: 21 April 2016 / Accepted: 9 May 2016 / Published: 13 May 2016
(This article belongs to the Special Issue Information Theoretic Learning)

Abstract

:
Spectral clustering methods allow datasets to be partitioned into clusters by mapping the input datapoints into the space spanned by the eigenvectors of the Laplacian matrix. In this article, we make use of the incomplete Cholesky decomposition (ICD) to construct an approximation of the graph Laplacian and reduce the size of the related eigenvalue problem from N to m, with m N . In particular, we introduce a new stopping criterion based on normalized mutual information between consecutive partitions, which terminates the ICD when the change in the cluster assignments is below a given threshold. Compared with existing ICD-based spectral clustering approaches, the proposed method allows the reduction of the number m of selected pivots (i.e., to obtain a sparser model) and at the same time, to maintain high clustering quality. The method scales linearly with respect to the number of input datapoints N and has low memory requirements, because only matrices of size N × m and m × m are calculated (in contrast to standard spectral clustering, where the construction of the full N × N similarity matrix is needed). Furthermore, we show that the number of clusters can be reliably selected based on the gap heuristics computed using just a small matrix R of size m × m instead of the entire graph Laplacian. The effectiveness of the proposed algorithm is tested on several datasets.

Graphical Abstract

1. Introduction

In this paper, we deal with the data clustering problem. Clustering refers to a technique for partitioning unlabeled data into natural groups, where data points that are related to each other are grouped together and points that are dissimilar are assigned to different groups [1]. In this context, spectral clustering [2,3,4,5] has been shown to be among the most successful methods in many application domains, due mainly to its ability to discover nonlinear clustering boundaries. The algorithm is based on computing the eigendecomposition of a matrix derived from the data called Laplacian. The eigenvectors of the Laplacian represent an embedding of the input data, which reveals the underlying clustering structure. A major drawback of spectral clustering is its computational and memory cost. If we denote the number of datapoints by N, solving the eigenvalue problem has complexity O ( N 3 ) , the construction of the Laplacian matrix has cost O ( N 2 ) , and the Laplacian may not fit into the main memory when N is large. A number of algorithms have been devised to make spectral clustering feasible for large scale applications, which include power iteration clustering [6], spectral clustering in conjunction with the Nyström approximation [7], incremental spectral clustering techniques [8,9,10], kernel spectral clustering [11,12,13], parallel spectral clustering [14], consensus spectral clustering [15], vector quantization-based approximate spectral clustering [16], and approximate pairwise clustering [17]. In this article, we introduce a spectral clustering algorithm that exploits the incomplete Cholesky decomposition to reduce the size of the eigenvalue problem. The idea behind the proposed method is similar to [18], but a number of novelties are introduced. First, a new stopping criterion based on normalized mutual information is devised, which allows us to decrease the number m of selected pivots, and hence, the computational complexity. Second, the number of clusters is automatically selected by means of the eigen-gap heuristics computed on a small similarity matrix of size m × m . Third, a sensitivity analysis shows how to select specific threshold values in order to achieve desired cluster quality, sparsity, and computational time. The rest of this paper is organized as follows. Section 2 summarizes the spectral clustering method and the incomplete Cholesky decomposition. In Section 3, the proposed algorithm is introduced. Section 4 describes the results of the experiments, Section 5 analyzes the computational cost of the proposed algorithm, and finally Section 6 concludes the article.

2. Spectral Clustering

Spectral clustering solves a relaxation of the graph partitioning problem. In its most basic formulation, one is provided with an unweighted/weighted graph and is asked to split it into k non-overlapping groups A 1 , , A k in order to minimize the cut size, which is the number of edges running between the groups (or the sum of their weights). This idea is formalized via the mincut problem [19], that is, the objective of finding k subgraphs such that a minimal number of edges are cut off and that the sum of all weights of these cut edges is minimal. Furthermore, in order to favour balanced clusters, the normalized cut problem can be defined as follows:
min G k tr ( G T L n G ) subject to G T G = I N
where:
  • L n = I D 1 2 S D 1 2 is called the normalized Laplacian;
  • S is the similarity matrix, which describes the topology of the graph;
  • D = diag ( d ) , with d = [ d 1 , , d N ] T and d i = j = 1 N S i j , denotes the degree matrix;
  • G = [ g 1 , , g k ] is the matrix containing the normalized cluster indicator vectors g l = D 1 2 y l | | D 1 2 y l | | 2 ;
  • y l , with l = 1 , , k , is the cluster indicator vector for the l-th cluster. It has a 1 in the entries corresponding to the nodes in the l-th cluster and 0 otherwise. Moreover, the cluster indicator matrix can be defined as Y = [ y 1 , , y k ] { 0 , 1 } N × k ;
  • I N denotes the N × N identity matrix.
Since this is a NP-hard problem, a good approximate solution can be obtained in polynomial time, allowing G to take continuous values; i.e., G R N × k . In this case it can be shown that solving problem (1) is equivalent to finding the solution to the following eigenvalue problem:
L n g l = λ l g l , l = 1 , , k ,
where λ 1 , , λ k are the k smallest eigenvalues of the normalized Laplacian L n , which contain the clustering information.

2.1. Incomplete Cholesky Decomposition

A Cholesky decomposition [20] of a matrix A R N × N is a decomposition of a symmetric positive definite matrix into the product of a lower triangular matrix and its transpose; i.e., A = C C T , and it is widely used to solve linear systems. The incomplete Cholesky decomposition (ICD) [21] allows the reduciton of the computational time required by the Cholesky decomposition by computing a low rank approximation of accuracy τ of the matrix A in O ( m 2 N ) , such that | | A C C T | | F < τ , with C R N × m and m N . In fact, the ICD selects the rows and the columns of A in an appropriate manner, such that the rank of the approximation is close to the rank of the original matrix. In other words, the selected rows and columns, also called pivots, are related to certain data points, and this sparse set of data points is a good representation of the full data set. As discussed in [22], the ICD leads to small numerical error only when there is a fast decay of the eigenvalues. However, as pointed out in [18], this condition is not always met. Therefore, the ICD stopping criterion based on the low rank assumption is not optimal.

2.2. A Reduced Eigenvalue Problem

As described in [18,22], the ICD technique briefly summarized in the previous section can be used to speed up the solution of the spectral clustering eigenvalue problem (2). In this section, we will review the main linear algebra operations that are needed for this purpose. Let’s start by considering the following eigenvalue problem:
L ˜ n g l = λ l ˜ g l , l = 1 , , k ,
with L ˜ n = D 1 2 S D 1 2 , whose eigenvalues λ ˜ l are related to the eigenvalues of L n by the relation λ l ˜ = 1 λ l (the eigenvectors are the same). Therefore, the clustering information is contained in the eigenvectors corresponding to the largest eigenvalues of L ˜ n . If we replace the similarity matrix S with its ICD, we obtain that L ˜ n D ˜ 1 2 C C T D ˜ 1 2 . In order to reduce the size of the eigenvalue problem involving L ˜ n , we can replace D ˜ 1 2 C with its Q R factorization and substitute R with its singular value decomposition to obtain:
L ˜ n D ˜ 1 2 C C T D ˜ 1 2 ( Q R ) ( Q R ) T Q ( U R Σ R V R T ) ( V R Σ R U R T ) Q T Q U R ( Σ R 2 ) U R T Q T ,
where Q R N × m , R R m × m , R = U R Σ R V R , and U R , Σ R , V R R m × m . Notice that now we have to solve an eigenvalue problem of size m × m involving matrix R R T , which can be much smaller than the size N × N of the original problem (3). Furthermore, the eigenvectors of problem (3) can be estimated as g ^ l = Q U R , l , whose related eigenvalues are λ ^ l = σ R , l 2 . Finally, the extraction of the cluster indicator matrix from the top k eigenvectors can be achieved by computing a pivoted L Q decomposition of the eigenvector matrix D 1 2 G ^ as proposed in [23]:
Y ^ = P L Q G ^
where G ^ = [ g ^ 1 , , g ^ k ] , P R N × N is a permutation matrix, L R N × k is a lower triangular matrix, and Q R k × k denotes a unitary matrix. In real-world scenarios, the clusters present a certain amount of overlap. Therefore, matrix Y ^ becomes real-valued and the cluster assignment for point x i is computed as:
j i = arg max l = 1 , , k ( | Y ^ i l | ) .

3. Proposed Algorithm

As explained previously, the classic ICD algorithm is based on the assumption that the spectrum of the Laplacian matrix is characterized by a fast decay. Since this property in some cases does not hold [18], in this article we introduce a novel stopping criterion, which will be explained now.

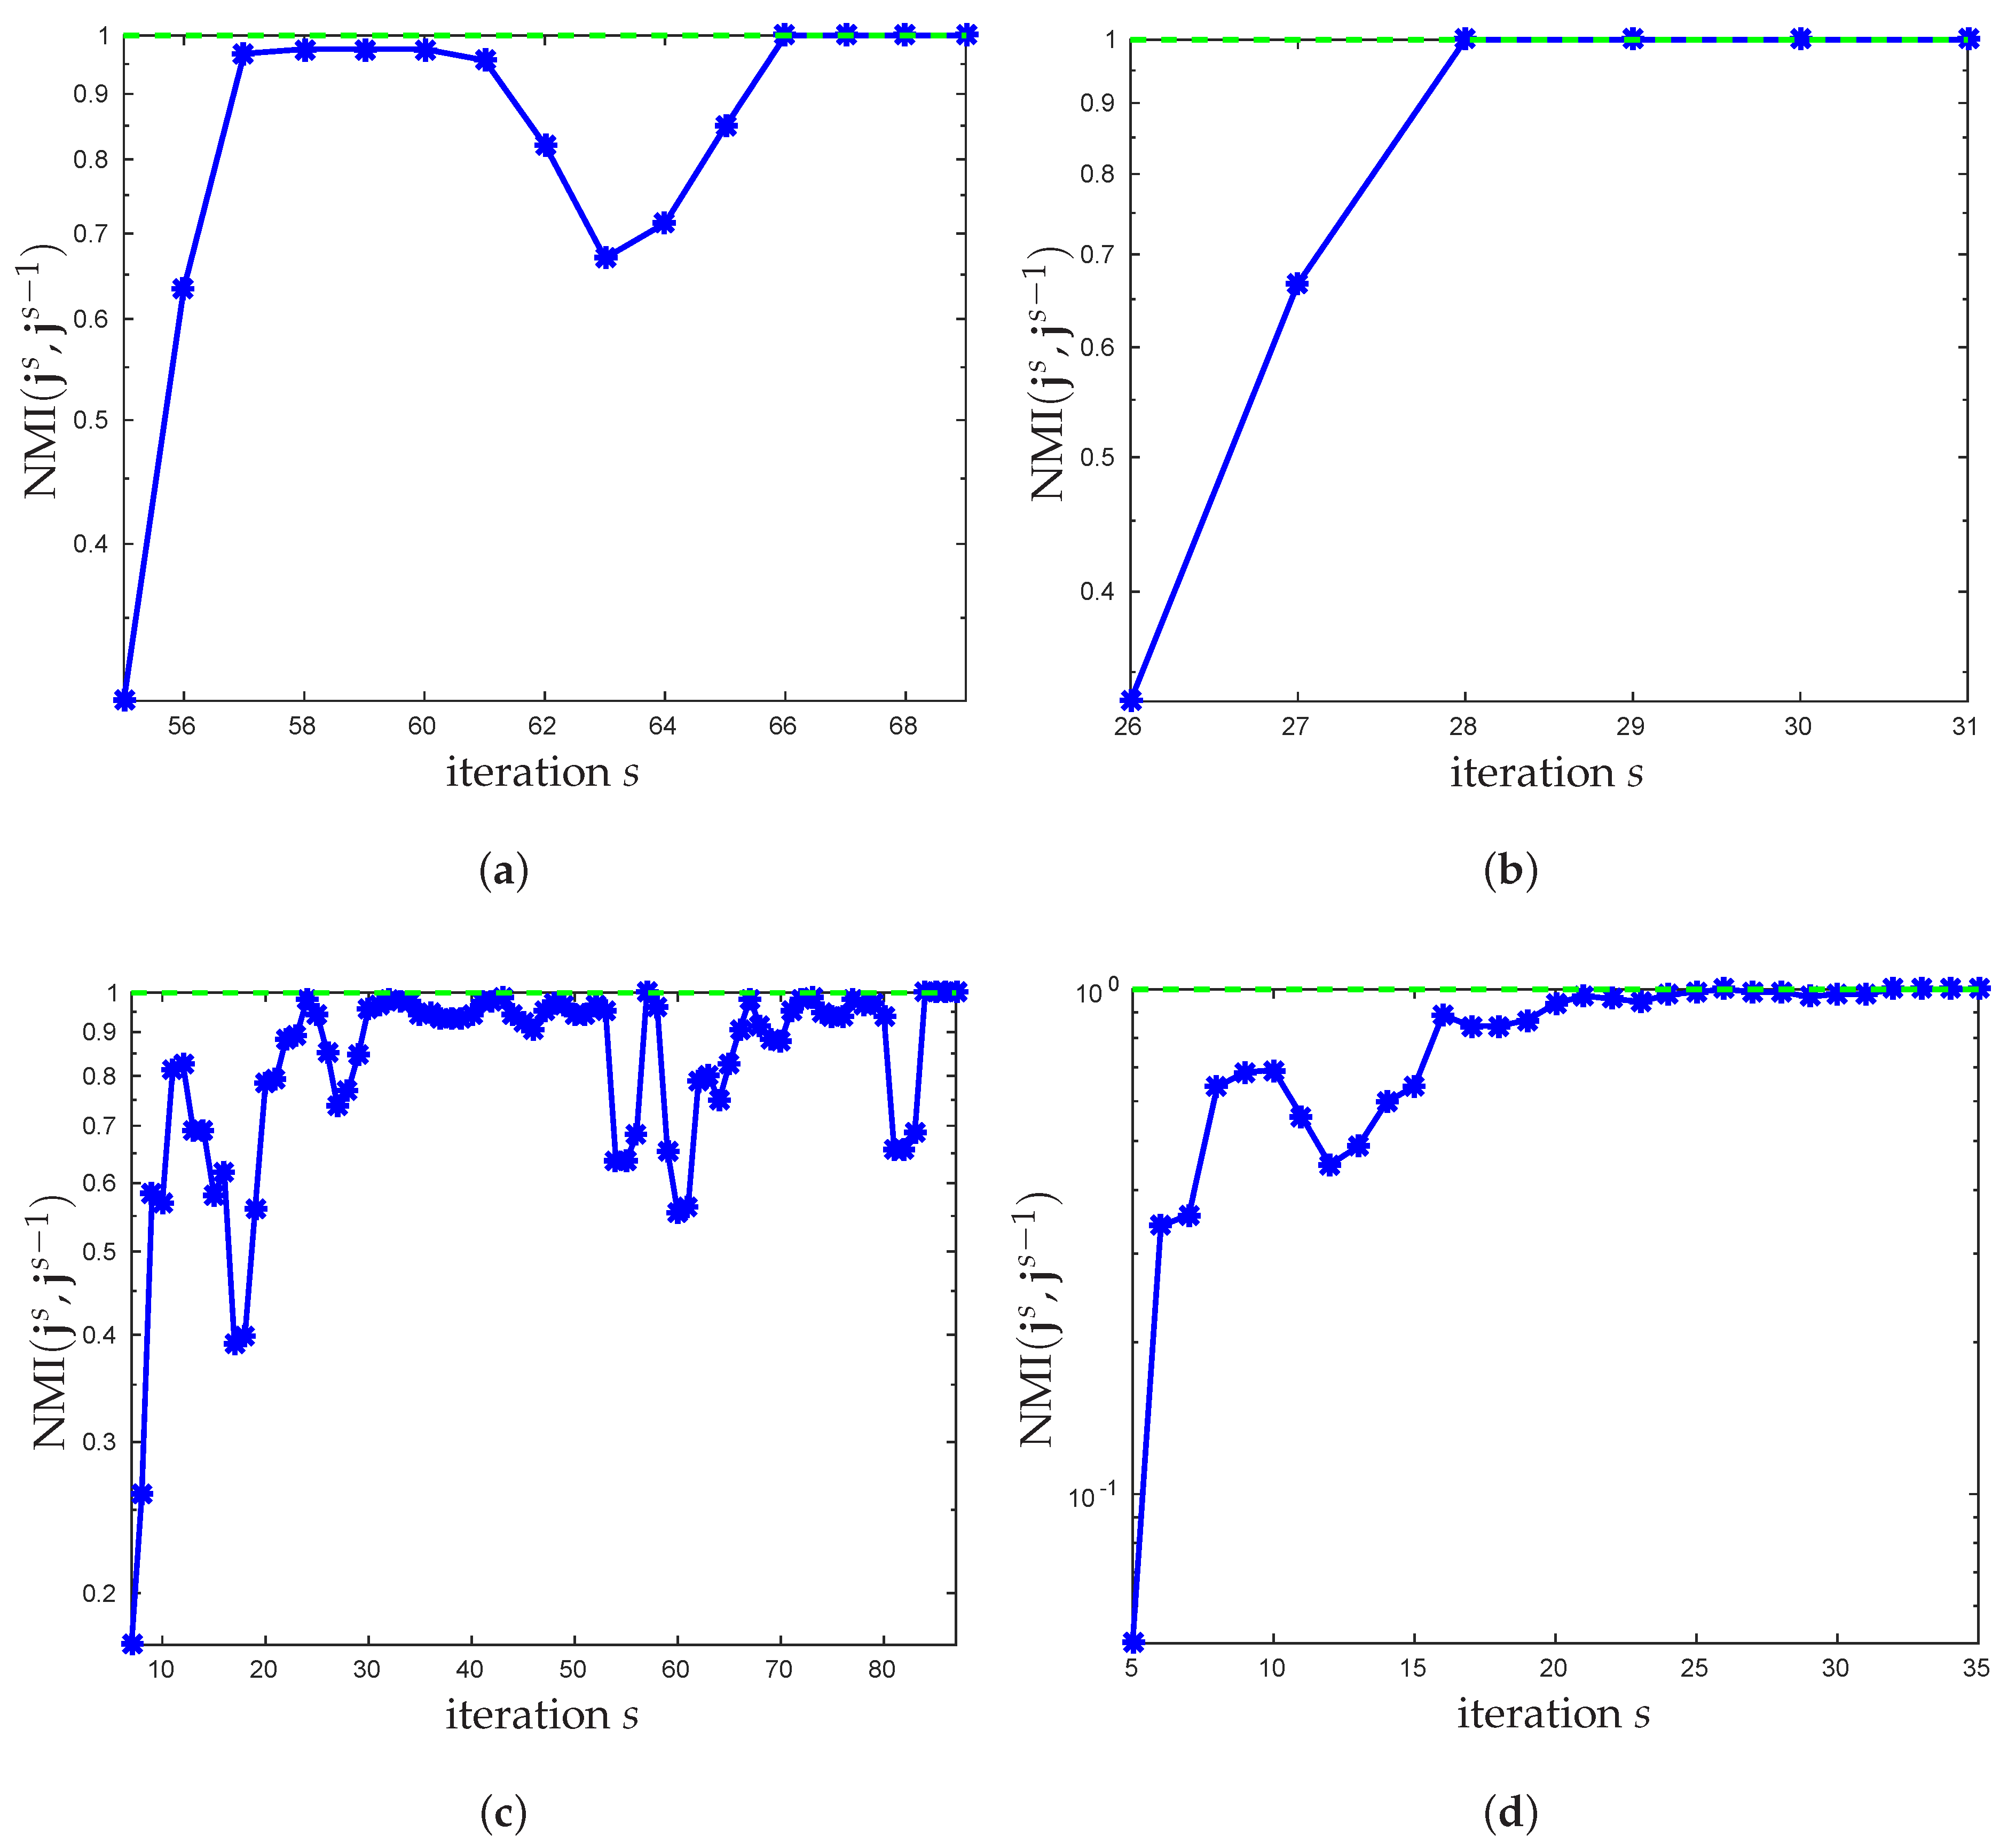
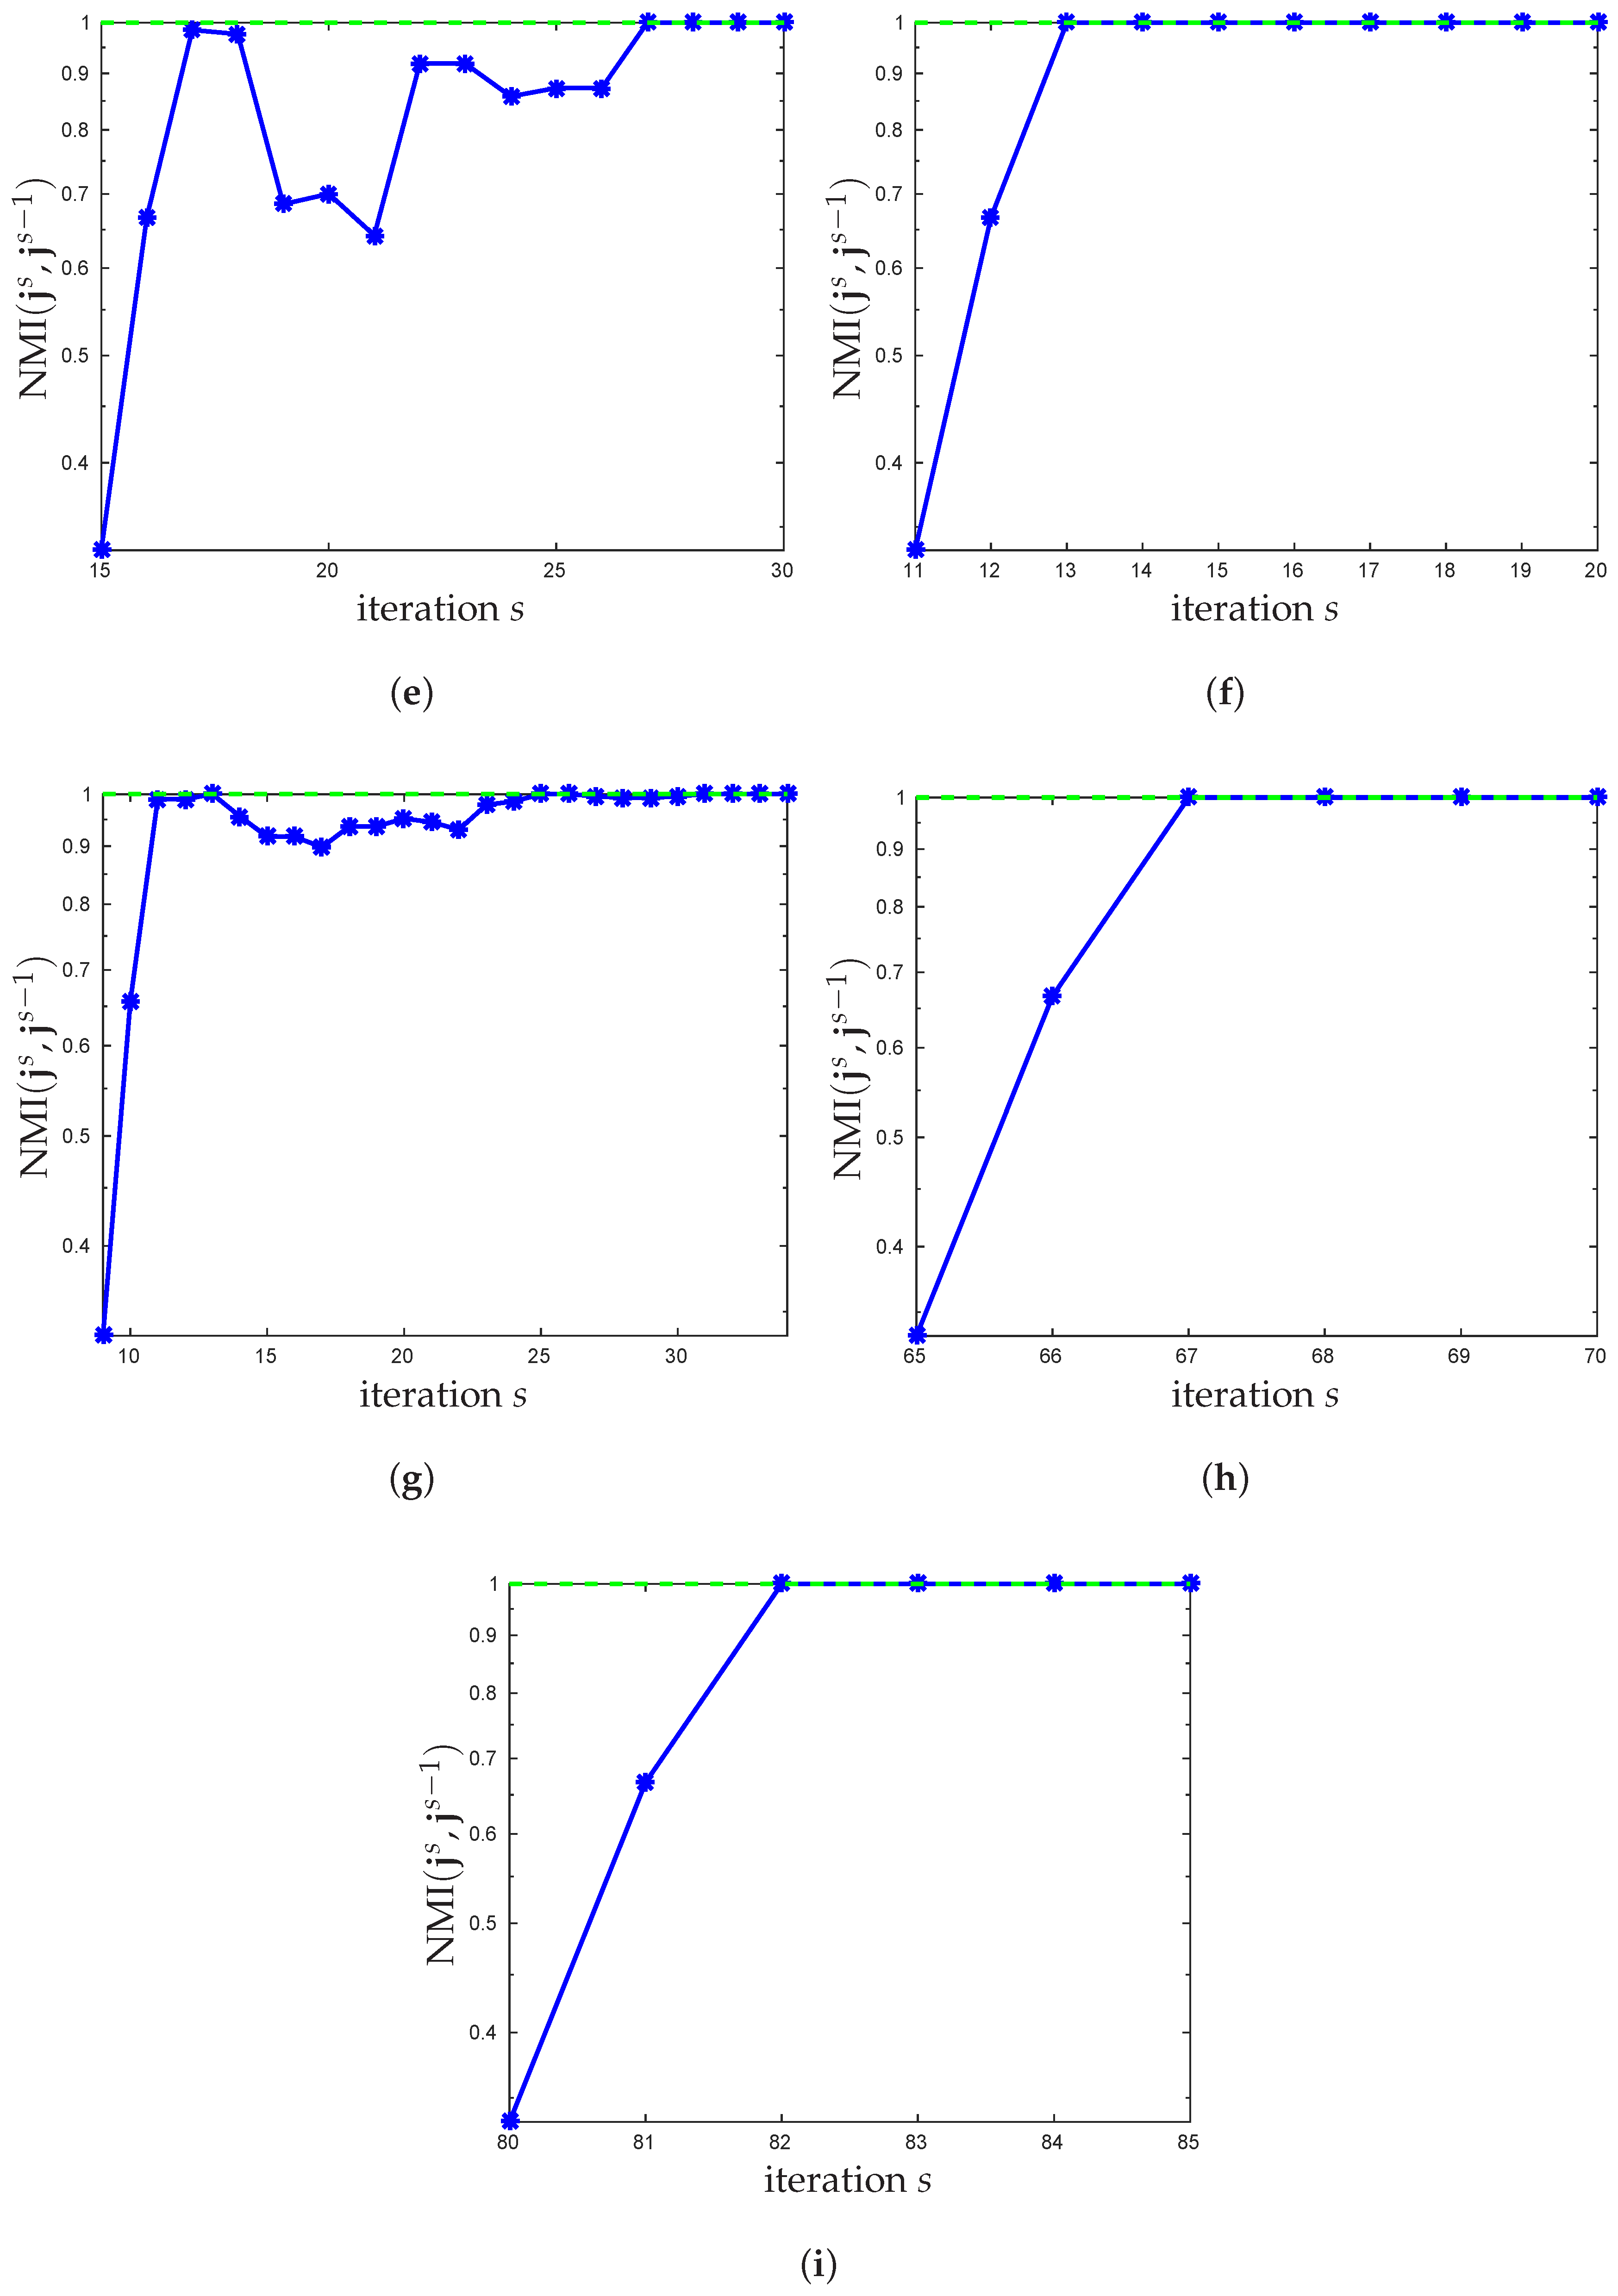
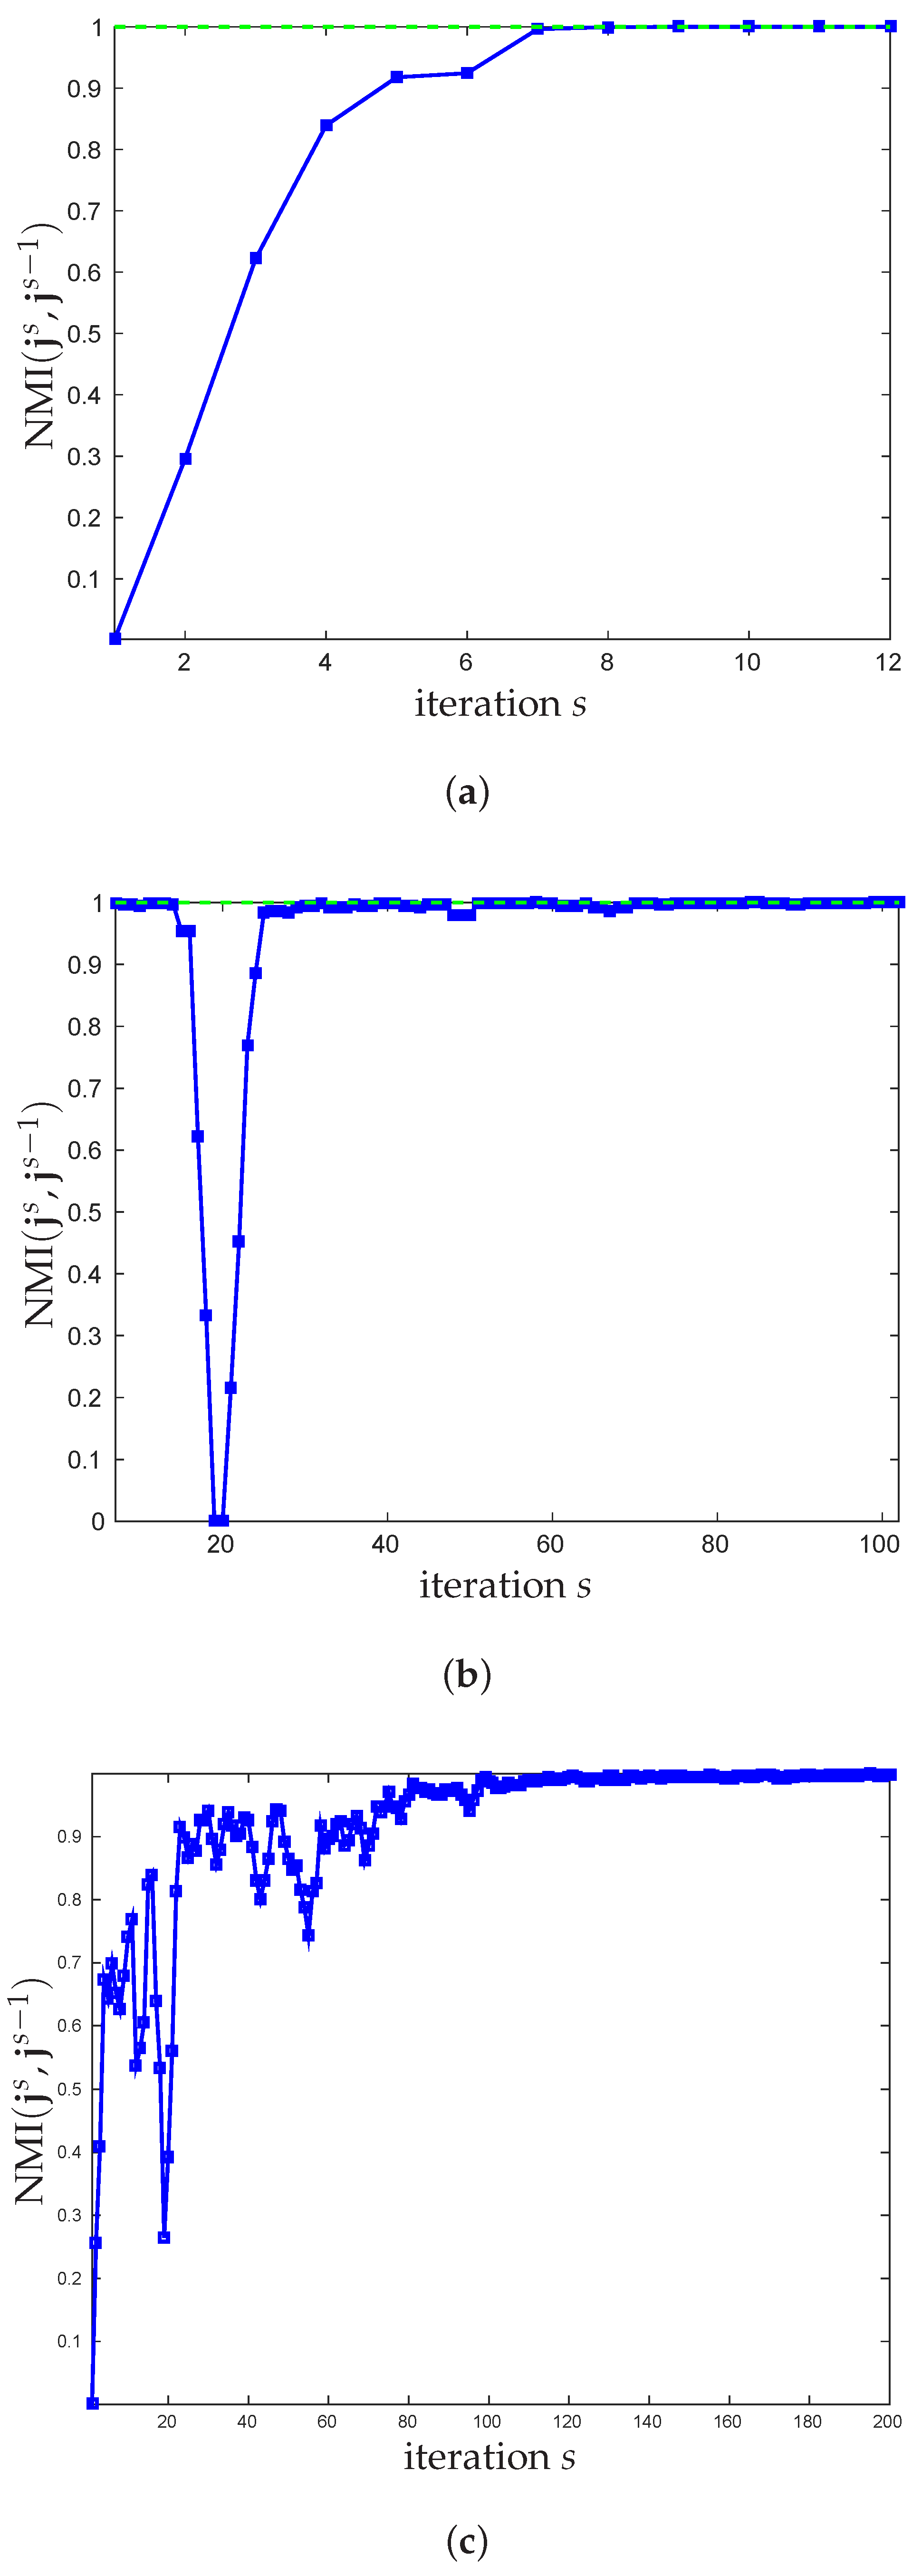
3.1. New Stopping Criterion

The new stopping condition only assumes that the cluster assignments after the selection of each pivot tend to converge. In particular, given the cluster assignments j s at step s and j s 1 at iteration s 1 , with j = [ j 1 , , j N ] , we can compute the normalized mutual information (NMI) [24] as follows:
nmi s = NMI ( j s , j s 1 ) .
The value nmi s measures the statistical information shared between the cluster assignments j s and j s 1 , and takes values in the range [ 0 , 1 ] . It tells us how much knowing one of these clusterings reduces our uncertainty about the other. The higher the NMI, the more useful the information in j s helps us to predict the cluster memberships in j s 1 and viceversa. In practice, this means that when the cluster assignments between two consecutive iterations are the same (up to the labelling), nmi s = 1 . On this basis, we propose to terminate the ICD algorithm when | nmi s 1 | < THR stop , THR stop being a user-specified threshold value. Furthermore, to speed up the procedure, we start to check the convergence of the cluster assignments only when the approximation of the similarity matrix is good enough. An approximation of matrix S implies that the degree of each datapoint is also approximated. Therefore, the ratio r deg = min ( d ˜ ) max ( d ˜ ) can be used to have an idea of the quality of the approximation [18], where d ˜ = C C T 1 N , and min and max denote the minimum and maximum element of a vector. In particular, the convergence of the cluster assignments begins to be monitored when min ( d ˜ ) max ( d ˜ ) > THR deg . From our experience THR stop = THR deg = 10 6 represents a good choice, which prevents termination of the ICD algorithm too early (with poor clustering performance), but also not too late (by selecting more pivots than needed). In this realm, a sensitivity analysis (the study is related to the dataset Three 2D Gaussians) of the proposed algorithm with respect to different threshold settings is depicted in Figure 1. In Figure 2, the trend of nmi s as a function of the number of selected pivots is shown for the synthetic datasets analysed in this paper.

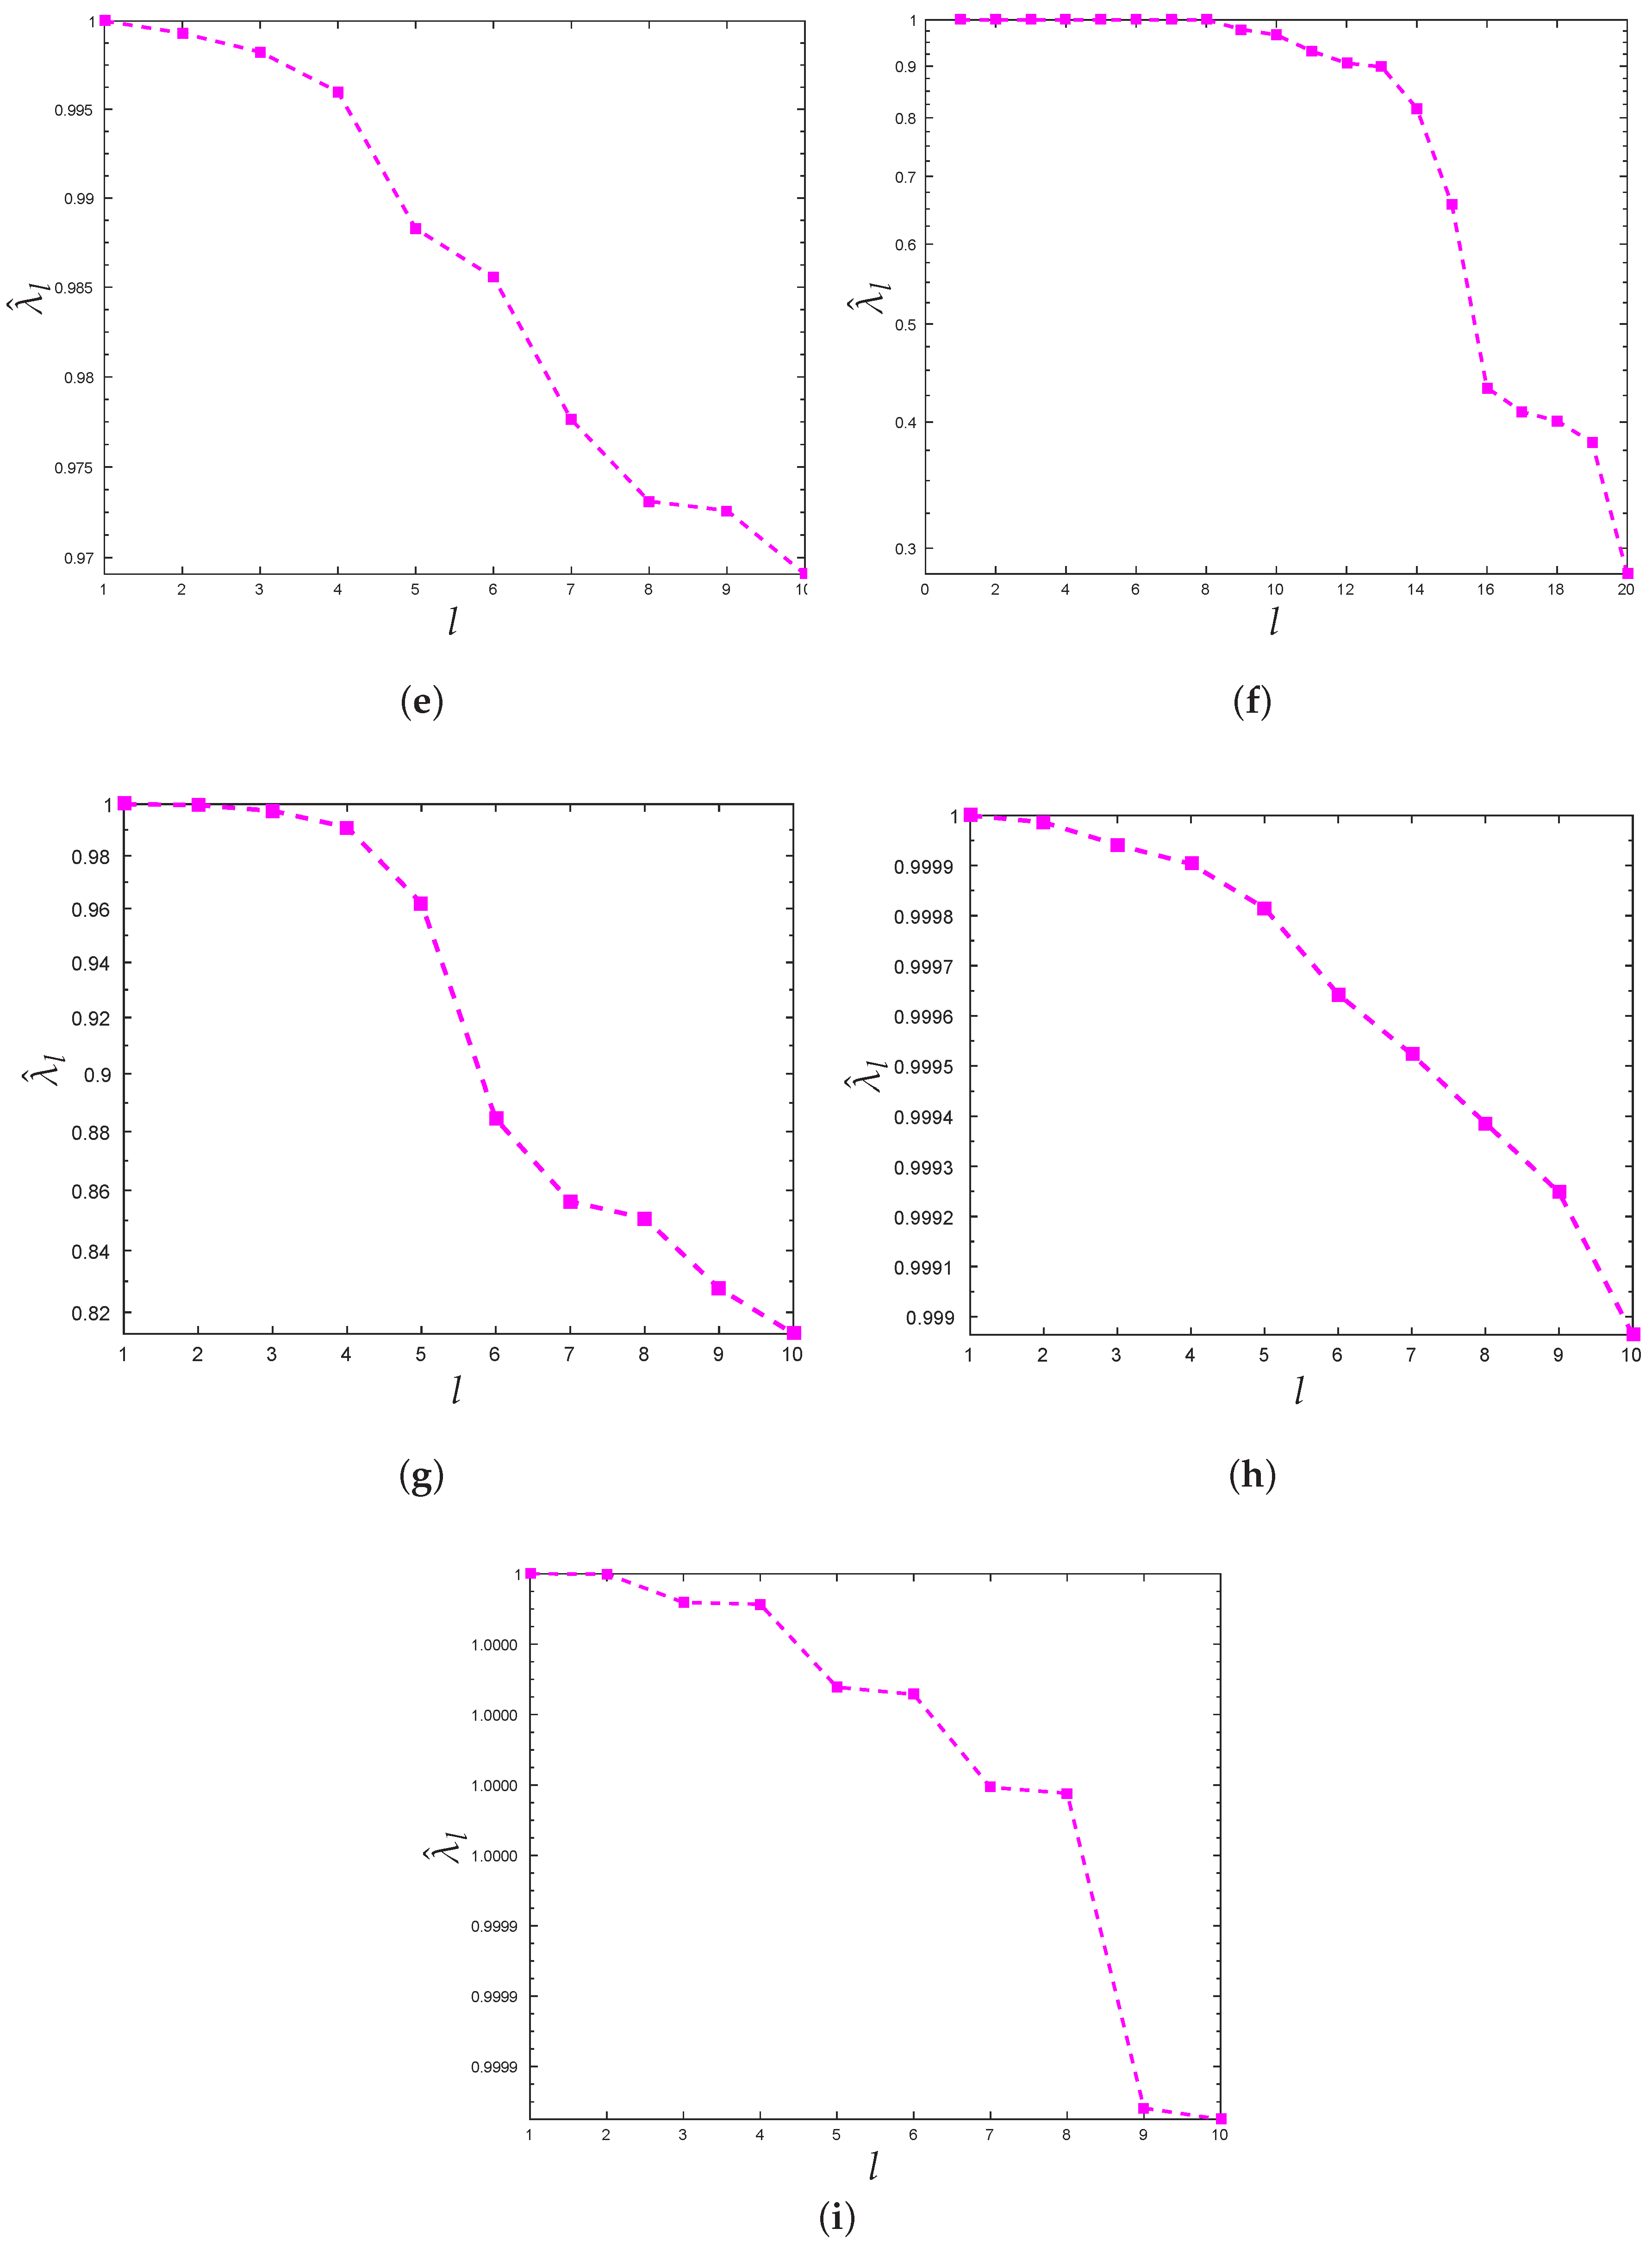
3.2. Choosing the Number of Clusters

The number of clusters k present in the data is not known beforehand and must be chosen carefully to ensure meaningful results. To tackle this issue, we exploit the theoretical fact that the multiplicity of the eigenvalue 1 of the Laplacian L n equals the number of connected components (i.e., clusters) in the graph. In other words, we use the eigen-gap heuristics [4], which unlike standard spectral clustering, in our case is computed using the m × m R matrix (see Equation (4)) rather than the original N × N Laplacian matrix. Furthermore, we consider an eigenvalue to have converged if | λ ^ l 1 | < THR eig . For simplicity, we set THR eig = THR stop = 10 6 , which from our experiments, turned out to be a good choice. In Figure 3, we show through several examples that a meaningful value for k can be detected using only the information provided by the m selected pivots. However, it should be pointed out that the eigengap heuristic can fail in real situations when, due to some overlap between the clusters, the sharp decay of the eigenvalues of the ideal case quickly deteriorates. In this case, the Gershgorin circle theorem, which provides upper bounds on the eigenvalues of the Laplacian matrix, can be utilized to determine a meaningful interval for the number of clusters [25]. Another alternative to select the number of clusters, although more computationally demanding, could be the use of any internal cluster validity criterion in conjunction with the current cluster assignments.
The complete clustering algorithm proposed in this paper, which we call ICD-NMI, is summarized in Algorithm 1. Furthermore, a Matlab implementation can be downloaded from [26].
Entropy 18 00182 i001

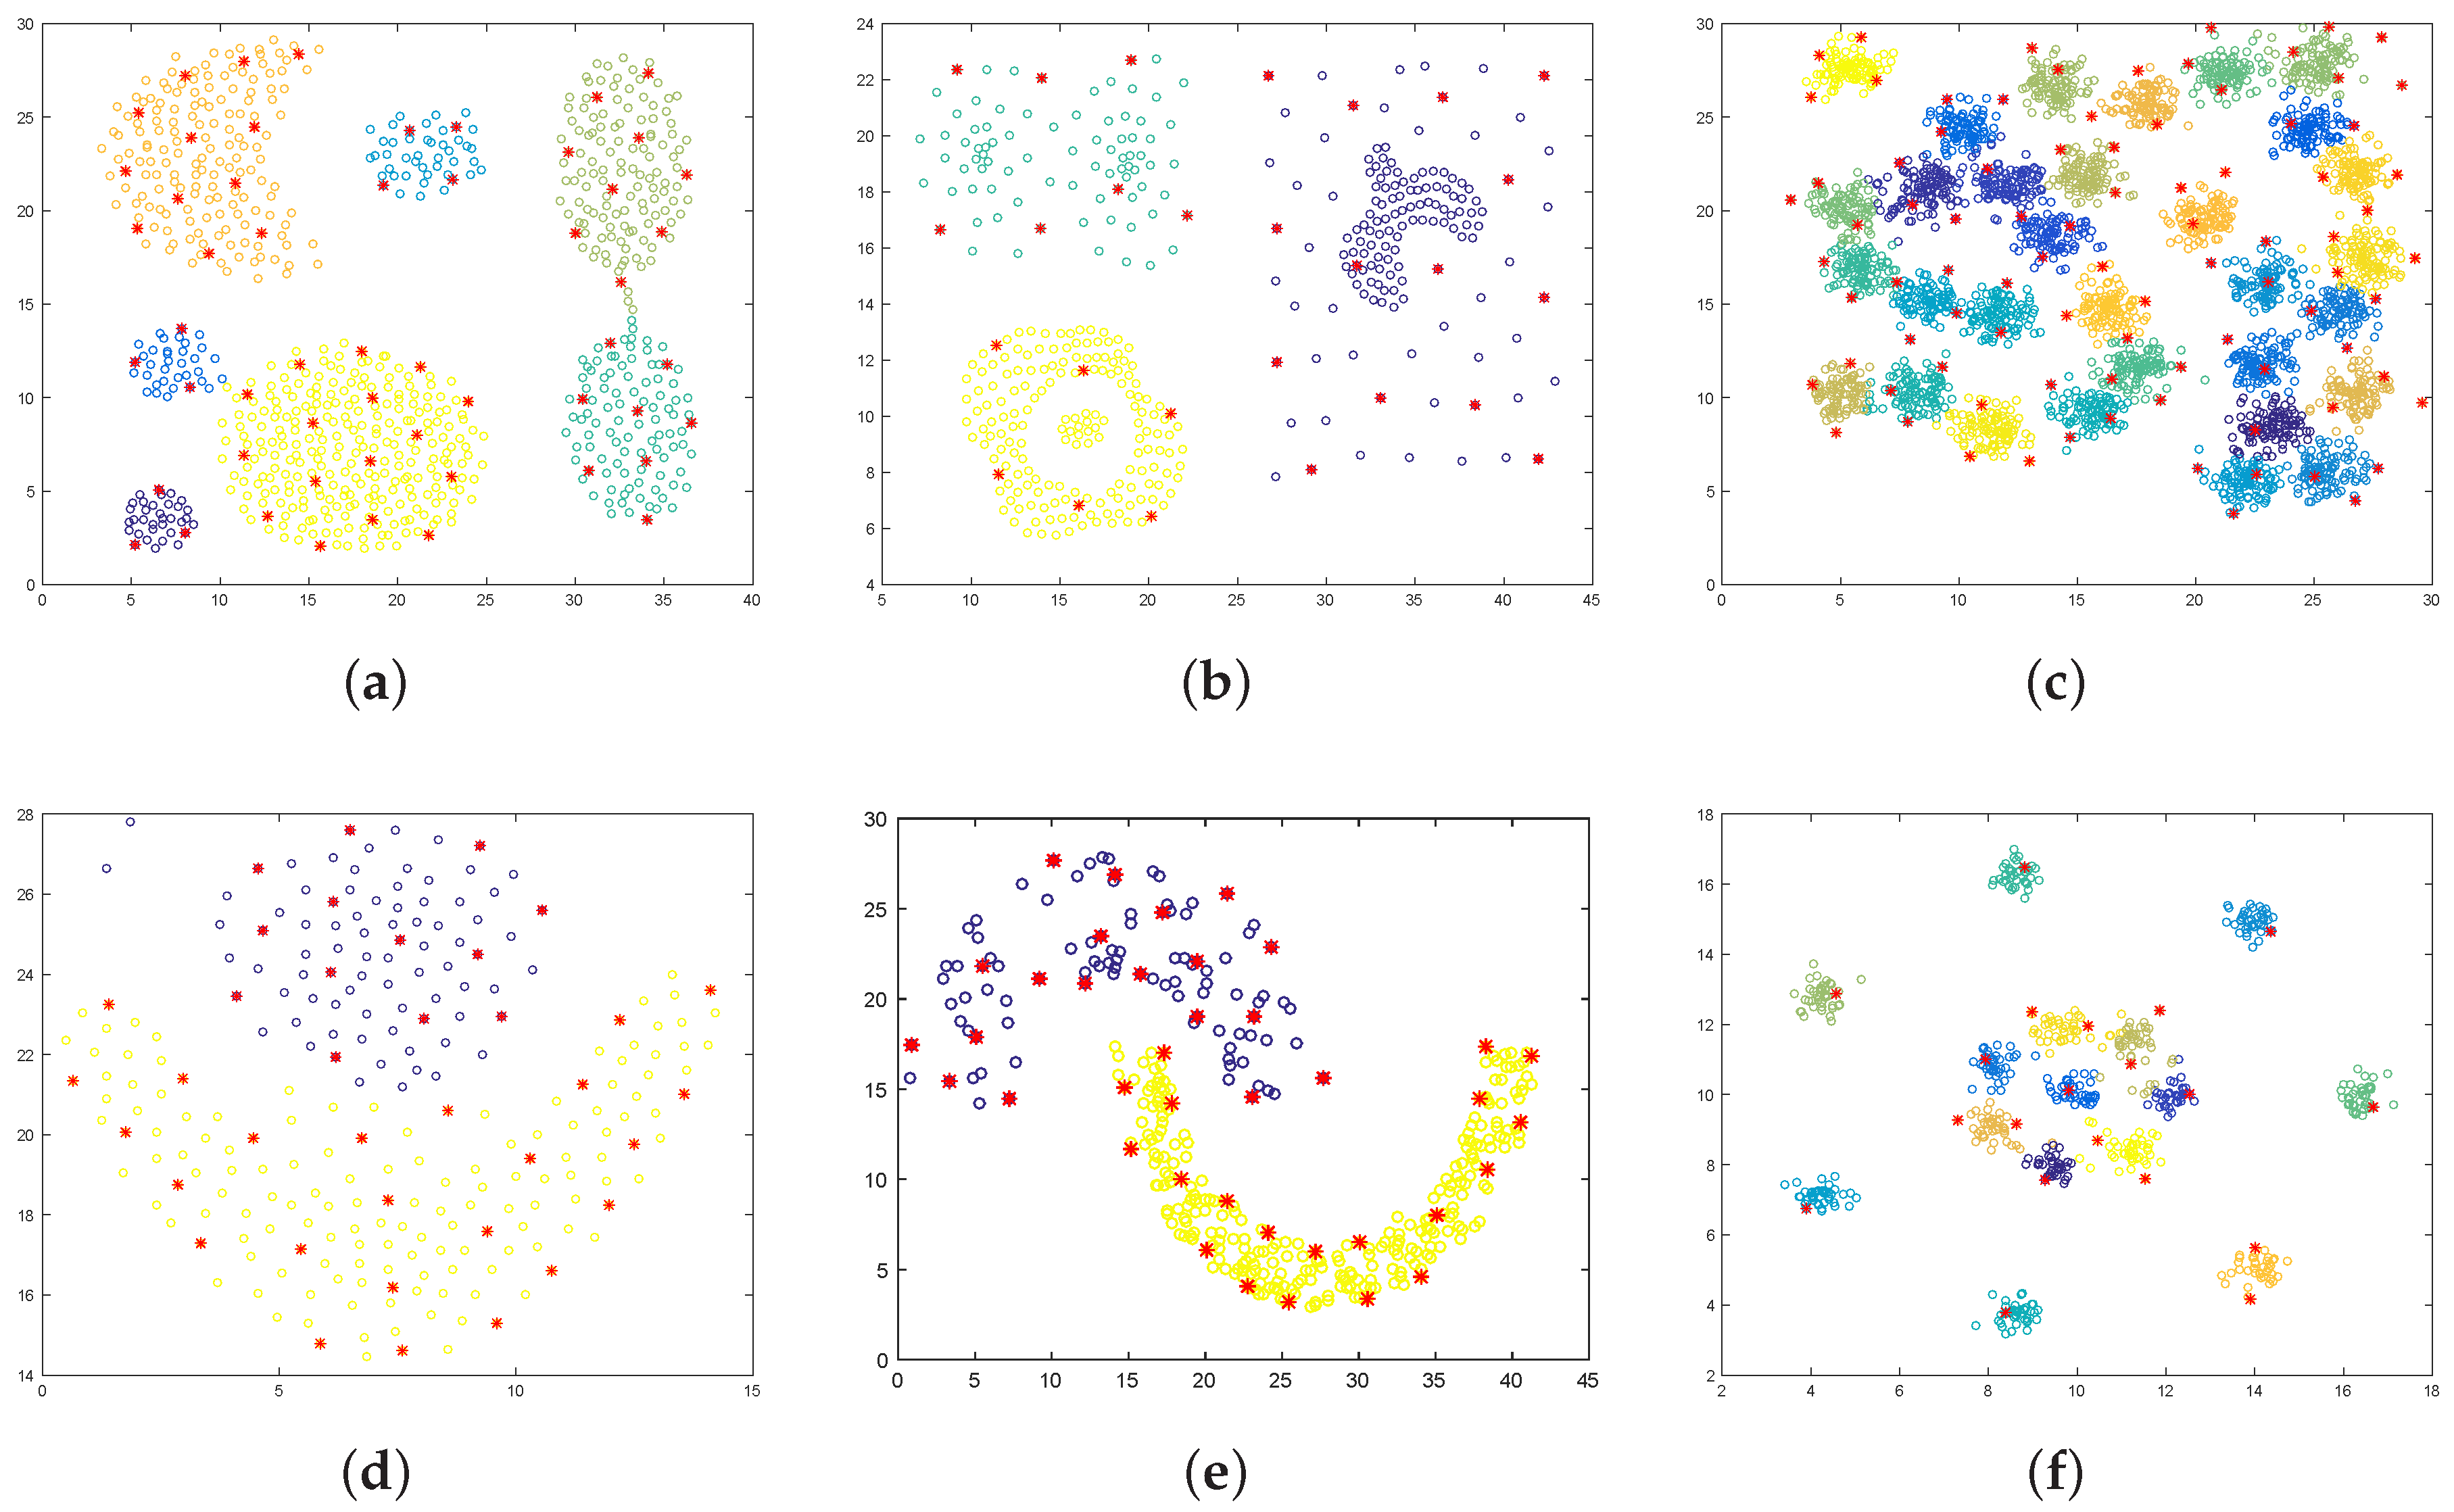
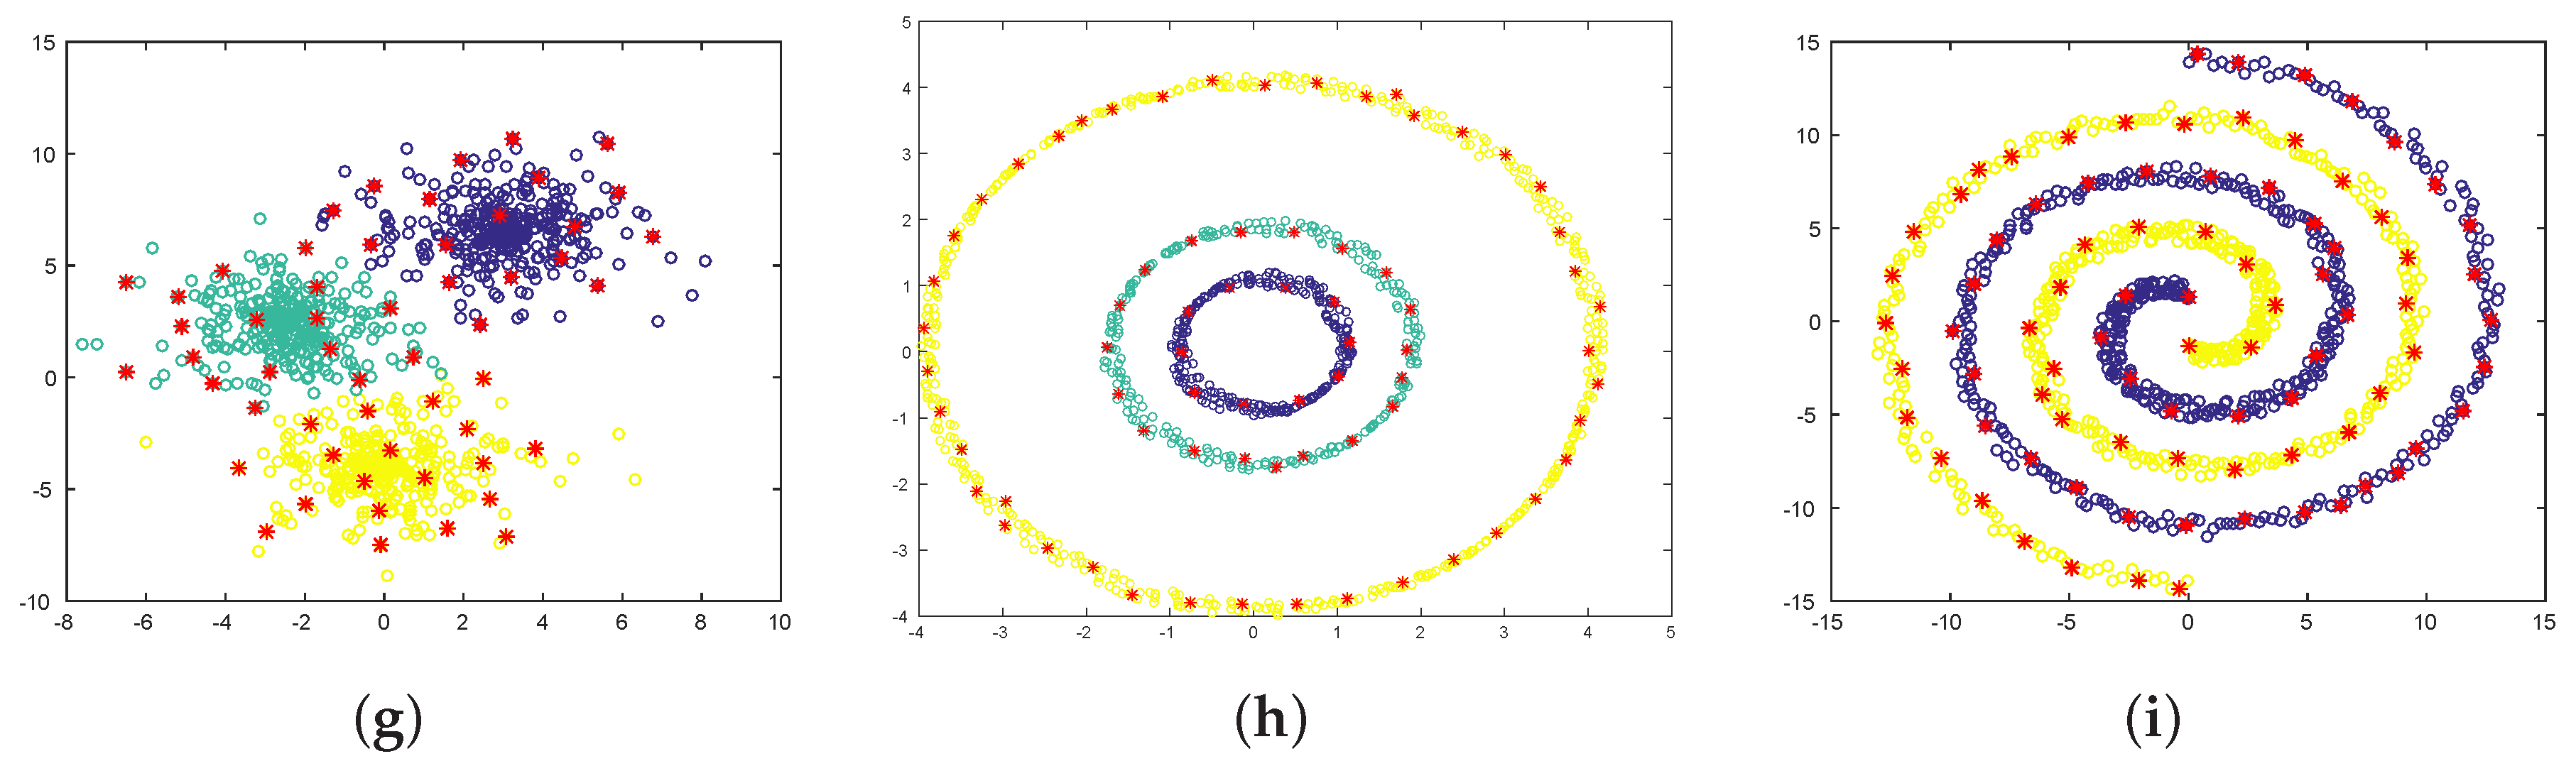
4. Experimental Results

In this section the outcomes of the experiments are presented. Given a dataset { x i } i = 1 N , with x i R d , we start by constructing a graph G = ( V , E ) where the N data points represent the vertices V = { v i } i = 1 N , and their pairwise similarity S i r the weight of the edge between them E = { S i r } i , r = 1 N . Throughout this paper, the radial basis function with parameter σ is taken as the similarity measure between two data points x i and x r ; i.e., S i r = W ( x i , x r ) = exp ( | | x i x r | | 2 2 2 σ 2 ) . For simplicity, the parameter σ is chosen based on the Silverman (the issue concerning the tuning of the bandwidth parameter is outside of the scope of the paper) rule of thumb [27]. To understand the behaviour of the proposed algorithm, we have performed simulations on a number of synthetic datasets that are commonly used to benchmark (the majority of the datasets has been downloaded from http://cs.joensuu.fi/sipu/datasets/) clustering algorithms. In Figure 3, the eigenvalues λ ^ l that are estimated after selecting the last pivot are illustrated. We can notice how, in general, the number of eigenvalues that have converged to 1 up to threshold THR eig reflect the true number of clusters present in the data. Figure 2 shows the working principle of the stopping criterion introduced in Section 3.1: the value nmi s converges to 1 THR stop after a certain number of iterations. In Figure 4, the detected clusters are depicted together with the selected pivots. In all the datasets, a meaningful clustering result has been obtained, and the pivot elements represent the clustered structure of the related data distribution well.
Table 1 reports a comparison between the proposed method and two other clustering algorithms based on the incomplete Cholesky decomposition, namely algorithms (for a fair comparison, we report the results of the algorithm that does not use the L 1 regularization) [18,22]. The comparison concerns both the number of selected pivots and the match between the detected clusters and the true groupings, as measured by the Adjusted Rand Index ([28]). The results indicate that the proposed algorithm, namely ICD-NMI, requires a minor number of pivots, resulting in a sparser spectral clustering method with comparable or higher accuracy.
Figure 5 shows the convergence of the cluster assignments in the analysis of a number of large real-life databases. The results confirm the main observation that we have made in the case of the synthetic datasets; that is, the proposed technique requires a limited number of pivots (in the case of the poker dataset, the method stopped because it reached the maximum number of iterations without converging) to perform the clustering. Table 2 reports a comparison with the k-means algorithm [1] used as baseline and an alternative low-rank method based on the Nyström approximation (the size of the subset should be less than 500 points to not get out-of-memory error). The cluster quality is measured in terms of the Silhouette index [29] and the Davies–Bouldin (DB) criterion [30], and the computational burden in terms of runtime. The results indicate that the proposed approach, although slower than k-means, reaches a higher clustering performance compared to the alternative approaches, in general.

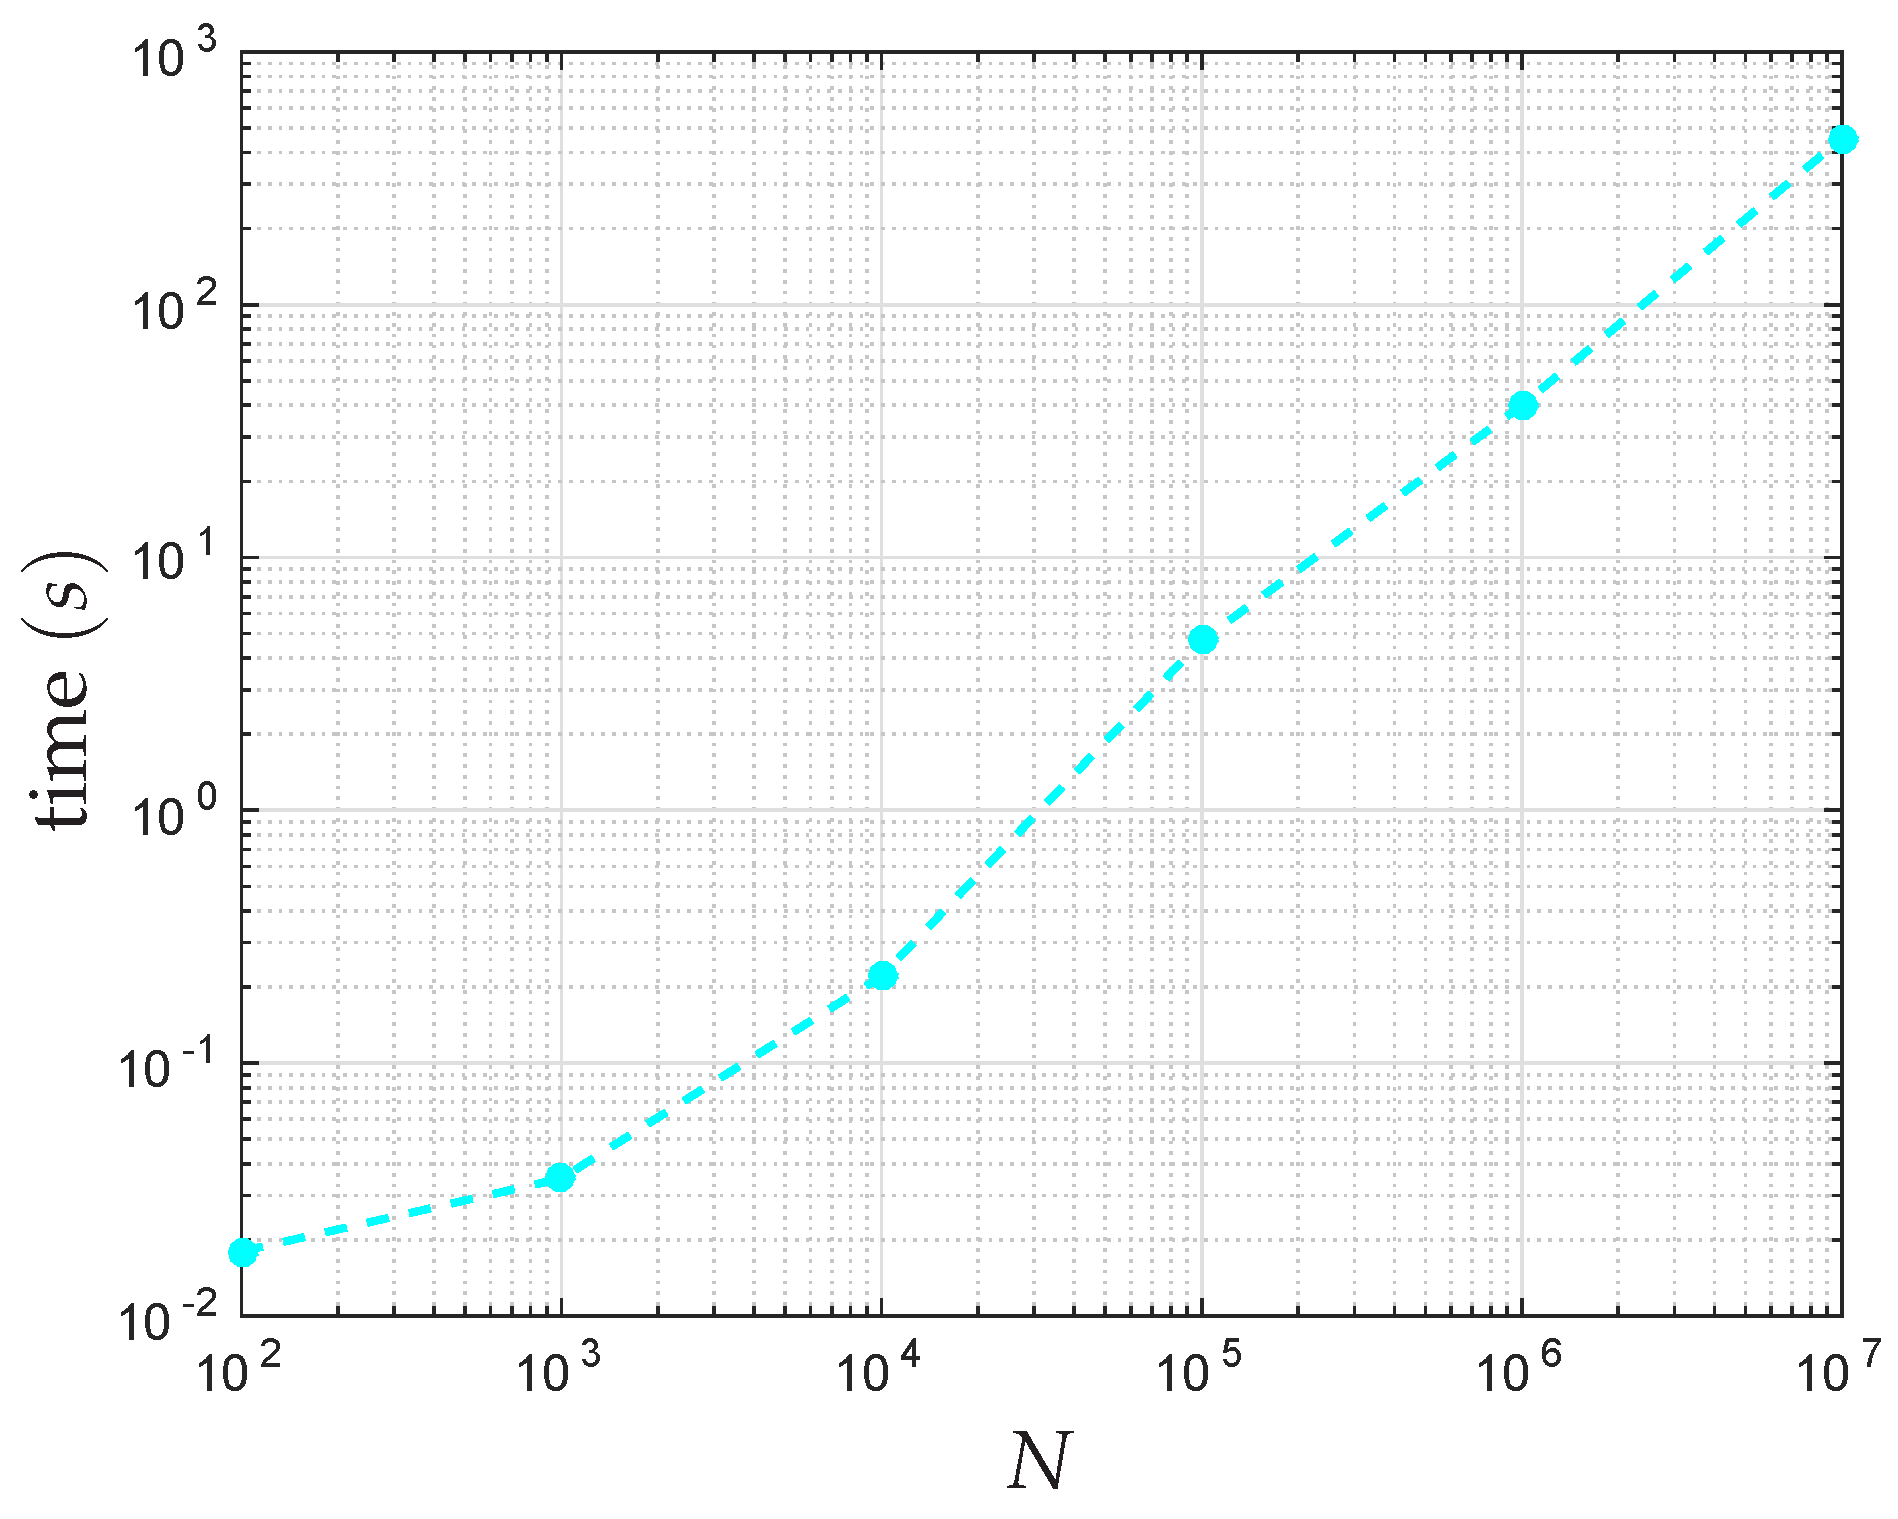
5. Computational Complexity and Memory Requirements

In this section, the computational burden of the proposed method is analysed in more detail. In Algorithm 1, two main parts are present: (i) the computation of the current ICD approximation at each step, which scales linearly with respect to the total number of data points N; (ii) the steps involved in the calculation of the NMI between current and previous cluster assignments, all of which depend linearly on N. This reasoning is supported by Figure 6, where the runtime of the proposed approach is analysed by using one of the synthetic datasets mentioned earlier. It can be evinced how algorithm ICD-NMI scales linearly, i.e., has complexity O ( N ) .
Regarding the memory load, the proposed method has low requirements, because only matrices of size N × m and m × m need to be constructed. Furthermore, as we have shown, in general the algorithm selects a low number of pivots, even in case of very large datasets, meaning that m N .

6. Conclusions

In this paper we have introduced a new stopping criterion for the incomplete Cholesky decomposition (ICD). The proposed criterion terminates the ICD when the change in the cluster assignments is below a given threshold, as measured by the normalized mutual information between consecutive partitionings. This allows the selection of a limited number of pivots compared to existing techniques, and at the same time, achieves good clustering quality, as shown for a number of synthetic and real-world datasets. Furthermore, the number of clusters is selected efficiently based on the eigengap heuristic computed on a small m × m matrix, with m N . Finally, a sensitivity analysis demonstrated how specific threshold values can influence the desired cluster quality, sparsity, and computational burden. Future work may be related to exploiting memory mapping to handle bigger datasets that do not fit in memory.

Acknowledgments

EU: The research leading to these results has received funding from the European Research Council under the European Union’s Seventh Framework Programme (FP7/2007-2013)/ERC AdG A-DATADRIVE-B (290923). This paper reflects only the authors’ views and the Union is not liable for any use that may be made of the contained information. Research Council KUL: CoE PFV/10/002 (OPTEC), BIL12/11T; PhD/Postdoc grants Flemish Government: FWO: projects: G.0377.12 (Structured systems), G.088114N (Tensor based data similarity); PhD/Postdoc grant iMinds Medical Information Technologies SBO 2015 IWT: POM II SBO 100031 Belgian Federal Science Policy Office: IUAP P7/19 (DYSCO, Dynamical systems, control and optimization, 2012-2017). The research was partially supported by the Research Council KU Leuven, project OT/10/038 (Multi-parameter model order reduction and its applications), PF/10/002 Optimization in Engineering Centre (OPTEC), by the Fund for Scientific Research-Flanders (Belgium), G.0828.14N (Multivariate polynomial and rational interpolation and approximation), and by the Interuniversity Attraction Poles Programme, initiated by the Belgian State, Science Policy Office, Belgian Network DYSCO (Dynamical Systems, Control, and Optimization).The scientific responsibility rests with its authors.

Author Contributions

Conceived and designed the experiments: Rocco Langone, Marc Van Barel, Johan Suykens. Performed the experiments: Rocco Langone. Analyzed the data: Rocco Langone. Contributed reagents/materials/analysis tools: Rocco Langone, Marc Van Barel. Wrote the paper: Rocco Langone. All authors have read and approved the final manuscript.

Conflicts of Interest

The authors declare no conflict of interest.

References

  1. Jain, A.K. Data clustering: 50 years beyond K-means. Pattern Recogn. Lett. 2010, 31, 651–666. [Google Scholar] [CrossRef]
  2. Chung, F.R.K. Spectral Graph Theory; American Mathematical Society: Providence, RI, USA, 1997. [Google Scholar]
  3. Ng, A.Y.; Jordan, M.I.; Weiss, Y. On spectral clustering: Analysis and an algorithm. In Advances in Neural Information Processing Systems 14; Dietterich, T.G., Becker, S., Ghahramani, Z., Eds.; MIT Press: Cambridge, MA, USA, 2001; pp. 849–856. [Google Scholar]
  4. Von Luxburg, U. A tutorial on spectral clustering. Stat. Comput. 2007, 17, 395–416. [Google Scholar] [CrossRef]
  5. Jia, H.; Ding, S.; Xu, X.; Nie, R. The latest research progress on spectral clustering. Neural Comput. Appl. 2014, 24, 1477–1486. [Google Scholar] [CrossRef]
  6. Lin, F.; Cohen, W.W. Power Iteration Clustering. In Proceedings of the 27th International Conference on Machine Learning (ICML), Haifa, Israel, 21–24 June 2010; pp. 655–662.
  7. Fowlkes, C.; Belongie, S.; Chung, F.; Malik, J. Spectral Grouping Using the Nyström Method. IEEE Trans. Pattern Anal. Mach. Intell. 2004, 26, 214–225. [Google Scholar] [CrossRef] [PubMed]
  8. Ning, H.; Xu, W.; Chi, Y.; Gong, Y.; Huang, T. Incremental Spectral Clustering With Application to Monitoring of Evolving Blog Communities. In Proceedings of the 2007 SIAM International Conference on Data Mining, Minneapolis, MN, USA, 26–28 April 2007.
  9. Dhanjal, C.; Gaudel, R.; Clemençon, S. Efficient Eigen-Updating for Spectral Graph Clustering. Neurocomputing 2013, 131, 440–452. [Google Scholar] [CrossRef] [Green Version]
  10. Langone, R.; Agudelo, O.M.; de Moor, B.; Suykens, J.A.K. Incremental kernel spectral clustering for online learning of non-stationary data. Neurocomputing 2014, 139, 246–260. [Google Scholar] [CrossRef]
  11. Alzate, C.; Suykens, J.A.K. Multiway spectral clustering with out-of-sample extensions through weighted kernel PCA. IEEE Trans. Pattern Anal. Mach. Intell. 2010, 32, 335–347. [Google Scholar] [CrossRef] [PubMed]
  12. Mall, R.; Langone, R.; Suykens, J.A.K. Kernel spectral clustering for big data networks. Entropy 2013, 15, 1567–1586. [Google Scholar] [CrossRef]
  13. Novák, M.; Alzate, C.; Langone, R.; Suykens, J.A.K. Fast Kernel Spectral Clustering Based on Incomplete Cholesky Factorization for Large Scale Data Analysis. Available online: http://www.esat.kuleuven.be/stadius/ADB/novak/kscicdinternal.pdf (accessed on 11 May 2016).
  14. Chen, W.Y.; Song, Y.; Bai, H.; Lin, C.J.; Chang, E. Parallel Spectral Clustering in Distributed Systems. IEEE Trans. Pattern Anal. Mach. Intell. 2011, 33, 568–586. [Google Scholar] [CrossRef] [PubMed]
  15. Luo, D.; Ding, C.; Huang, H.; Nie, F. Consensus spectral clustering in near-linear time. In Proceedings of the 2011 IEEE 27th International Conference on Data Engineering (ICDE), Hannover, Germany, 11–16 April 2011; pp. 1079–1090.
  16. Taşdemir, K. Vector quantization based approximate spectral clustering of large datasets. Pattern Recogn. 2012, 45, 3034–3044. [Google Scholar] [CrossRef]
  17. Wang, L.; Leckie, C.; Kotagiri, R.; Bezdek, J. Approximate pairwise clustering for large data sets via sampling plus extension. Pattern Recogn. 2011, 44, 222–235. [Google Scholar] [CrossRef]
  18. Frederix, K.; van Barel, M. Sparse spectral clustering method based on the incomplete Cholesky decomposition. J. Comput. Appl. Math. 2013, 237, 145–161. [Google Scholar] [CrossRef]
  19. Stoer, M.; Wagner, F. A Simple Min-cut Algorithm. J. ACM 1997, 44, 585–591. [Google Scholar] [CrossRef]
  20. Golub, G.H.; van Loan, C.F. Matrix Computations; Johns Hopkins University Press: Baltimore, MD, USA, 1996. [Google Scholar]
  21. Bach, F.R.; Jordan, M.I. Kernel Independent Component Analysis. J. Mach. Learn. Res. 2002, 3, 1–48. [Google Scholar] [CrossRef]
  22. Alzate, C.; Suykens, J.A.K. Sparse Kernel Models for Spectral Clustering Using the Incomplete Cholesky Decomposition. In Proceedings of the 2008 International Joint Conference on Neural Networks, Hong Kong, China, 1–8 June 2008; pp. 3555–3562.
  23. Zha, H.; Ding, C.; Gu, M.; He, X.; Simon, H. Spectral Relaxation for K-means Clustering. In Advances in Neural Information Processing Systems 14; MIT Press: Cambridge, MA, USA, 2002. [Google Scholar]
  24. Strehl, A.; Ghosh, J. Cluster ensembles—A knowledge reuse framework for combining multiple partitions. J. Mach. Learn. Res. 2002, 3, 583–617. [Google Scholar]
  25. Mall, R.; Mehrkanoon, S.; Suykens, J.A. Identifying intervals for hierarchical clustering using the Gershgorin circle theorem. Pattern Recogn. Lett. 2015, 55, 1–7. [Google Scholar] [CrossRef]
  26. Scalable Spectral Clustering. Available online: http://www.esat.kuleuven.be/stadius/ADB/langone/scalableSC.php (accessed on 12 May 2016).
  27. Silverman, B.W. Density Estimation for Statistics and Data Analysis; Chapman & Hall: New York, NY, USA, 1986. [Google Scholar]
  28. Hubert, L.; Arabie, P. Comparing partitions. J. Classif. 1985, 1, 193–218. [Google Scholar] [CrossRef]
  29. Rousseeuw, P.J. Silhouettes: A graphical aid to the interpretation and validation of cluster analysis. J. Comput. Appl. Math. 1987, 20, 53–65. [Google Scholar] [CrossRef]
  30. Davies, D.L.; Bouldin, D.W. A Cluster Separation Measure. IEEE Trans. Pattern Anal. Mach. Intell. 1979, 1, 224–227. [Google Scholar] [CrossRef] [PubMed]
  31. Blackard, J.A.; Dean, D.J. Comparative accuracies of artificial neural networks and discriminant analysis in predicting forest cover types from cartographic variables. Comput. Electron. Agric. 1999, 24, 131–151. [Google Scholar] [CrossRef]
  32. Lintott, C.; Schawinski, K.; Bamford, S.; Slosar, A.; Land, K.; Thomas, D.; Edmondson, E.; Masters, K.; Nichol, R.C.; Raddick, M.J.; et al. Galaxy Zoo 1: Data release of morphological classifications for nearly 900,000 galaxies. Mon. Not. R. Astron. Soc. 2011, 410, 166–178. [Google Scholar] [CrossRef] [Green Version]
  33. Cattral, R.; Oppacher, F. Evolutionary Data Mining: Classifying Poker Hands. In Proceedings of the 2007 IEEE Congress on Evolutionary Computation, Singapore, 25–28 September 2007.
  34. MacQueen, J. Some Methods for Classification and Analysis of Multivariate Observations. In Proceedings of the Fifth Berkeley Symposium on Mathematical Statistics and Probability; Le Cam, L.M., Neyman, J., Eds.; University of California Press: Oakland, CA, USA, 1967; Volume 1, pp. 281–297. [Google Scholar]
  35. Zhang, K.; Kwok, J. Clustered Nyström Method for Large Scale Manifold Learning and Dimension Reduction. IEEE Trans. Neural Netw. 2010, 21, 1576–1587. [Google Scholar] [CrossRef] [PubMed]
Figure 1. Sensitivity analysys. Behavior of the proposed approach with respect to different threshold values in terms of cluster quality, as measured by the (a) Adjusted Rand Index (ARI), (b) sparsity (e.g., number of selected pivots), (c) runtime.
Entropy 18 00182 g001aEntropy 18 00182 g001b
Figure 2. Proposed stopping criterion. Convergence of the cluster assignments during the incomplete Cholesky decomposition as measured by the normalized mutual information between consecutive partitionings. (a) Aggregation; (b) Compounds; (c) D31; (d) Flames; (e) Jain; (f) R15; (g) Three 2D Gaussians; (h) Three rings; (i) Two spirals.
Entropy 18 00182 g002aEntropy 18 00182 g002b
Figure 3. Choosing the number of clusters. Estimated eigenvalues of the approximated Laplacian L ˜ n . In general, the number of eigenvalues λ ^ l such that | λ ^ l 1 | < 10 6 gives a good indication of the number of clusters which are present in the data. (a) Aggregation; (b) Compounds; (c) D31; (d) Flames; (e) Jain; (f) R15; (g) Three 2D Gaussians; (h) Three rings; (i) Two spirals.
Entropy 18 00182 g003aEntropy 18 00182 g003b
Figure 4. Clustering results.Clusters detected by the proposed approach in different colors. The selected pivots are indicated with red stars. We can notice how the detected partitions are meaningful, and the distribution of the pivots is representative of the distribution of the related dataset. (a) Aggregation; (b) Compounds; (c) D31; (d) Flames; (e) Jain; (f) R15; (g) Three 2D Gaussians; (h) Three rings; (i) Two spirals.
Entropy 18 00182 g004aEntropy 18 00182 g004b
Figure 5. Convergence of cluster assignments on real datasets. Normalized mutual information between consecutive partitionings during the ICD. (a) Covertype; (b) GalaxyZoo; (c) PokerHand.
Entropy 18 00182 g005
Figure 6. Computational complexity. Scalability of the proposed algorithm with the number N of datapoints. The Three rings dataset has been used to perform this analysis. The CPU complexity is O ( N ) , which makes the method suitable for handling large-scale clustering problems. Furthermore, the memory requirements are low compared to standard spectral clustering because the full N × N similarity matrix is never constructed.
Entropy 18 00182 g006
Table 1. Comparison with other incomplete Cholesky decomposition (ICD)-based methods on toy datasets. Different algorithms are contrasted in terms of the number of selected pivots and clustering quality, in the case of three synthetic datasets. We can notice how the proposed technique obtains a high clustering performance in terms of Adjusted Rand Index (ARI), and at the same time it requires a small number of pivots. (Boldface numbers indicate the best performance.)
DatasetAlgorithmNumber of PivotsARI
Two spiralsICD-NMI 88 1
[22]1291
[18]941
Three ringsICD-NMI 71 1
[22]93 0 . 85
[18]87 0 . 87
Three 2D GaussiansICD-NMI91
[22]211
[18]91
Table 2. Comparison with k-means and the Clustered Nyström method on three large real-life datasets Performance of different approaches in terms of runtime, Silhouette and DB criterion (average values over ten randomizations). (Boldface numbers indicate the best performance).
AlgorithmCovertype [31]GalaxyZoo [32]PokerHand [33]
NdNdNd
581 , 012 54 667 , 944 9 1 , 025 , 010 10
SilDBtime (s)SilDBtime (s)SilDBtime (s)
ICD-NMI 0 . 93 0 . 14 14 . 61 0 . 55 0 . 55 521 . 76 0 . 16 3 . 70 3408 . 5
k-means [34] 0 . 16 1 . 30 5 . 57 0 . 54 1 . 36 2 . 89 0 . 12 2 . 20 83 . 56
Clustered Nyström [35] 0 . 06 2 . 98 218 . 48 0 . 56 0 . 94 308 . 91 0 . 11 2 . 33 650 . 89

