A Co-Opetitive Automated Negotiation Model for Vertical Allied Enterprises Teams and Stakeholders

1
College of Information Science and Engineering, Northeastern University, Shenyang 110819, China
2
State Key Laboratory of Synthetical Automation for Process Industries, Northeastern University, Shenyang 110819, China
3
School of Management, Heilongjiang University of Science and Technology, Harbin 150022, China
*
Author to whom correspondence should be addressed.
Entropy 2018, 20(4), 286; https://0-doi-org.brum.beds.ac.uk/10.3390/e20040286
Submission received: 18 February 2018
/
Revised: 2 April 2018
/
Accepted: 11 April 2018
/
Published: 14 April 2018
(This article belongs to the Special Issue Information Theory in Game Theory)
Abstract
:Upstream and downstream of supply chain enterprises often form a tactic vertical alliance to enhance their operational efficiency and maintain their competitive edges in the market. Hence, it is critical for an alliance to collaborate over their internal resources and resolve the profit conflicts among members, so that the functionality required by stakeholders can be fulfilled. As an effective solution, automated negotiation for the vertical allied enterprises team and stakeholder will sufficiently make use of emerging team advantages and significantly reduce the profit conflicts in teams with grouping decisions rather than unilateral decisions by some leader. In this paper, an automated negotiation model is designed to describe both the collaborative game process among the team members and the competitive negotiation process between the allied team and the stakeholder. Considering the co-competitiveness of the vertical allied team, the designed model helps the team members making decision for their own sake, and the team counter-offers for the ongoing negotiation are generated with non-cooperative game process, where the profit derived from negotiation result is distributed with Shapley value method according to contribution or importance contributed by each team member. Finally, a case study is given to testify the effectiveness of the designed model.
1. Introduction
When China entered a new stage of economic development after the financial crises in the years 2007–2008 and 2008–2012, namely the new normal economy, its economic growth shifted from high-speed to medium-to-high-speed, the economic structure was constantly improved and upgraded, and the economic development shifted from input-driven and investment-driven to innovation driven with the removal of red tape and delegation of powers to authorities at lower levels [1]. The new normal economy has led the supply chain management to be more agile and competitive in the global context, and it is no longer limited to the competition among single enterprises in market, but the competition between supply chains has become the mainstream trend of the current economic development [2,3]. To maintain their own competitive edge, improve the utilization of idle resource, and reduce duplicate investment and operational risk, enterprises often undertake vertical alliances with upstream and downstream ones in the supply chain as a business tactic in their competitive strategy [4,5,6]. Hence, the allocation of idle resources and the formation of scale economies in the supply chain can be improved, which also is advantageous to enhance the coordinated development level of the supply chain [7]. As a result, it is critical for an alliance to collaborate over internal resources and resolve the profit conflicts among members, so that the functionality required by stakeholders can be fulfilled. As an effective means to resolve the profit conflicts and realize the coordinated development of supply chain, negotiation has received a great deal attention of academic and practitioners such as the collaborative planning among supply chains partners [8] and eco-efficient or open innovation in a supply chain [9,10,11,12,13,14] etc. However, the negotiations in industries are often inefficient due to the diversity of intellectual backgrounds of the negotiating parties, many variables involved, complex interactions, and inadequate negotiation knowledge of the project participants [9,14,15]. In recent years, with the rapid development of Internet and information technology, automated negotiation based on multiple agents is widely studied and applied to the operations and management of supply chain, which provides an effective way to resolve various conflicts in it [4,5,6]. Considering the challenge for the users in terms of quality-oriented selection of their required services, Hashmi et al. [16] presented a social network-based trust framework (SNRNeg) and proposed an end-to-end automated negotiation approach of Genetic Algorithm-based Web service for modeling dependency relationships among the Quality of Service (QoS) component of Web services with static environment. Patrikar et al. [17] proposed a linear programming and pattern matching based multilateral automated negotiation system and studied some multilateral system with several methods. To find a proficient mechanism helping an agent to decide under which conditions to accept opponent’s offer in a bilateral automated negotiation, Baarslag et al. [18] compared the performance of various acceptance conditions in combination with a broad range of bidding strategies and negotiation scenarios, and then proposed new acceptance conditions meanwhile demonstrated their advantages relative to other conditions by numerical experiments. To enhance the ability of an agent to quickly and autonomously select an appropriate strategy among the candidates according to the situation changes of automated negotiation, Cao et al. [19] developed multi-strategy selection theoretical model and algorithm, by the experimental results analysis, which may enable a negotiating agent to select appropriate strategy dynamically to deal with the ever-changing opponent’s offer and achieve a more efficient and effective agreement than possible with a conventional fixed strategy. In order to effectively coordinate the demand, production and business contracts or orders, Hernández et al. [20] proposed an automated negotiation mechanism suitable for multi-level supply chain coordination. However, with the assumption that each one is fully cooperative, their work is only limited to the study of the cooperation and negotiation problems in a supply chain, but the negotiation between the supply chain and demanders is not taken into account. Since big data may provide novel insights into, inter alia, market trends, customer buying patterns, and maintenance cycles, as well as into ways of lowering costs and enabling more targeted business decisions [21], firms can better understand customers’ preferences and needs by analyzing the big data generated from various sources, such as market information and the records of historic cooperation and negotiation etc., and managers increasingly view data as an important driver of innovation and a significant source of value creation and competitive advantage [22]. According to the historical information of a supply chain and market, Giannakis et al. [23] studied how to improve the agility of the supply chain by combining big data method with multi-agent automated negotiation, and designed a framework model, which may be impractical as assumed that all supply chain members are fully cooperative and they may share all obtainable information and resources each other [24]. In the research and application of big data, it is always the main challenges to deal with massive amounts of data and to leverage or apply predictive analytics, as it is extremely hard for existing analytic methods to process high volume of various data in real time and produce useful information [22,25], and it is also difficult to accumulate so much and efficient negotiation information or records with the same partner or the relevant operational data of supply chain management considering the trade secret and trust in practice. Thus, it is tough to resolve all decision-making problem by big data method which should be used as a supplementary approach for the research and application of automated negotiation and be suitable to underscore and shed some light on certain partial aspects. In recent decades, most of current works have focused on the processes of which parties (bilateral, or multiparty) are of single individuals, but some real-world scenarios may involve negotiation parties of more than a single individual [26,27,28]. The research carried out by Sheu and Gao [29] found that supply chain or allied members participate in a negotiation as a team can significantly improve their bargaining power in the negotiation, with regarding to cost reduction of operations, trading and technology innovation [12]. According to that, Sanchez-Anguix et al. [26,27,28] defined the supply chain members in negotiation as an allied team and proposed an automated negotiation model called Team Negotiation based on Profit Order Difference (TNPOD), in which each team member has an independent decision for the calculation of counter-offer, and the final counter-offer of the team was selected by members vote. However, the measurement and distribution of alliance collaboration profit cannot be considered in their work, and it is short of analyzing the game process in decision-making of the team. The alliance collaboration profit is the profit saved from the operational cost of supply chain by the effective collaboration and communication of members in the alliance. Inside the allied team, the game process of the decision-making on supply chain operations and management gradually becomes the focus of academic and applied research [3,30,31], but the special game problem with co-opetition is often ignored. Although, in reality, allied team members do expect that their profits can be improved by the cooperation in an alliance, it is difficult for them to completely share resources and operational information due to the fact that they are usually independent and self-financing economic entities [32,33,34,35,36], and each party must be aware of which information should be shared or not, because there is an objective difficulty in identifying trustworthy potential partners [14]. Thus, it is very necessary to study the special game problem in the supply chain alliance with co-opetition partnership.
This paper designs an Automated Negotiation model for the vertical allied Team (ANT), with a competitive negotiation process between the team and the stakeholder (a stakeholder may be any possible party or organization in a supply chain which might negotiate with the vertical allied enterprises team), and with a collaborative game process among the team members. The counter-offer process in the allied team is calculated from the perspective of a non-cooperative game, and the distribution of the alliance collaboration profit is of Shapley value solution in terms of the offer contribution rates. Finally, a case study is given to testify the effectiveness of the designed model, where the stakeholder to replenish coal products and the vertical allied team including one coal enterprise and one logistic enterprise are involved in the automated negotiation to make a business agreement. The major contributions of this paper are as follows: on the one hand, the decision-making of the vertical allied team with co-opetitive relationship is shaped with game process in the negotiation with opponent. On the other hand, with the designed automated negotiation model, the vertical allied team may properly manage internal collaborative business even competition coexists among team members. Furthermore, this model can help many allied teams in supply chain or independent organizations to make agreement with other stakeholders or potential cooperators.
The rest of the paper is structured as follows: Section 2 establishes a platform framework of automated negotiation with team-side game, and with regards to negotiation scenario two agent types are defined for the allied team and the individual members, respectively. In Section 3 a non-cooperative game process is designed for team members’ collaboration with Shapley Value solution. Section 4 demonstrates and testifies the effectiveness of the proposed model with the analysis of numerical experiments. Section 5 presents summary of this paper and the suggestions for the future studies.
2. Framework of the Automated Negotiation Model
2.1. Negotiation Scenario
2.1.1. Problem Analysis
In reality, the cost of some products or services is usually dependent on the collaboration of production and logistics, and the logistic costs often account for a higher percentage of the total cost, such as in the case of fresh or perishable products, energy products including coal and oil and so on. Meanwhile the different quantity and completion times have a significant impact on the total cost of those products. Therefore, in order to improve the operational efficiency of supply chain and reduce additional costs and losses caused by undesired collaboration, the production and logistics enterprises of those products or services prefer to form a supply chain vertical allied team. Although all the allied team members are seeking to consolidate their market competitive advantages through the collaboration with upstream and downstream enterprises of supply chain, it is impossible for them to completely share their resources and operational information since each of them is independent and self-financing [24,37,38]. Hence, either non-cooperative or cooperative game processes for the team or its members cannot comprehensively reflect the characteristics of the vertical alliance with co-opetition partnership [30,35,36]. In this paper, without loss of generality, the vertical allied team or team for short is defined as a group of one Production enterprise and one Logistics enterprise in a supply chain, and the Stakeholder enterprise is defined as an independent entity, which seeks for the provider of some material, product or service such as a manufacturer, retailer or customer, etc. All team members are well familiar with each other’s productivity or strength, and many settings are in common sense such as the pricing rules, collaboration profit function and the historical information about negotiation. In this study, three issues of quantity, price and delivery time are taken account in the model. The value ranges of each issue thought by the team might be different from those of Stakeholder enterprise.
2.1.2. Automated Negotiation Process of the Proposed Model
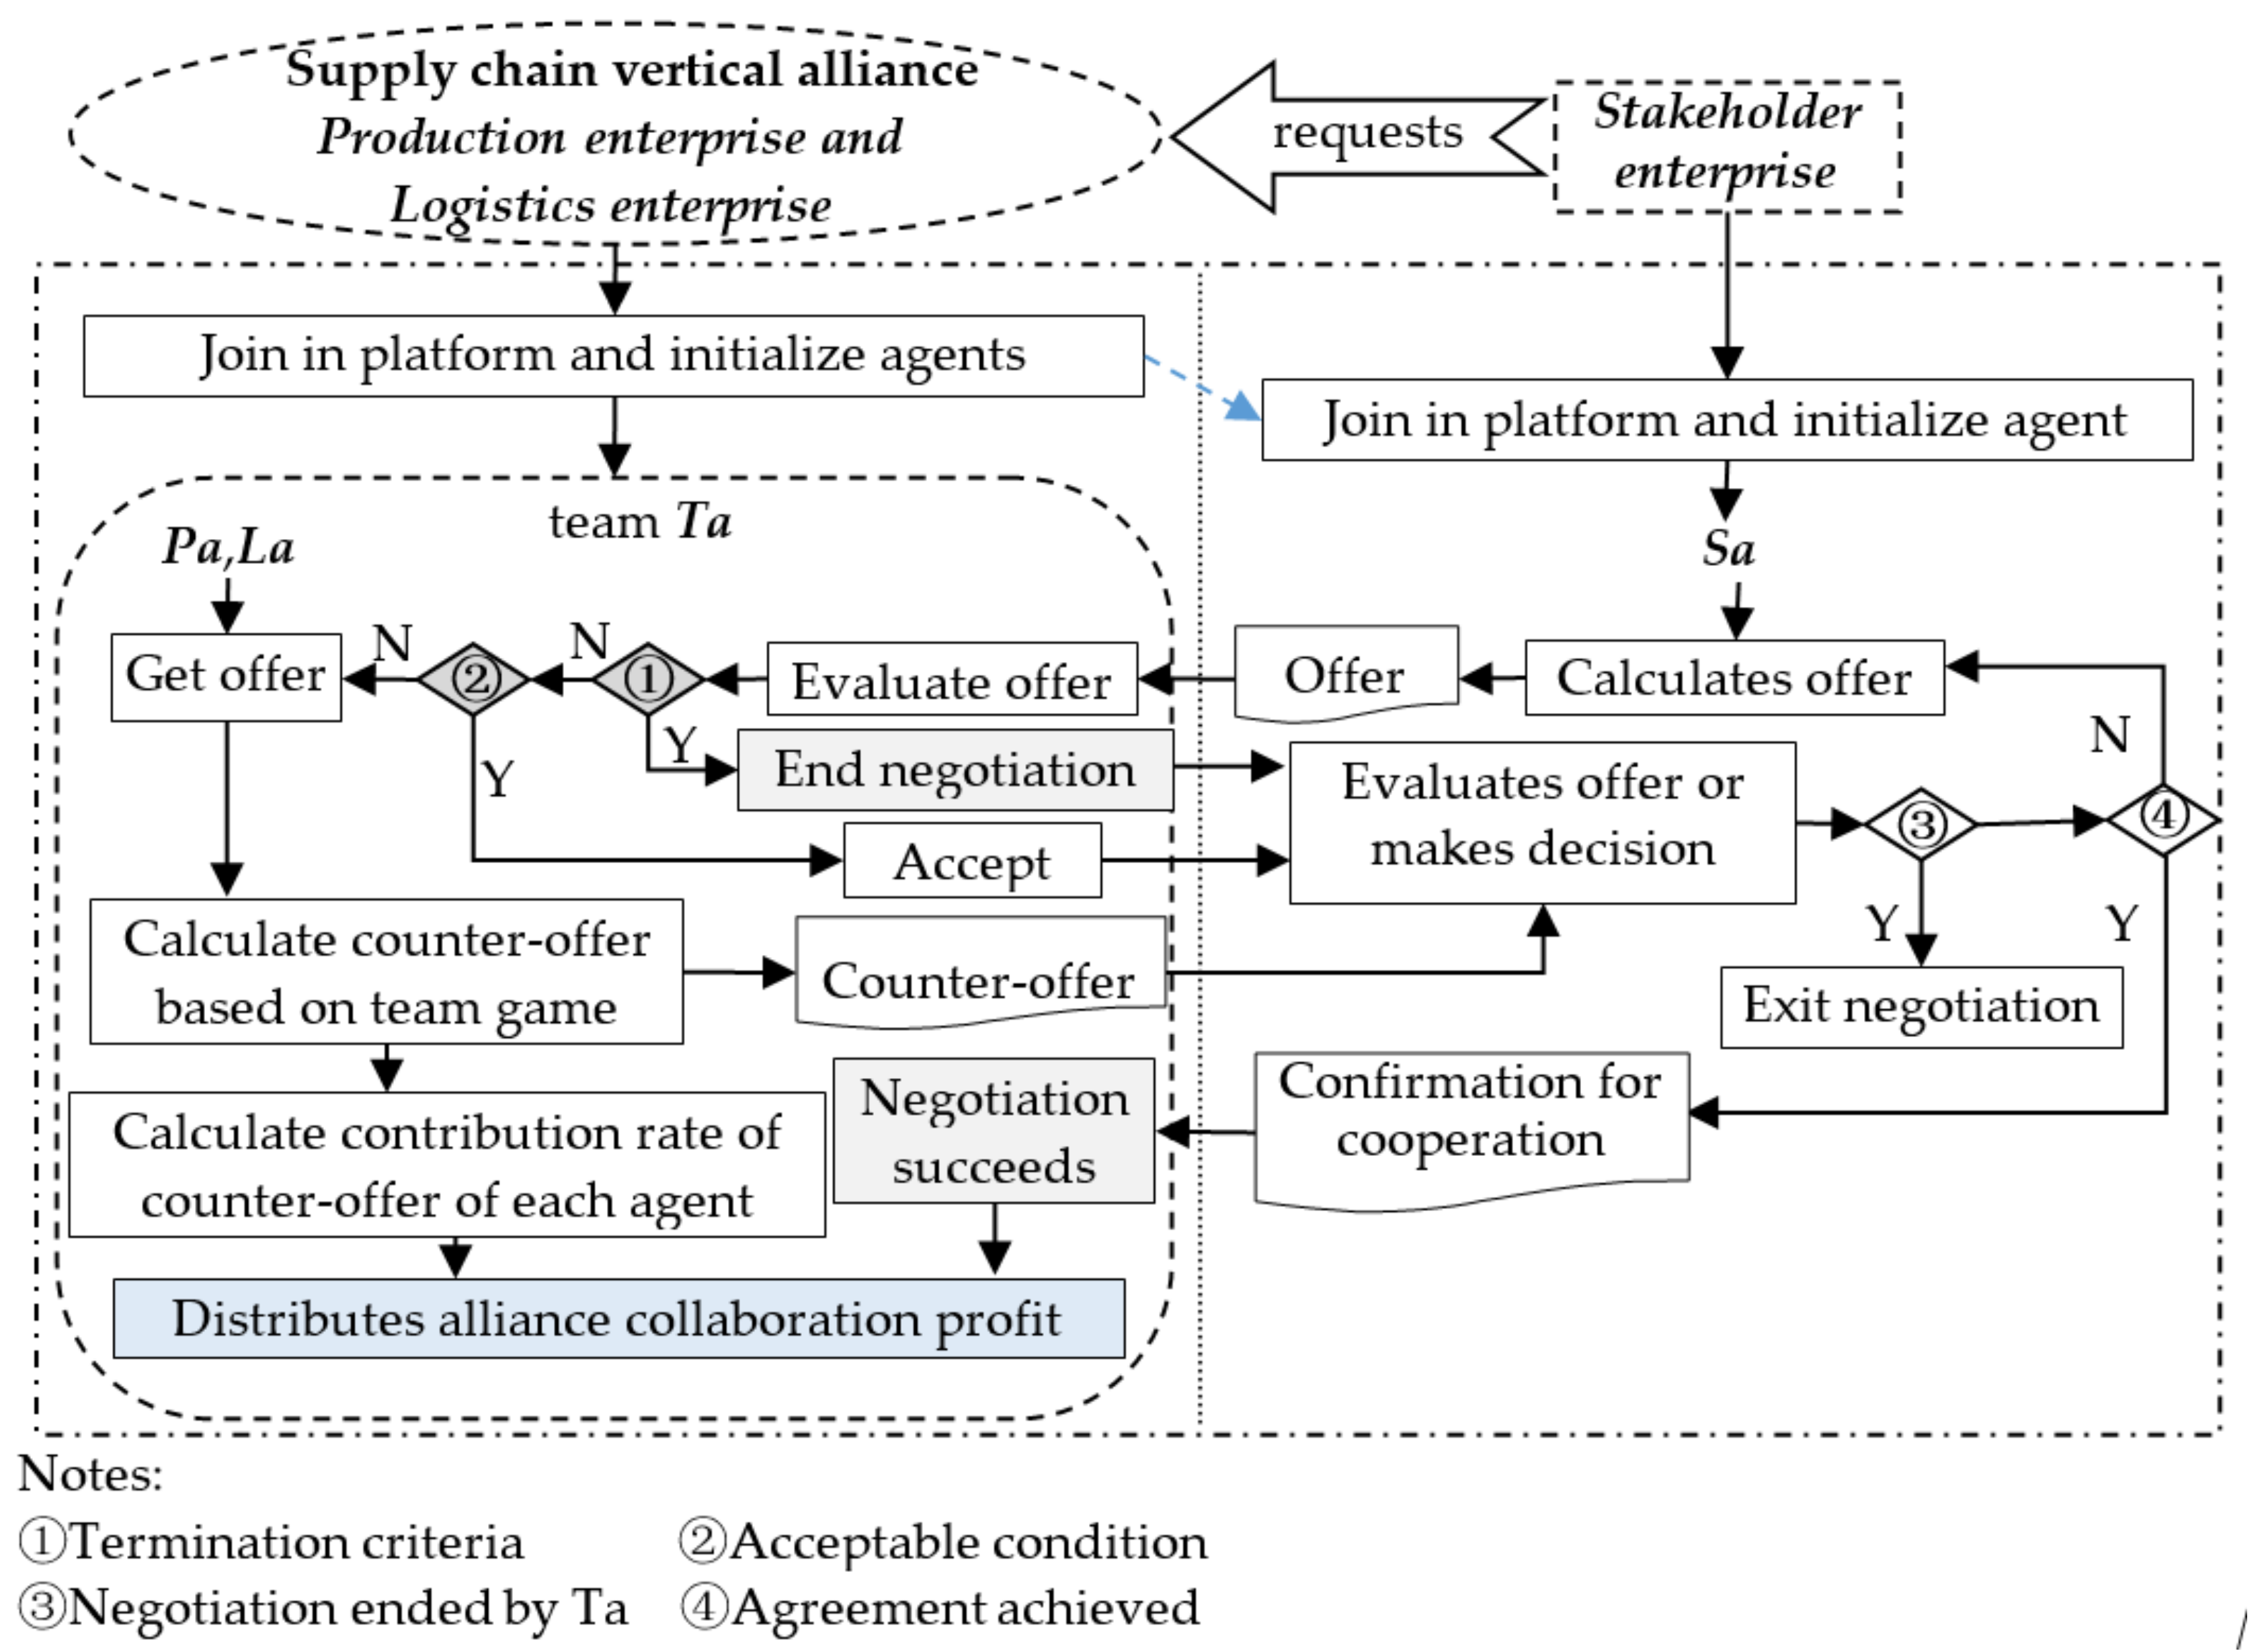
The automated negotiation process is designed basing on any supply chain Business to Business (B2B) electronic platform. Stakeholder enterprises which have demands for fulfillment, Production enterprises and Logistics enterprises can enroll in the platform to seek business. To clearly describe the automated negotiation process, suppose that the B2B platform receives the request of a Stakeholder enterprise to meet a demand, it chooses a pair of Production enterprise and Logistics enterprise as a vertical allied team to carry out the demand.
The automated negotiation is arranged by B2B platform system for the Stakeholder enterprise and the team, and the agents for Stakeholder enterprise, the team with its Production enterprise and Logistics enterprise members are initialized as well, denoted by Sa, Ta, Pa, La, where Ta can also be seen as a trusted mediator or organizer agent of the team. In each round or iteration of automated negotiation between Sa and Ta, firstly, Sa sends an offer to Ta, then a counter-offer is generated by Ta basing on the outcome of the team-side game if the Sa offer is negotiable, repeating in this way until the negotiation succeeds or stop with termination criteria. With respect to each counter-offer the Ta distributes the deduced collaboration profit according to the contribution rates of Pa and La on the total profit over the counter-offer with Shapley value method. The process of automated negotiation is illustrated in Figure 1. It is worth to note that the automated negotiation will continue unless Ta refuses the Sa offer or agreement is achieved before the designated deadline.
2.2. Automated Negotiation Model ANT
Firstly, symbols and denominations are defined as in Table 1:
According to the characteristic of the negotiation between the allied team Ta and Sa, ANT can be defined as a 3-tuple:
where I = {q, p, d} denotes the issues set concerned in the automated negotiation process. For the instance of above scenario, q, p and d denote the quantity, price and delivery time, respectively.
2.2.1. Allied Team for Negotiation
According to the characteristic of the allied team in ANT, Ta can be defined as a 12-tuple:
where A = {Pa, La} is a set of member agents in the team; round-dependent price function pTa can be represented as follows [39]:
where denotes the quantity requested by Sa at the t-th round; if , if ; .
CTa in (2) denotes the unit cost function:
where can also be interpreted as the profit obtained by the collaboration of member agents in Ta [36] if the quantity is , which can be calculated by:
As a result, the total profit of the allied team is
When receives the Sa offer at the t-th round, , Ta calculates out a counter-offer with the outcome of team game, where , is calculated by (3) and is the delivery time given by Pa or La from their point of view.
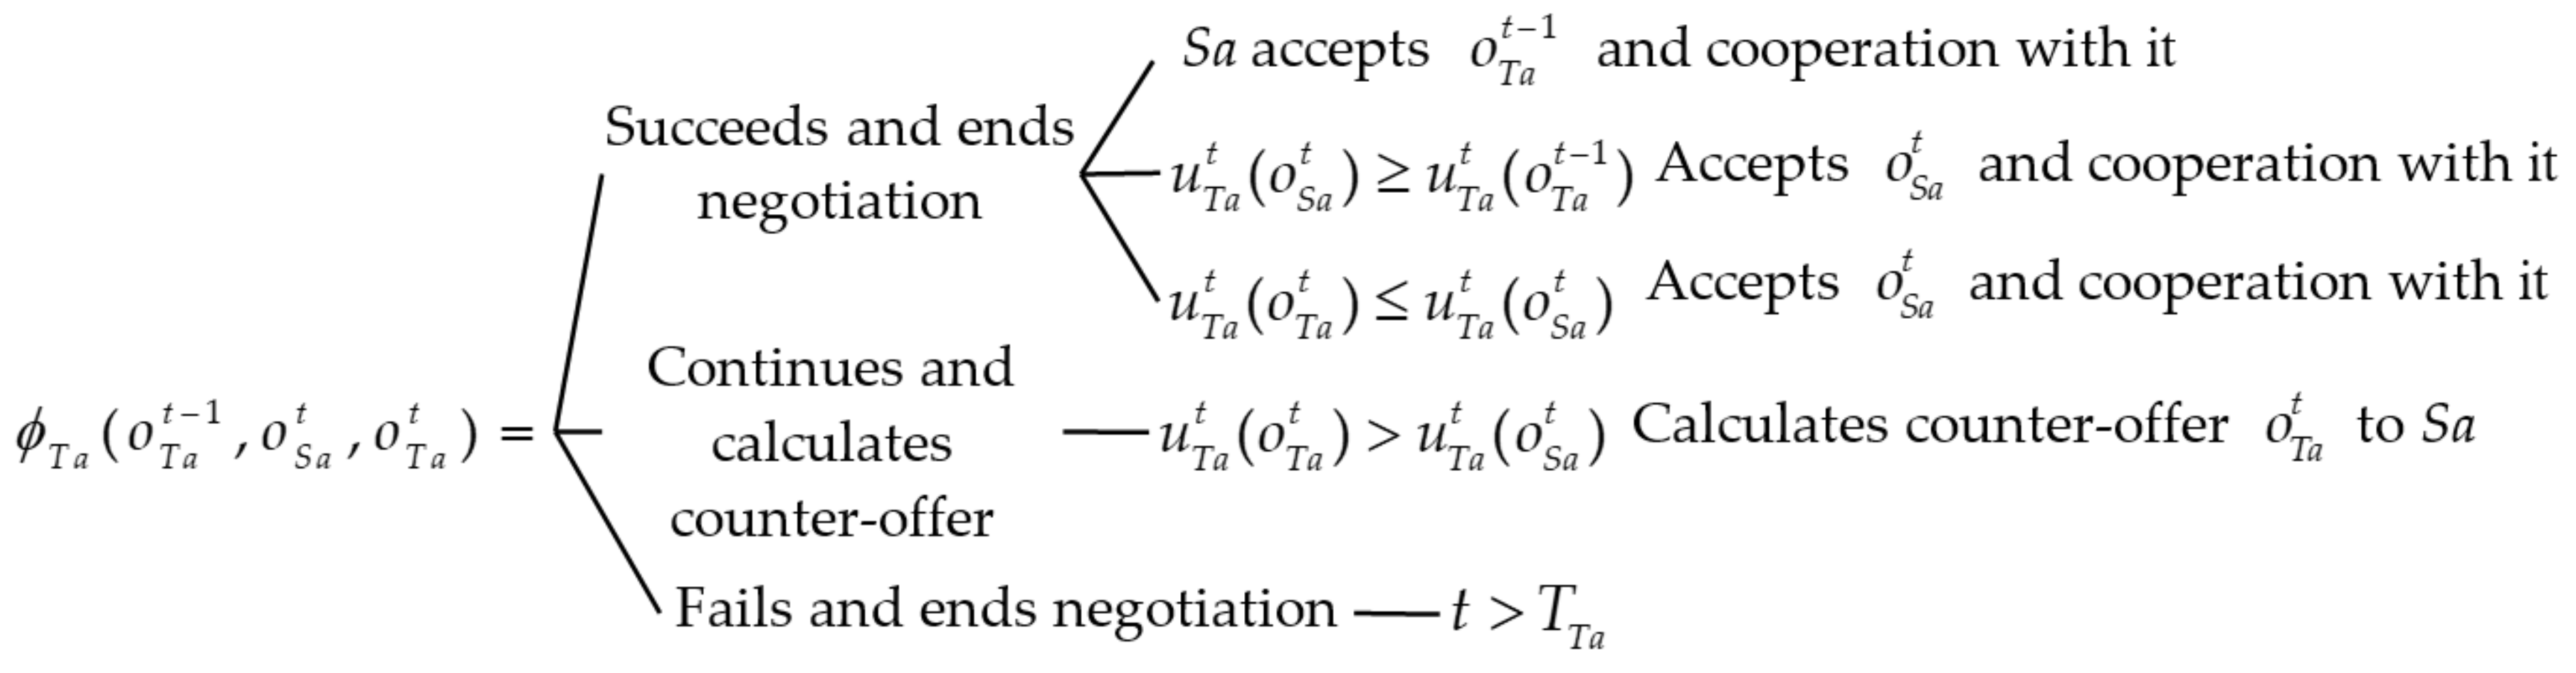
To facilitate the negotiation, a complete negotiation strategy is defined as a set of rules in a decision tree and designated by Ta before starting the automated negotiation. Figure 2 demonstrates a typical negotiation strategy of Ta.
2.2.2. Members of Allied Team
During the negotiation, the benefit equilibrium among team members is of delivery time, each member agent selects a suitable delivery time by itself for the Sa offer () at the t-th round, and then calculates the corresponding cost. Provided that the quantity requested by Sa will not be altered while member agents calculating their counter-offers, i.e., ; a member agent in Ta can be defined as follows:
where ui is the profit evaluation function of i:
where αi is the distribution rate of unit price for agent i, and set ; βi is the distribution rate of team collaboration profit for agent i, it is calculated based on the Shapley value solution; is the unit price of Ta at the t-th round; is the collaboration profit over the Ta counter-offer at the t-th round; is the unit cost of agent i for its offer at the t-th round [4]:
where ci is the basic unit cost of agent i in general situation, and is the influence factor of quantity on the unit cost of agent i, and if , if ; is the influence factor of delivery time on the unit cost of agent i, and where denotes the correlation factor of the delivery time of agent k on agent i, and represents the correlation factor of historical negotiation information, and if t ≤ 2, if 2 < t ≤ TTa.
2.3. Definition of Sa
For the numerical simulation in Section 4, the agent Sa of the Stakeholder enterprise is defined as follows:
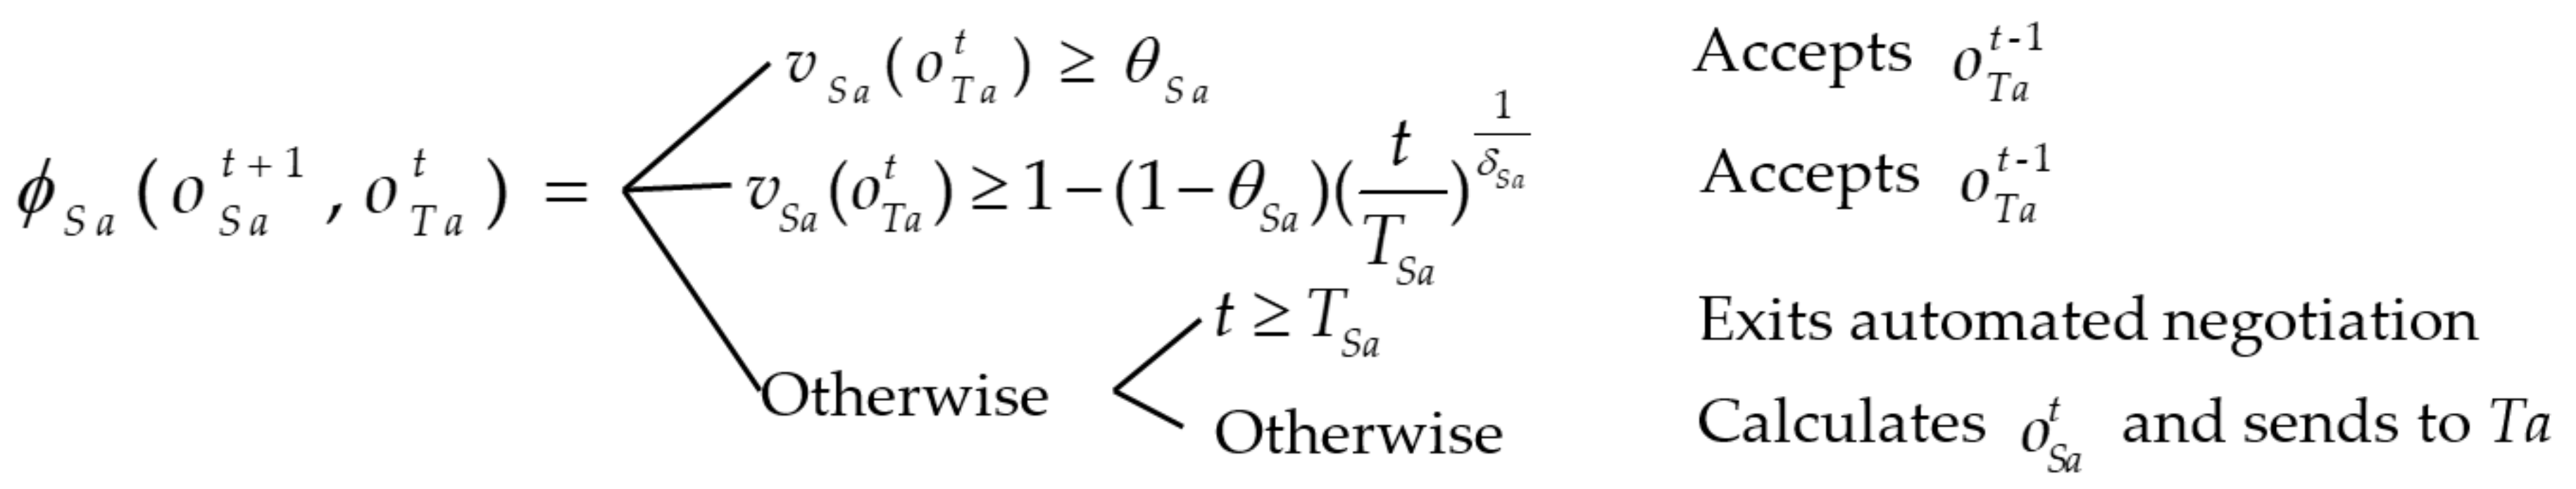
where is the weights set of Sa for each issue, and ; and are the sets of ideal and values for each issue; TSa is the negotiation deadline acceptable by Sa; θSa is the threshold value of satisfaction level, i.e., the minimum of satisfaction level acceptable by Sa; δSa is the concession coefficient of Sa in calculating offer, and Sa chooses it basing on the time and quantity in negotiation [40,41], so ; vSa is the offer evaluation function. Therefore, the satisfaction level of can be calculated with Multiple Attribute Utility Theory (MAUT):
φSa is the negotiation strategy of Sa, as shown in Figure 3:
EDSa in (10) is the optimization model [28] of Sa to determine its offer by minimizing the Euclidean Distance:
3. Collaborative Game Process of Allied Team
To reflect the characteristics of the vertical allied team with co-opetition partnership, in this paper a game process is designed with non-cooperative game and Shapley Value method.
3.1. Counter-Offer Calculation of Team Members
Since there are usually profit conflicts between the two team members, they are not completely cooperative in negotiation and may take some strategic actions to protect their own profit. In the study, the process of calculating the optimal delivery times of Pa and La ( and ) is modeled by a non-cooperative game. The feasible set Di and the profit evaluation function ui may determine the strategies of , and the reaction function can be used to find the optimal delivery times for Pa and La. Assuming that ui is differentiable, strictly convex and bounded, i.e., the best actions of i can be derived from the feasible set Di. Therefore, with respect to let the first order partial derivative of ui be zero (), giving us:
It is not difficult to find that the cross point of the reaction functions is the Nash equilibrium solution for the game between Pa and La of calculating the counter-offer, i.e., no member can benefit by changing its delivery time while the other members keep theirs unchanged when is fixed. By the arrangements of (17), we can get:
where , and .
By solving the above two equations system, the optimal delivery times of Pa and La at the t-th round may be calculated:
where and .
Then, by substituting (19) into (8), we can get the optimal profit values of Pa and La in terms of and respectively.
3.2. Shapley Value based Distribution Rate of Collaboration Profit
During the negotiation, the collaboration profit of Ta will be distributed to Pa and La according to the contribution rates of their offers to the total profit. In this study, the contribution rates are calculated with Shapley value [42,43]. When all member agents of the team are fully cooperative with each other, the form of a cooperative game can be represented as (N,v), where N = {1,…,n} is the set of member agents, and v:2N→R is a profit function of an offer in negotiation. An intuitive interpretation of the Shapley value can be described as follows: considering all possible ranking sequences of member agents, a marginal contribution of member agent i is defined with respect to a given ranking sequence as its marginal worth to the team as its existence in the sequence, i.e., v({1,…, i−1, i})−v({1,…, i−1}), where {1,…, i−1} are the team member agents preceding i in the given ranking sequence. Thus, the Shapley value is obtained by averaging the marginal contributions for all possible sequences as shown in the following formula [44]:
where v(S) denotes the profit generated by the offer of partial team . As the team only has two agent (Pa and La) in the study (i.e., N = {1,2}), and {1} and {2} represent Pa and La, respectively, the Shapley values of Pa and La offers can be expressed as follows [45,46,47,48]:
where , , , and ; and denote the profits of Pa and La obtained from their own offers if they did not join in the allied team, and . In contrast, denotes the total profit that Ta gets if Pa and La join in the team, and , . Hence, by arranging (21) and (22), we have:
Therefore, the distribution rates of collaboration profit with respect to Pa and La in the team can be expressed as: and , which depend on the offers of Pa and La.
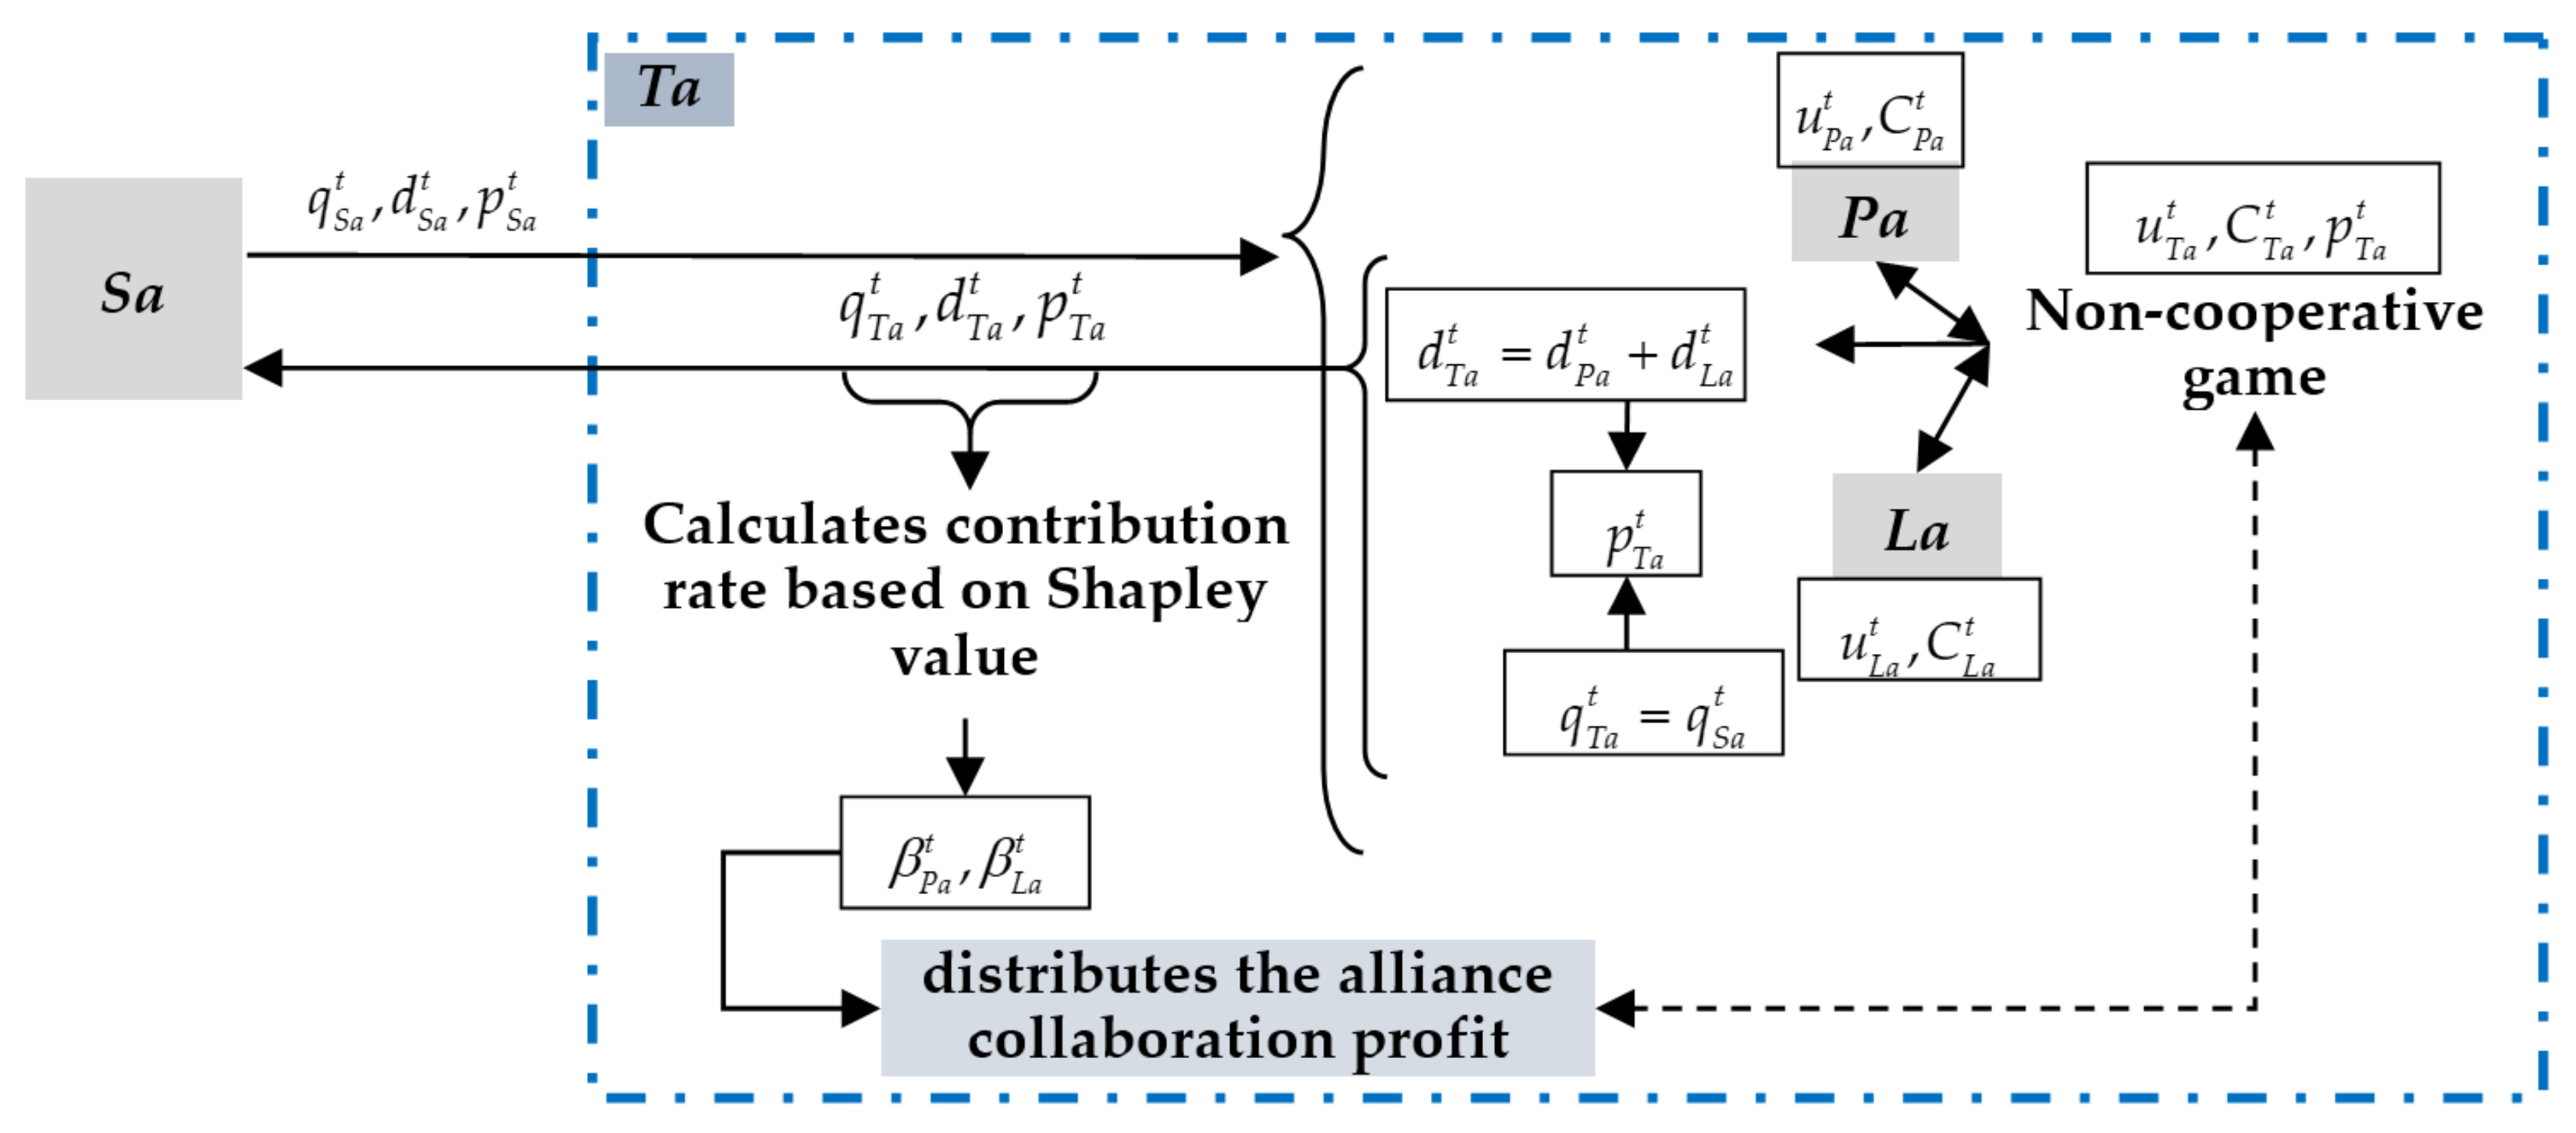
The process of team game between Pa and La in Ta is shown in Figure 4. In the negotiation of each round, Pa and La calculate their own offers based on the non-cooperative game, and then Ta distributes the collaboration profit according to their contribution rates, and the automated negotiation iterates round by round until the termination criteria is met. Pa and La may take the profit of Ta and their individual profits into account of their offers. Notably, in first round, the distribution of collaboration profit is initialized with fixed rates.
4. Numerical Simulation and Analysis
4.1. Simulation Experiments
In recent years, China’s energy transition to tackle climate change, from a coal-dominated system to one with the world largest deployment of renewable energy such as wind or solar energy, has intensified the dual pressures of the coal enterprises including cutting overcapacity and fierce competition in coal industry as China entered new normal economy [49]. To enhance the operational efficiency, improve the service level for customers and maintain the competition edges in market, many coal production enterprises often group a vertical alliance with coal logistics enterprises or other enterprises in the supply chain as a business tactic in their competitive strategy [50]. In this study, two members of alliance with one Production enterprise and one Logistics enterprise, and one Stakeholder enterprise are involved in the numerical simulation. With the notations designated in previous sections, the Production enterprise entity is a large coal production enterprise in Inner Mongolia, which seeks to outsource the coal logistics, to enhance the production capacity, efficiency and quality. The Logistics enterprise entity is a professional logistics enterprise which engages in coal transportation. The Stakeholder enterprise entity is a large power & heating company in Guangzhou, which sooner or later replenishes coal for power generation, a power & heating company needs to replenish a quantity of coal of specifications at some costs (the unit calorific value should be between 6300 and 6400 Kcal, moreover, the volatile matter, total sulfur and moisture should be less than 14%, 0.9% and 8% respectively. The known conditions include that the distance is about 25,000 Km, and logistics cost has a considerable proportion in the cost of sales (at least 60% in the sale cost of coal according to the objective statistics [39,50])), and sends the request to the B2B electronic platform. To support the power & heating company, the B2B electronic platform groups a coal production enterprise and a professional logistics enterprise as an allied negotiation team in some ways (the supply chain B2B electronic platform may find the team with some rules or strategies, in a process that might need qualified Production enterprise and Logistics enterprise to interact with each other and confirm the team formation), to negotiate with the power & heating company for making a supply contract or agreement. The B2B electronic platform initializes four agents: Sa, Pa, La, Ta, accordingly for the power & heating company, the coal production enterprise, the professional logistics enterprise and the allied team, and then starts an automated negotiation process designed as above, and the issues of negotiation involve quantity q (ton), unit price p (RMB/ton) and delivery time d (due day), i.e., the issues set of negotiation is {q, d, p}. Assuming that, all member agents of the team independently make their decision and at the same time, there is no leader or follower in the team about making offers during the negotiation with Sa. Each of Pa and La is economically rational and acts strategically, usually seeks for maximizing its own profits. All team member agents have the common cost function but with different parameters setting, for more profits they may share some information or resources and the team settings are in common sense such as the pricing rules, collaboration profit function and the historical information of the negotiation.
4.2. Parameter Settings
4.3. Analysis of Experimental results
Based on the settings in Table 2, Table 3 and Table 4, a set of illustrative parametric data of a problem instance is shown in Table 5.
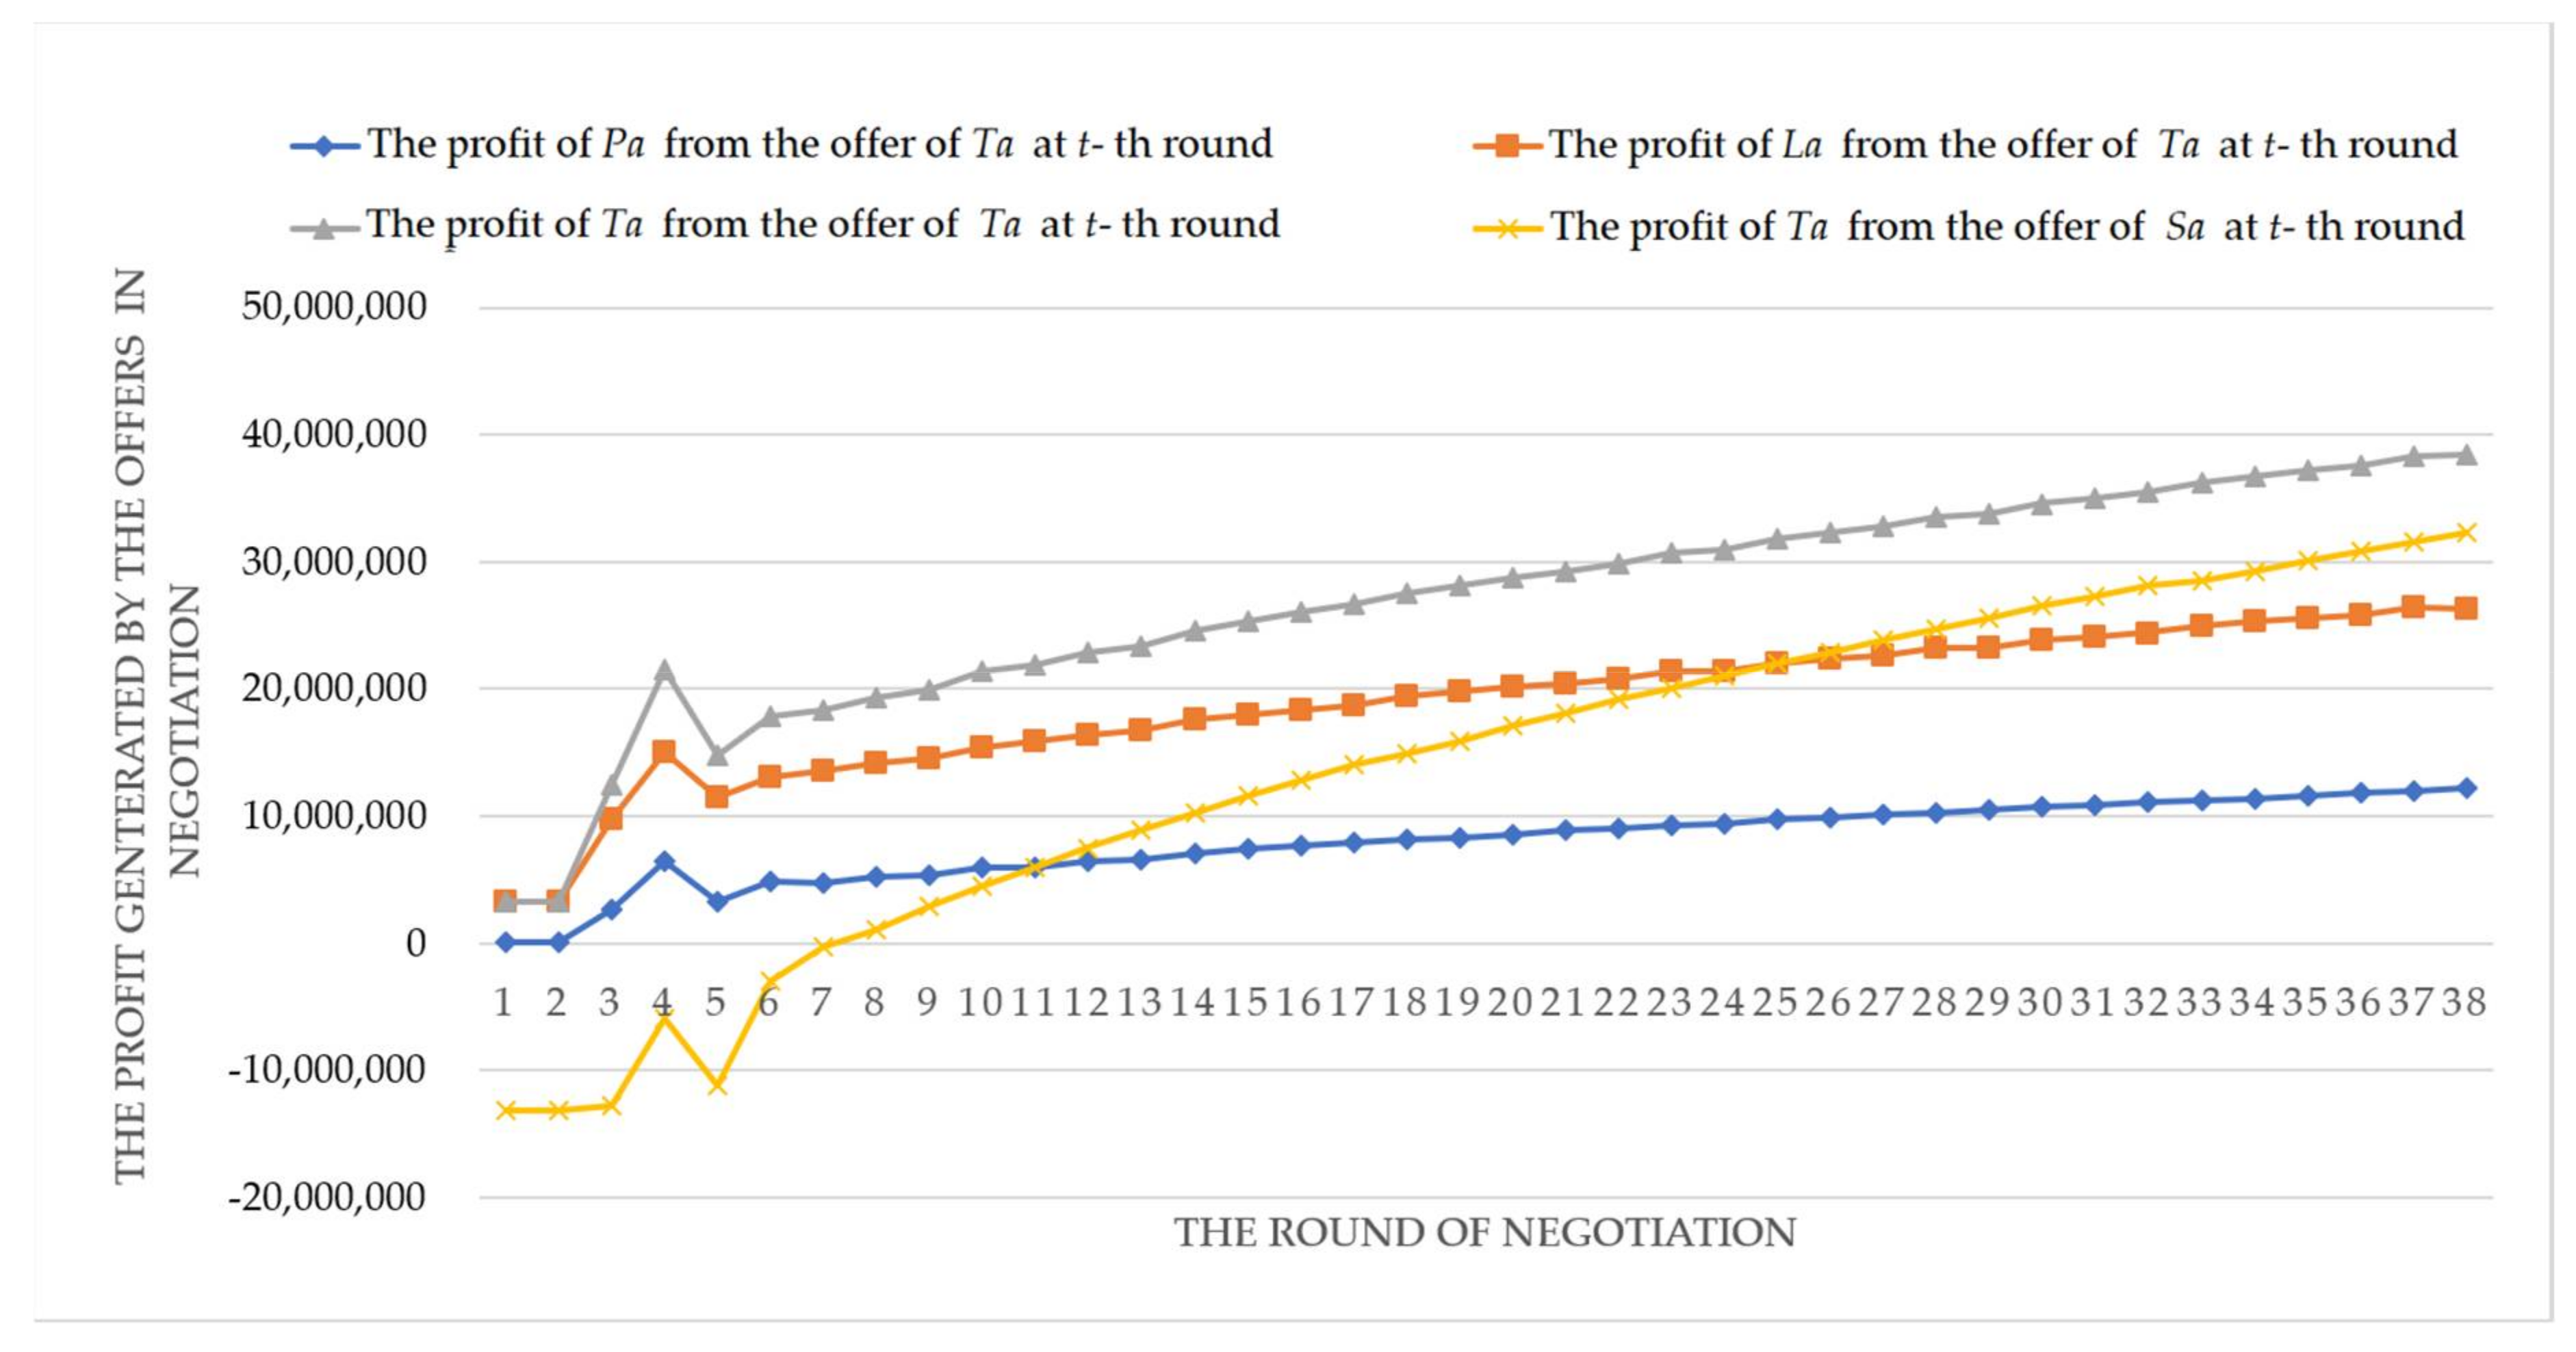
During the automated negotiation, to maximize their individual profits, Pa and La may calculate their best offers according to their own situation. With regards to the offer of Sa, the counter-offer of Ta is not mandatorily assigned, but each member agent (Pa and La) participates in the decision-making, which is constructive for the operational fulfilment in future. Moreover, the distribution of collaboration profit based on Shapley value has leaded to each member agent doing best to make the total profit of Ta.
In Figure 5, it is shown that the profits of Ta, Pa and La are consistently improved in the negotiation process. Meanwhile, Figure 6 shows that the profit improvement of Ta is not relying on the loss of Sa, but improves the satisfaction level of Sa accordingly. Finally, at the 38th round, by the negotiation strategy in Figure 4, Sa accepts the offer of Ta: , (i.e., quantity is 45,160.56 ton, delivery time is 55 days, and unit price is 601.51 Yuan/ton), because the satisfaction level of Sa is 0.5943 which is bigger than its threshold θSa (0.59). The profits of Ta, Pa and La are 38,467,922.45 Yuan, 12,168,691.6 Yuan and 26,299,230.84 Yuan, respectively. As a result, we can find that ANT is suitable to solve the trading negotiation problems between allied vertical alliance and stakeholder enterprise, where a win-win effective agreement or contract can be obtained.
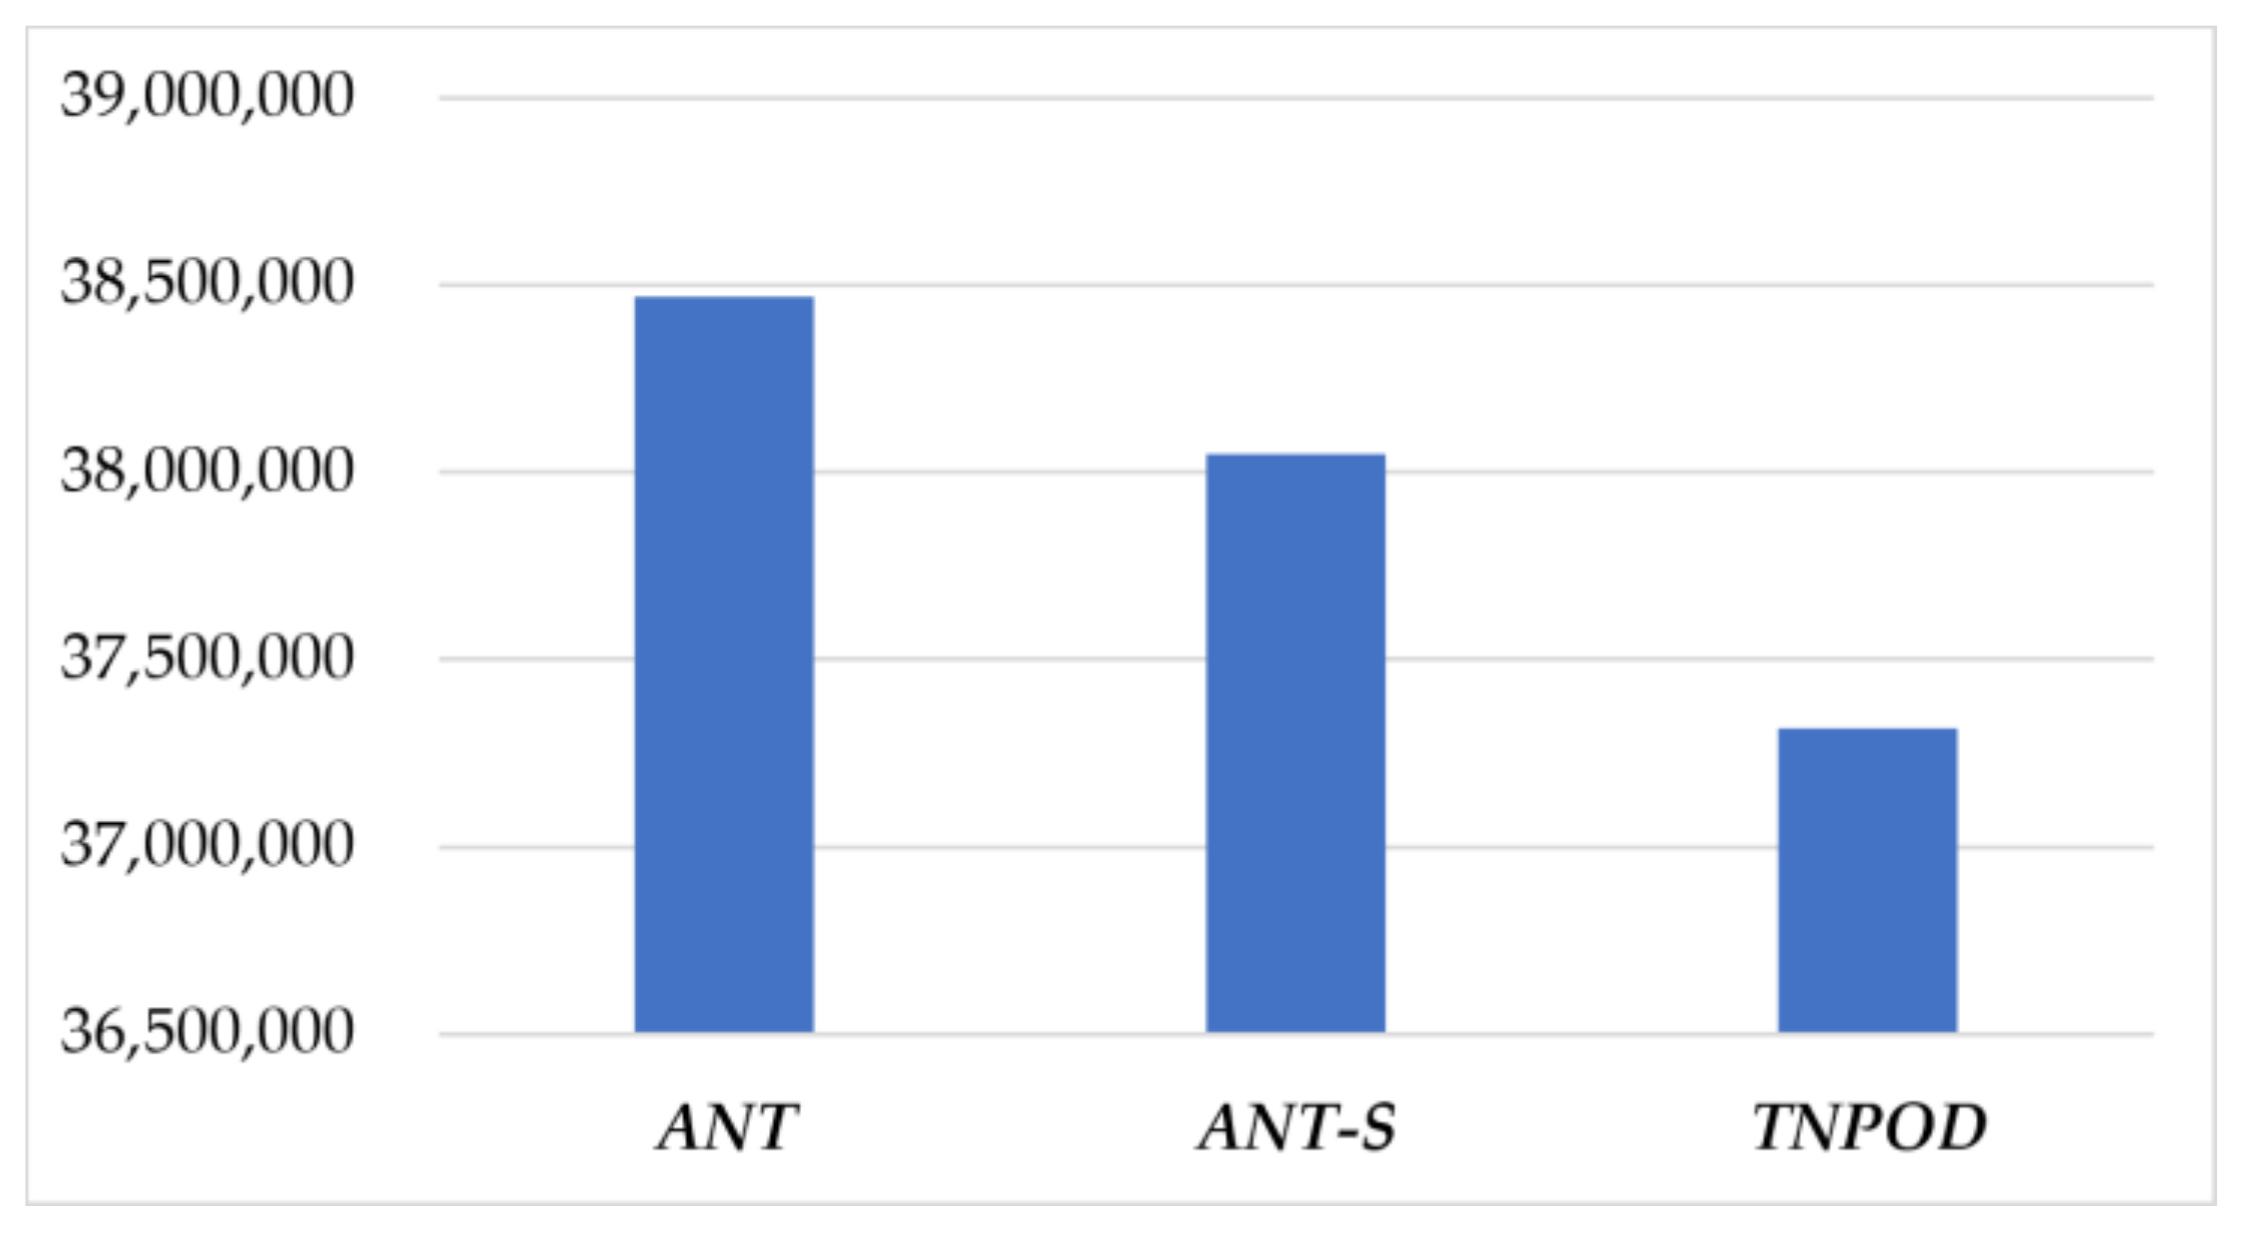
To compare ANT with other models of different mechanisms: ANT-S (The distribution of collaboration profit in ANT based on a fixed rate) and TNPOD (Sanchez-Anguix et al. [26,28]), with data in Table 5. The comparison of the models is shown in Figure 7.
Through the simulation experiments, it is found that ANT-S and TNPOD can also succeed in the negotiation within 38 rounds, but the obtained profits of Ta are significantly different, as shown in Figure 7. By ANT-S, the maximum profit of Ta (38,049,564.59 Yuan) is 418,357.86 Yuan less than ANT (38,467,922.45 Yuan), indicating that the profit distribution by the Shapley value in ANT is more effective than those on a fixed distribution rate. By TNPOD, the final profit of Ta is 37,317,253.12 Yuan, less 1,150,669.33 and 732,311.47 than ANT and ANT-S respectively, implying that the team game-based method may obtain higher profit for Ta than the voting-based method.
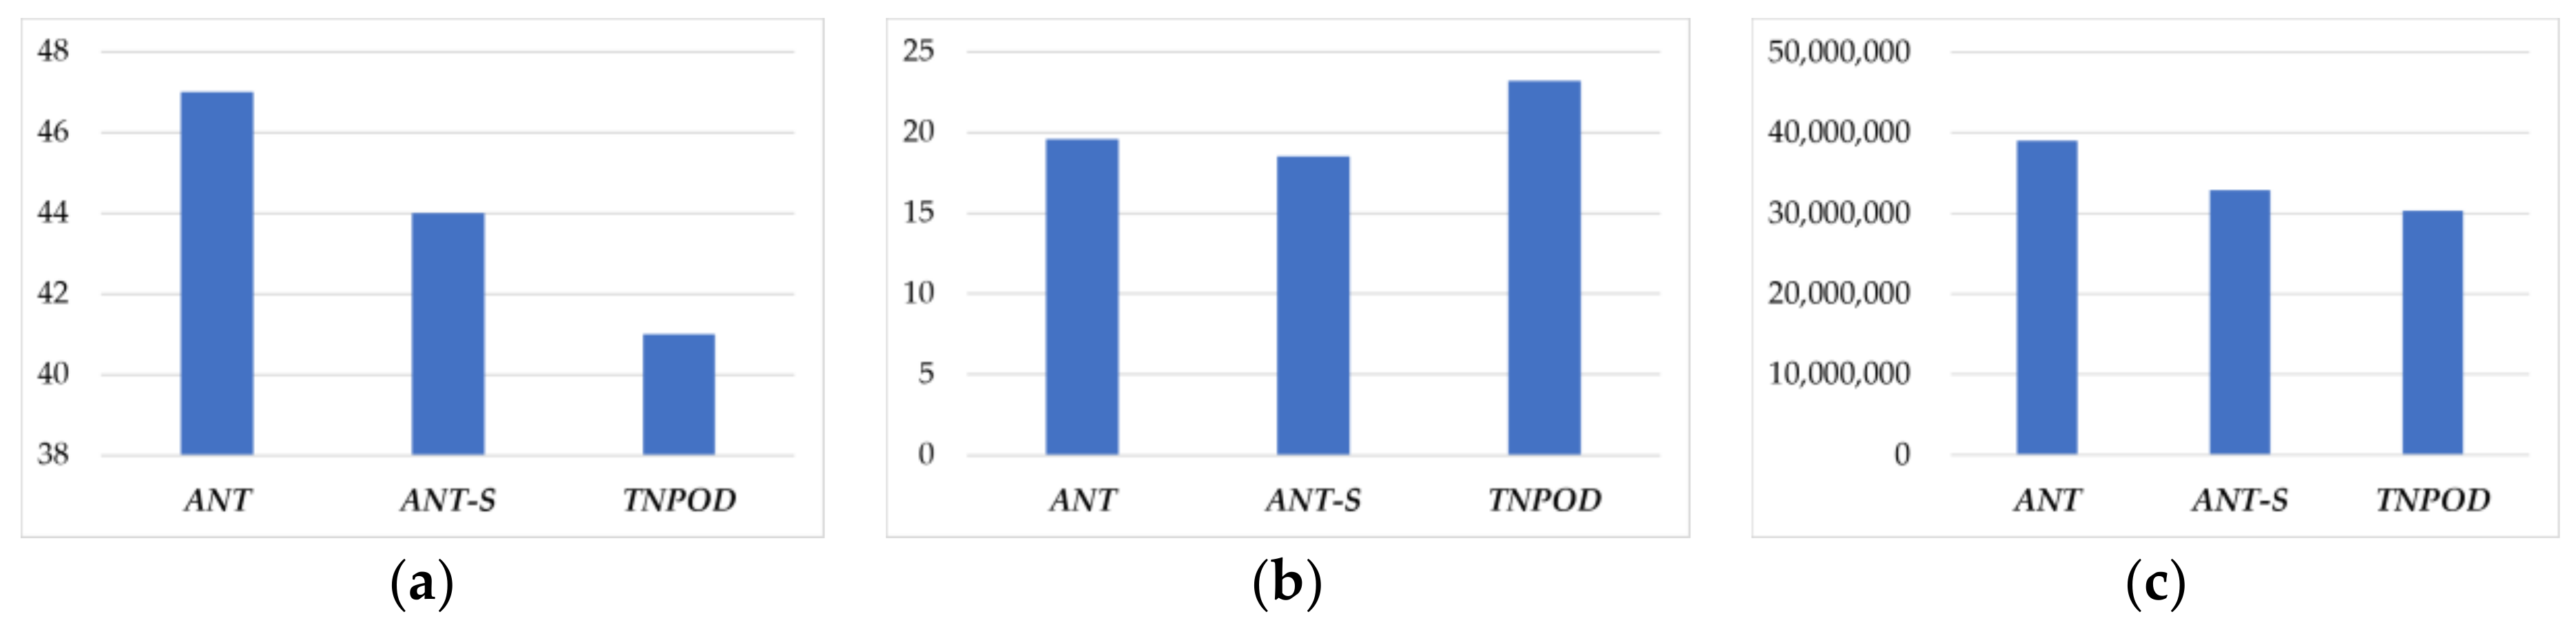
Moreover, to further verify the effectiveness of ANT, this study has compared the average results of 50 times simulations of ANT with ANT-S and TNPOD. The comparison results are shown in Figure 8.
In Figure 8a, it is shown that ANT can obtain more successful negotiations than ANT-S and TNPOD in the 50 simulation experiments, which indicates that ANT has better adaptability to negotiation environment and instance parameters. In Figure 8b, the average number of negotiation rounds is slightly worse than ANT-S, but is better than TNPOD. The main reason for this is that ANT may make member agents more prudent in calculating offers than ANT-S to obtain more collaboration profit, and TNPOD allows Ta more offer adjustments for a mutually acceptable agreement in negotiation. Fortunately, the gap of rounds between ANT and ANT-S is not significant, so it has not obvious effect on the result of the undergoing automatic negotiation processes. In Figure 8c, the average profit of Ta is obviously better than ANT-S and TNPOD, like the result of simulation experiment in Figure 7. Notably that, in Figure 8 the average number of the negotiation rounds, and the average profit of Ta are obtained in successful negotiations.
In summary, in terms of the above numerical simulation results and analysis, the proposed ANT can be effective and helpful for the allied team and stakeholder to make a business contract or agreement, through the automated negotiation on a supply chain B2B electronic platform.
5. Conclusions
With the emergence of the new normal economy, the market competition is increasingly fierce. To keep their competitive edge, enterprises often group vertical alliance with upstream and downstream partners in supply chain as a business tactic in their competitive strategy. Although, in reality, allied members do expect that their profits can be improved by the cooperation in an alliance, it is difficult for them to completely share resources and operational information due to privacy or trust consideration. To improve their bargaining competence in the negotiation with opponents, in terms of cost reduction of operations, trading and technology innovation, the members of the vertical alliance may form as a single negotiation team. Considering the characteristics that the competition and cooperation coexist in the team, this paper designed automated negotiation model and a team game process, aiming at obtaining a business agreement on the fulfilment of stakeholder’s demand. In ANT, the offer calculation in the allied team is described and analyzed from the perspective of non-cooperative game, and solved with Shapley value, so that the collaboration profit is distributed among team members according to their contribution rates. Through a case study of simulation experiments with a power & heating company and an allied team with a coal enterprise and a logistics enterprise, the effectiveness of ANT has been testified.
The research shed light on the cooperation among the vertical supply chain and demand stakeholder: (1) although the vertical allied team in a negotiation may significantly improve their bargaining power, the decision-making mechanism of the counter-offer may influence the final profit of the team; (2) the team formation and the decision-making mechanism need take into account the characteristics of the vertical supply chain with co-opetition; (3) the decision-making mechanism embedded with suitable game process may improve the efficiency and quality of the counter-offer attainable by the team; (4) the combination of cooperative and non-cooperative games may be a good way to describe the decision-making processes in the concerned problem.
Our research makes some contributions on theoretic and practical applications: (1) the decision-making of the vertical allied team with co-opetitive relationship is shaped with game process in the negotiation with opponent; (2) with the proposed automated negotiation model, the vertical allied team may properly manage internal collaborative business even member competition coexists; (3) this model can help allied teams, in a supply chain or other independent organization that cooperate for fulfilling a task, to make an agreement with other stakeholders or potential cooperators, with the assumption that team members may have different know-how or roles for fulfilling the tasks but not affect the decision-making in the team, and the tasks are not so clearly divided among the team members, meanwhile the working approaches are less rigid and eventually more prone to lower the work efficiency or generate much more extra cost as the inferior collaboration. By appropriate improvement or adjustment, the proposed model can be applied to solving problems in other domains that may be supported by agent-based negotiation teams, such as the team-based services finding, for instance, in the travel service platform such as TripAdvisor (an American travel and restaurant platform company providing hotel and restaurant reviews, accommodation bookings and other travel-related content.), and the team-based management of complex democratic organization, for instance, the agricultural cooperatives reported in the literature [51] such as the agricultural products platform such as Hello Fresh and Blue Apron in American and so on.
From the two practical application scenarios, it is observable that an electronic marketplace platform is necessary for a physical connection between members to make information sharing feasible for various flow activities. Although the work flow of the proposed model aims to be general and adaptable to a wide variety of domains and applications, some improvement or adjustment must be done to meet the specific demands of different platform environments. Moreover, In the present research many practical factors such as the enterprise scale and technological superiority, etc. don’t affect the decision-making of member agents in the vertical allied enterprises team, which may be impractical. Thus, subsequent research should be based on this foundation and further studies the influence of the specific team with distinct size or structure, in which member enterprises might have different know-how and therefore some of them might be naturally in a more advantageous position than other companies. In future research, the model might also be improved by considering more negotiation issues besides the delivery time and other negotiation situations such as three or more teams involved in a negotiation. In addition, some unique challenges like how to form a negotiation team and how to shape and define the cost or profit function of agents should be considered with the new topic.
Acknowledgments
This work is supported by Major International Joint Research Project of Natural Science Foundation of China under Grant No. 71620107003; the National Science Foundation for Distinguished Young Scholars of China under Grant No. 71325002; the Foundation for Innovative Research Groups of National Science Foundation of China under Grant No. 61621004; the 111 Project (B16009); the Fundamental Research Funds for State Key Laboratory of Synthetical Automation for Process Industries under Grant No.2013ZCX11; Natural Science Foundation of China under Grant No. 71171040, No. 71540019; Planning Project of Philosophy and Social Science of Heilongjiang Province under Grant No.14C004.
Author Contributions
Taiguang Gao, Qing Wang and Min Huang proposed research ideas and designed the model and the process of team game; Min Huang, Xingwei Wang and Yu Zhang suggested the research methods and performed the mathematical derivation; Taiguang Gao and Qing Wang designed and carried out the numerical simulation; they wrote this paper together and contributed equally to this work and all of them have read and approved the final manuscript.
Conflicts of Interest
The authors declare no conflict of interest.
References
- Zhang, H.; Li, L.; Chen, T.; Li, V. Where will China’s real estate market go under the economy’s new normal? Cities 2016, 55, 42–48. [Google Scholar] [CrossRef]
- Dai, D.; Si, F.; Wang, J. Stability and complexity analysis of a dual-channel closed-loop supply chain with delayed decision under government intervention. Entropy 2017, 19, 577. [Google Scholar] [CrossRef]
- Ai, X.; Chen, J.; Zhao, H.; Tang, X. Competition among supply chains: Implications of full returns policy. Int. J. Prod. Econ. 2012, 139, 257–265. [Google Scholar] [CrossRef]
- Esposito, E.; Evangelista, P. Investigating virtual enterprise models: Literature review and empirical findings. Int. J. Prod. Econ. 2014, 148, 145–157. [Google Scholar] [CrossRef]
- Grauberger, W.; Kimms, A. Revenue management under horizontal and vertical competition within airline alliances. Omega 2016, 59, 228–237. [Google Scholar] [CrossRef]
- Kenyon, G.N.; Meixell, M.J.; Westfall, P.H. Production outsourcing and operational performance: An empirical study using secondary data. Int. J. Prod. Econ. 2016, 171, 336–349. [Google Scholar] [CrossRef]
- Huang, M.; Cui, Y.; Yang, S.; Wang, X. Fourth party logistics routing problem with fuzzy duration time. Int. J. Prod. Econ. 2013, 145, 107–116. [Google Scholar] [CrossRef]
- Dudek, G.; Stadtler, H. Negotiation-based collaborative planning between supply chains partners. Eur. J. Oper. Res. 2005, 163, 668–687. [Google Scholar] [CrossRef]
- Yenipazarli, A. To collaborate or not to collaborate: Prompting upstream eco-efficient innovation in a supply chain. Eur. J. Oper. Res. 2017, 260, 571–587. [Google Scholar] [CrossRef]
- Bigliardi, B.; Bottani, E.; Galati, F. Open innovation and supply chain management in food machinery supply chain: A case study. Int. J. Eng. Sci. Technol. 2010, 2, 244–255. [Google Scholar] [CrossRef]
- West, J.; Bogers, M. Leveraging external sources of innovation: A review of research on open innovation. J. Prod. Innov. Manag. 2014, 31, 814–831. [Google Scholar] [CrossRef]
- Greco, M.; Grimaldi, M.; Cricelli, L. Open innovation actions and innovation performance: A literature review of European empirical evidence. Eur. J. Innov. Manag. 2015, 18, 150–171. [Google Scholar] [CrossRef]
- Bogers, M.; Zobel, A.K.; Afuah, A.; Almirall, E.; Brunswicker, S.; Dahlander, L.; Frederiksen, L.; Gawer, A.; Gruber, M.; Haefliger, S.; et al. The open innovation research landscape: Established perspectives and emerging themes across different levels of analysis. Ind. Innov. 2017, 24, 8–40. [Google Scholar] [CrossRef]
- Barchi, M.; Greco, M. Negotiation in open innovation: A literature review. Group Decis. Negot. 2018, 1–32. [Google Scholar] [CrossRef]
- Ren, Z.; Anumba, C.J. Learning in multi-agent systems: A case study of construction claims negotiation. Adv. Eng. Inform. 2002, 16, 265–275. [Google Scholar] [CrossRef]
- Hashmi, K.; Malik, Z.; Najmi, E.; Rezgui, A. SNRNeg: A social network enabled negotiation service. Inf. Sci. 2016, 349, 248–262. [Google Scholar] [CrossRef]
- Patrikar, M.; Vij, S.; Mukhopadhyay, D. An approach on multilateral automated negotiation. Procedia Comput. Sci. 2015, 49, 298–305. [Google Scholar] [CrossRef]
- Baarslag, T.; Hindriks, K.; Jonker, C. Effective acceptance conditions in real-time automated negotiation. Decis. Support Syst. 2014, 60, 68–77. [Google Scholar] [CrossRef]
- Cao, M.; Luo, X.; Luo, X.R.; Dai, X. Automated negotiation for e-commerce decision making: A goal deliberated agent architecture for multi-strategy selection. Decis. Support Syst. 2015, 73, 1–14. [Google Scholar] [CrossRef]
- Hernández, J.E.; Mula, J.; Poler, R.; Lyons, A.C. Collaborative planning in multi-tier supply chains supported by a negotiation-based mechanism and multi-agent system. Group Decis. Negot. 2014, 23, 235–269. [Google Scholar] [CrossRef]
- Wang, G.; Gunasekaran, A.; Ngai, E.W.; Papadopoulos, T. Big data analytics in logistics and supply chain management: Certain investigations for research and applications. Int. J. Prod. Econ. 2016, 176, 98–110. [Google Scholar] [CrossRef]
- Tan, K.H.; Zhan, Y.; Ji, G.; Ye, F.; Chang, C. Harvesting big data to enhance supply chain innovation capabilities: An analytic infrastructure based on deduction graph. Int. J. Prod. Econ. 2015, 165, 223–233. [Google Scholar] [CrossRef]
- Giannakis, M.; Giannakis, M.; Louis, M.; Louis, M. A multi-agent based system with big data processing for enhanced supply chain agility. J. Enterp. Inf. Manag. 2016, 29, 706–727. [Google Scholar] [CrossRef]
- Rauh, J. Secret sharing and shared information. Entropy 2017, 19, 601. [Google Scholar] [CrossRef]
- Schoenherr, T.; Speier-Pero, C. Data science, predictive analytics, and big data in supply chain management: Current state and future potential. J. Bus. Logist. 2015, 36, 120–132. [Google Scholar] [CrossRef]
- Sanchez-Anguix, V.; Julian, V.; Botti, V.; Garcia-Fornes, A. Reaching unanimous agreements within agent-based negotiation teams with linear and monotonic utility functions. IEEE Trans. Syst. Man Cybern. Part B 2012, 42, 778–792. [Google Scholar] [CrossRef] [PubMed]
- Sanchez-Anguix, V.; Julian, V.; Botti, V.; García-Fornes, A. Tasks for agent-based negotiation teams: Analysis, review, and challenges. Eng. Appl. Artif. Intell. 2013, 26, 2480–2494. [Google Scholar] [CrossRef]
- Sanchez-Anguix, V.; Julian, V.; Botti, V.; García-Fornes, A. Studying the impact of negotiation environments on negotiation teams’ performance. Inf. Sci. 2013, 219, 17–40. [Google Scholar] [CrossRef]
- Sheu, J.B.; Gao, X.Q. Alliance or no alliance—Bargaining power in competing reverse supply chains. Eur. J. Oper. Res. 2014, 233, 313–325. [Google Scholar] [CrossRef]
- Lou, W.; Ma, J.; Zhan, X. Bullwhip entropy analysis and chaos control in the supply chain with sales game and consumer returns. Entropy 2017, 19, 64. [Google Scholar] [CrossRef]
- Gao, J.; Yang, X.; Liu, D. Uncertain Shapley value of coalitional game with application to supply chain alliance. Appl. Soft Comput. 2017, 56, 551–556. [Google Scholar] [CrossRef]
- Niu, B.; Wang, Y.; Guo, P. Equilibrium pricing sequence in a co-opetitive supply chain with the ODM as a downstream rival of its OEM. Omega 2015, 57, 249–270. [Google Scholar] [CrossRef]
- Luo, Z.; Chen, X.; Wang, X. The role of co-opetition in low carbon manufacturing. Eur. J. Oper. Res. 2016, 253, 392–403. [Google Scholar] [CrossRef]
- Harré, M.S. Strategic information processing from behavioural data in iterated games. Entropy 2018, 20, 27. [Google Scholar] [CrossRef]
- Zhang, J.; Frazier, G.V. Strategic alliance via co-opetition: Supply chain partnership with a competitor. Decis. Support Syst. 2011, 51, 853–863. [Google Scholar] [CrossRef]
- Chen, X.; Hao, G. Co-opetition alliance models of parallel flights for determining optimal overbooking policies. Math. Comput. Model. 2013, 57, 1101–1111. [Google Scholar] [CrossRef]
- Fielder, A.; Panaousis, E.; Malacaria, P.; Hankin, C.; Smeraldi, F. Game Theory Meets Information Security Management. In Proceedings of the IFIP International Information Security Conference, Marrakech, Morocco, 2–4 June 2014. [Google Scholar]
- Panaousis, E.; Fielder, A.; Malacaria, P.; Hankin, C.; Smeraldi, F. Cybersecurity Games and Investments: A decision support approach. In Proceedings of the 5th International Conference on Decision and Game Theory for Security, Los Angeles, CA, USA, 6–7 November 2014. [Google Scholar]
- Cheng, Q.; Ning, S.; Xia, X.; Yang, F. Modelling of coal trade process for the logistics enterprise and its optimization with stochastic predictive control. Int. J. Prod. Res. 2016, 54, 2241–2259. [Google Scholar] [CrossRef]
- Faratin, P.; Sierra, C.; Jennings, N.R. Negotiation decision functions for autonomous agents. Robot. Auton. Syst. 1998, 24, 159–182. [Google Scholar] [CrossRef]
- Fatima, S.; Kraus, S.; Wooldridge, M. Principles of Automated Negotiation; Cambridge University Press: Cambridge, UK, 2014. [Google Scholar]
- Roth, A.E. The Shapley Value: Essays in Honor of Lloyd S. Shapley; Cambridge University Press: Cambridge, UK, 1998. [Google Scholar]
- Shapley, L.S. A value for n-person games. Contrib. Theory Games 1953, 2, 307–317. [Google Scholar]
- Nagarajan, M.; Sošić, G. Game-theoretic analysis of cooperation among supply chain agents: Review and extensions. Eur. J. Oper. Res. 2008, 187, 719–745. [Google Scholar] [CrossRef]
- Guardiola, L.A.; Meca, A.; Timmer, J. Cooperation and profit allocation in distribution chains. Decis. Support Syst. 2007, 44, 17–27. [Google Scholar] [CrossRef]
- Kemahlıoğlu-Ziya, E.; Bartholdi III, J.J. Centralizing inventory in supply chains by using Shapley value to allocate the profits. Manuf. Serv. Oper. Manag. 2011, 13, 146–162. [Google Scholar] [CrossRef]
- Lozano, S.; Moreno, P.; Adenso-Díaz, B.; Algaba, E. Cooperative game theory approach to allocating benefits of horizontal cooperation. Eur. J. Oper. Res. 2013, 229, 444–452. [Google Scholar] [CrossRef]
- Leng, M.; Parlar, M. Allocation of cost savings in a three-level supply chain with demand information sharing: A cooperative-game approach. Oper. Res. 2009, 57, 200–213. [Google Scholar] [CrossRef]
- Dong, C.; Qi, Y.; Dong, W.; Lu, X.; Liu, T.; Qian, S. Decomposing driving factors for wind curtailment under economic new normal in China. Appl. Energy 2018, 217, 178–188. [Google Scholar] [CrossRef]
- Wang, C.; Ducruet, C. Transport corridors and regional balance in China: The case of coal trade and logistics. J. Transp. Geogr. 2014, 40, 3–16. [Google Scholar] [CrossRef]
- Ortmann, G.F.; King, R.P. Agricultural cooperatives I: History, theory and problems. Agrekon 2007, 46, 18–46. [Google Scholar] [CrossRef]
Figure 1.
The process of automated negotiation.

Figure 2.
The negotiation strategy of Ta. is the counter-offer of Ta at the (t − 1)-th round.

Figure 3.
The negotiation strategy of Sa.

Figure 4.
The team game process for calculating counter-offers.

Figure 5.
The profits of Ta and its member agents during the negotiation.

Figure 6.
The satisfaction level and resistance force of Sa during the negotiation.

Figure 7.
The comparison of Ta’s profit by different models.

Figure 8.
The average results comparison of 50 times simulations. (a) Number of successful negotiations; (b) Number of negotiation rounds; (c) Average profit.
Figure 8.
The average results comparison of 50 times simulations. (a) Number of successful negotiations; (b) Number of negotiation rounds; (c) Average profit.


Table 1.
The Notations and Descriptions in ANT.
| Notations | Descriptions |
|---|---|
| Pa, La | the agents delegating Production enterprise and Logistics enterprise in an automated negotiation |
| , | the ideal and threshold value for quantity () |
| , | the ideal and threshold value for delivery time () |
| the round-dependent price function | |
| the average unit price in the market, and we set bTa = (1 + γb)(cPa + cLa) in this paper | |
| the general markup percentage of price relative to total cost value | |
| the deadline designated when the automated negotiation is initialized | |
| the influence factor of the quantity on unit price, | |
| the influence factor of the delivery times of Pa and La on unit price | |
| the delivery time requested by Ta at the tth round, | |
| the alliance collaboration profit from the team offer at the t-th round | |
| the distribution rates set of for Pa and La, αTa = {αPa,αLa} and αPa + αLa = 1 | |
| the distribution rates set of for Pa and La, βTa = {βPa,βLa} and βPa + βLa = 1 | |
| the negotiation strategy of Ta | |
| , | the ideal and threshold quantities of agent i, , |
| , | the ideal and threshold deliver times of agent i, , |
| the delivery time requested by agent i, | |
| the unit cost of agent i with the team offer at the tth round, | |
| the basic unit cost of agent i in general case, | |
| the influence factor of quantity on the unit cost of agent i, , | |
| the influence factor of delivery time on the unit cost of agent i, | |
| the correlation factor of historical negotiation information for agent i, |
Table 2.
The data template for simulating Ta.
| Parameters | Value Ranges | Parameters | Value Ranges |
|---|---|---|---|
Table 3.
The data template for simulating Pa and La.
| Parameters | Value Ranges | Parameters | Value Ranges |
|---|---|---|---|
Table 4.
The data template for simulating Sa.
| Parameters | Value Ranges | Parameters | Value Ranges |
|---|---|---|---|
Table 5.
Illustrative parametric data of problem instance.
| Parameters | Value | Parameters | Value | Parameters | Value | Parameters | Value |
|---|---|---|---|---|---|---|---|
| 46,384 | 31,384 | 119 | 79 | ||||
| 51,384 | 31,384 | 67 | 42 | ||||
| 46,384 | 28,384 | 57 | 37 | ||||
| 47 | 0.32 | 514 | 623 | ||||
| 31,384 | 46,384 | 39 | 69 | ||||
| 578 | 1078 | 0.59 | 4 | ||||
| 52 | 0.30 | 0.20 | 0.50 |
© 2018 by the authors. Licensee MDPI, Basel, Switzerland. This article is an open access article distributed under the terms and conditions of the Creative Commons Attribution (CC BY) license (http://creativecommons.org/licenses/by/4.0/).
Share and Cite
MDPI and ACS Style
Gao, T.; Wang, Q.; Huang, M.; Wang, X.; Zhang, Y. A Co-Opetitive Automated Negotiation Model for Vertical Allied Enterprises Teams and Stakeholders. Entropy 2018, 20, 286. https://0-doi-org.brum.beds.ac.uk/10.3390/e20040286
AMA Style
Gao T, Wang Q, Huang M, Wang X, Zhang Y. A Co-Opetitive Automated Negotiation Model for Vertical Allied Enterprises Teams and Stakeholders. Entropy. 2018; 20(4):286. https://0-doi-org.brum.beds.ac.uk/10.3390/e20040286
Chicago/Turabian StyleGao, Taiguang, Qing Wang, Min Huang, Xingwei Wang, and Yu Zhang. 2018. "A Co-Opetitive Automated Negotiation Model for Vertical Allied Enterprises Teams and Stakeholders" Entropy 20, no. 4: 286. https://0-doi-org.brum.beds.ac.uk/10.3390/e20040286
Note that from the first issue of 2016, this journal uses article numbers instead of page numbers. See further details here.