A Comparative Study of Geoelectric Signals Possibly Associated with the Occurrence of Two Ms > 7 EQs in the South Pacific Coast of Mexico

Abstract
:1. Introduction
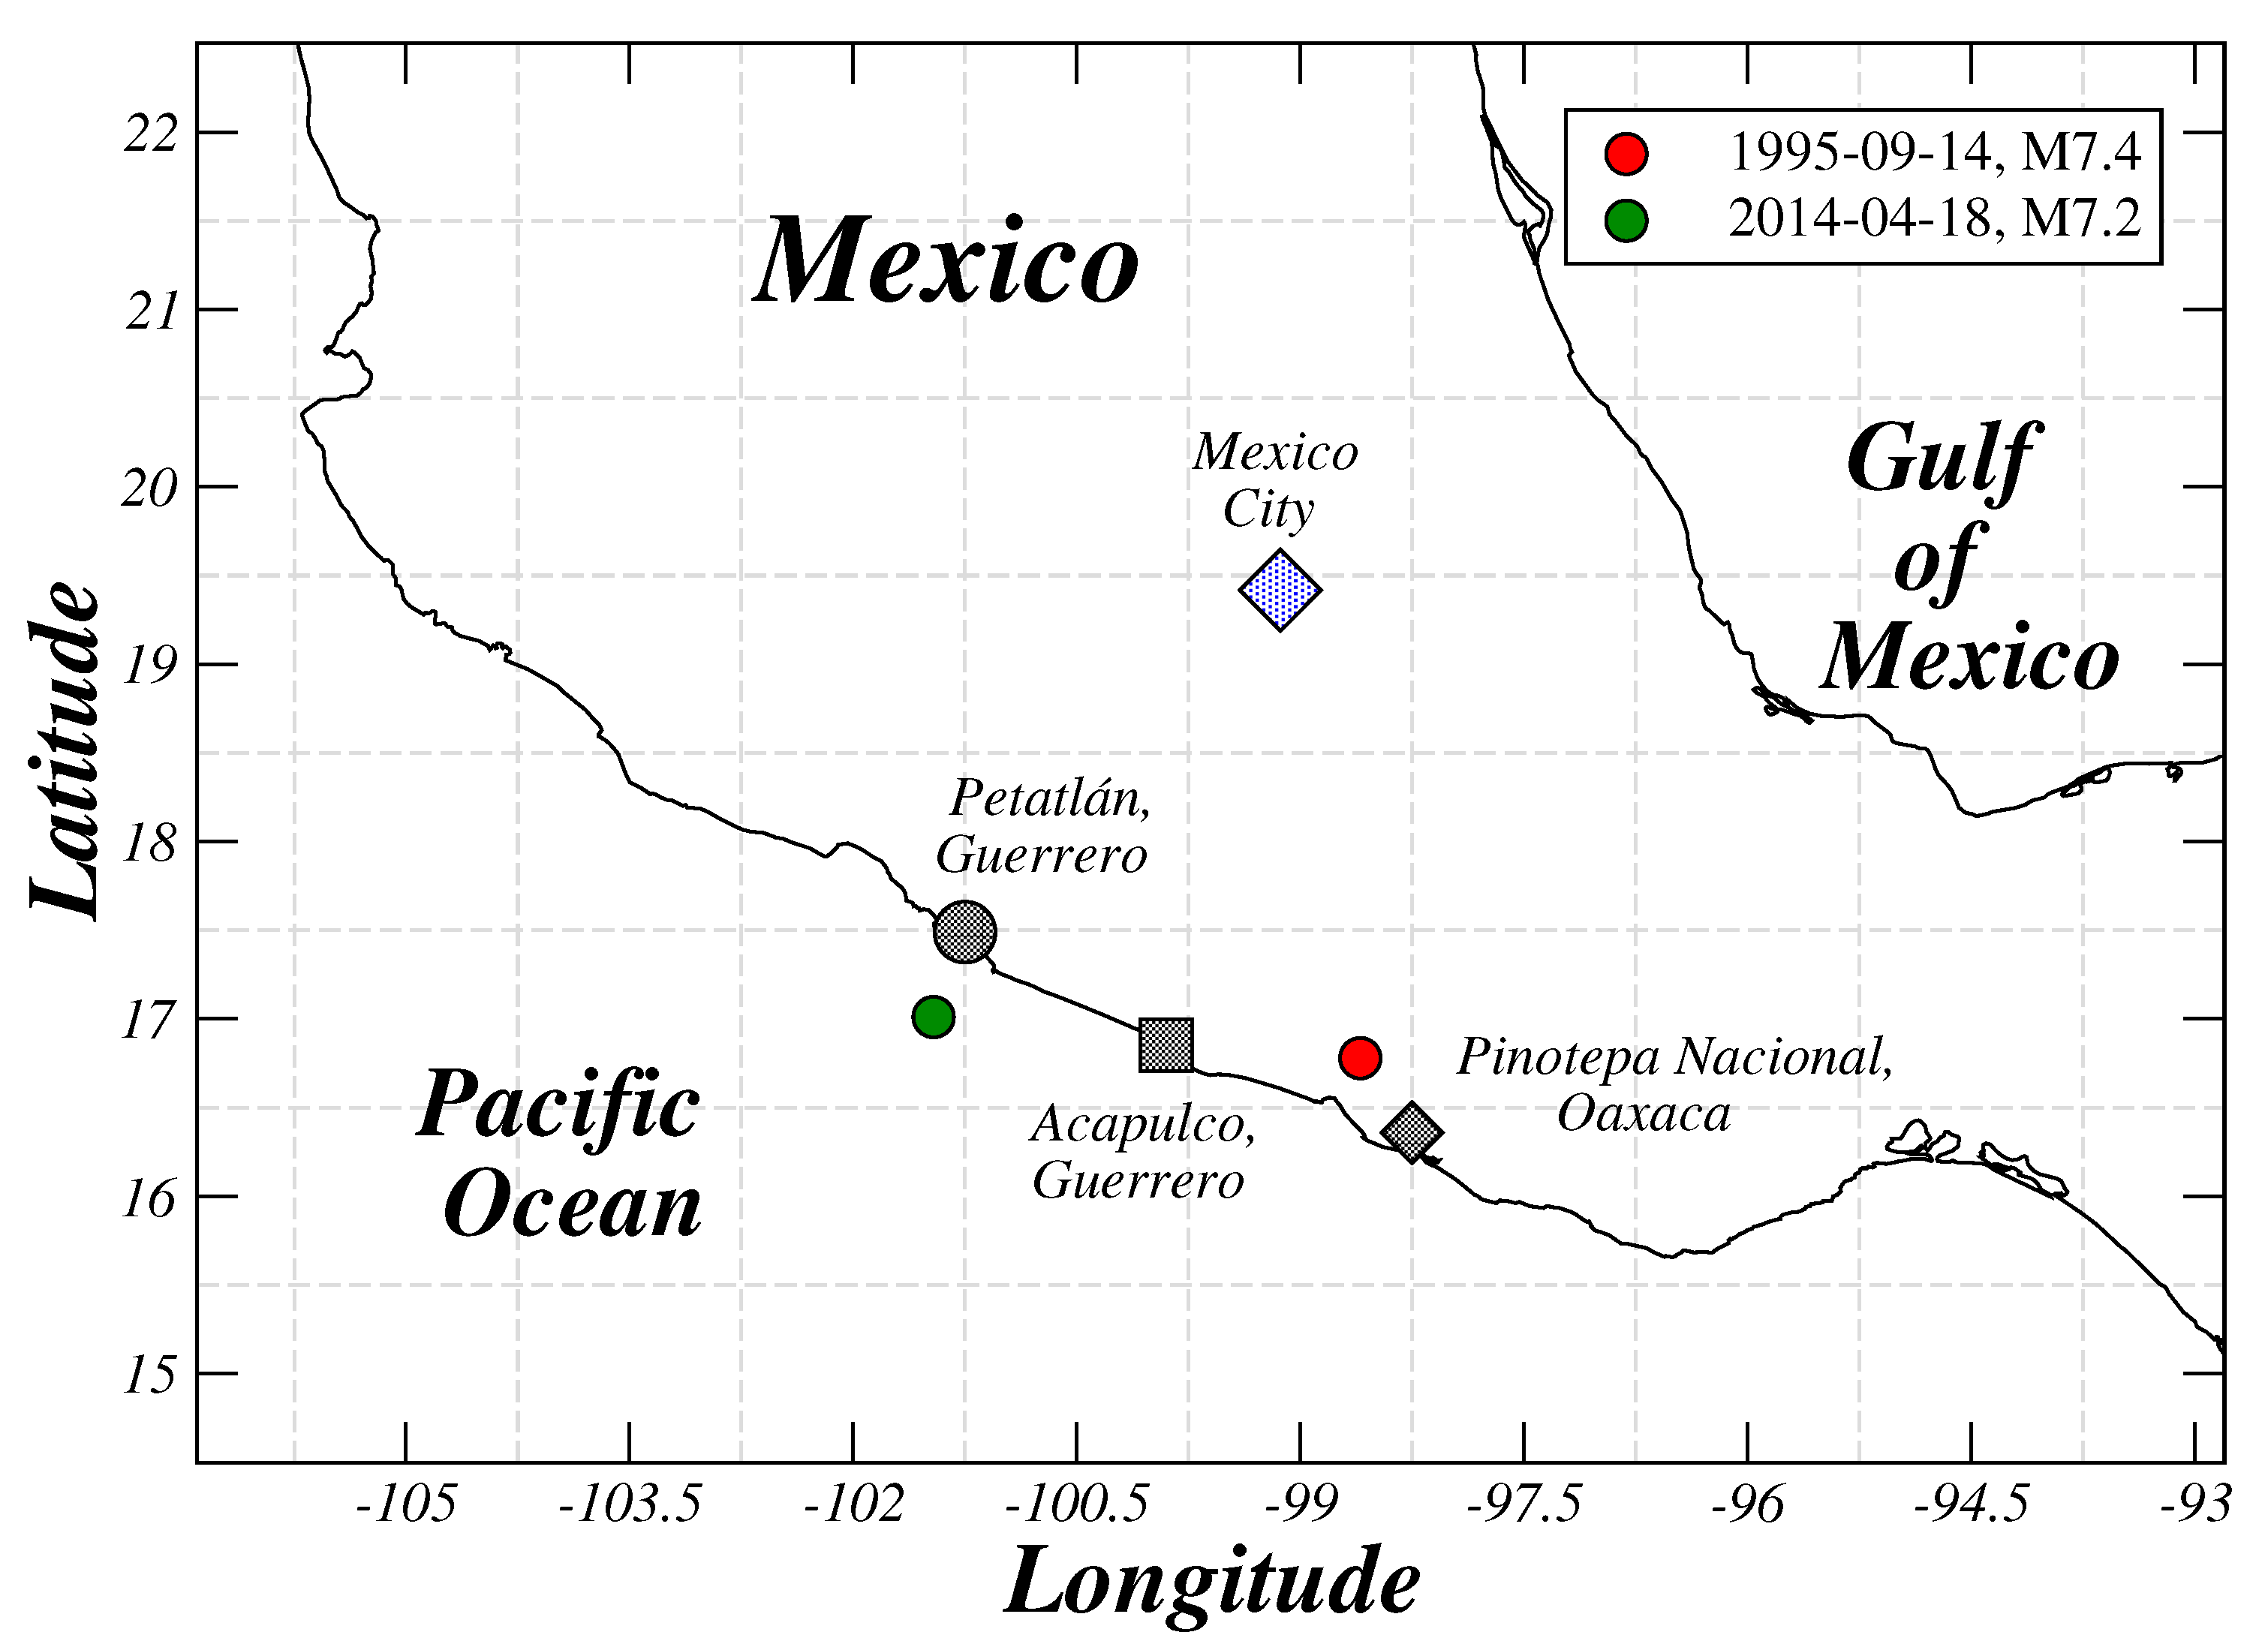
2. The Stations
3. Methods
3.1. Spectral Power and Frequency-Band Analyses
3.2. Detrended Fluctuation Analysis
4. Results
4.1. Spectral Analysis
4.2. DFA Analysis
5. Discussion and Conclusions
Author Contributions
Funding
Acknowledgments
Conflicts of Interest
References
- Geller, R.J.; Jackson, D.D.; Kagan, Y.Y.; Mulargia, F. Earthquakes Cannot Be Predicted. Science 1997, 275, 1616. [Google Scholar] [CrossRef] [Green Version]
- Perez-Oregon, J.; Muñoz-Diosdado, A.; Rudolf-Navarro, A.; Guzmán-Sáenz, A.; Angulo-Brown, F. On the possible correlation between the Gutenberg-Richter parameters of the frequency-magnitude relationship. J. Seismol. 2018, 22, 1025–1035. [Google Scholar] [CrossRef]
- Perez-Oregon, J.; Muñoz-Diosdado, A.; Rudolf-Navarro, A.; Angulo-Brown, F. Some common features between a spring-block self-organized critical model, stick-slip experiments with sandpapers and actual seismicity. Acepted Pure Appl. Geophys. 2019. [Google Scholar] [CrossRef]
- Bak, P.; Christensen, K.; Danon, L.; Scanlon, T. Unified scaling law for earthquakes. Phys. Rev. Lett. 2002, 88, 178501. [Google Scholar] [CrossRef] [Green Version]
- Bak, P.; Tang, C.; Wiesenfeld, K. Self-organized criticality. Phys. Rev. A 1988, 38, 364. [Google Scholar] [CrossRef]
- Bak, P. How Nature Works: The Science of Self-Organized Criticality; Springer: New York, NY, USA, 1996. [Google Scholar]
- Peters, O.; Christensen, K. Rain: Relaxations in the sky. Phys. Rev. E 2002, 66, 036120. [Google Scholar] [CrossRef] [Green Version]
- Peters, O.; Hertlein, C.; Christensen, K. A complexity view of rainfall. Phys. Rev. Lett. 2001, 88, 018701. [Google Scholar] [CrossRef] [Green Version]
- Angulo-Fernández, F.; Reyes-Ramírez, I.; Flores-Márquez, E.L. Scaling properties of rainfall records in some Mexican zones. Acta Geophys. 2018, 66, 361–367. [Google Scholar] [CrossRef]
- Sobolev, G.; Semerchan, A.; Salov, B. Precursors of the destruction of large rock sample. Phys. Chem. Earth Part Solid Earth Geod. 1982, 18, 572–580. [Google Scholar]
- Varotsos, P.; Alexopoulos, K. Physical properties of the variations of the electric field of the earth preceding earthquakes, I. Tectonophysics 1984, 110, 73–98. [Google Scholar] [CrossRef]
- Varotsos, P.; Sarlis, N.; Skordas, E. Seismic electric signals and seismicity: On a tentative interrelation between their spectral content. Acta Geophys. Pol. 2002, 50, 337–354. [Google Scholar]
- Varotsos, P.; Sarlis, N.; Skordas, E. Long-range correlations in the electric signals that precede rupture: Further investigations. Phys. Rev. E 2003, 67, 021109. [Google Scholar] [CrossRef] [PubMed] [Green Version]
- Hayakawa, M.; Ito, T.; Smirnova, N. Fractal analysis of ULF geomagnetic data associated with the Guam earthquake on August 8, 1993. Geophys. Res. Lett. 1999, 26, 2797–2800. [Google Scholar] [CrossRef]
- Hayakawa, M.; Hattori, K.; Ohta, K. Monitoring of ULF (ultra-low-frequency) geomagnetic variations associated with earthquakes. Sensors 2007, 7, 1108–1122. [Google Scholar] [CrossRef] [Green Version]
- Yépez, E.; Angulo-Brown, F.; Peralta, J.; Pavia, C.; González-Santos, G. Electric field patterns as seismic precursors. Geophys. Res. Lett. 1995, 22, 3087–3090. [Google Scholar] [CrossRef]
- Varotsos, P.A.; Sarlis, N.V.; Skordas, E.S. Phenomena preceding major earthquakes interconnected through a physical model. Ann. Geophys. 2019, 37, 315–324. [Google Scholar] [CrossRef] [Green Version]
- Varotsos, P.; Sarlis, N.; Skordas, E.; Lazaridou, M. Identifying sudden cardiac death risk and specifying its occurrence time by analyzing electrocardiograms in natural time. Appl. Phys. Lett. 2007, 91, 064106. [Google Scholar] [CrossRef]
- Varotsos, P.; Sarlis, N.; Skordas, E. Scale-specific order parameter fluctuations of seismicity in natural time before mainshocks. Europhys. Lett. 2011, 96, 59002. [Google Scholar] [CrossRef] [Green Version]
- Ramirez-Rojas, A.; Muñoz-Diosdado, A.; Pavia-Miller, C.; Angulo-Brown, F. Spectral and multifractal study of electroseismic time series associated to the Mw = 6.5 earthquake of 24 October 1993 in Mexico. Nat. Hazards Earth Syst. Sci. 2004, 4, 703–709. [Google Scholar] [CrossRef] [Green Version]
- Ramírez-Rojas, A.; Flores-Márquez, E.; Guzman-Vargas, L.; Márquez-Cruz, J.; Pavía-Miller, C.; Angulo-Brown, F. A comparison of ground geoelectric activity between three regions of different level of seismicity. Nat. Hazards Earth Syst. Sci. 2007, 7, 591–598. [Google Scholar] [CrossRef]
- Ramírez-Rojas, A.; Flores-Márquez, E.; Guzman-Vargas, L.; Gálvez-Coyt, G.; Telesca, L.; Angulo-Brown, F. Statistical features of seismoelectric signals prior to M7. 4 Guerrero-Oaxaca earthquake (México). Nat. Hazards Earth Syst. Sci. 2008, 8, 1001–1007. [Google Scholar] [CrossRef] [Green Version]
- Flores-Márquez, L.; Márquez-Cruz, J.; Ramírez-Rojas, A.; Galvez-Coyt, G.; Angulo-Brown, F. A statistical analysis of electric self-potential time series associated to two 1993 earthquakes in Mexico. Nat. Hazards Earth Syst. Sci. 2007, 7, 549–556. [Google Scholar] [CrossRef]
- Guzman-Vargas, L.; Ramírez-Rojas, A.; Hernández-Pérez, R.; Angulo-Brown, F. Correlations and variability in electrical signals related to earthquake activity. Phys. Stat. Mech. Appl. 2009, 388, 4218–4228. [Google Scholar] [CrossRef]
- Higuchi, T. Relationship between the fractal dimension and the power law index for a time series: A numerical investigation. Physica D 1990, 46, 254–264. [Google Scholar] [CrossRef]
- Ivanov, P.C.; Amaral, L.A.N.; Goldberger, A.L.; Stanley, H.E. Stochastic feedback and the regulation of biological rhythms. Europhys. Lett. 1998, 43, 363–368. [Google Scholar] [CrossRef] [PubMed] [Green Version]
- Lighthill, M.J. A Critical Review of VAN: Earthquake Prediction from Seismic Electrical Signals; World Scientific: Singapore, 1996. [Google Scholar]
- Stein, E.M.; Weiss, G. Introduction to Fourier Analysis on Euclidean Spaces (PMS-32); Princeton University Press: Princeton, NJ, USA, 1971; Volume 32. [Google Scholar]
- Malamud, B.D.; Turcotte, D.L. Self-affine time series: I. Generation and analyses. In Advances in Geophysics; Elsevier: Amsterdam, The Netherlands, 1999; Volume 40, pp. 1–90. [Google Scholar]
- Kantelhardt, J.W.; Tismer, S.; Gans, F.; Schumann, A.Y.; Penzel, T. Scaling behavior of EEG amplitude and frequency time series across sleep stages. Europhys. Lett. 2015, 112, 18001. [Google Scholar] [CrossRef]
- Peng, C.K.; Buldyrev, S.V.; Havlin, S.; Simons, M.; Stanley, H.E.; Goldberger, A.L. Mosaic organization of DNA nucleotides. Phys. Rev. 1994, 49, 1685. [Google Scholar] [CrossRef] [Green Version]
- Peng, C.K.; Havlin, S.; Stanley, H.E.; Goldberger, A.L. Quantification of scaling exponents and crossover phenomena in nonstationary heartbeat time series. Chaos 1995, 5, 82–87. [Google Scholar] [CrossRef]
- Kantelhardt, J.W.; Koscielny-Bunde, E.; Rego, H.H.; Havlin, S.; Bunde, A. Detecting long-range correlations with detrended fluctuation analysis. Physica A 2001, 295, 441–454. [Google Scholar] [CrossRef] [Green Version]
- Guzman-Vargas, L.; Ramírez-Rojas, A.; Angulo-Brown, F. Multiscale entropy analysis of electroseismic time series. Nat. Hazards Earth Syst. Sci. 2008, 8, 855–860. [Google Scholar] [CrossRef]


© 2019 by the authors. Licensee MDPI, Basel, Switzerland. This article is an open access article distributed under the terms and conditions of the Creative Commons Attribution (CC BY) license (http://creativecommons.org/licenses/by/4.0/).
Share and Cite
Guzmán-Vargas, L.; Carrizales-Velazquez, C.; Reyes-Ramírez, I.; Fonseca-Campos, J.; Rosa-Galindo, A.d.l.; Quintana-Moreno, V.O.; Peralta, J.A.; Angulo-Brown, F. A Comparative Study of Geoelectric Signals Possibly Associated with the Occurrence of Two Ms > 7 EQs in the South Pacific Coast of Mexico. Entropy 2019, 21, 1225. https://0-doi-org.brum.beds.ac.uk/10.3390/e21121225
Guzmán-Vargas L, Carrizales-Velazquez C, Reyes-Ramírez I, Fonseca-Campos J, Rosa-Galindo Adl, Quintana-Moreno VO, Peralta JA, Angulo-Brown F. A Comparative Study of Geoelectric Signals Possibly Associated with the Occurrence of Two Ms > 7 EQs in the South Pacific Coast of Mexico. Entropy. 2019; 21(12):1225. https://0-doi-org.brum.beds.ac.uk/10.3390/e21121225
Chicago/Turabian StyleGuzmán-Vargas, Lev, Carlos Carrizales-Velazquez, Israel Reyes-Ramírez, Jorge Fonseca-Campos, Arturo de la Rosa-Galindo, Víctor O. Quintana-Moreno, José Antonio Peralta, and Fernando Angulo-Brown. 2019. "A Comparative Study of Geoelectric Signals Possibly Associated with the Occurrence of Two Ms > 7 EQs in the South Pacific Coast of Mexico" Entropy 21, no. 12: 1225. https://0-doi-org.brum.beds.ac.uk/10.3390/e21121225