Evidential Decision Tree Based on Belief Entropy

School of Computer Science and Engineering, University of Electronic Science and Technology of China, Chengdu 610054, China
*
Author to whom correspondence should be addressed.
Entropy 2019, 21(9), 897; https://0-doi-org.brum.beds.ac.uk/10.3390/e21090897
Submission received: 12 July 2019
/
Revised: 13 August 2019
/
Accepted: 13 September 2019
/
Published: 16 September 2019
Abstract
:Decision Tree is widely applied in many areas, such as classification and recognition. Traditional information entropy and Pearson’s correlation coefficient are often applied as measures of splitting rules to find the best splitting attribute. However, these methods can not handle uncertainty, since the relation between attributes and the degree of disorder of attributes can not be measured by them. Motivated by the idea of Deng Entropy, it can measure the uncertain degree of Basic Belief Assignment (BBA) in terms of uncertain problems. In this paper, Deng entropy is used as a measure of splitting rules to construct an evidential decision tree for fuzzy dataset classification. Compared to traditional combination rules used for combination of BBAs, the evidential decision tree can be applied to classification directly, which efficiently reduces the complexity of the algorithm. In addition, the experiments are conducted on iris dataset to build an evidential decision tree that achieves the goal of more accurate classification.
1. Introduction
Decision trees are one of the efficient techniques that are widely used in various areas, like machine learning, image processing, and pattern recognition. Decision trees are good due to having better comprehensibility of classification in terms of extracting from feature-based samples [1,2,3]. In addition, decision trees were not only proven efficient in many fields [4], but also have less parameters [5]. There are two main rules considered in the process of building decision trees [6]. One is the stopping criterion to determine when to stop the growth of tree and generate leaf nodes [7]. The other is how to assign class labels in leaf nodes [8]. The first rule means that the growth of the tree should be ended [9] if all samples belongs to the same class [9]. The second rule emphasizes the importance of setting a threshold [10]. There exist many methods of decision trees, such as ID3 [7], C4.5 [11,12], and CART [10].
However, all rules in the processing of decision trees are under certain situations; while the real world is filled with uncertainty [13,14,15,16]. Thus, when it deals with uncertain issues, all the rules should take uncertainty into consideration. Dempster-Shafer evidence theory (D–S) [17,18] is widely used in many applications such as decision making [19,20,21,22,23,24], evidential reasoning [25,26,27,28], information fusion [29,30], pattern recognition [31,32,33], fault diagnosis [34,35,36,37], risk evaluation [38,39,40], network analysis [41], conflicting management [42,43,44,45], uncertainty modeling [46,47,48,49,50], and so on [51,52,53,54]. In the D–S evidence theory, Basic Belief Assignment (BBA) measures the uncertainty. Deng entropy [55] is proposed to quantify the uncertain measure of BBA.
Some works combined with evidence theory and decision trees are presented [56,57,58,59,60], but, motivated by the idea of building decision tree based on Pearson correlation coefficient [61] and the proposed Deng entropy instead of information entropy [62,63,64,65,66], in this paper, the evidential decision tree is proposed for classification of fuzzy data sets using BBAs, which are applied directly for classification instead of using combination rules for classification indirectly. That is to say, the evidential decision tree is constructed for classification directly based on BBAs rather than using combination rules, which not only reduce the complexity of algorithm but also avoid designing the combination rules, which is always complicated. Moreover, the proposed evidential decision trees are much more efficient than traditional decision tree methods, illustrated by the analysis of experiments with the iris data set and wine data set.
2. Preliminaries
In this section, D–S evidence [17,18], Deng Entropy [55], and Pearson’s correlation coefficient based on the decision tree (PCC-Tree) [61] are briefly introduced. D–S evidence theory is introduced to present the definitions in terms of uncertain problems. Additionally, the Deng entropy is introduced to calculate the uncertain degree of BBAs. Finally, PPC-Tree is followed by the proposed method, replacing Pearson’s correlation coefficient with Deng entropy to build an evidential decision tree.
2.1. D–S Evidence Theory
Handling uncertainty is an open issue, and many methods have been developed [67,68,69]. In D–S evidence theory [17,18], is a frame of discernment. represents the identification of every element in the framework.
Basic Belief Assignment (BBA), a mass function, is one of the most important definitions of D–S evidence theory and many operations are presented based on it such as negation [70,71], divergence measure [72], and correlation [73]. BBA has two features: and . It should be mentioned that the BBA of an empty set in classical evidence theory is zero [74].
For the same evidence, different Basic Belief Assignments will be obtained due to different independent evidence sources. Assuming the frame of discernment is , are n different BBAs which are all independent. According to Dempster’s combination rule, the result is presented as follows:
K is normalization factor, which is defined as follows:
The reliability factor is given to construct the discounted mass function , m is one of the BBAs on the identification frame :
2.2. Deng Entropy
Inspired by Shannon Entropy, a new uncertainty method called Deng Entropy is proposed [55]:
As shown in the above definition, different from the classical Shannon entropy, the belief for each focal element A is divided by , which means the potential number of states in A. Through a simple transformation, it is found that Deng entropy is actually a type of composite measure, as follows: If the quotient rule of logarithm transformation of Deng Entropy is carried out, it is actually a comprehensive measurement:
where the first term could be explained as a measure of total nonspecificity in the mass function m, and the second term could be interpreted as the measure of discord of the mass function among distinct focal elements.
2.3. PCC-Tree
During building decision trees, the Pearson’s correlation coefficient can be used as the optimal splitting point—PCC-Tree [61].
Following the idea of building the traditional decision tree, one new type of decision tree was reconstructed by Pearson’s correlation coefficient through a top-down recursive way. The detailed constructing process can be found in Algorithm 1.
| Algorithm 1 Constructing a PCC-Tree |
|
3. Proposed Method
Evidential decision tree is introduced in this section. Motivated by the idea of building a decision tree based on Pearson’s correlation coefficient, the Deng Entropy is calculated as a measure in splitting rules processing the decision tree. The difference is that the relation between the probability distributions of attributes and the probability distribution of decision attributes can be measured by Pearson’s correlation coefficient, but BBAs can not in terms of uncertainty. Thus, the Deng Entropy is proposed in this paper, as a measure of splitting rules processing in the decision tree. In the end, the decision tree is built in the situation of uncertainty.
3.1. BBA Determination
It is an open issue to determine the BBAs of attributes. In this paper, one of them is chosen to determine the BBAs [75]. The procedures are introduced in detail as follows.
- Step 1: Normality test is carried out for each attribute column from each training set class. Consider a case where there are N samples in each class in the training set, and the attribute column (length N) are normality tested to get a Normality Index for the attribute j of class i, donated as (binary expression). If , it means the selected attribute obeys the experimental assumption. Otherwise, if , it represents that the attribute does not follow normal distribution. Transformation of the original data to an equivalent normal space will occur when condition is adopted.
- Step 2: Calculate the value of the mean and the sample standard deviation of each sample for selected class and selected attribute.is the sample value of the attribute from the sample in class i. Thus, obtain the corresponding normal distribution function:For each attribute, n normal distribution functions (or curves) can be obtained as models of different classes in the specific attribute.
- Step 3: Determine the relationship between the test sample and the normal distribution models. Choose a sample from the test set, the n intersection of the selected sample is obtained by calculating the intersection of and the n normal distribution functions .
- Step 4: For the n intersections of the selected attribute , ranks them in decreasing order, . For , its corresponding class (i.e., the class the normal distribution curve belonged to) can be denoted as . Assign to a proposition by the following rule:If , then . If is a missing value, its corresponding BBA will be assigned as , which means that the attribute is regarded as ignorance.
3.2. Deng Entropy Calculation
3.3. Evidential Decision Tree Construction
Based on the above equations, the decision tree based on Deng Entropy can be constructed in a top-down recursive way, which follows the traditional progress of decision trees. Firstly, the algorithm is proposed to find the best attribute for splitting rules shown in Algorithm 2.
| Algorithm 2 Splitting Rules based on Deng Entropy |
|
Secondly, Algorithm 3 is proposed to classify samples by maximum value and minimum value of training set and find the child nodes of decision tree. In this section, the implementation of the algorithm is illustrated by taking the case of only three classes as an example. Similar to Algorithm 3, branches only need to be added when the number of classes increases.
| Algorithm 3 Construct an Evidential Decision Tree |
|
An Illustration For Evidential Decision Tree Construction
Assuming that there is a set of training instance , is a set of evidential test attributes, and each attribute is represented by a belief function on the set of possible terms. Let D be the decision attribute and the members of it compose the frame of discernment .
In order to better illustrate the implementation of the algorithm in the process of building a decision tree based on Deng entropy, a numerical example shown in Table 1 is given to illustrate the meaning of each notations.
In this example, there are two test attributes and one decision attribute. According to proposed approach steps, the Deng entropy should be calculated under these circumstances.
In the implementation of Algorithm 2, means each attribute, represents the value of each focal element in the identification framework for the instance of attribute . In other words, is the term in Equation (10).
For the two properties of Table 1, there are some specific notation representations:
- ;
- ;
- ;
- .
By comparing the calculation result of each attribute of Deng entropy, Algorithm 2 can find the father nodes of the decision tree, and Algorithm 3 is used to find the child of the decision tree.
4. Experiment
4.1. The Application of the Proposed Method
The Iris data set contains three classes, and each classes has 50 samples. These BBAs are used to generate the evidential decision tree instead of being combined to do classification work.
First, the iris data set is used to generate the BBAs shown in Table 2. Set classes as A,B,C, etc.
Second, samples should be classified simply by maximum value and minimum value of iris dataset used in Algorithm 3, shown in Table 3. Classifications of wines are shown in Table 4.
4.2. Analysis of the Experiments
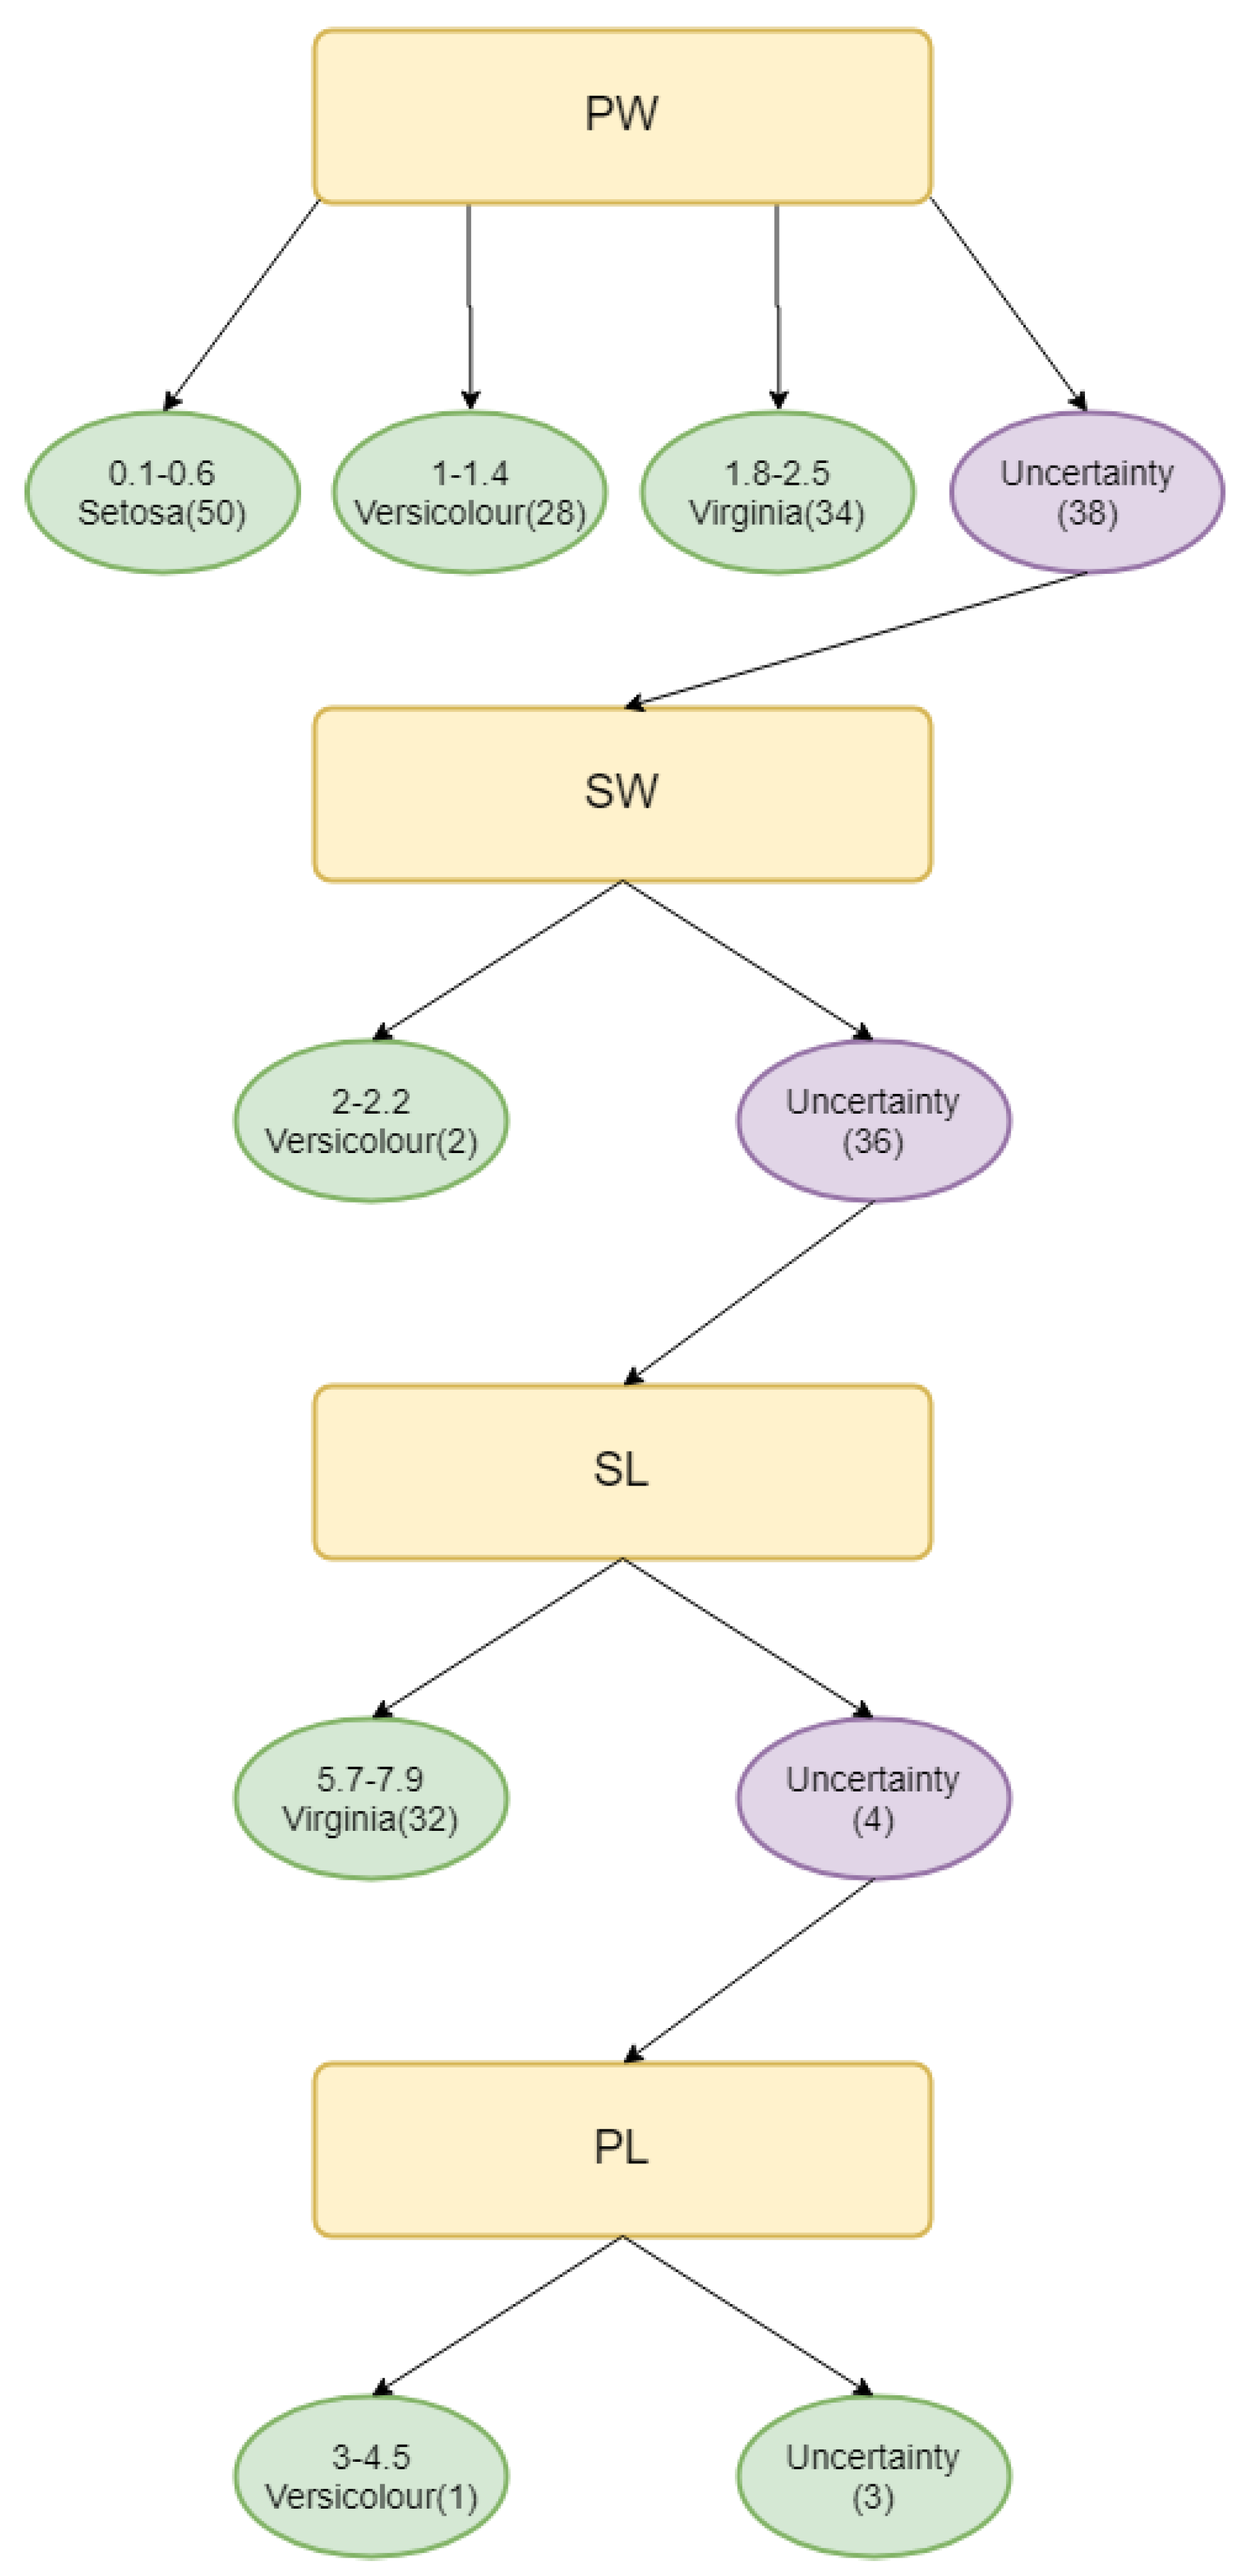
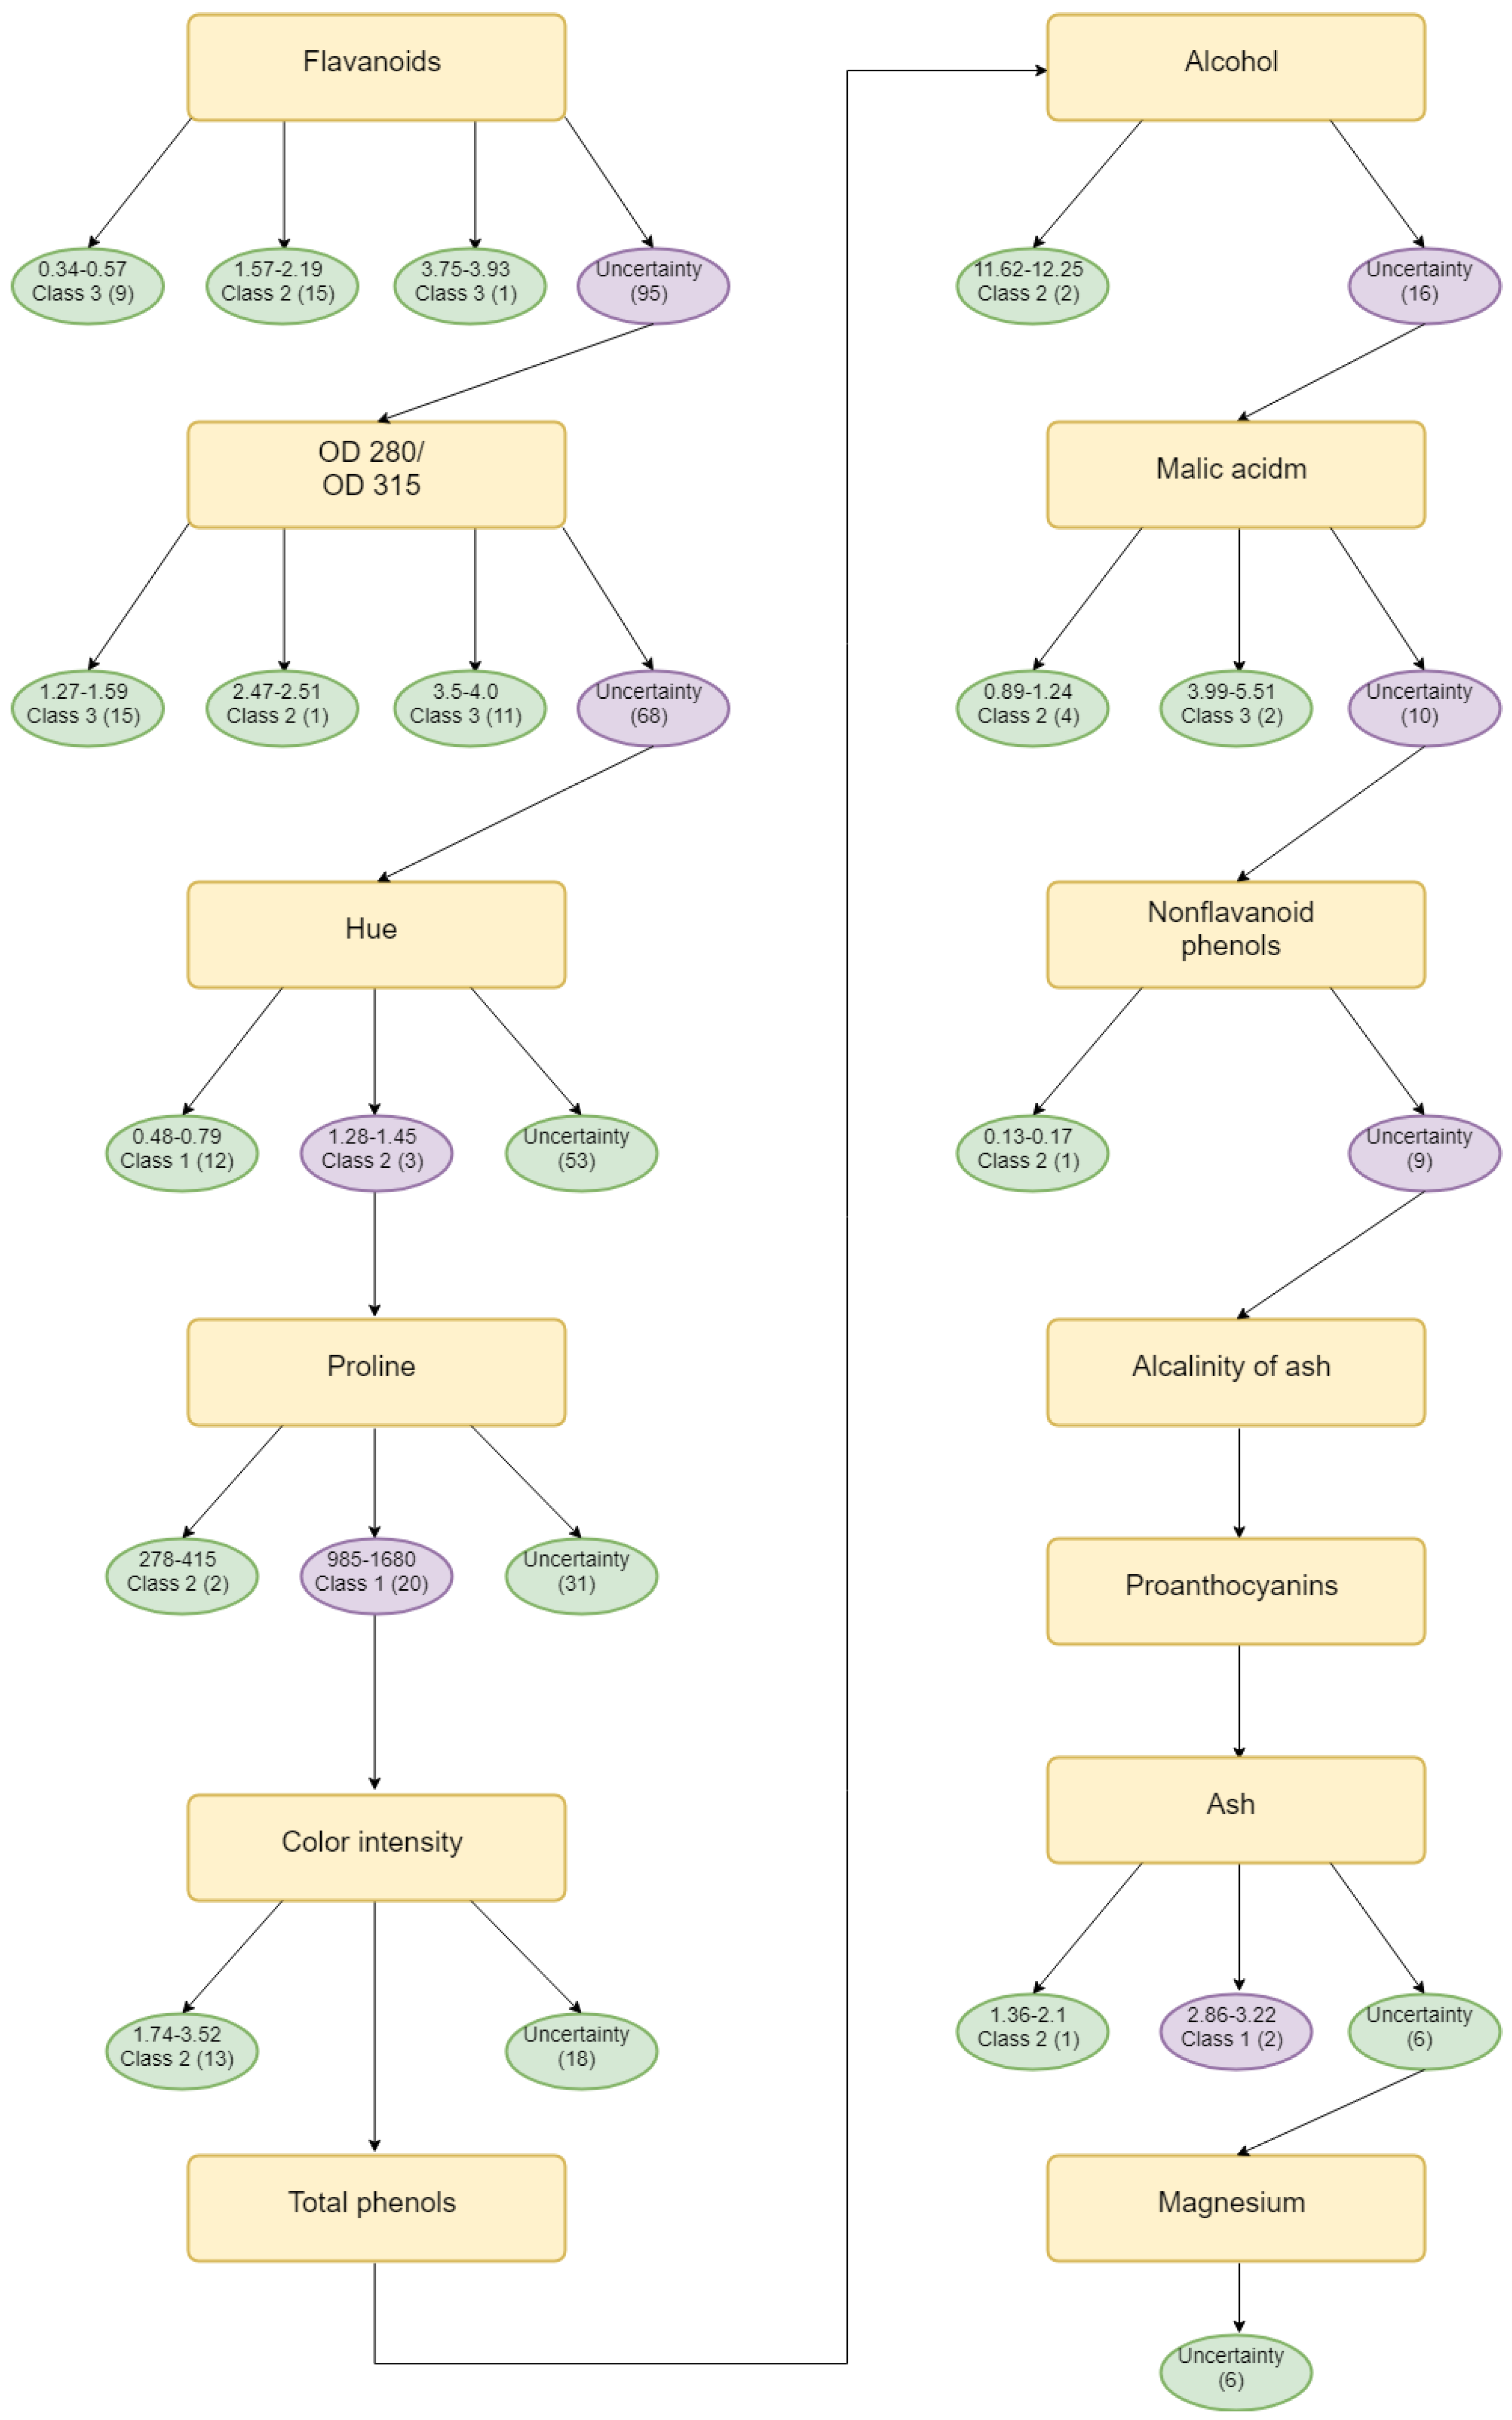
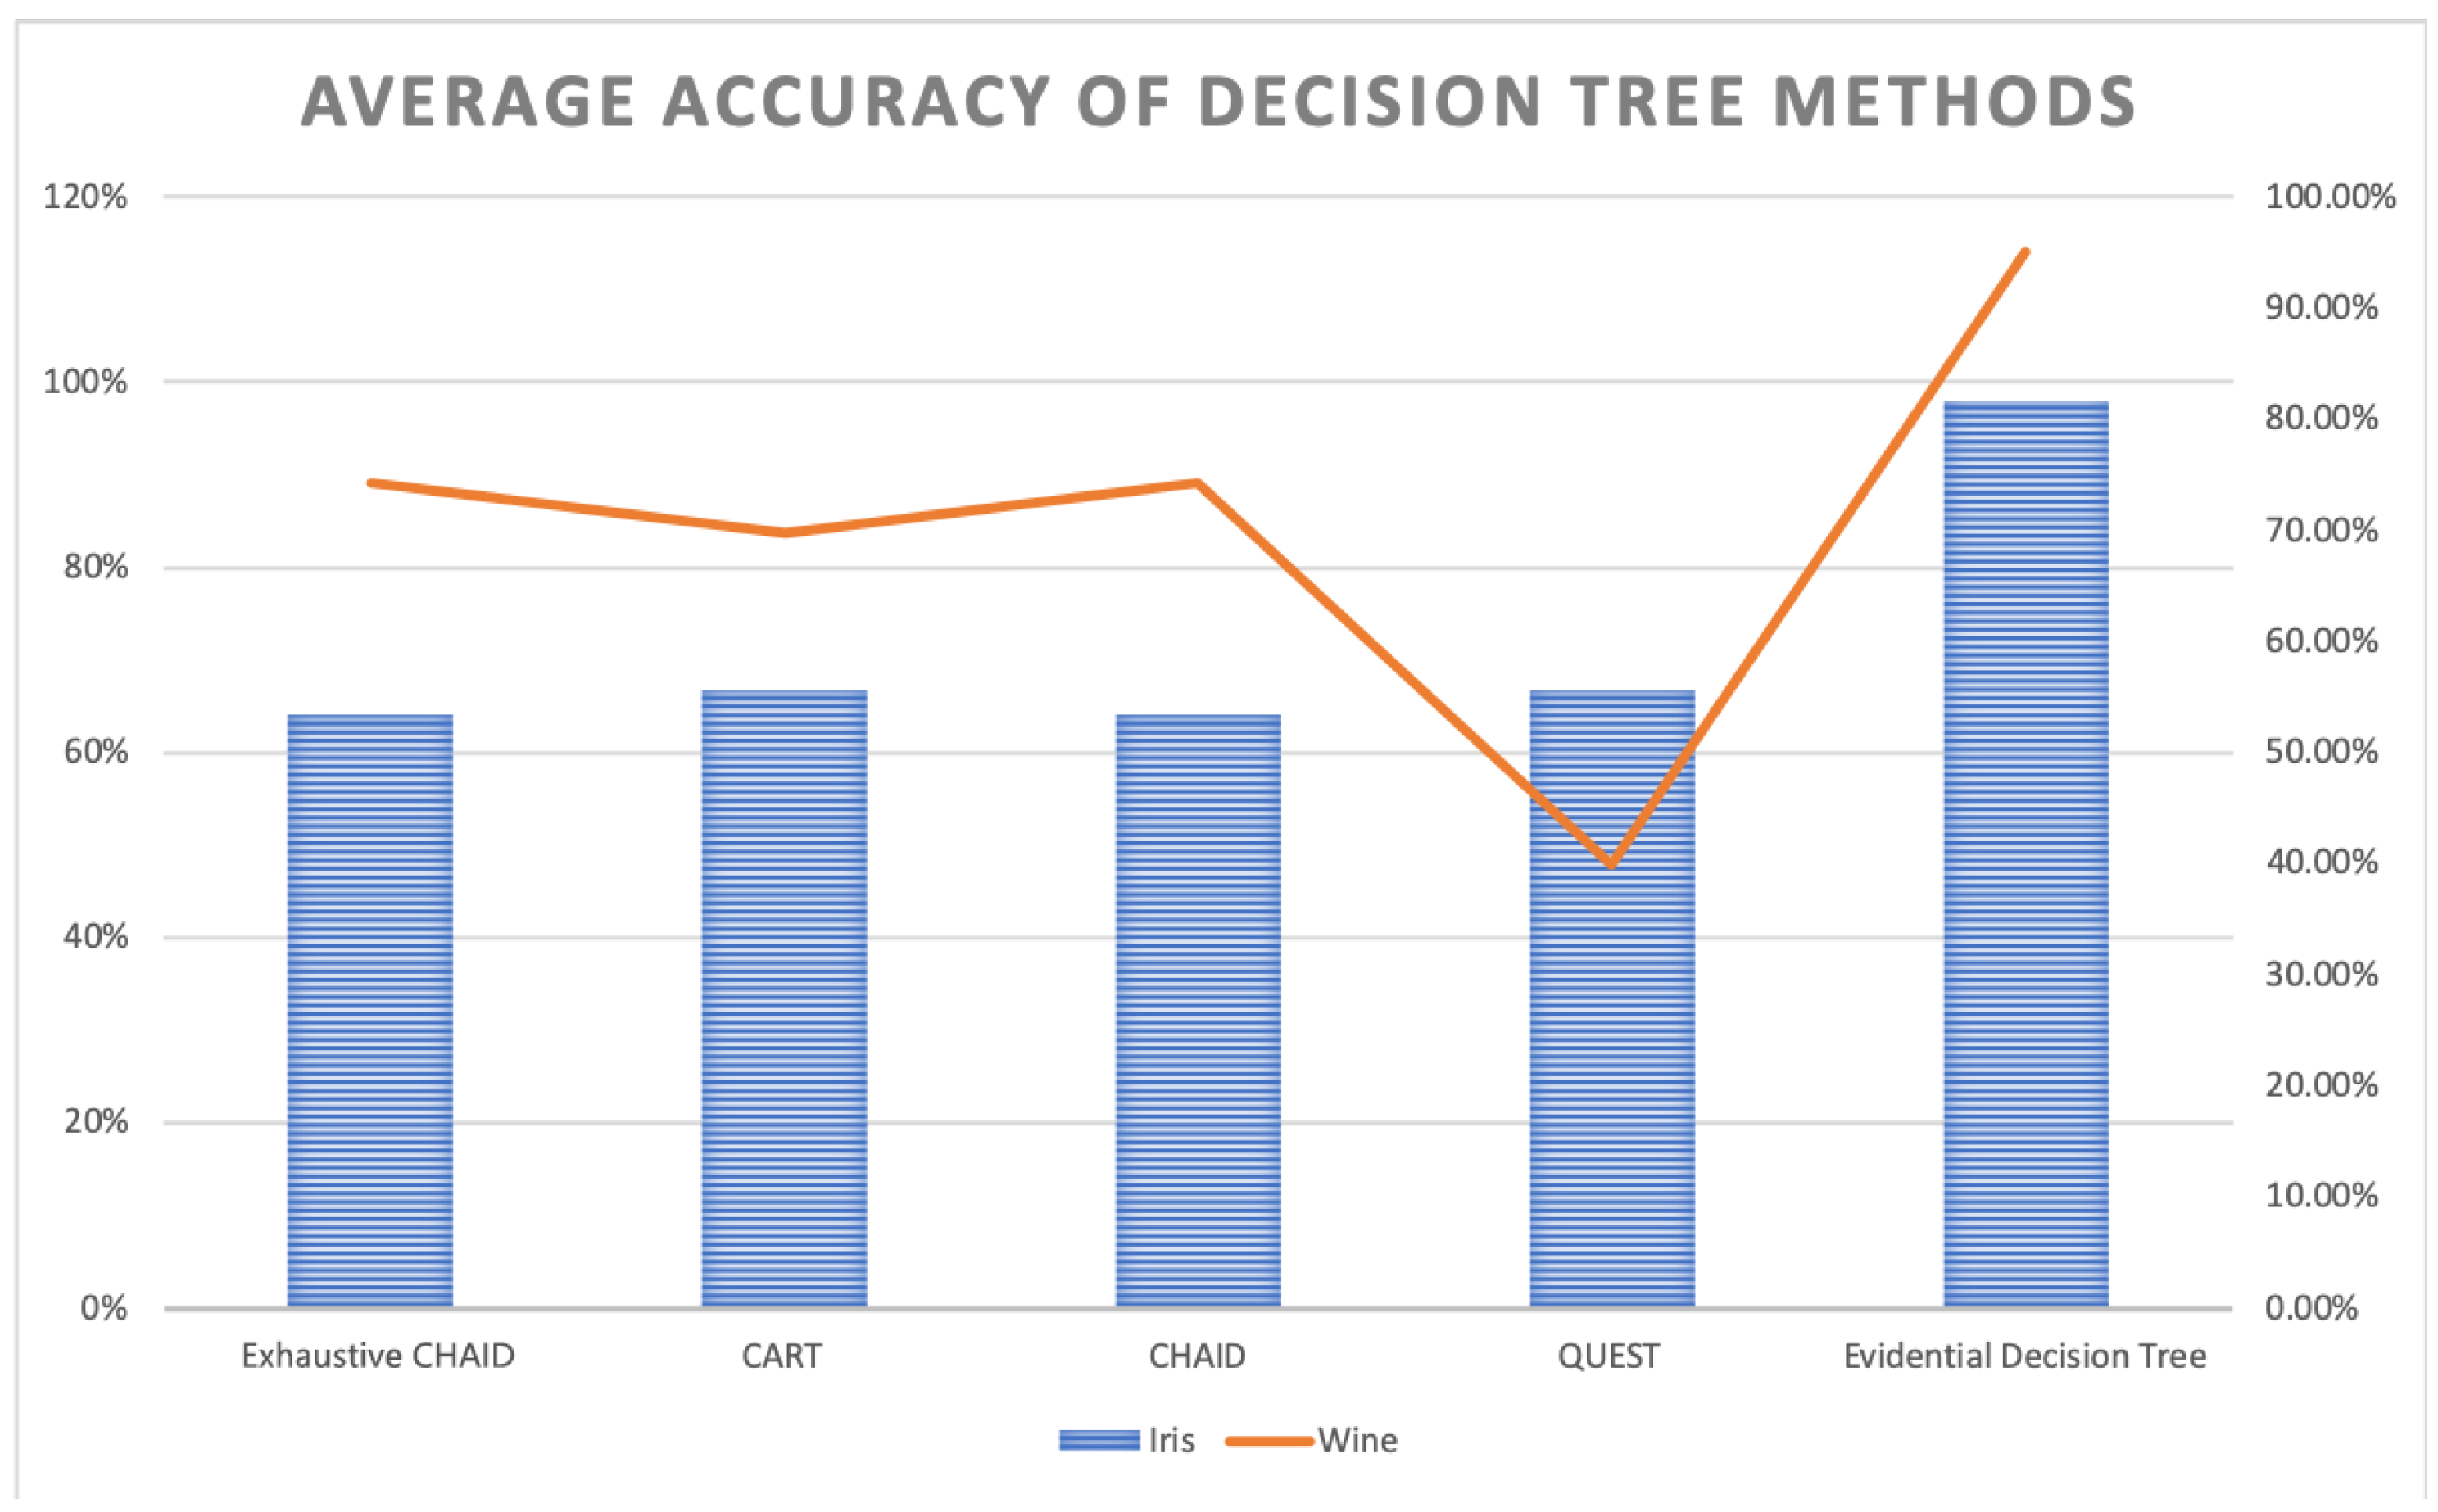
The evidential decision tree of the iris dataset is constructed, as shown in Figure 1. According to SL, SW, PL, and PW’s value of Deng entropy, the father nodes are PW, SW, PL, and SL. Then, according to the designed Algorithm 3, the child nodes are replenished to build the complete decision tree. A total of 150 samples are classified using the entropy decision. As a result, 147 samples can be absolutely classified and 3 samples cannot be classified. Almost 98% of samples are classified under the uncertain situation. In the process of building the evidential decision tree, the lowest value of Deng entropy (PW) firstly is used as the best splitting attribute, which is efficient to classify almost 3/4 of all samples into certain decision attributes. The reason is that the Deng entropy measures the uncertain degree of BBAs. The lower the Deng entropy is, the more accurate the attribute can classify samples. The wine dataset is also used to generate the evidential decision tree for classification. Moreover, there have been more experiments conducted to have a comparison. The average accuracy is 95%, which is much higher than traditional decision methods like Exhaustive CHAID, CART, CHAID, and QUEST. The same applies for wine, shown in Table 7 and Figure 3.
Compared with evidence fusion processing fuzzy data classification, in terms of time complexity of the algorithm, the evidential decision tree is almost during the process of building the decision tree, which can still complete the task of fuzzy data classification. Instead, the traditional evidence combination methods at least cause since the orthogonal-sum calculator (Equation (2)) is used in the evidence combination equation. The reason why time complexity of the algorithm increases is that the measurement of Deng entropy is directly used as the indicator of information gain before building the tree.
5. Conclusions
The existing methods have been based on Pearson’s correlation coefficient and information entropy to find the best splitting attribute in the process of building a decision tree. However, they are all impossible to handle with uncertain data classification, since Pearson’s correlation coefficient and the traditional information entropy both can only be used in the probability problem. When it comes to uncertain issues, the definition of BBA in D–S evidence theory can be seen as the probability in uncertain problems. Moreover, motivated by the idea of Deng entropy—which can measure the uncertain degree of BBAs—the evidential decision tree is proposed in this paper. The Deng entropy values of attributes’ BBAs are used as the measurement of the best splitting attribute. The lower the Deng entropy is, the more accurate the attribute can classify samples. Without using BBAs combination rules, 98% samples of iris and 95% samples of wine can be classified into certain decision attributes. In other words, the application of the evidential decision tree based on belief entropy efficiently reduces the complexity of algorithms for fuzzy data classification.
Author Contributions
M.L., H.X., and Y.D. conceived the idea of the study, performed the research, analyzed data, and wrote the manuscript.
Funding
The work is partially supported by the National Natural Science Foundation of China (Grant Nos. 61573290, 61973332).
Acknowledgments
The authors greatly appreciate the reviewers’ suggestions and the editor’s encouragement.
Conflicts of Interest
The authors declare no conflict of interest.
References
- Calistru, I.T.; Cotofrei, P.; Stoffel, K. A parallel approach for decision trees learning from big data streams. In International Conference on Business Information Systems; Springer International Publishing: Cham, Switzerland, 2015; pp. 3–15. [Google Scholar]
- Xiao, G.; Li, K.; Li, K. Reporting l most influential objects in uncertain databases based on probabilistic reverse top-k queries. Inf. Sci. 2012, 42, 181–192. [Google Scholar] [CrossRef]
- Manwani, N.; Sastry, P. Geometric decision tree. IEEE Trans. Syst. Man Cybern. Part B Cybern. 2012, 42, 181–192. [Google Scholar] [CrossRef] [PubMed]
- Lim, T.S.; Loh, W.Y.; Shih, Y.S. An empirical comparison of decision trees and other classification methods. Citeseer 1998. Available online: http://citeseerx.ist.psu.edu/viewdoc/summary?doi=10.1.1.48.6753 (accessed on 30 August 2019).
- Gehrke, J.; Ganti, V.; Ramakrishnan, R.; Loh, W.Y. BOAT—optimistic decision tree construction. ACM SIGMOD Record. 1999, 28, 169–180. [Google Scholar] [CrossRef]
- Qian, Y.; Xu, H.; Liang, J.; Liu, B.; Wang, J. Fusing monotonic decision trees. IEEE Trans. Knowl. Data Eng. 2015, 27, 2717–2728. [Google Scholar] [CrossRef]
- Quinlan, J.R. C4. 5: Programs for Machine Learning; Elsevier: Amsterdam, The Netherlands, 2014. [Google Scholar]
- Holmes, G.; Pfahringer, B.; Kirkby, R.; Frank, E.; Hall, M. Multiclass alternating decision trees. In Proceedings of the European Conference on Machine Learning, Helsinki, Finland, 19–23 August 2002; pp. 161–172. [Google Scholar]
- Yadav, C.; Wang, S.; Kumar, M. Algorithm and approaches to handle large Data-A Survey. Int. J. Comput. Sci. Netw. 2013, 2, 37–41. [Google Scholar]
- Breiman, L. Classification and Regression Trees; Routledge: London, UK, 2017. [Google Scholar]
- Quinlan, J.R. Improved use of continuous attributes in C4.5. J. Artif. Intell. Res. 1996, 4, 77–79. [Google Scholar] [CrossRef]
- Moral-García, S.; Mantas, C.J.; Castellano, J.G.; Abellán, J. Ensemble of classifier chains and Credal C4.5 for solving multi-label classification. Prog. Artif. Intell. 2019, 1–19. [Google Scholar]
- Dzitac, I.; Filip, F.G.; Manolescu, M.J. Fuzzy logic is not fuzzy: World-renowned computer scientist Lotfi A. Zadeh. Int. J. Comput. Commun. Control 2017, 12, 748–789. [Google Scholar] [CrossRef]
- Xiao, F. Hybrid Fuzzy Soft Sets Decision Making Method in Medical Diagnosis. IEEE Access 2018, 6, 25300–25312. [Google Scholar] [CrossRef]
- Meng, D.; Li, Y.; Zhu, S.; Lv, G.; Correia, J.; de Jesus, A. An Enhanced Reliability Index Method and Its Application in Reliability-Based Collaborative Design and Optimization. Math. Probl. Eng. 2019. [Google Scholar] [CrossRef]
- Fei, L.; Deng, Y. A new divergence measure for basic probability assignment and its applications in extremely uncertain environments. Int. J. Intell. Syst. 2019, 34, 584–600. [Google Scholar] [CrossRef]
- Dempster, A.P. Upper and lower probabilities induced by a multivalued mapping. In Classic Works of the Dempster–Shafer Theory of Belief Functions; Springer: Berlin/Heidelberg, Germany, 2008; pp. 57–72. [Google Scholar]
- Shafer, G. A Mathematical Theory of Evidence; Princeton University Press: Princeton, NJ, USA, 1976. [Google Scholar]
- Fei, L.; Deng, Y.; Hu, Y. DS-VIKOR: A New Multi-criteria Decision-Making Method for Supplier Selection. Int. J. Fuzzy Syst. 2019, 21, 157–175. [Google Scholar] [CrossRef]
- Trinkūnienė, E.; Podvezko, V.; Zavadskas, E.K.; Jokšienė, I.; Vinogradova, I.; Trinkūnas, V. Evaluation of quality assurance in contractor contracts by multi-attribute decision-making methods. Econ. Res-Ekonomska Istraživanja 2017, 30, 1152–1180. [Google Scholar] [CrossRef] [Green Version]
- Huynh, V.N.; Nakamori, Y.; Ho, T.B.; Murai, T. Multiple-attribute decision making under uncertainty: The evidential reasoning approach revisited. IEEE Trans. Syst. Man Cybern. Part A Syst. Hum. 2006, 36, 804–822. [Google Scholar]
- Mardani, A.; Nilashi, M.; Zavadskas, E.K.; Awang, S.R.; Zare, H.; Jamal, N.M. Decision making methods based on fuzzy aggregation operators: Three decades review from 1986 to 2017. Int. J. Inf. Technol. Decis. Mak. 2018, 17, 391–466. [Google Scholar] [CrossRef]
- Maghsoodi, A.I.; Abouhamzeh, G.; Khalilzadeh, M.; Zavadskas, E.K. Ranking and selecting the best performance appraisal method using the MULTIMOORA approach integrated Shannon’s entropy. In Frontiers of Business Research in China; Springer International Publishing: Cham, Switzerland, 2018; p. 2. [Google Scholar]
- Nakamori, Y.; Hu, C.; Kreinovich, V. On decision making under interval uncertainty: A new justification of Hurwicz optimism-pessimism approach and its use in group decision making. In Proceedings of the 39th International Symposium on Multiple-Valued Logic, Naha, Okinawa, Japan, 21–23 May 2009; pp. 214–220. [Google Scholar]
- Jaunzemis, A.D.; Holzinger, M.J.; Chan, M.W.; Shenoy, P.P. Evidence gathering for hypothesis resolution using judicial evidential reasoning. Inf. Fusion 2019, 49, 26–45. [Google Scholar] [CrossRef]
- Zhou, M.; Liu, X.; Yang, J.; Chen, Y.; Wu, J. Evidential reasoning approach with multiple kinds of attributes and entropy-based weight assignment. Knowl-Based Syst. 2019, 163, 358–375. [Google Scholar] [CrossRef]
- Zhou, M.; Liu, X.; Chen, Y.; Yang, J. Evidential reasoning rule for MADM with both weights and reliabilities in group decision making. Knowl-Based Syst. 2018, 143, 142–161. [Google Scholar] [CrossRef]
- Sun, R.; Deng, Y. A new method to identify incomplete frame of discernment in evidence theory. IEEE Access 2019, 7, 15547–15555. [Google Scholar] [CrossRef]
- Xu, H.; Deng, Y. Dependent evidence combination based on decision-making trial and evaluation laboratory method. Int. J. Intell. Syst. 2019, 34, 1555–1571. [Google Scholar] [CrossRef]
- Su, X.; Li, L.; Shi, F.; Qian, H. Research on the Fusion of Dependent Evidence Based on Mutual Information. IEEE Access 2018. [Google Scholar] [CrossRef]
- Vandoni, J.; Aldea, E.; Le Hégarat-Mascle, S. Evidential query-by-committee active learning for pedestrian detection in high-density crowds. Int. J. Approx. Reason. 2019, 104, 166–184. [Google Scholar] [CrossRef]
- Han, Y.; Deng, Y. An Evidential Fractal AHP target recognition method. Def. Sci. J. 2018, 68, 367–373. [Google Scholar] [CrossRef]
- Liu, Z.; Pan, Q.; Dezert, J.; Martin, A. Combination of classifiers with optimal weight based on evidential reasoning. Int. J. Comput. Commun. Control 2017, 14, 329–343. [Google Scholar] [CrossRef]
- Zhang, H.; Deng, Y. Engine fault diagnosis based on sensor data fusion considering information quality and evidence theory. Adv. Mech. Eng. 2018, 11. [Google Scholar] [CrossRef]
- Seiti, H. Developing pessimistic-optimistic risk-based methods for multi-sensor fusion: An interval-valued evidence theory approach. Appl. Soft Comput. 2018, 1568–4946. [Google Scholar] [CrossRef]
- Dong, Y.; Zhang, J.; Li, Z.; Hu, Y.; Deng, Y. Combination of Evidential Sensor Reports with Distance Function and Belief Entropy in Fault Diagnosis. Def. Sci. J. 2019, 14, 293–307. [Google Scholar] [CrossRef]
- Gong, Y.; Su, X.; Qian, H.; Yang, N. Research on fault diagnosis methods for the reactor coolant system of nuclear power plant based on D-S evidence theory. Ann. Nucl. Energy 2018, 122, 395–399. [Google Scholar] [CrossRef]
- Seiti, H.; Hafezalkotob, A.; Najafi, S.E.; Khalaj, M.N. A risk-based fuzzy evidential framework for FMEA analysis under uncertainty: An interval-valued DS approach. Int. J. Fuzzy Syst. 2018, 1–12. [Google Scholar] [CrossRef]
- Seiti, H.; Hafezalkotob, A.; Martínez, L. R-numbers, a new risk modeling associated with fuzzy numbers and its application to decision making. Inf. Sci. 2019, 483, 206–231. [Google Scholar] [CrossRef]
- Zhao, J.; Deng, Y. Performer selection in Human Reliability analysis: D numbers approach. Int. J. Comput. Commun. Control 2019, 14, 437–452. [Google Scholar] [CrossRef] [Green Version]
- Li, M.; Zhang, Q.; Deng, Y. Evidential identification of influential nodes in network of networks. Chaos Solitons Fractals 2019, 117, 283–296. [Google Scholar] [CrossRef]
- An, J.; Hu, M.; Fu, L.; Zhan, J. A novel fuzzy approach for combining uncertain conflict evidences in the Dempster-Shafer theory. IEEE Access 2019, 7, 7481–7501. [Google Scholar] [CrossRef]
- Huynh, V. Discounting and combination scheme in evidence theory for dealing with conflict in information fusion. In Proceedings of the International Conference on Modeling Decisions for Artificial Intelligence, Awaji Island, Japan, 30 November–2 December 2009; pp. 217–230. [Google Scholar]
- Wang, J.; Qiao, K.; Zhang, Z.; Xiang, F. A new conflict management method in Dempster–Shafer theory. Int. J. Distrib. Sens. Netw. 2017, 13, 1550147717696506. [Google Scholar] [CrossRef]
- Wang, Y.; Zhang, K.; Deng, Y. Base belief function: an efficient method of conflict management. J. Ambient. Intell. Humaniz. Comput. 2018. [Google Scholar] [CrossRef]
- Xiao, F. A novel multi-criteria decision making method for assessing health-care waste treatment technologies based on D numbers. Eng. Appl. Artif. Intell. 2018, 71, 216–225. [Google Scholar] [CrossRef]
- Deng, X.; Jiang, W.; Zhen, W. Zero-sum polymatrix games with link uncertainty: A Dempster-Shafer theory solution. Appl. Math. Comput. 2019, 340, 101–112. [Google Scholar] [CrossRef]
- Li, Y.; Deng, Y. TDBF: Two Dimension Belief Function. Int. J. Intell. Syst. 2019, 34, 1968–1982. [Google Scholar] [CrossRef]
- Kang, B.; Zhang, P.; Gao, Z.; Chhipi-Shrestha, G.; Hewage, K.; Sadiq, R. Environmental assessment under uncertainty using Dempster–Shafer theory and Z-numbers. J. Ambient. Intell. Humaniz. Comput. 2019. [Google Scholar] [CrossRef]
- Han, Y.; Deng, Y. A hybrid intelligent model for Assessment of critical success factors in high risk emergency system. J. Ambient. Intell. Humaniz. Comput. 2018, 9, 1933–1953. [Google Scholar] [CrossRef]
- Cuzzolin, F. A geometric approach to the theory of evidence. IEEE Trans. Syst. Man Cybern. Part C Appl. Rev. 2008, 38, 522–534. [Google Scholar] [CrossRef]
- Moral-García, S.; Castellano, J.G.; Mantas, C.J.; Montella, A.; Abellán, J. Decision Tree Ensemble Method for Analyzing Traffic Accidents of Novice Drivers in Urban Areas. Entropy 2019, 21, 360. [Google Scholar] [CrossRef]
- Yager, R.R. Interval valued entropies for Dempster–Shafer structures. Knowl-Based Syst. 2018, 161, 390–397. [Google Scholar] [CrossRef]
- Han, Y.; Deng, Y. A novel matrix game with payoffs of Maxitive Belief Structure. Int. J. Intell. Syst. 2019, 34, 690–706. [Google Scholar] [CrossRef]
- Deng, Y. Deng entropy. Chaos Solitons Fractals 2016, 91, 549–553. [Google Scholar] [CrossRef]
- Fan, X.; Han, D.; Yang, Y.; Ai, W. Comparative Study of Decision Tree with Different Evidential Uncertainty Measures. In Proceedings of the 2018 Chinese Automation Congress (CAC), Xi’an, China, 30 November–2 December 2018; pp. 3104–3108. [Google Scholar]
- Trabelsi, A.; Elouedi, Z.; Lefevre, E. Handling uncertain attribute values in decision tree classifier using the belief function theory. In Proceedings of the International Conference on Artificial Intelligence: Methodology, Systems, and Applications, Varna, Bulgaria, 7–10 September 2016; pp. 26–35. [Google Scholar]
- Boukhris, I.; Elouedi, Z.; Ajabi, M. Toward intrusion detection using belief decision trees for big data. Knowl. Inf. Syst. 2017, 53, 671–698. [Google Scholar] [CrossRef]
- Sutton-Charani, N.; Destercke, S.; Denoeux, T. Learning decision trees from uncertain data with an evidential EM approach. In Proceedings of the 12th International Conference on Machine Learning and Applications, Miami, FL, USA, 4–7 December 2013; Volume 1, pp. 111–116. [Google Scholar]
- Smarandache, F.; Han, D.; Martin, A. Comparative study of contradiction measures in the theory of belief functions. In Proceedings of the 15th International Conference on Information Fusion, Singapore, 9–12 July 2012; pp. 271–277. [Google Scholar]
- Mu, Y.; Liu, X.; Wang, L. A Pearson’s correlation coefficient based decision tree and its parallel implementation. Inf. Sci. 2018, 435, 40–58. [Google Scholar] [CrossRef]
- Umanol, M.; Okamoto, H.; Hatono, I.; Tamura, H.; Kawachi, F.; Umedzu, S.; Kinoshita, J. Fuzzy decision trees by fuzzy ID3 algorithm and its application to diagnosis systems. In Proceedings of the 1994 IEEE 3rd International Fuzzy Systems Conference, Orlando, FL, USA, 26–29 June 1994; pp. 2113–2118. [Google Scholar]
- Yuan, Y.; Shaw, M.J. Induction of fuzzy decision trees. Fuzzy Sets Syst. 1995, 69, 125–139. [Google Scholar] [CrossRef]
- Xue, J.; Wu, C.; Chen, Z.; Van Gelder, P.; Yan, X. Modeling human-like decision-making for inbound smart ships based on fuzzy decision trees. Expert Syst. Appl. 2019, 155, 172–188. [Google Scholar] [CrossRef]
- Zhai, J.; Wang, X.; Zhang, S.; Hou, S. Tolerance rough fuzzy decision tree. Inf. Sci. 2018, 465, 425–438. [Google Scholar] [CrossRef]
- Sardari, S.; Eftekhari, M.; Afsari, F. Hesitant fuzzy decision tree approach for highly imbalanced data classification. Appl. Soft Comput. 2017, 61, 727–741. [Google Scholar] [CrossRef]
- Abellan, J.; Bosse, E. Drawbacks of Uncertainty Measures Based on the Pignistic Transformation. IEEE Trans. Syst. Man Cybern.-Syst. 2018, 48, 382–388. [Google Scholar] [CrossRef]
- Meng, D.; Yang, S.; Zhang, Y.; Zhu, S. Structural reliability analysis and uncertainties-based collaborative design and optimization of turbine blades using surrogate model. Fatigue Fract. Eng. Mater. Struct. 2018, 1–9. [Google Scholar] [CrossRef]
- Meng, D.; Liu, M.; Yang, S.; Zhang, H.; Ding, R. A fluid–structure analysis approach and its application in the uncertainty-based multidisciplinary design and optimization for blades. Adv. Mech. Eng. 2018, 10, 1687814018783410. [Google Scholar] [CrossRef]
- Gao, X.; Deng, Y. The generalization negation of probability distribution and its application in target recognition based on sensor fusion. Int. J. Distrib. Sens. Netw. 2019, 15. [Google Scholar] [CrossRef]
- Gao, X.; Deng, Y. The negation of basic probability assignment. Int. J. Distrib. Sens. Netw. 2019, 7. [Google Scholar] [CrossRef]
- Song, Y.; Deng, Y. A new method to measure the divergence in evidential sensor data fusion. Int. J. Distrib. Sens. Netw. 2019, 15. [Google Scholar] [CrossRef]
- Jiang, W. A correlation coefficient for belief functionsn. Int. J. Approx. Reason. 2018, 103, 94–106. [Google Scholar] [CrossRef]
- Sun, R.; Deng, Y. A new method to determine generalized basic probability assignment in the open world. IEEE Access 2019, 7, 52827–52835. [Google Scholar] [CrossRef]
- Xu, P.; Deng, Y.; Su, X.; Mahadevan, S. A new method to determine basic probability assignment from training data. Knowl-Based Syst. 2013, 46, 69–80. [Google Scholar] [CrossRef]
Figure 1.
Evidential decision tree for Iris.

Figure 2.
Evidential decision tree for Wine.

Figure 3.
Average Accuracy of Decision Tree Methods.


Table 1.
Two Basic Belief Assignments (BBAs) of numerical examples.
| 0.8 | 0.2 | 0 | 0.3 | 0.3 | 0.4 | ||
| 0 | 0.5 | 0.5 | 0.2 | 0.3 | 0.5 | ||
| 0.8 | 0 | 0.2 | 0.4 | 0 | 0.6 | ||
| 0.15 | 0.15 | 0.7 | 0 | 0.8 | 0.2 | ||
| 0.2 | 0.3 | 0.5 | 0.8 | 0 | 0.2 | ||
| ⋯ | ⋯ | ⋯ | ⋯ | ⋯ | ⋯ | ⋯ | ⋯ |
Table 2.
BBAs of Iris Dataset.
| m(B) | m(B,C) | m(A,B,C) | |
|---|---|---|---|
| 1 | 0.6601 | 0.3246 | 0.0153 |
| 2 | 0.6772 | 0.3096 | 0.0132 |
| 3 | 0.6341 | 0.3659 | 0 |
| 4 | 0.5823 | 0.4177 | 0 |
| 5 | 0.5407 | 0.4586 | 0 |
| 6 | 0.5564 | 0.4436 | 0 |
| 7 | 0.8978 | 0.1022 | 0 |
| ⋯ | ⋯ | ⋯ | ⋯ |
Table 3.
Samples Preclassification for Iris.
| SL | SW | PL | PW | |
|---|---|---|---|---|
| Setosa | 4.3–5.8 | 2.3–4.4 | 1–1.9 | 0.1–0.6 |
| Versicolour | 4.9–5.7 | 2–3.4 | 3–5.1 | 1–1.8 |
| Virginica | 4.9–7.9 | 2.2–3.8 | 4.5–6.9 | 1.4–2.5 |
Table 4.
Samples Preclassification for Wine.
| Alcohol | Malic acidm | Ash | Alcalinity of ash | Magnesium | |
| Class 1 | 14.34–14.83 | 2.86–3.22 | |||
| Class 2 | 11.62–12.25 | 0.89–1.24 | 1.36–2.1 | 10.6–11.2/27–30 | 7.0–8.0/132–162 |
| Class 3 | 3.99–5.51 | ||||
| Total phenols | Flavanoids | Nonflavanoid phenols | Proanthocyanins | Color intensity | |
| Class 1 | 3.52–3.85 | ||||
| Class 2 | 0.34–0.57/3.75–3.93 | 0.13–0.17 | 0.41–0.55/2.96–3.28 | 1.74–3.52 | |
| Class 3 | 0.98–1.1 | 1.57–2.19 | 8.7–13.0 | ||
| Hue | OD280/OD315 | Proline | |||
| Class 1 | 0.48–0.79 | 985–1680 | |||
| Class 2 | 1.28–1.45 | 2.47–2.51 | 278–415 | ||
| Class 3 | 1.27–1.59/3.5–4.0 |
Table 5.
Deng Entropy for each attribute of Iris.
| SL | SW | PL | PW | |
|---|---|---|---|---|
| Deng Entropy | 0.9600 | 0.8828 | 0.9865 | 0.8157 |
Table 6.
Deng Entropy for each attribute of Wine.
| Alcohol | Malic acidm | Ash | Alcalinity of ash | Magnesium | |
| Deng_Entropy | 196.8 | 216.2 | 297.05 | 268.91 | 301.28 |
| Total phenols | Flavanoids | Nonflavanoid phenols | Proanthocyanins | Color intensity | |
| Deng_Entropy | 193.08 | 115.13 | 263.15 | 269.62 | 188.89 |
| Hue | OD280/OD315 | Proline | |||
| Deng_Entropy | 155.22 | 148.52 | 169.15 |
Table 7.
Comparison between traditional decision tree and evidential decision tree.
| Average Accuracy | Iris | Wine |
|---|---|---|
| Exhaustive CHAID | 64% | 74.20% |
| CART | 66.70% | 69.70% |
| CHAID | 64% | 74.20% |
| QUEST | 66.70% | 39.90% |
| Evidential Decision Tree | 98% | 95% |
© 2019 by the authors. Licensee MDPI, Basel, Switzerland. This article is an open access article distributed under the terms and conditions of the Creative Commons Attribution (CC BY) license (http://creativecommons.org/licenses/by/4.0/).
Share and Cite
MDPI and ACS Style
Li, M.; Xu, H.; Deng, Y. Evidential Decision Tree Based on Belief Entropy. Entropy 2019, 21, 897. https://0-doi-org.brum.beds.ac.uk/10.3390/e21090897
AMA Style
Li M, Xu H, Deng Y. Evidential Decision Tree Based on Belief Entropy. Entropy. 2019; 21(9):897. https://0-doi-org.brum.beds.ac.uk/10.3390/e21090897
Chicago/Turabian StyleLi, Mujin, Honghui Xu, and Yong Deng. 2019. "Evidential Decision Tree Based on Belief Entropy" Entropy 21, no. 9: 897. https://0-doi-org.brum.beds.ac.uk/10.3390/e21090897
Note that from the first issue of 2016, this journal uses article numbers instead of page numbers. See further details here.