Electro-Osmotic Behavior of Polymeric Cation-Exchange Membranes in Ethanol-Water Solutions

 ,
,  ,
,
Abstract
:1. Introduction
2. Model Equations
3. Experimental
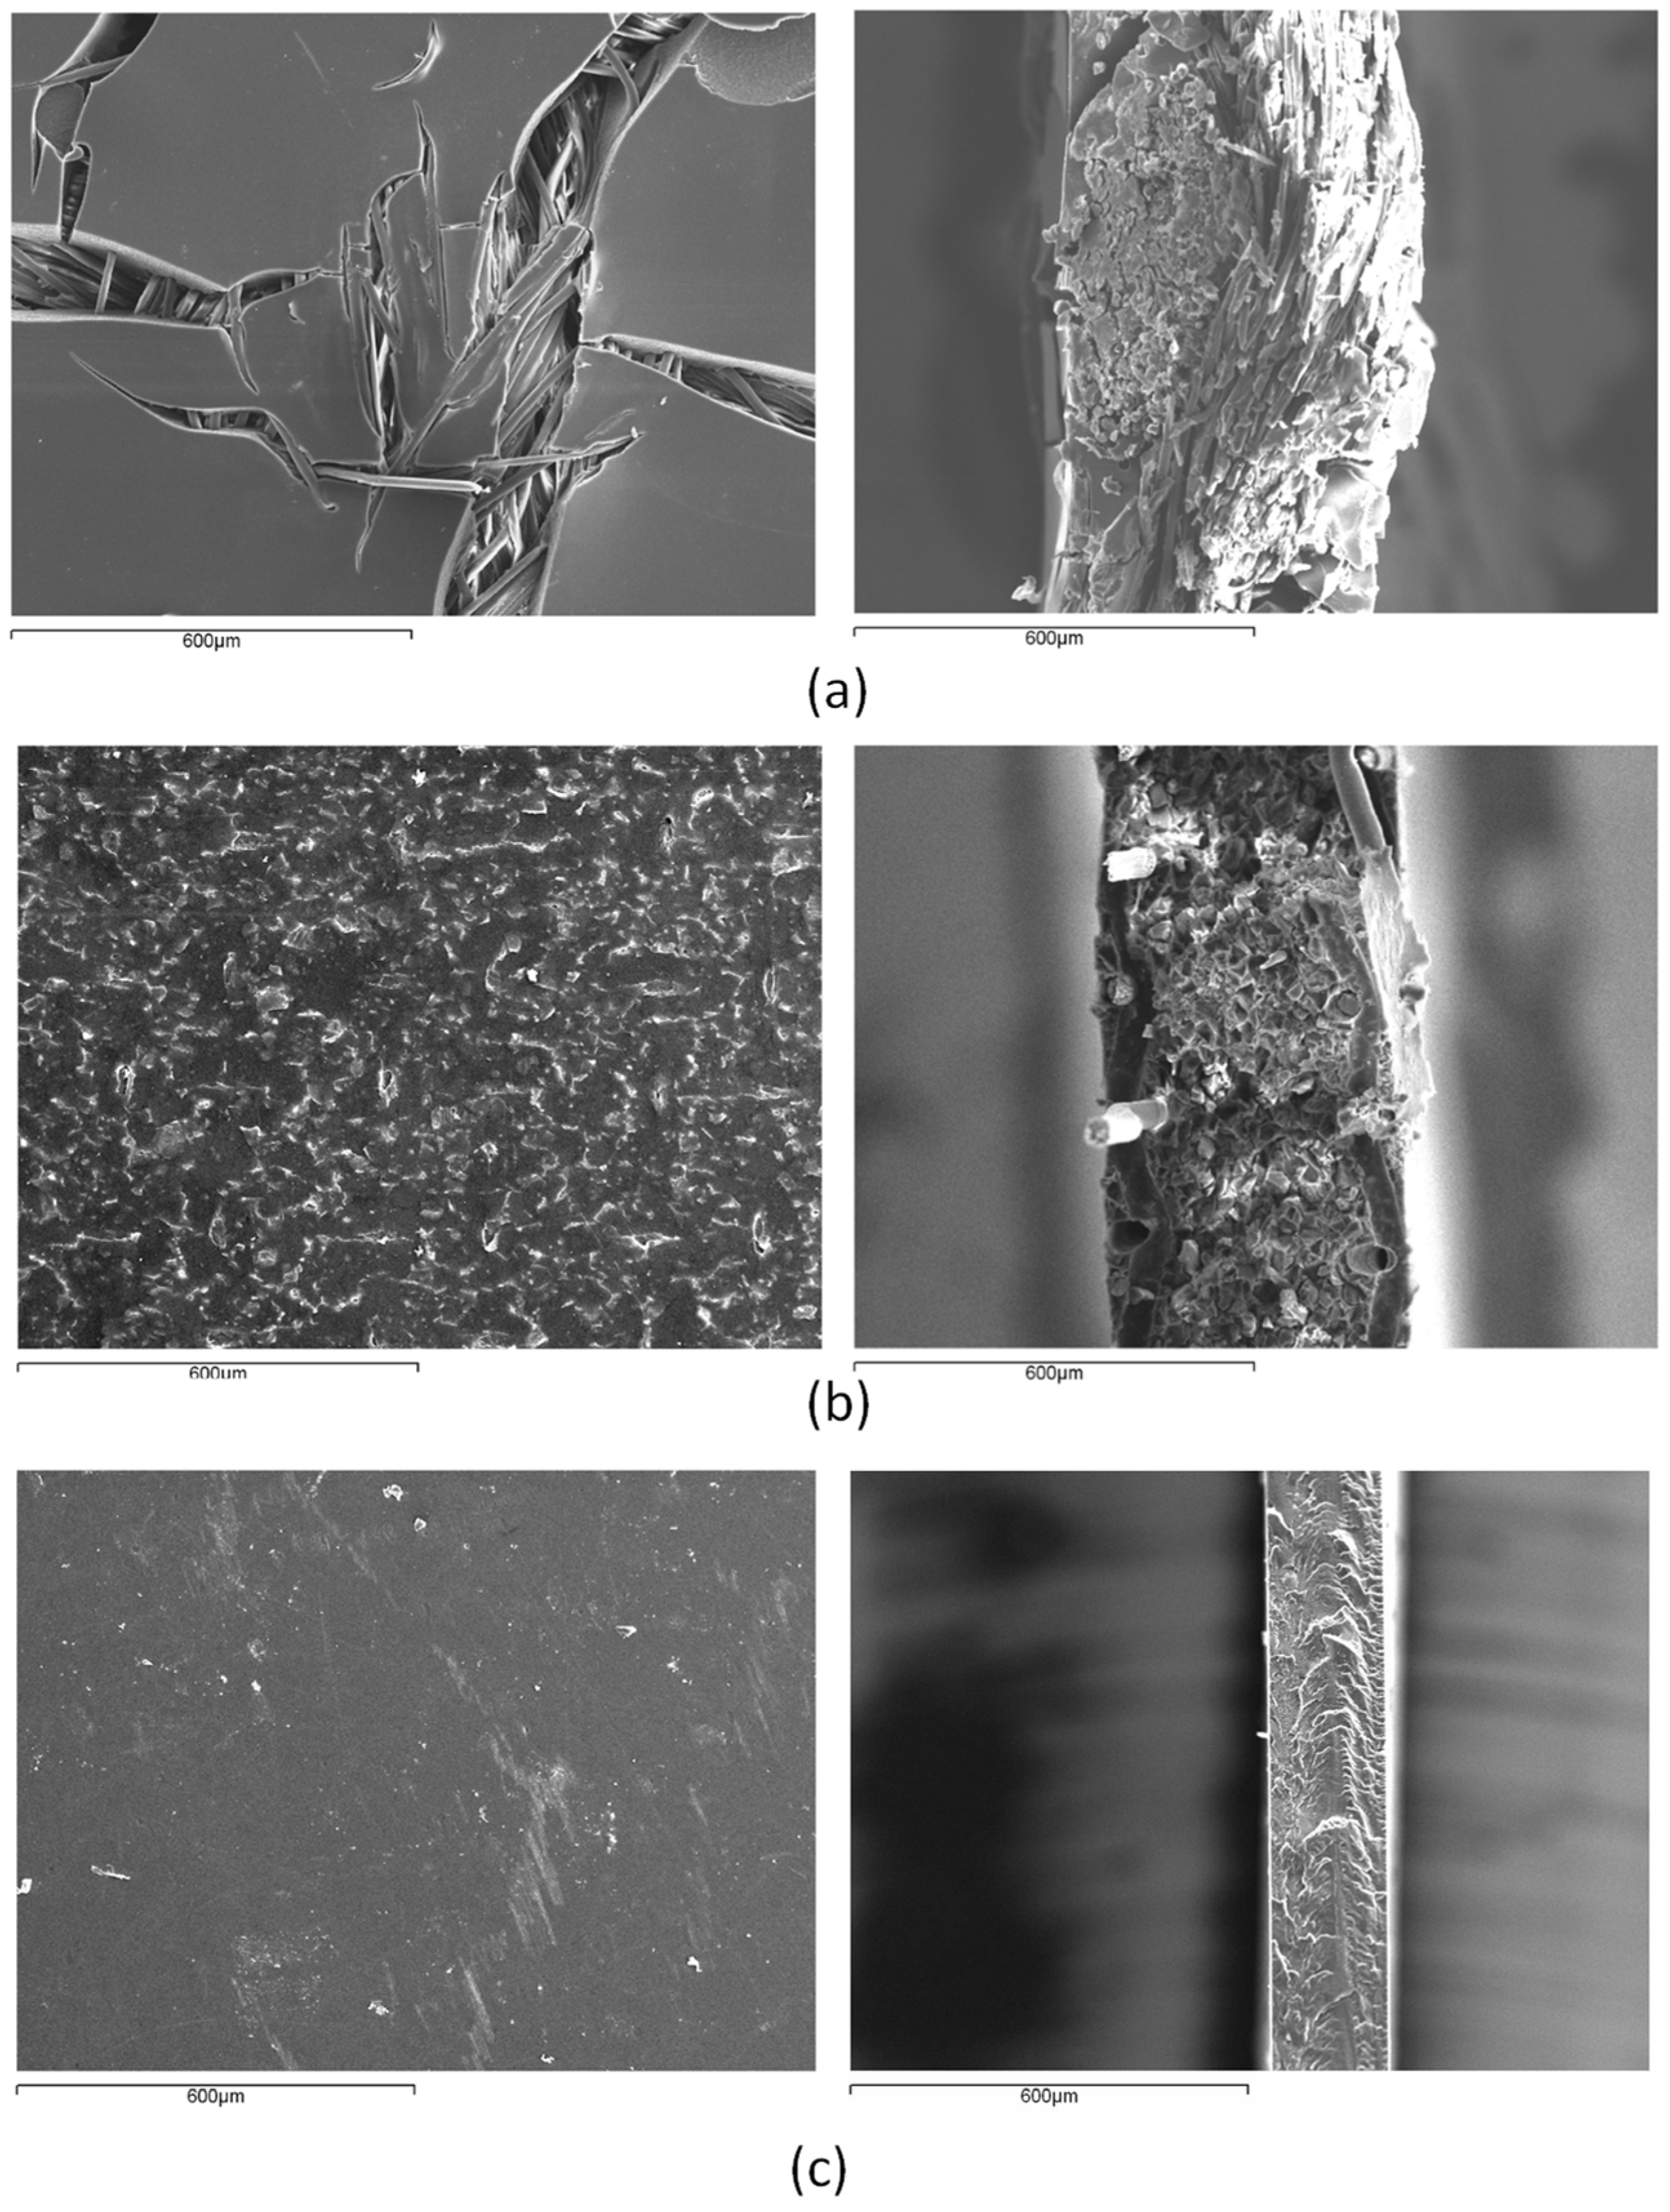
3.1. Membranes and Materials
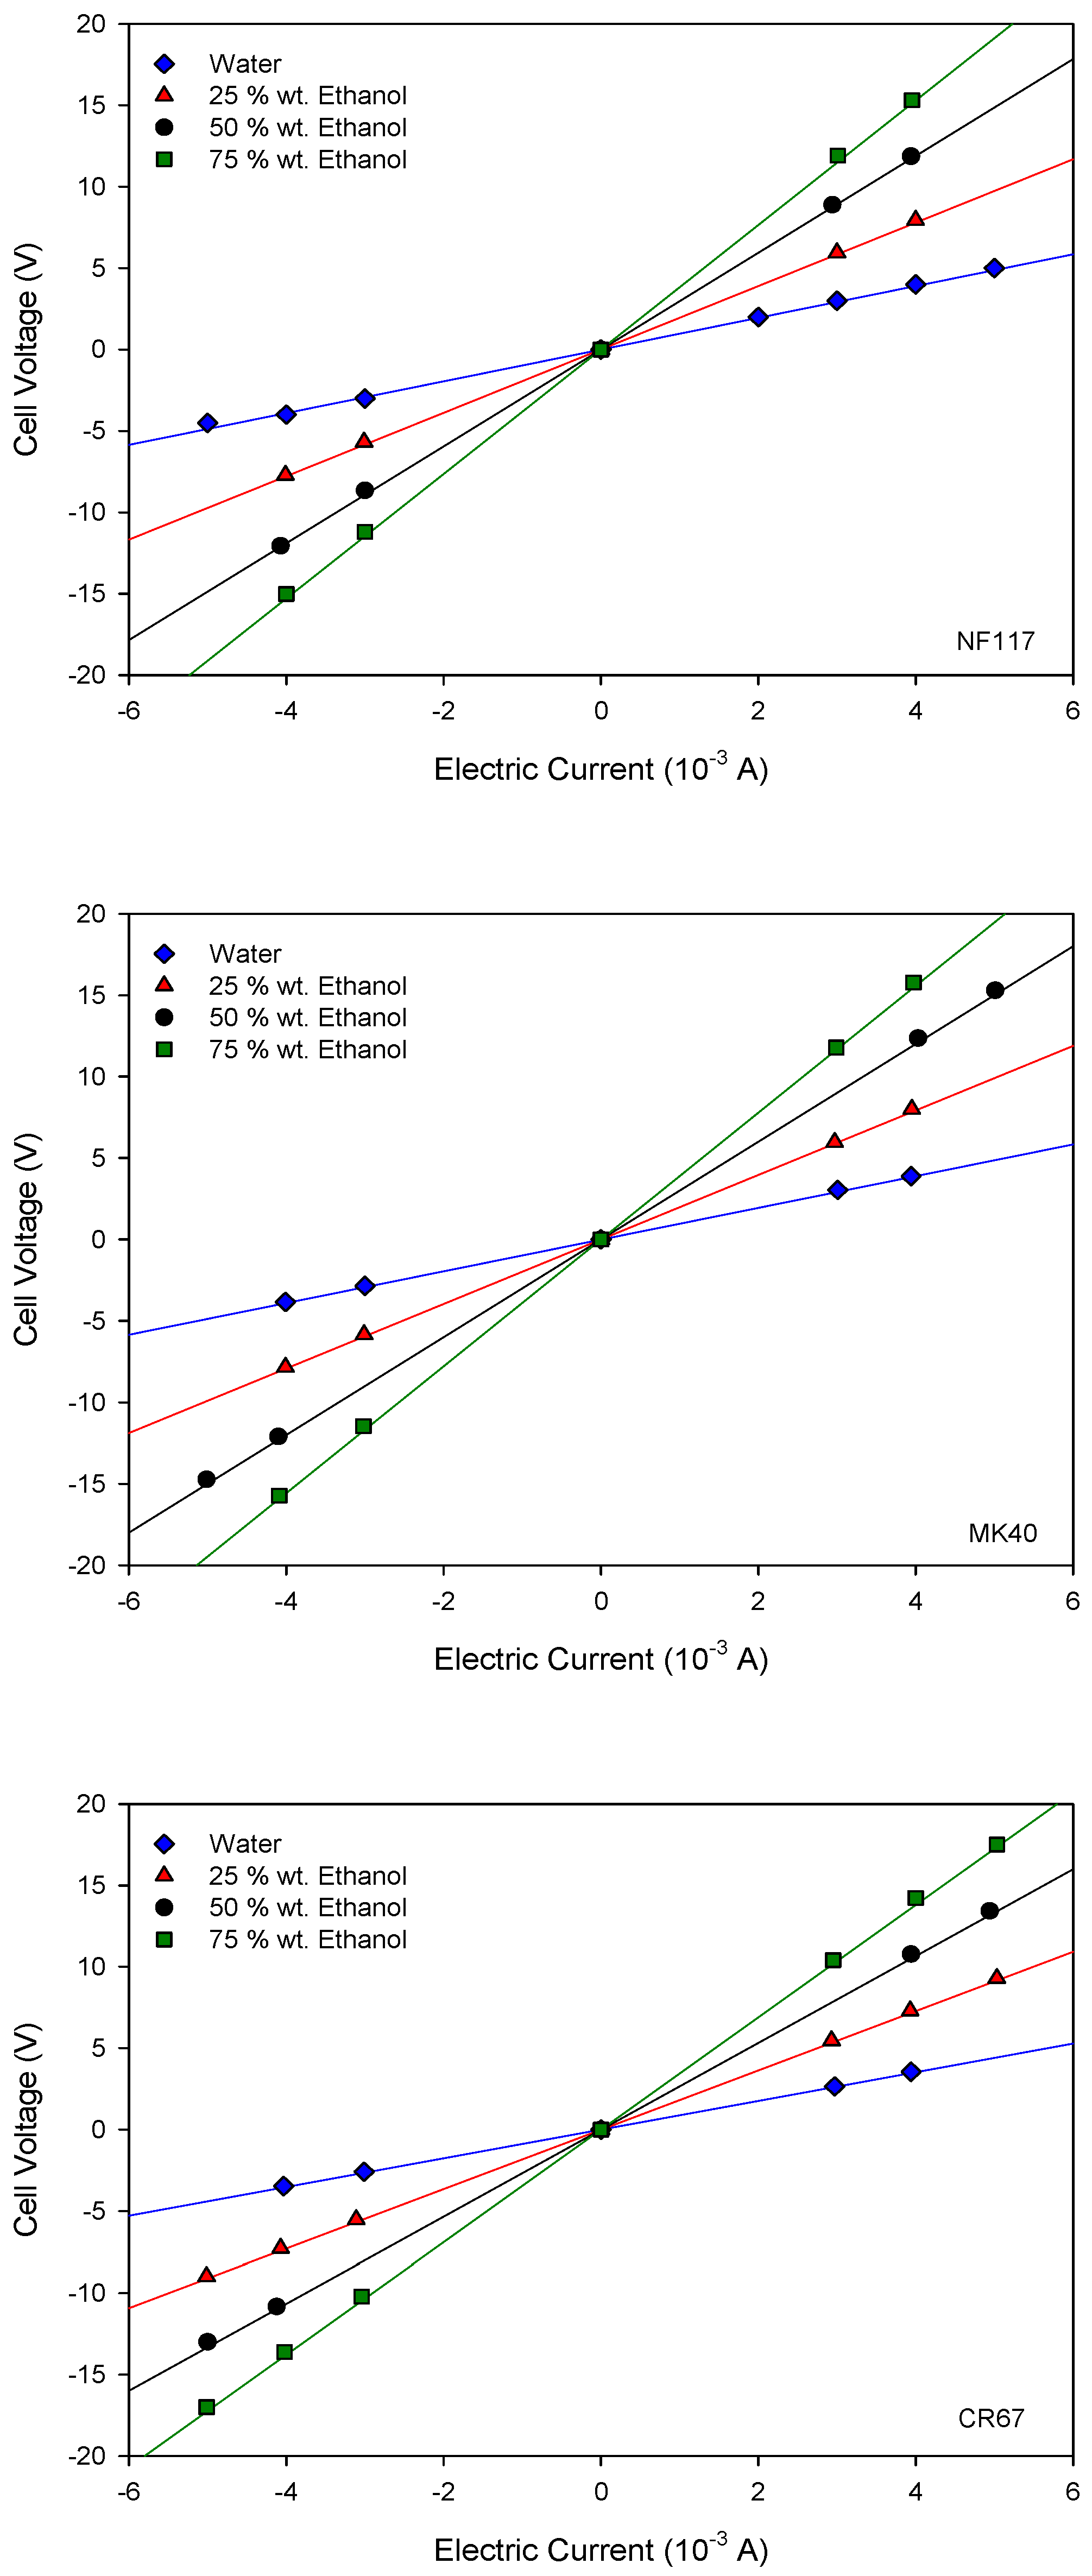
3.2. Measurement of the Electro-Osmotic Flow and Current-Voltage Curves
4. Results and Discussion
4.1. Liquid Uptake of the Membranes
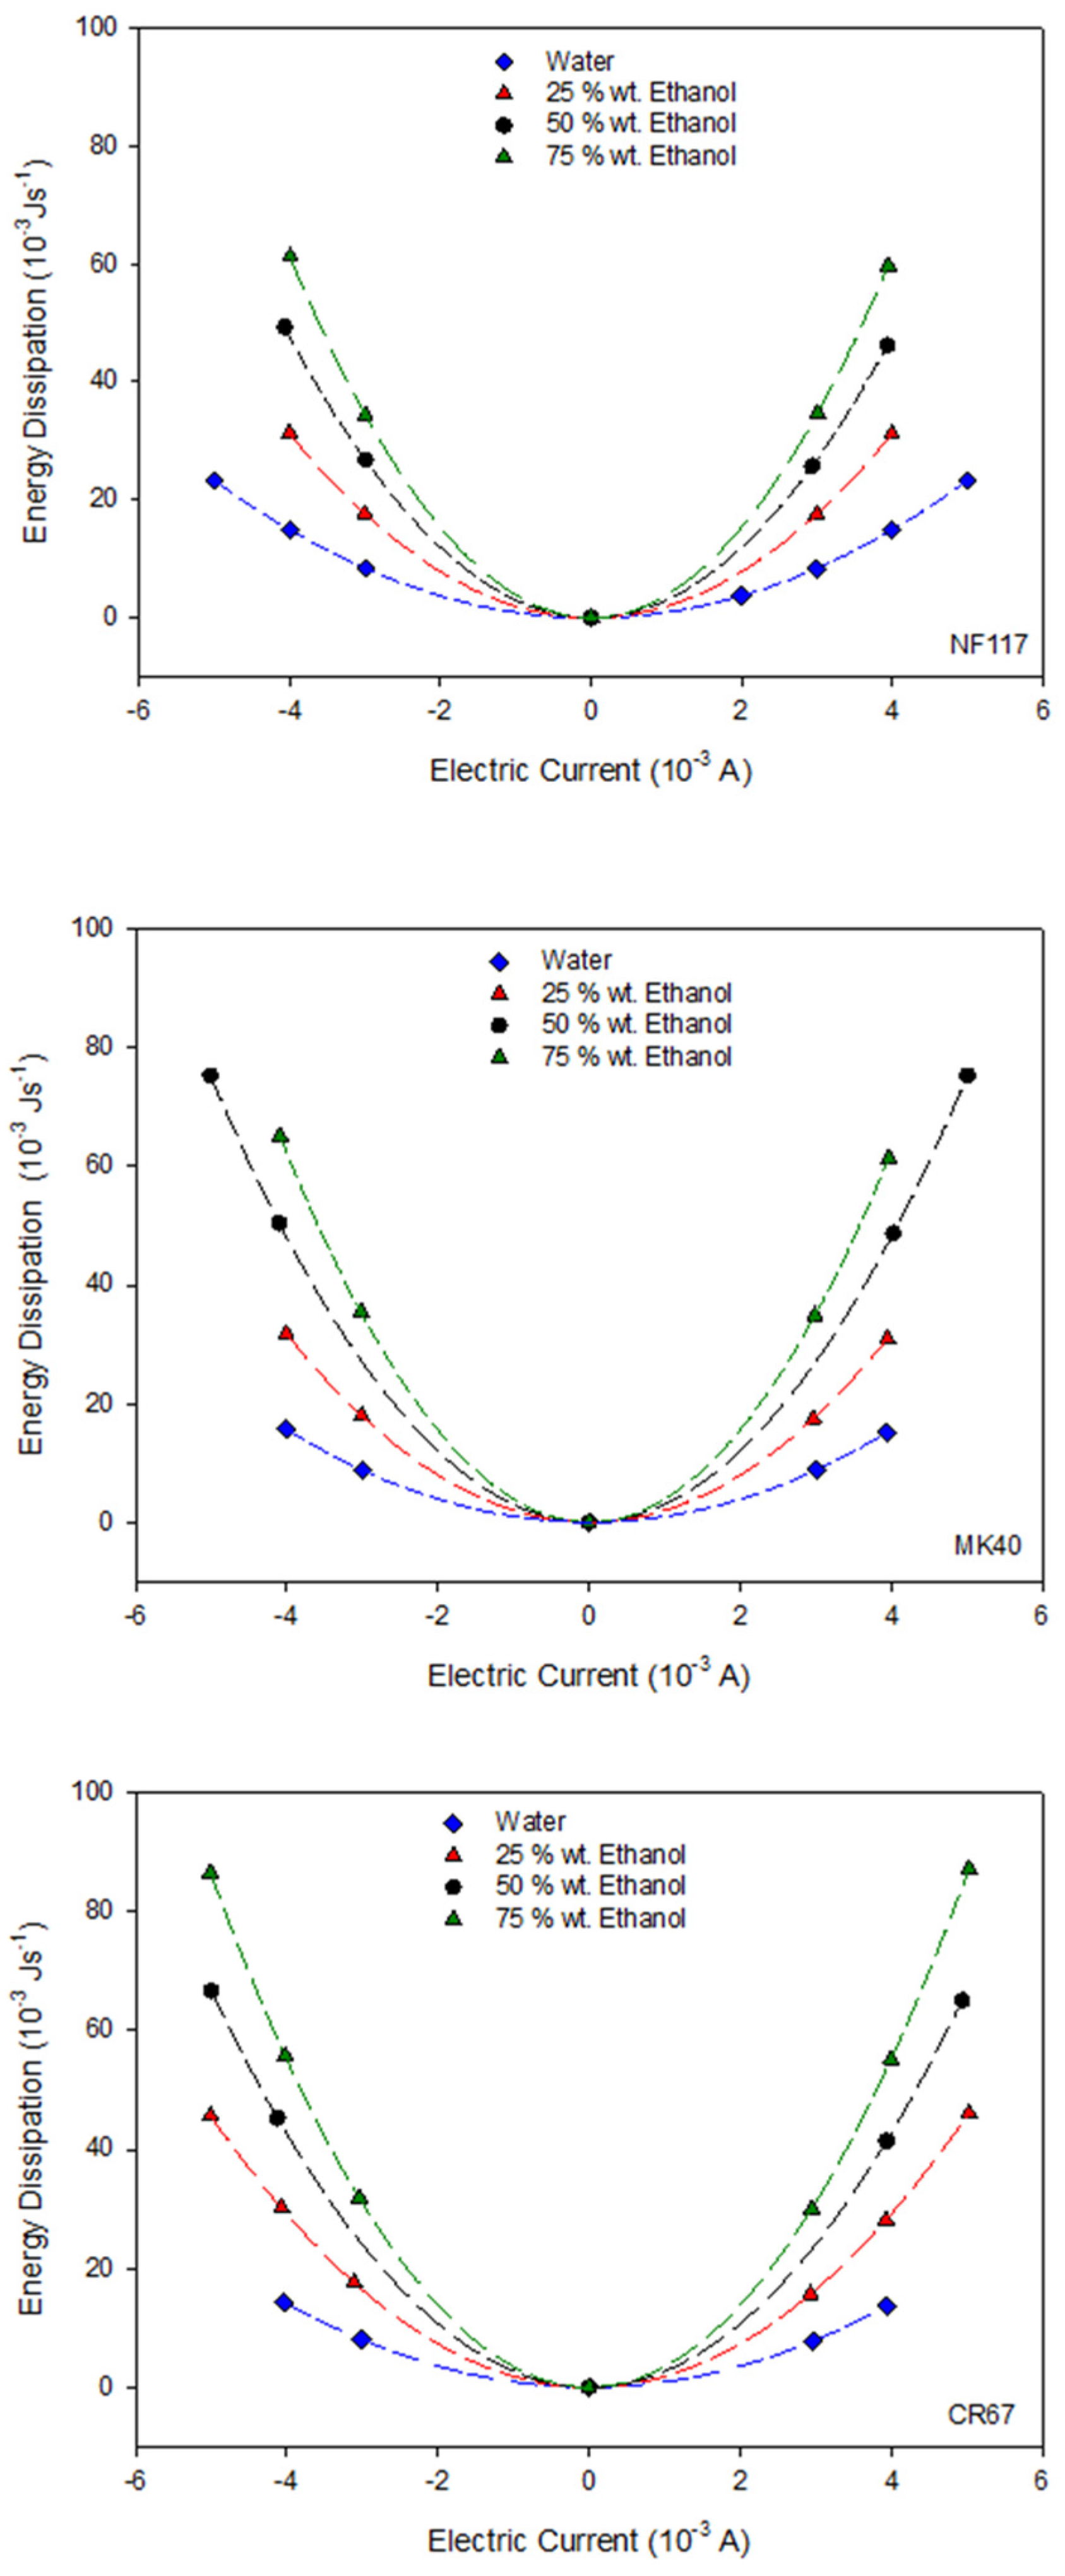
4.2. Determination of the Dissipated Energy
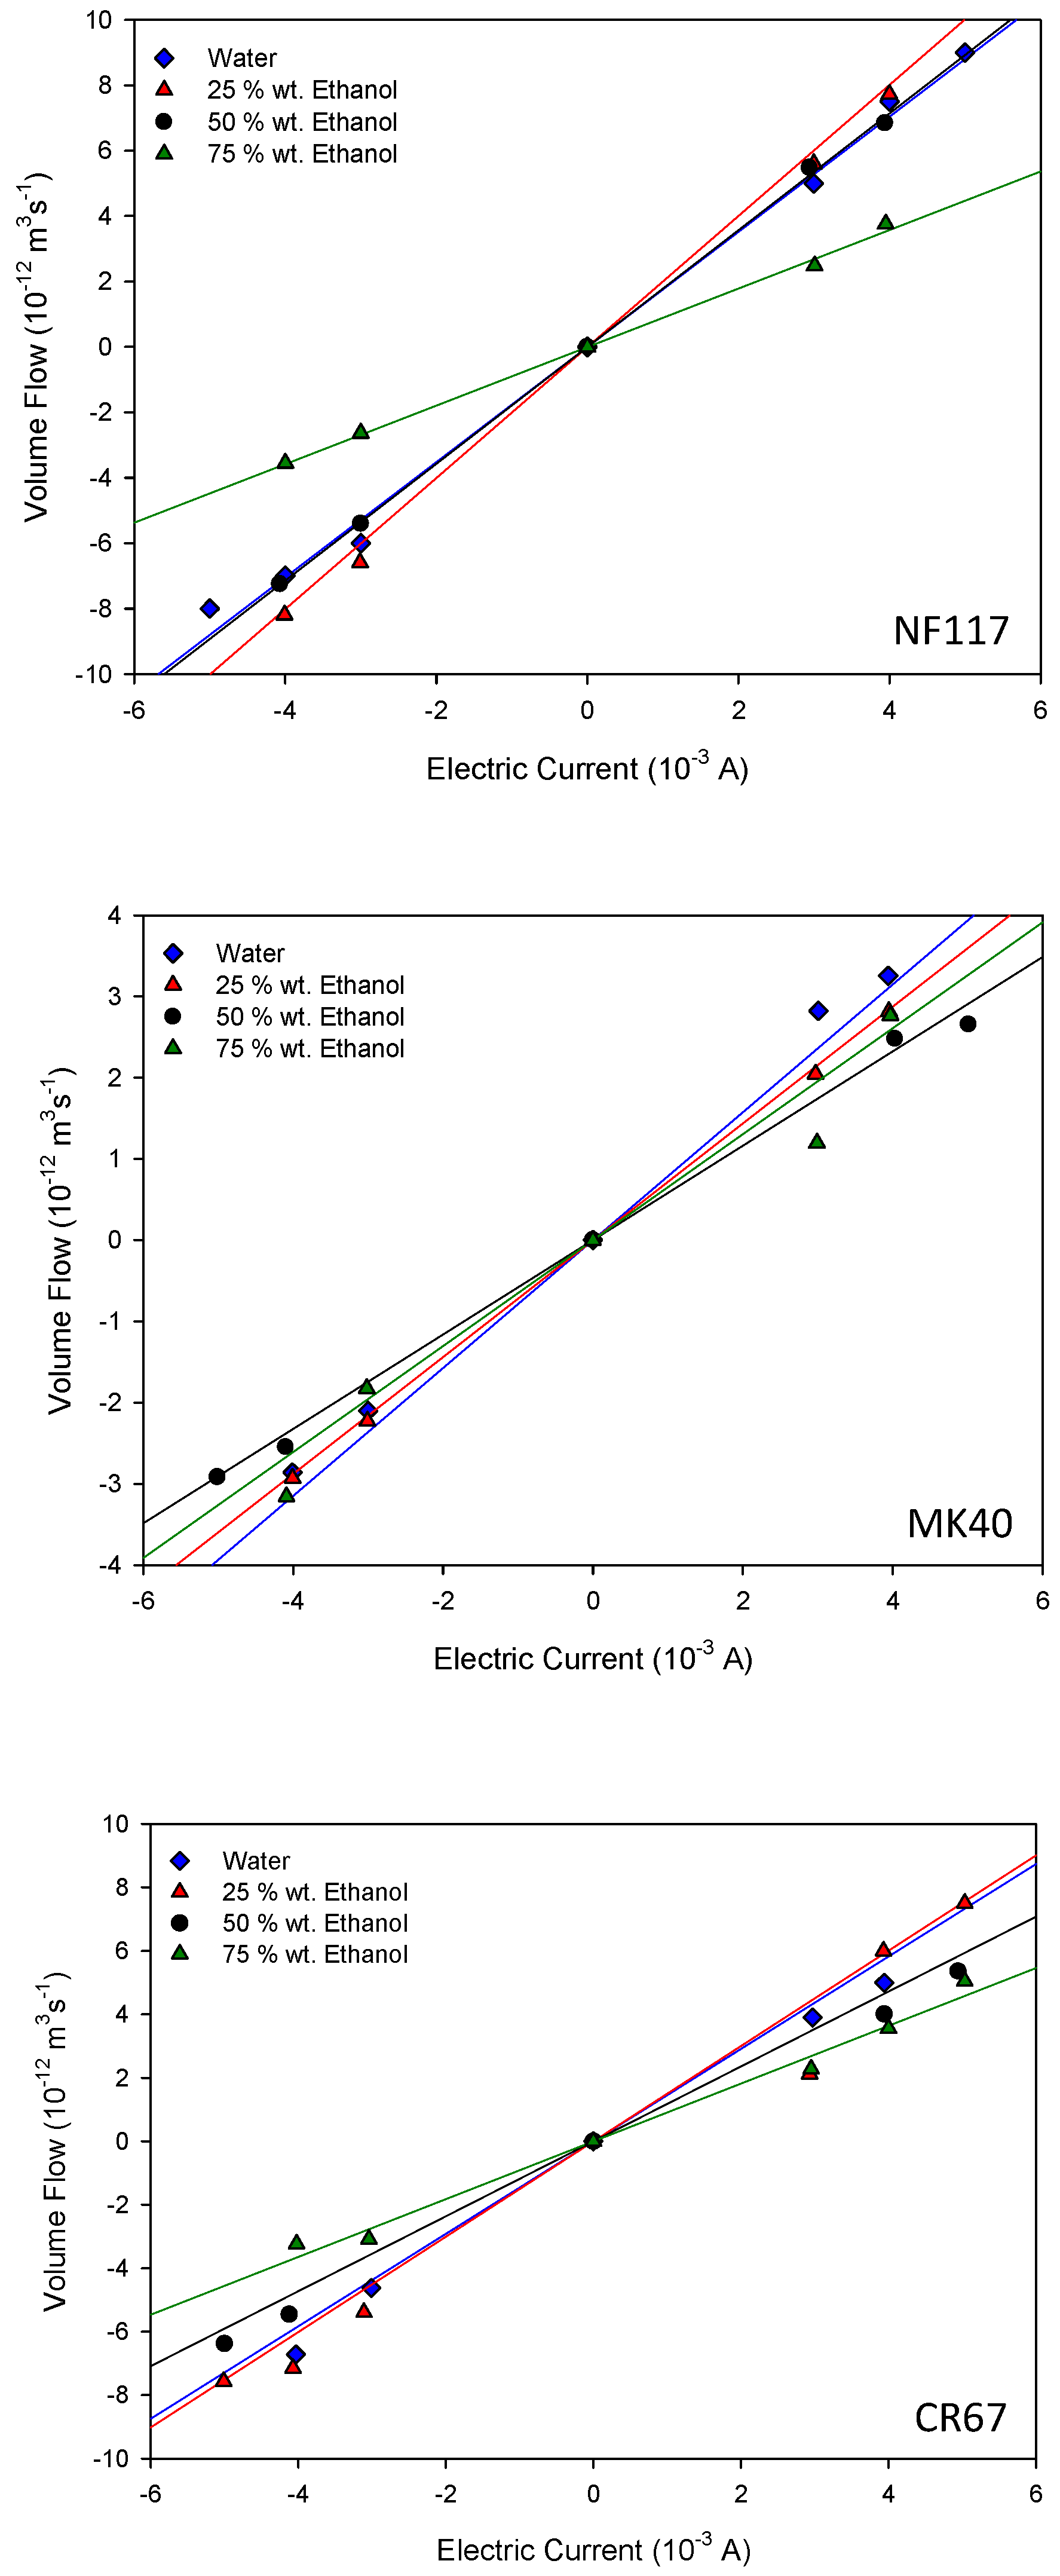
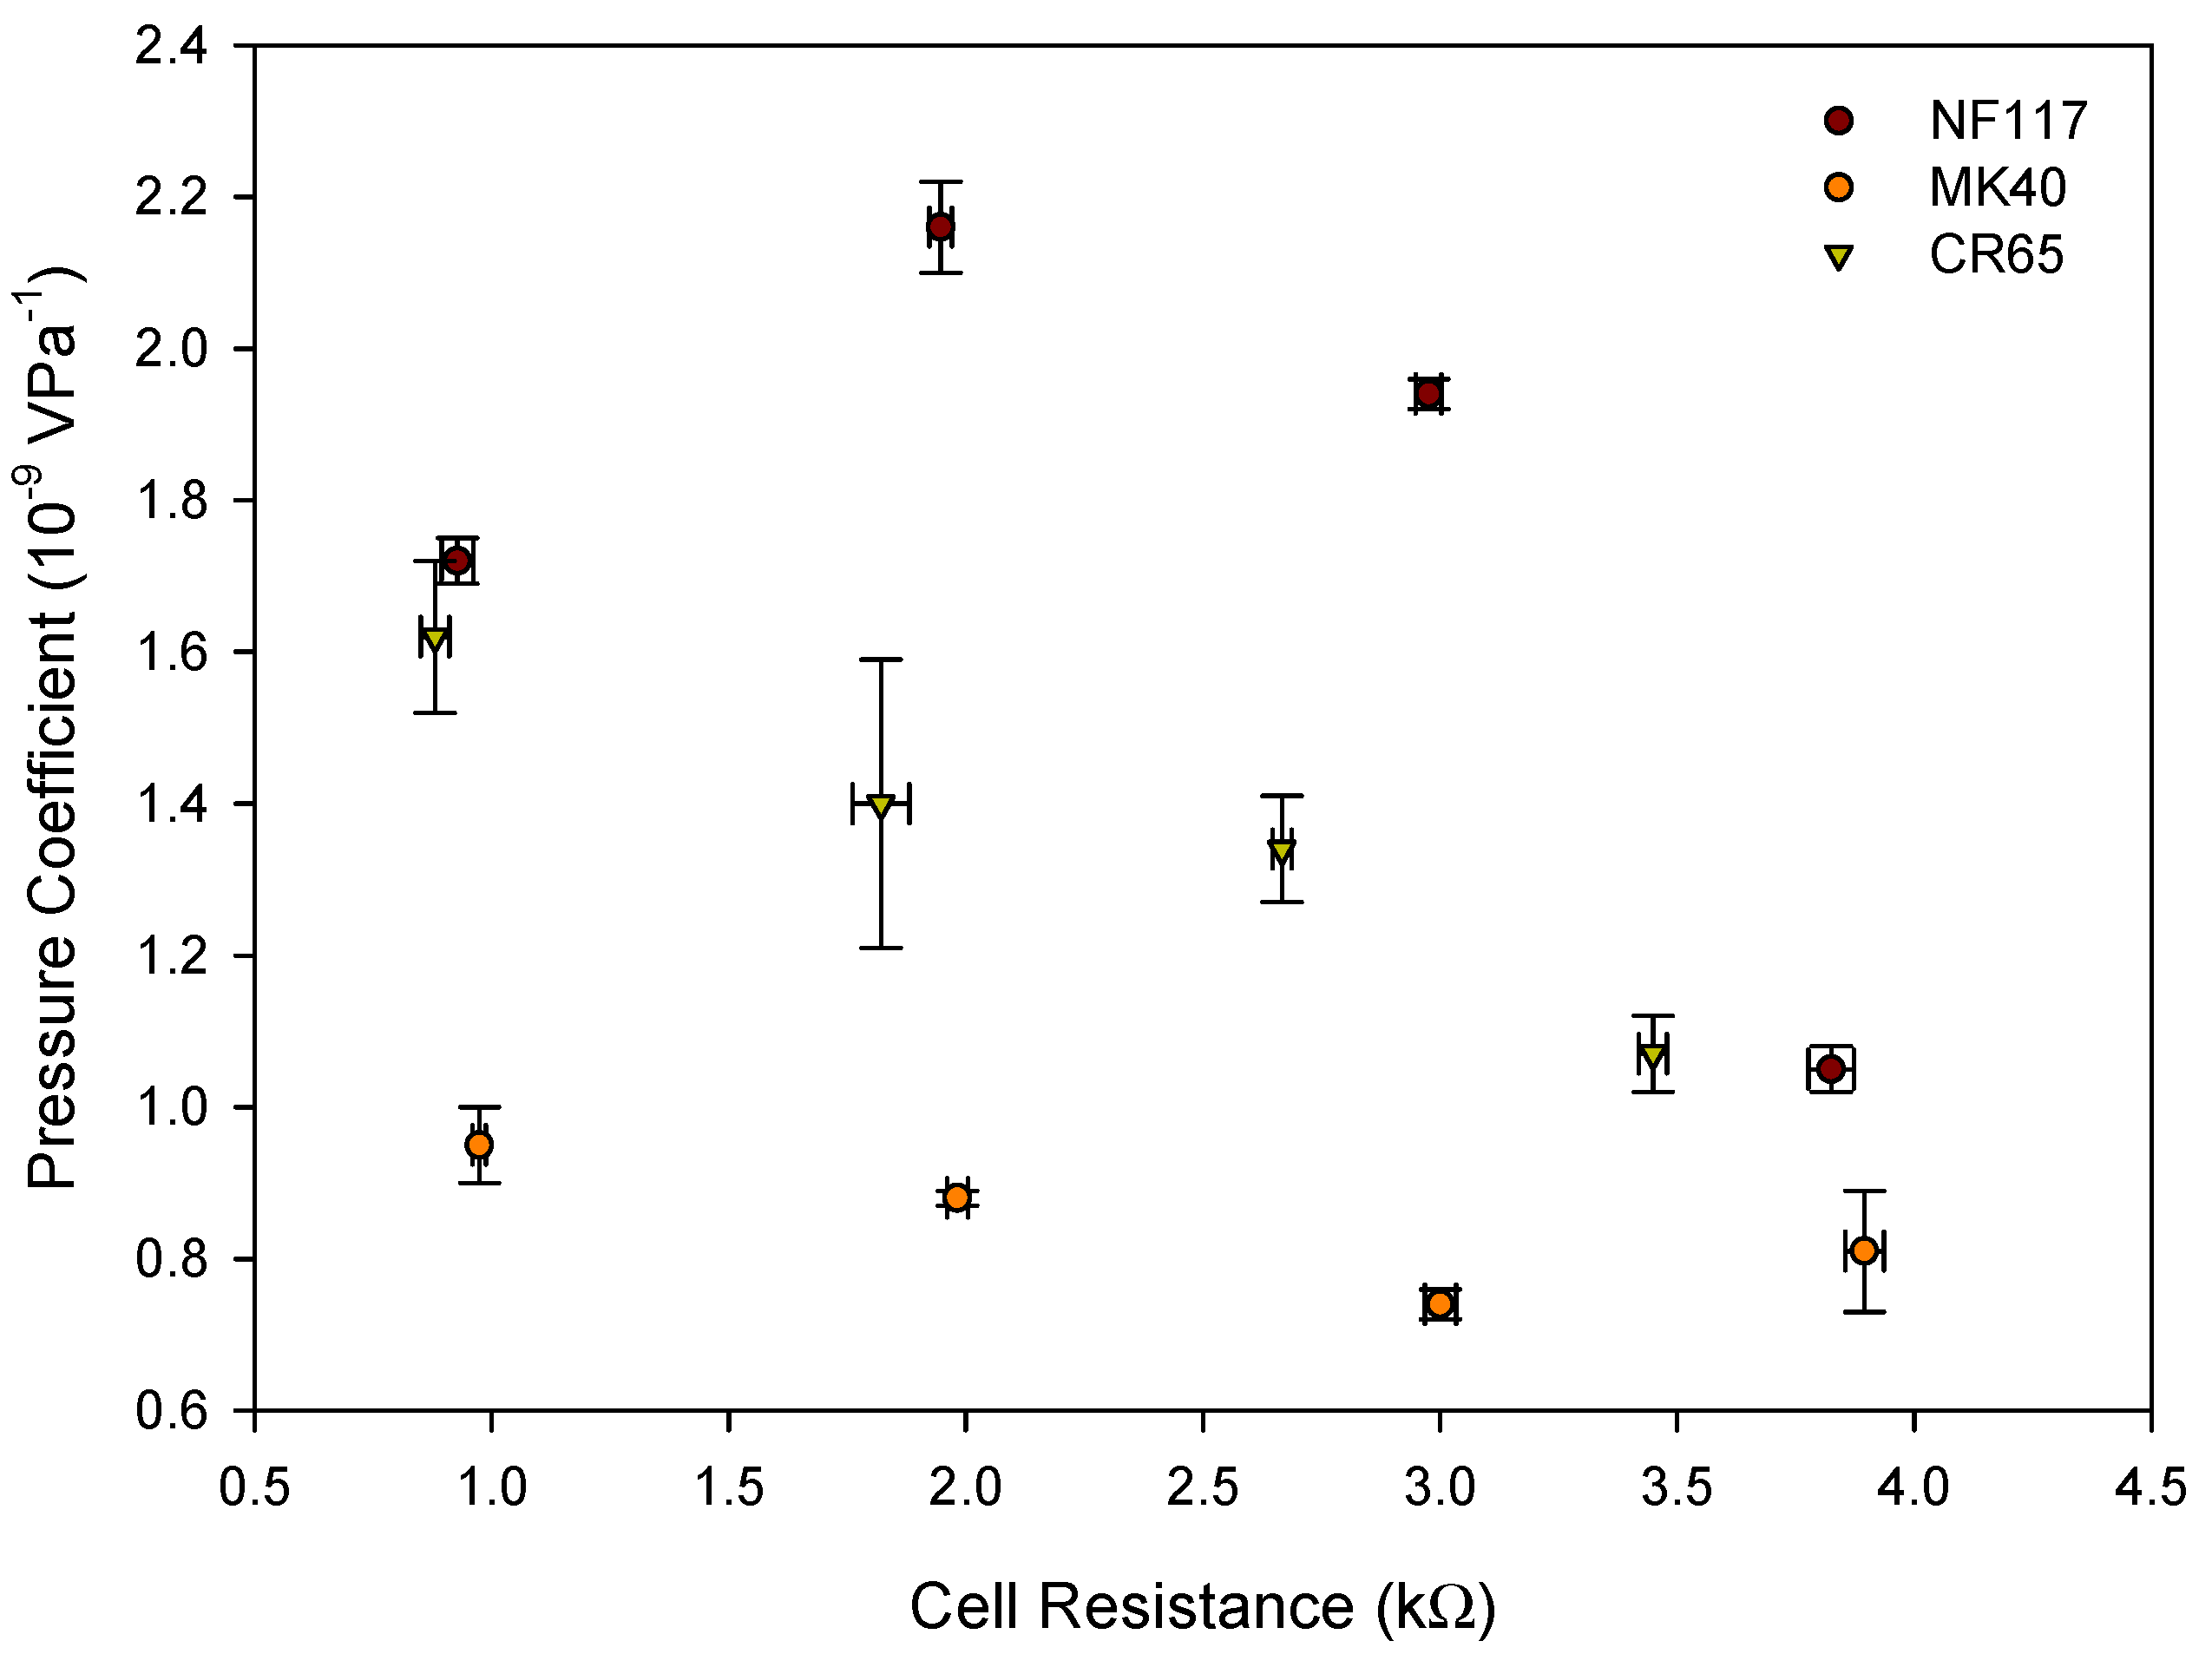
4.3. Electro-Osmotic Permeability
5. Conclusions
Author Contributions
Funding
Conflicts of Interest
References
- de Groot, S.R.; Mazur, P. Non Equilibrium Thermodynamics; Dover Publication INC: New York, NY, USA, 1984. [Google Scholar]
- Barbati, A.C.; Kirby, B.J. Electrokinetic measurements of thin Nafion films. Langmuir 2014, 30, 1985–1993. [Google Scholar] [CrossRef] [PubMed]
- Lawrence, N.D.; Perera, J.M.; Iyer, M.; Hickey, M.W.; Stevens, G.W. The use of streaming potential measurements to study the fouling and cleaning of ultrafiltration membranes. Sep. Purif. Technol. 2006, 48, 106–112. [Google Scholar] [CrossRef]
- Xuan, X.; Li, D. Thermodynamics analysis of electrokinetic microchanel energy conversion. J. Power Sources 2006, 156, 677–684. [Google Scholar] [CrossRef]
- Sjgren, B.; Haldrup, S.; Catalano, J.; Bentien, A. High figure of merit for electrokinetic energy conversion in Nafion membranes. J. Power Sources 2014, 247, 235–242. [Google Scholar]
- Haldrup, S.; Catalano, J.; Hansen, M.R.; Wagner, M.; Vestergaard, G.; Pedersen, J.S.; Bentien, A. High elecatrokinetic energy conversion efficiency in charged nanoporous nitrocellulose/sulfonated polystyrene membranes. Nano Lett. 2015, 15, 1158–1165. [Google Scholar] [CrossRef] [PubMed]
- Catalano, J.; Hamelers, H.V.M.; Biesheuvel, A.B.P.M. Revisiting Morrison and Osterle 1965: The efficiency of membrane-based electrokinetic energy conversion. J. Phys. Condes. Matter 2016, 28, 324001. [Google Scholar] [CrossRef] [PubMed]
- Østedgaard-Munck, D.N.; Catalano, J.; Kristensen, M.B.; Bentien, A.S. Data on flow cell optimization for membrane-based electrokinetic energy conversion. Data Brief 2017, 15, 1–11. [Google Scholar] [CrossRef] [PubMed]
- Matse, M.; Eikerlin, M.; Berg, P. Electrokinetic Onsager coefficients and energy conversion in deformable nanofluidic channels. Eur. Phys. J. Spec. Top. 2019, 227, 2559–2573. [Google Scholar] [CrossRef]
- Yang, G.; Lei, W.; Chen, C.; Qin, S.; Zhang, L.; Su, Y.; Wang, J.; Chen, Z.; Sun, L.; Wang, X.; et al. Ultrathin Ti3C2Tx (MXene) membrane for pressure-driven electrokinetic power generation. Nano Energy 2020, 75, 104954. [Google Scholar] [CrossRef]
- Li, L.; Wang, X.; Pu, Q.; Liu, S. Advancement of electroosmotic pump in microflow analysis: A review. Anal. Chim. Acta 2019, 1060, 1–16. [Google Scholar] [CrossRef]
- Wanga, Y.-N.; Fu, L.-M. Micropumps and biomedical applications—A review. Microelectron. Eng. 2018, 195, 121–138. [Google Scholar] [CrossRef]
- Yang, Q.; Su, B.; Wnag, Y.; Wu, W. Low-voltage efficient electroosmotic pumps with ultrathin silica nanoporous membrane. Electrophoresis 2019, 40, 2149–2156. [Google Scholar] [CrossRef] [PubMed]
- Heysiattalab, S.; Shakeri, M.; Safari, M.; Keikha, M.M. Investigation of key parameters influence on performance of direct ethanol fuel (DEFC). J. Ind. Eng. Chem. 2011, 17, 727–729. [Google Scholar] [CrossRef]
- Rastogi, R.P.; Srivastava, S.C.; Singh, S.N. Nonequilibrium Thermodynamics of electrokinetic phenomena. Chem. Rev. 1993, 93, 1945–1990. [Google Scholar] [CrossRef]
- Barragán, V.M.; Izquierdo-Gil, M.A.; Godino, M.P.; Villaluenga, J.P.G. Study of the Internal Morphology of Cation-Exchange Membranes by Means of Electroosmotic Permeability Relaxations. Phys. Chem. B 2009, 113, 12952–12957. [Google Scholar] [CrossRef]
- Sarapulova, V.; Shkorkina, I.; Mareev, S.; Pismenskaya, N.; Kononenko, N.; Larchet, C.; Dammak, L.; Nikonenko, V. Transport characteristics of Fujifilm ion-exchange membranes as compared to homogeneous membranes AMX and CMX and to heterogeneous membranes MK-40 and MA-41. Membranes 2019, 9, 84. [Google Scholar] [CrossRef] [Green Version]
- Barragán, V.B.; Ruiz-Bauzá, C.; Villaluenga, J.P.G.; Seoane, B. On the methanol-water electroosmotic transport in a Nafion membrane. J. Membr. Sci. 2004, 236, 109–120. [Google Scholar] [CrossRef]
- Ganz, G.J.; Ives, i.D.J.G.; Ganz, G.J. (Eds.) Reference Electrodes; Academic Press: London, UK, 1961; pp. 179–230. [Google Scholar]
- Villaluenga, J.P.G.; Barragán, V.M.; Izquierdo-Gil, M.A.; Godino, M.P.; Seoane, B.; Ruiz-Bauzá, C. Comparative study of liquid uptake and permeation characteristics of sulfonated cation-exchange membranes in water and methanol. J. Membr. Sci. 2008, 15, 421–427. [Google Scholar] [CrossRef]
- Barragán, V.B.; Villaluenga, J.P.G.; Godino, M.P.; Izquierdo-Gil, M.A.; Ruiz-Bauzá, C.; Seoane, B. Swelling and electro-osmotic properties of cation-exchange membrane with different structure sin methanol-water media. J. Power Sources 2008, 185, 822–827. [Google Scholar] [CrossRef]
- Godino, M.P.; Barragán, V.B.; Villaluenga, J.P.G.; Ruiz-Bauzá, C.; Seoane, B.J. Liquid transport through sulfonated cation-exchange membranes for different water-alcohol media. Chem. Eng. J. 2010, 162, 643–648. [Google Scholar] [CrossRef]
- Bošković, P.; Sokol, V.; Tomaš, R.; Prkić, A. Conductivimetric study of potassium chroride in ethanol-water mixtures. J. Electrochem. Sci. 2013, 8, 10961–10975. [Google Scholar]
- Bafotzky, V.S. Fundamentals of Electrochemistry; Plenum Press: New York, NY, USA, 1993. [Google Scholar]
- Zhang, Y.; Xu, T.; Liu, Z. Streaming potential across a porous charged membrane in organic-aqueous solutions. Desalination 2007, 212, 183–190. [Google Scholar] [CrossRef]
- Barragán, V.M.; Pérez-Haro, M.J. Correlations between water uptake and effective fixed charge concentration at high univalent electrolyte concentrations in sulfonated polymer cation-exchange membranes with different morphologies. Electrochim. Acta 2011, 56, 8630–8637. [Google Scholar] [CrossRef]
- Piluharto, B.; Suendo, V.; Ciptati, T.; Radiman, C.L. Strong correlation between membrane effective fixed charge and proton conductivity in the sulfonated polysulfone cation-exchange membrane. Ionics 2011, 1, 229–238. [Google Scholar] [CrossRef]
- Somovilla, P.; Villaluenga, J.P.G.; Barragán, V.M.; Izquierdo-Gil, M.A. Experimental determination of the streaming potential across cation-exchange membranes with different morphologies. J. Membr. Sci. 2016, 500, 16–24. [Google Scholar] [CrossRef] [Green Version]
- Chang, C.C.; Yang, R.J. Electrokinetic energy conversion in micrometer-length nanofluidic channels. Microfluid. Nanofluid. 2010, 9, 225–241. [Google Scholar] [CrossRef]
- Arki, P.; Hecker, C.; Güth, F.; Joseph, Y. Nano- and Microfluidic Channels as Electrokinetic Sensors and Energy Harvesting Devices-Importance of Surface Charge on Solid-Liquid Interfaces. Procedia Eng. 2016, 168, 1374–1377. [Google Scholar] [CrossRef]


| Membrane | dm (10−6 m) | ρm (kg m−3) | IEC (meq g−1) | λ * | |
|---|---|---|---|---|---|
| Water | Ethanol | ||||
| NF117 | 181 | 1.98 | 0.94 | 11 | 2 |
| MK40 | 450 | 1.12 | 1.52 | 15 | 2 |
| CR67 | 685 | 0.833 | 2.1 | 17 | 2 |
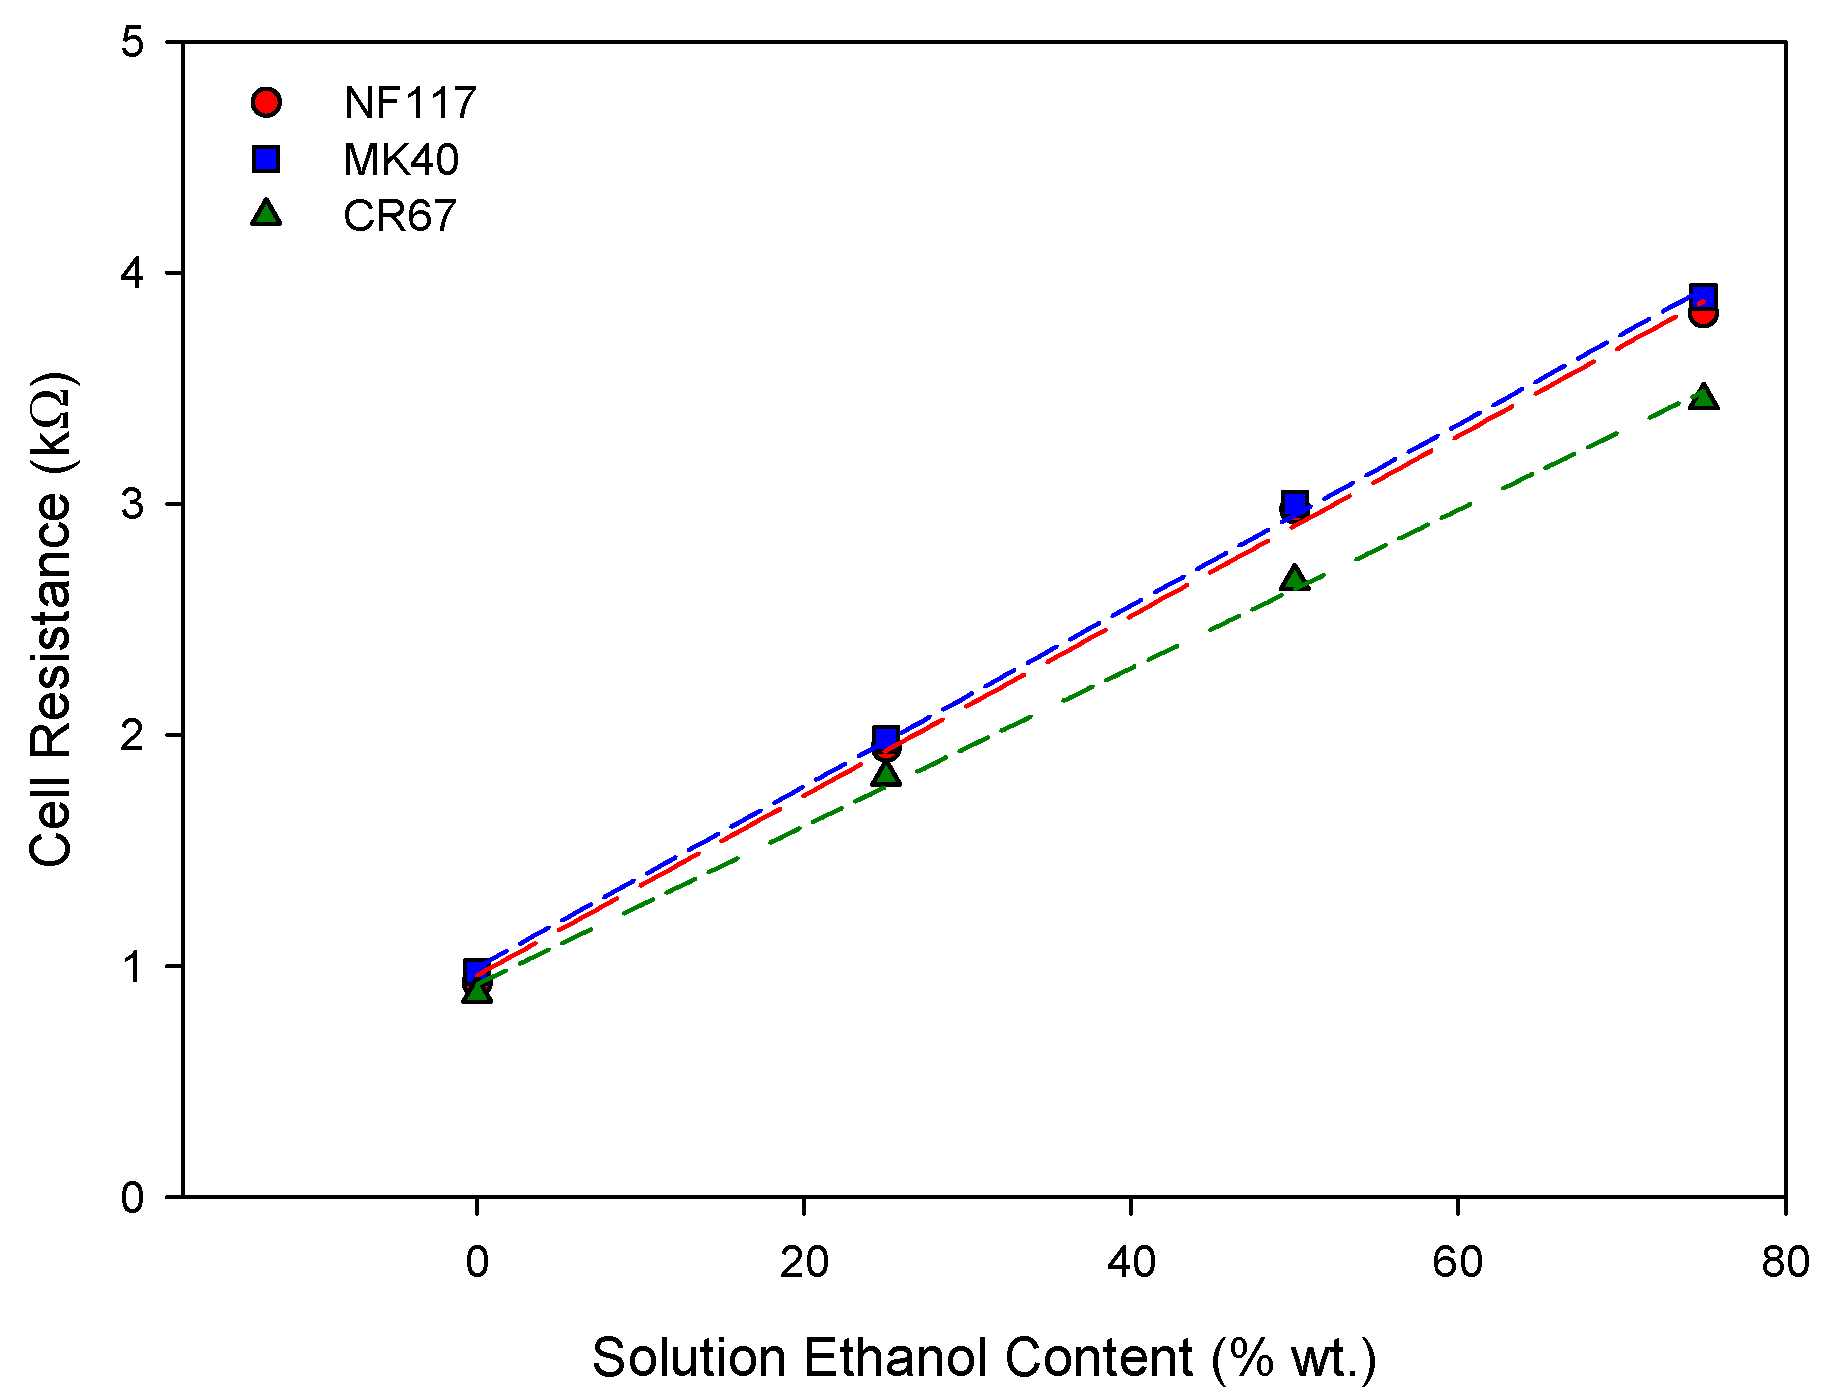
| Membrane | Cell Resistance in Pure Water (kΩ) | Slope (kΩ/% wt.) |
|---|---|---|
| NF117 | 0.928 ± 0.033 | 0.0389 ± 0.0012 |
| MK40 | 0.974 ± 0.014 | 0.0391 ± 0.0008 |
| CR67 | 0.881 ± 0.012 | 0.0342 ± 0.0010 |
| Membrane | Ethanol Percentage (wt.%) | β (10−9 V Pa−1) | ε |
|---|---|---|---|
| NF117 | 0 | 1.72 ± 0.03 | 0.27 |
| 25 | 2.16 ± 0.06 | 0.44 | |
| 50 | 1.94 ± 0.02 | 0.47 | |
| 75 | 1.05 ± 0.03 | 0.35 | |
| MK40 | 0 | 0.95 ± 0.05 | 0.33 |
| 25 | 0.88 ± 0.01 | 0.33 | |
| 50 | 0.74 ± 0.02 | 0.29 | |
| 75 | 0.81 ± 0.08 | 0.25 | |
| CR67 | 0 | 1.62 ± 0.10 | 0.35 |
| 25 | 1.40 ± 0.19 | 0.35 | |
| 50 | 1.34 ± 0.07 | 0.31 | |
| 75 | 1.07 ± 0.05 | 0.27 |
© 2020 by the authors. Licensee MDPI, Basel, Switzerland. This article is an open access article distributed under the terms and conditions of the Creative Commons Attribution (CC BY) license (http://creativecommons.org/licenses/by/4.0/).
Share and Cite
Barragán, V.M.; Villaluenga, J.P.G.; Morales-Villarejo, V.; Izquierdo-Gil, M.A. Electro-Osmotic Behavior of Polymeric Cation-Exchange Membranes in Ethanol-Water Solutions. Entropy 2020, 22, 692. https://0-doi-org.brum.beds.ac.uk/10.3390/e22060692
Barragán VM, Villaluenga JPG, Morales-Villarejo V, Izquierdo-Gil MA. Electro-Osmotic Behavior of Polymeric Cation-Exchange Membranes in Ethanol-Water Solutions. Entropy. 2020; 22(6):692. https://0-doi-org.brum.beds.ac.uk/10.3390/e22060692
Chicago/Turabian StyleBarragán, V. María, Juan P. G. Villaluenga, Víctor Morales-Villarejo, and M. Amparo Izquierdo-Gil. 2020. "Electro-Osmotic Behavior of Polymeric Cation-Exchange Membranes in Ethanol-Water Solutions" Entropy 22, no. 6: 692. https://0-doi-org.brum.beds.ac.uk/10.3390/e22060692