Robust Characterization of the Uterine Myoelectrical Activity in Different Obstetric Scenarios

 , ,
, ,
Abstract
:1. Introduction
2. Materials and Methods
2.1. Term-Preterm EHG Database
2.2. Ci2B-La Fe Database
2.3. EHG Signal Characterization
3. Results
4. Discussion
4.1. Robust Characterization of Uterine Activity in Whole EHG Recordings Analysis
4.2. Temporal & Spectral EHG Parameters
4.3. Non-Linear EHG Parameters
5. Conclusions
Author Contributions
Funding
Conflicts of Interest
References
- Wagura, P.; Wasunna, A.; Laving, A.; Wamalwa, D.; Ng’ang’a, P. Prevalence and factors associated with preterm birth at Kenyatta national hospital. BMC Pregnancy Childbirth 2018, 18, 107. [Google Scholar] [CrossRef] [PubMed]
- Liu, L.; Johnson, H.L.; Cousens, S.; Perin, J.; Scott, S.; Lawn, J.E.; Rudan, I.; Campbell, H.; Cibulskis, R.; Li, M.; et al. Global, regional, and national causes of child mortality: An updated systematic analysis for 2010 with time trends since 2000. Lancet 2012, 379, 2151–2161. [Google Scholar] [CrossRef]
- Howson, C.P.; Kinney, M.V.; McDougall, L.; Lawn, J.E. Born Too Soon Preterm Birth Action Group Born too soon: Preterm birth matters. Reprod. Health 2013, 10 (Suppl. 1), S1. [Google Scholar] [CrossRef] [Green Version]
- Garfield, R.E.; Maner, W.L. Physiology and electrical activity of uterine contractions. Semin. Dev. Biol. 2007, 18, 289–295. [Google Scholar] [CrossRef] [PubMed] [Green Version]
- AbouZahr, C. Global burden of maternal death and disability. Br. Med. Bull. 2003, 67, 1–11. [Google Scholar] [CrossRef]
- Karlsson, H.; Sanz, C.P. Postpartum haemorrhage. An. Sist. Sanit. Navar. 2009, 32, 159–168. [Google Scholar] [CrossRef] [PubMed]
- Turmen, T. Safe motherhood: A global problem. Report from a symposium on the prevention and management of anaemia in pregnancy and postpartum hemorrhage. World Health Organ. 1996, 1–13. [Google Scholar]
- Hadar, E.; Biron-Shental, T.; Gavish, O.; Raban, O.; Yogev, Y. A comparison between electrical uterine monitor, tocodynamometer and intra uterine pressure catheter for uterine activity in labor. J. Matern. Neonatal Med. 2015, 28, 1367–1374. [Google Scholar] [CrossRef]
- Terrien, J.; Marque, C.; Karlsson, B. Spectral characterization of human EHG frequency components based on the extraction and reconstruction of the ridges in the scalogram. Conf. Proc. IEEE Eng. Med. Biol. Soc. 2007, 2007, 1872–1875. [Google Scholar]
- Maul, H.; Maner, W.L.; Olson, G.; Saade, G.R.; Garfield, R.E. Non-invasive transabdominal uterine electromyography correlates with the strength of intrauterine pressure and is predictive of labor and delivery. J. Matern. Fetal Neonatal Med. 2004, 15, 297–301. [Google Scholar] [CrossRef]
- Terrien, J.; Marque, C.; Gondry, J.; Steingrimsdottir, T.; Karlsson, B. Uterine electromyogram database and processing function interface: An open standard analysis platform for electrohysterogram signals. Comput. Biol. Med. 2010, 40, 223–230. [Google Scholar] [CrossRef] [PubMed]
- Schlembach, D.; Maner, W.L.; Garfield, R.E.; Maul, H. Monitoring the progress of pregnancy and labor using electromyography. Eur. J. Obstet. Gynecol. Reprod. Biol. 2009, 144 (Suppl. 1), S33–S39. [Google Scholar] [CrossRef]
- Alberola-Rubio, J.; Prats-Boluda, G.; Ye-Lin, Y.; Valero, J.; Perales, A.; Garcia-Casado, J. Comparison of non-invasive electrohysterographic recording techniques for monitoring uterine dynamics. Med. Eng. Phys. 2013, 35. [Google Scholar] [CrossRef] [PubMed]
- Euliano, T.Y.; Nguyen, M.T.; Darmanjian, S.; McGorray, S.P.; Euliano, N.; Onkala, A.; Gregg, A.R. Monitoring uterine activity during labor: A comparison of 3 methods. Am. J. Obstet. Gynecol. 2013, 208, 66.e1–66.e6. [Google Scholar] [CrossRef] [PubMed] [Green Version]
- Parra, C.B.; Tendero, A.I.; Ye-Lin, Y.; Alberola-Rubio, J.; Perales Marin, A.; Garcia-Casado, J.; Prats-Boluda, G.; Benalcazar Parra, C.; Tendero, A.I.; Ye-Lin, Y.; et al. Feasibility of Labor Induction Success Prediction based on Uterine Myoelectric Activity Spectral Analysis. In Proceedings of the 11th International Joint Conference on Biomedical Engineering Systems and Technologies, Funchal, Madeira, Portugal, 19–21 January 2018; pp. 70–77. [Google Scholar]
- Devedeux, D.; Marque, C.; Mansour, S.; Germain, G.; Duchêne, J. Uterine electromyography: A critical review. Am. J. Obstet. Gynecol. 1993, 169, 1636–1653. [Google Scholar] [CrossRef]
- Chkeir, A.; Fleury, M.J.; Karlsson, B.; Hassan, M.; Marque, C. Patterns of electrical activity synchronization in the pregnant rat uterus. BioMedicine 2013, 3, 140–144. [Google Scholar] [CrossRef]
- Mas-Cabo, J.; Prats-Boluda, G.; García-Casado, J.; Perales Marin, A.; Alberola-Rubio, J.; López Corral, A.; Ye-Lin, Y.; Mas-Cabo, G.J.; Prats-Boluda, J.; García-Casado, A.; et al. Caracterización de la actividad eléctrica uterina durante la gestación, el parto y el postparto. In Proceedings of the Actas del XXXVII Congreso Anual de la Sociedad Española de Ingeniería Biomédica, Santander, Spain, 27–29 November 2019; pp. 379–382. [Google Scholar]
- Fele-Žorž, G.; Kavšek, G.; Novak-Antolič, Ž.; Jager, F. A comparison of various linear and non-linear signal processing techniques to separate uterine EMG records of term and pre-term delivery groups. Med. Biol. Eng. Comput. 2008, 46, 911–922. [Google Scholar] [CrossRef]
- Sikora, J.; Matonia, A.; Czabański, R.; Horoba, K.; Jezewski, J.; Kupka, T. Recognition of premature threatening labour symptoms from bioelectrical uterine activity signals. Arch. Perinat. Med. 2011, 17, 97–103. [Google Scholar]
- Mas-Cabo, J.; Prats-Boluda, G.; Perales, A.; Garcia-Casado, J.; Alberola-Rubio, J.; Ye-Lin, Y. Uterine electromyography for discrimination of labor imminence in women with threatened preterm labor under tocolytic treatment. Med. Biol. Eng. Comput. 2018, 57, 401–411. [Google Scholar] [CrossRef]
- Vinken, M.P.G.C.; Rabotti, C.; Mischi, M.; Oei, S.G. Accuracy of frequency-related parameters of the electrohysterogram for predicting preterm delivery: A review of the literature. Obs. Gynecol. Surv. 2009, 64, 529–541. [Google Scholar] [CrossRef]
- Hassan, M.; Terrien, J.; Marque, C.; Karlsson, B. Comparison between approximate entropy, correntropy and time reversibility: Application to uterine electromyogram signals. Med. Eng. Phys. 2011, 33, 980–986. [Google Scholar] [CrossRef] [PubMed]
- Lemancewicz, A.; Borowska, M.; Kuć, P.; Jasińska, E.; Laudański, P.; Laudański, T.; Oczeretko, E.; Kuc, P.; Jasinska, E.; Laudanski, P.; et al. Early diagnosis of threatened premature labor by electrohysterographic recordings - The use of digital signal processing. Biocybern. Biomed. Eng. 2016, 36, 302–307. [Google Scholar] [CrossRef]
- Garcia-Casado, J.; Ye-Lin, Y.; Prats-Boluda, G.; Mas-Cabo, J.; Alberola-Rubio, J.; Perales, A. Electrohysterography in the diagnosis of preterm birth: A review. Physiol. Meas. 2018, 39, 02TR01. [Google Scholar] [CrossRef]
- Most, O.; Langer, O.; Kerner, R.; Ben David, G.; Calderon, I. Can myometrial electrical activity identify patients in preterm labor? Am. J. Obstet. Gynecol. 2008, 199, 378. [Google Scholar] [CrossRef]
- Verdenik, I.; Pajntar, M.; Leskos, B.; Leskosek, B. Uterine electrical activity as predictor of preterm birth in women with preterm contractions. Eur. J. Obstet. Gynecol. Reprod. Biol. 2001, 95, 149–153. [Google Scholar] [CrossRef]
- Horoba, K.; Jezewski, J.; Matonia, A.; Wrobel, J.; Czabanski, R.; Jezewski, M. Early predicting a risk of preterm labour by analysis of antepartum electrohysterographic signals. Biocybern. Biomed. Eng. 2016, 36, 574–583. [Google Scholar] [CrossRef]
- Lucovnik, M.; Maner, W.L.; Chambliss, L.R.; Blumrick, R.; Balducci, J.; Novak-Antolic, Z.; Garfield, R.E. Noninvasive uterine electromyography for prediction of preterm delivery. Am. J. Obstet. Gynecol. 2011, 204, 228.e1–228.e10. [Google Scholar] [CrossRef] [Green Version]
- Smrdel, A.; Jager, F. Separating sets of term and pre-term uterine EMG records. Physiol. Meas. 2015, 36, 341–355. [Google Scholar] [CrossRef]
- Maner, W.L.; Garfield, R.E.; Maul, H.; Olson, G.; Saade, G. Predicting term and preterm delivery with transabdominal uterine electromyography. Obstet. Gynecol. 2003, 101, 1254–1260. [Google Scholar] [CrossRef]
- Marque, C.; Gondry, J. Use of the electrohysterogram signal for characterization of contractions during pregnancy. IEEE Trans. Biomed. Eng. 1999, 46, 1222–1229. [Google Scholar]
- Vrhovec, J.; Macek Lebar, A.; Lebar, A.M. An Uterine Electromyographic Activity as a Measure of Labor Progression. In Applications of EMG in Clinical and Sports Medicine; InTech: London, UK, 2012; pp. 243–268. ISBN 978-953-307-798-7. [Google Scholar]
- Mischi, M.; Chen, C.; Ignatenko, T.; de Lau, H.; Ding, B.; Oei, S.G.G.; Rabotti, C. Dedicated Entropy Measures for Early Assessment of Pregnancy Progression From Single-Channel Electrohysterography. IEEE Trans. Biomed. Eng. 2018, 65, 875–884. [Google Scholar] [CrossRef]
- Ball, J.W.; Dains, J.E.; Flynn, J.A.; Solomon, B.S.; Stewart, R.W. Seidel’s Guide to Physical Examination, 8th ed.; Elsevier: Amsterdam, The Netherlands, 2015; ISBN 978-0-323-11240-6. [Google Scholar]
- Garfield, R.E.; Maner, W.L.; MacKay, L.B.; Schlembach, D.; Saade, G.R. Comparing uterine electromyography activity of antepartum patients versus term labor patients. Am. J. Obstet. Gynecol. 2005, 193, 23–29. [Google Scholar] [CrossRef] [PubMed]
- Maner, W.L.; Garfield, R.E. Identification of human term and preterm labor using artificial neural networks on uterine electromyography data. Ann. Biomed. Eng. 2007, 35, 465–473. [Google Scholar] [CrossRef]
- Dimitrov, G.V.; Arabadzhiev, T.I.; Mileva, K.N.; Bowtell, J.L.; Crichton, N.; Dimitrova, N.A. Muscle fatigue during dynamic contractions assessed by new spectral indices. Med. Sci. Sports Exerc. 2006. [Google Scholar] [CrossRef] [PubMed]
- Murphy, P.; Nagarajan, R.; Preißl, H.; Eswaran, H.; Wilson, J.D.; Lowery, C.; Murphy, P.; Lowery, C.; Preissl, H.; Nagarajan, R.; et al. Analysis of uterine contractions: A dynamical approach. J. Matern. Fetal Neonatal Med. 2003, 14, 8–21. [Google Scholar] [CrossRef]
- Lempel, A.; Ziv, J. On the complexity of finite valued functions. IEEE Trans. Inf. Technol. 1976, I, 23. [Google Scholar] [CrossRef]
- Vrhovec, J.; Macek-Lebar, A.; Rudel, D. Evaluating Uterine Electrohysterogram with Entropy. In Proceedings of the 11th Mediterranean Conference on Medical and Biomedical Engineering and Computing, Ljubljana, Slovenia, 26–30 June 2007; Springer: Berlin/Heidelberg, Germany, 2007; Volume 16, pp. 144–147. [Google Scholar]
- Diab, A.; Hassan, M.; Marque, C.; Karlsson, B. Quantitative performance analysis of four methods of evaluating signal nonlinearity: Application to uterine EMG signals. Conf. Proc. IEEE Eng. Med. Biol. Soc. 2012, 2012, 1045–1048. [Google Scholar] [PubMed]
- Zhang, X.S.; Roy, R.J.; Jensen, E.W. EEG complexity as a measure of depth of anesthesia for patients. IEEE Trans. Biomed. Eng. 2001, 48, 1424–1433. [Google Scholar] [CrossRef]
- Roy, B.; Ghatak, S. Nonlinear Methods to Assess Changes in Heart Rate Variability in Type 2 Diabetic Patients. Arq. Bras. Cardiol. 2013. [Google Scholar] [CrossRef]
- Andreu-Perez, J.; Poon, C.C.Y.; Merrifield, R.D.; Wong, S.T.C.; Yang, G.Z. Big Data for Health. IEEE J. Biomed. Heal. Inform. 2015. [Google Scholar] [CrossRef]
- Batista, A.G.; Najdi, S.; Godinho, D.M.; Martins, C.; Serrano, F.C.; Ortigueira, M.D.; Rato, R.T. A multichannel time–frequency and multi-wavelet toolbox for uterine electromyography processing and visualisation. Comput. Biol. Med. 2016, 76, 178–191. [Google Scholar] [CrossRef]
- Fergus, P.; Cheung, P.; Hussain, A.; Al-Jumeily, D.; Dobbins, C.; Iram, S. Prediction of preterm deliveries from EHG signals using machine learning. PLoS ONE 2013, 8, e77154. [Google Scholar] [CrossRef] [PubMed]
- Acharya, U.R.; Sudarshan, V.K.; Rong, S.Q.; Tan, Z.; Lim, C.M.; Koh, J.E.; Nayak, S.; Bhandary, S.V.; Qing, S.; Tan, Z.; et al. Automated detection of premature delivery using empirical mode and wavelet packet decomposition techniques with uterine electromyogram signals. Comput. Biol. Med. 2017, 85, 33–42. [Google Scholar] [CrossRef] [PubMed]
- Ren, P.; Yao, S.; Li, J.; Valdes-Sosa, P.A.; Kendrick, K.M. Improved Prediction of Preterm Delivery Using Empirical Mode Decomposition Analysis of Uterine Electromyography Signals. PLoS ONE 2015, 10, e0132116. [Google Scholar] [CrossRef] [PubMed] [Green Version]
- Ahmed, M.U.; Chanwimalueang, T.; Thayyil, S.; Mandic, D.P. A multi variate multiscale fuzzy entropy algorithm with application to uterine EMG complexity analysis. Entropy 2017, 19, 2. [Google Scholar] [CrossRef] [Green Version]
- Krapohl, A.J.; Myers, G.G.; Caldeyro-Barcia, R. Uterine contractions in spontaneous labor. A quantitative study. Am. J. Obstet. Gynecol. 1970, 106, 378–387. [Google Scholar] [CrossRef]
- Garfield, R.E.; Maner, W.L.; Maul, H.; Saade, G.R. Use of uterine EMG and cervical LIF in monitoring pregnant patients. Int. J. Obstet. Gynaecol. 2005, 112, 103–108. [Google Scholar] [CrossRef] [PubMed]
- Grotegut, C.A.; Paglia, M.J.; Johnson, L.N.C.; Thames, B.; James, A.H. Oxytocin exposure during labor among women with postpartum hemorrhage secondary to uterine atony. Am. J. Obstet. Gynecol. 2011, 204, 56.e1–56.e6. [Google Scholar] [CrossRef] [Green Version]
- Diab, A.; Hassan, M.; Marque, C.; Karlsson, B. Performance analysis of four nonlinearity analysis methods using a model with variable complexity and application to uterine EMG signals. Med. Eng. Phys. 2014, 36, 761–767. [Google Scholar] [CrossRef] [Green Version]
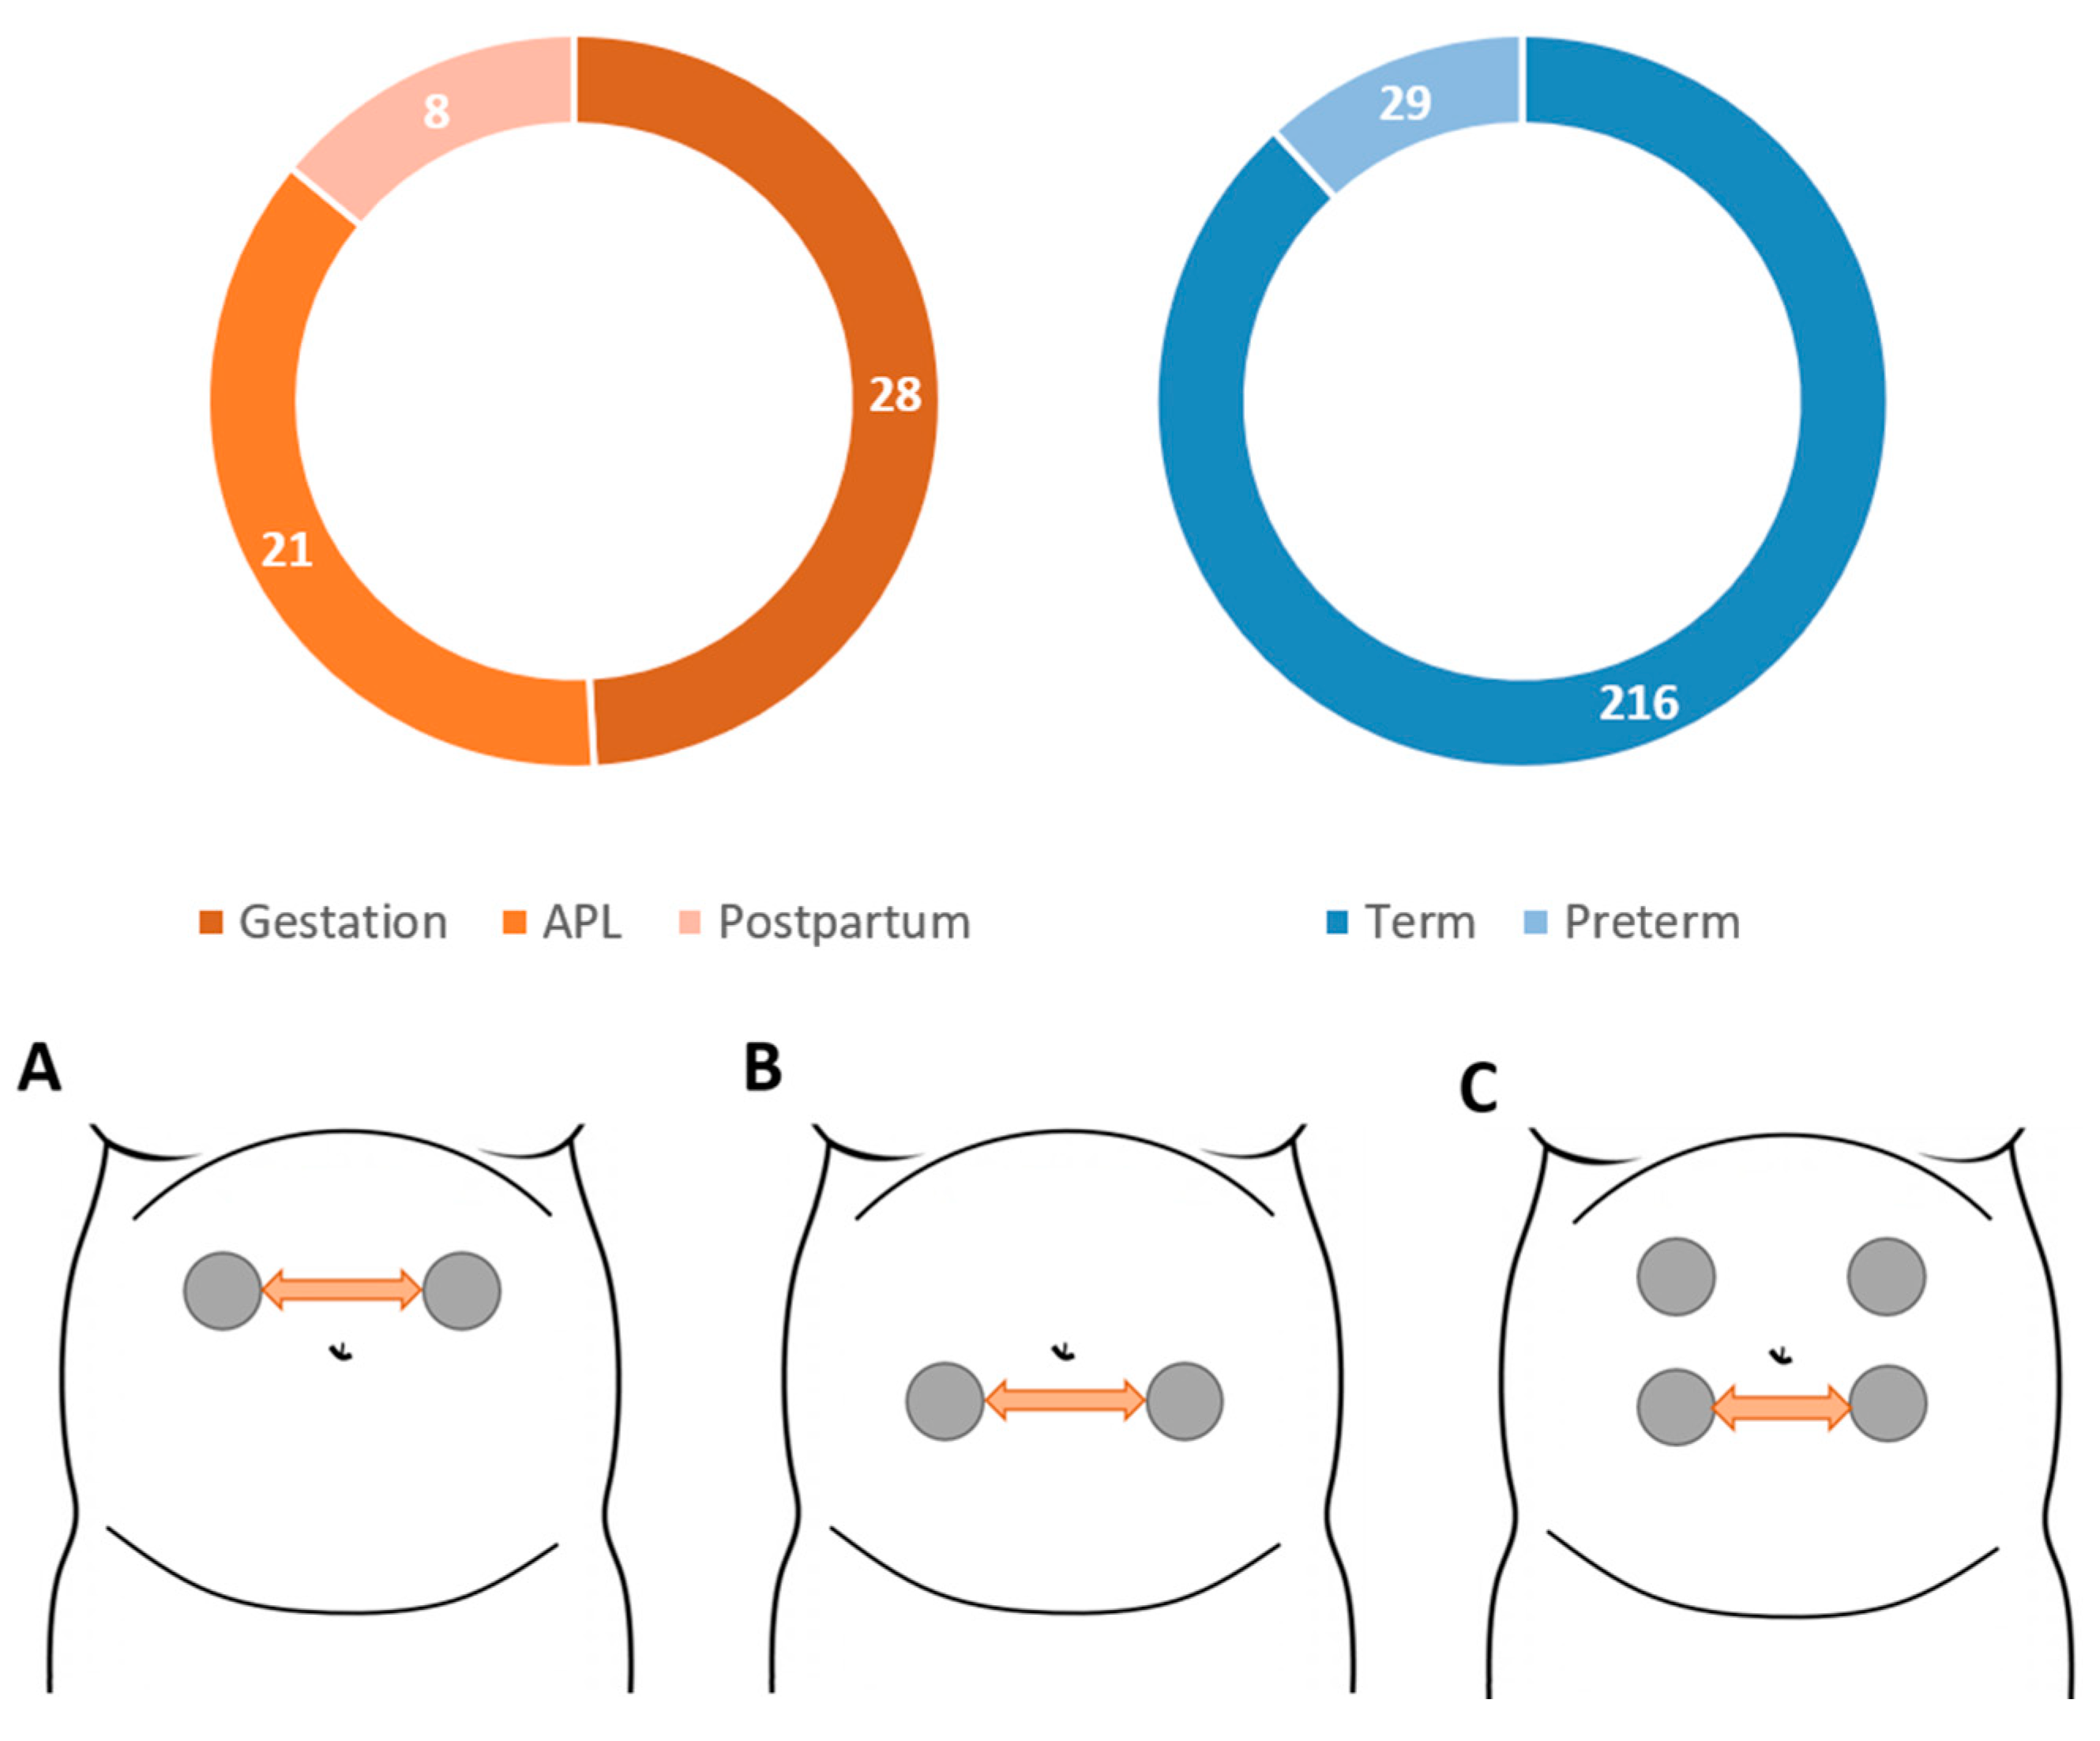
 represents the patient’s navel.
represents the patient’s navel.
represents the patient’s navel.


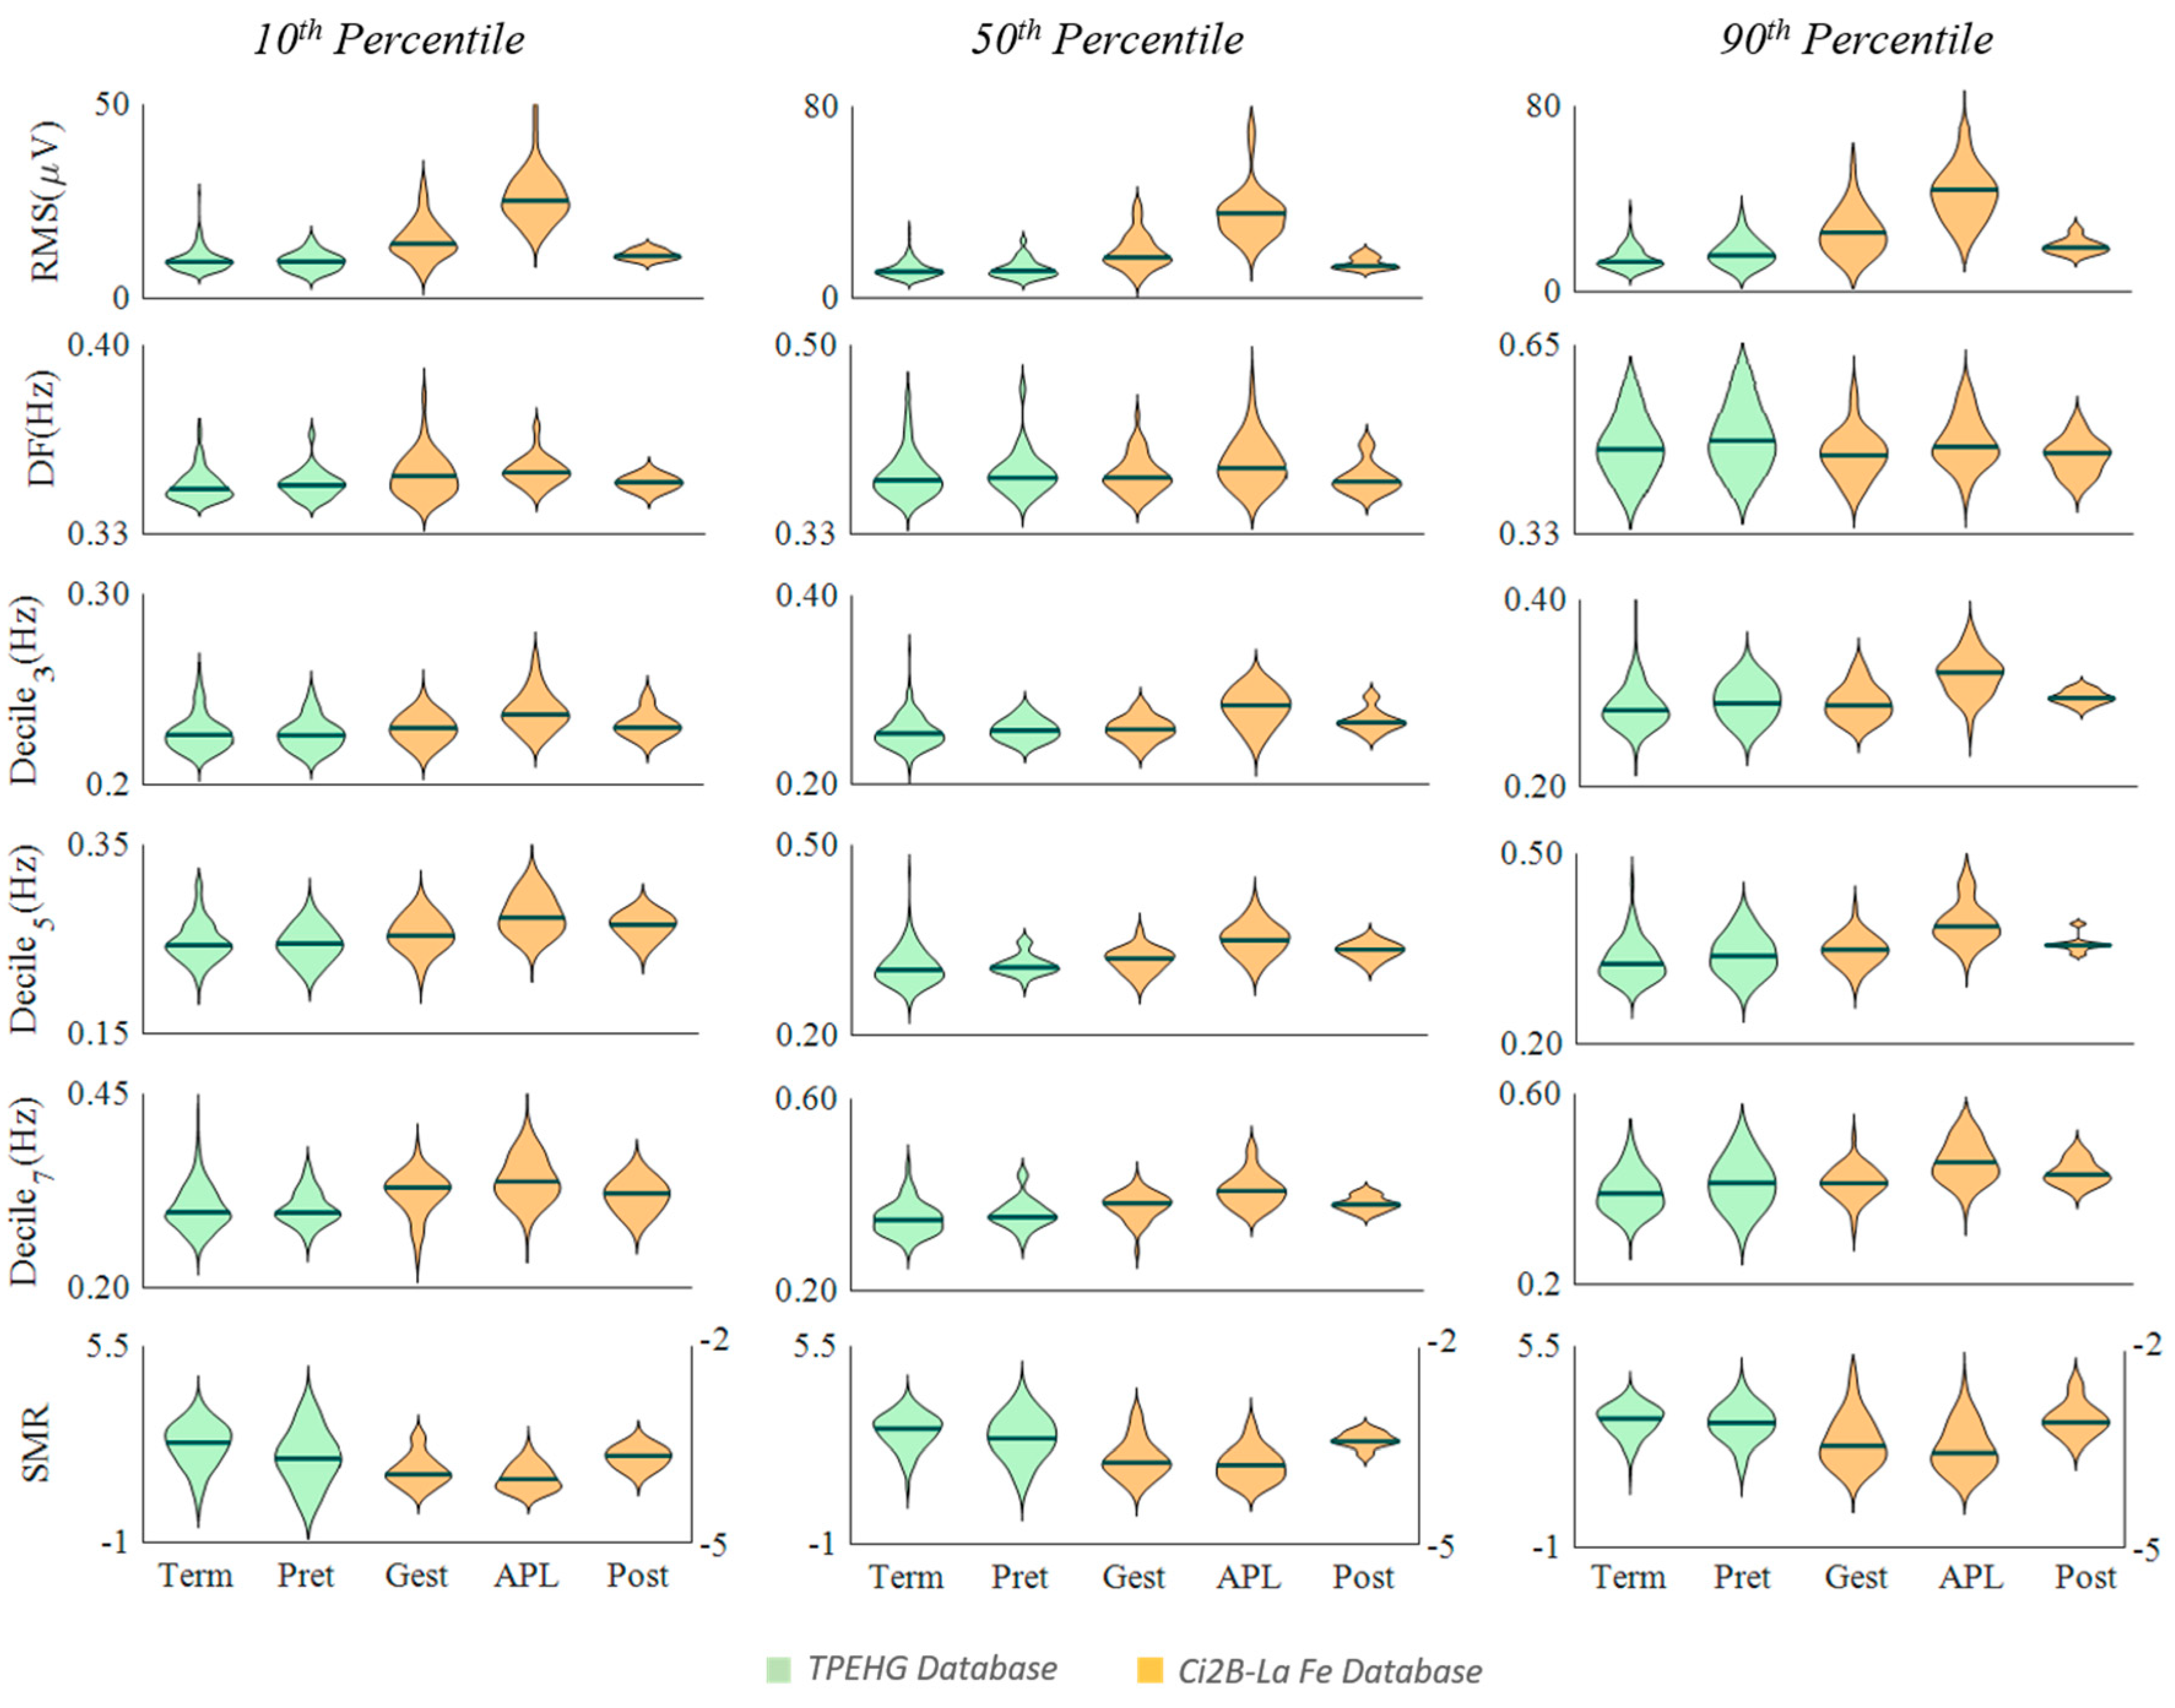
| Term vs. Preterm | Gest. vs. APL | Post. vs. APL | |||||||
|---|---|---|---|---|---|---|---|---|---|
| 10th | 50th | 90th | 10th | 50th | 90th | 10th | 50th | 90th | |
| RMS | 0.74 | 0.61 | 0.04 | <0.01 | <0.01 | <0.01 | <0.01 | <0.01 | <0.01 |
| DF | 0.99 | 0.68 | 0.46 | 0.47 | 0.08 | 0.02 | 0.56 | 0.14 | 0.14 |
| Dec3 | 0.97 | 0.11 | 0.04 | <0.01 | <0.01 | <0.01 | 0.04 | 0.04 | <0.01 |
| Dec5 | 0.86 | 0.16 | 0.07 | <0.01 | <0.01 | <0.01 | 0.19 | 0.04 | <0.01 |
| Dec7 | 0.88 | 0.07 | 0.06 | 0.01 | <0.01 | <0.01 | 0.06 | 0.01 | 0.10 |
| SMR | <0.01 | 0.13 | 0.36 | 0.02 | 0.13 | 0.17 | <0.01 | <0.01 | <0.01 |
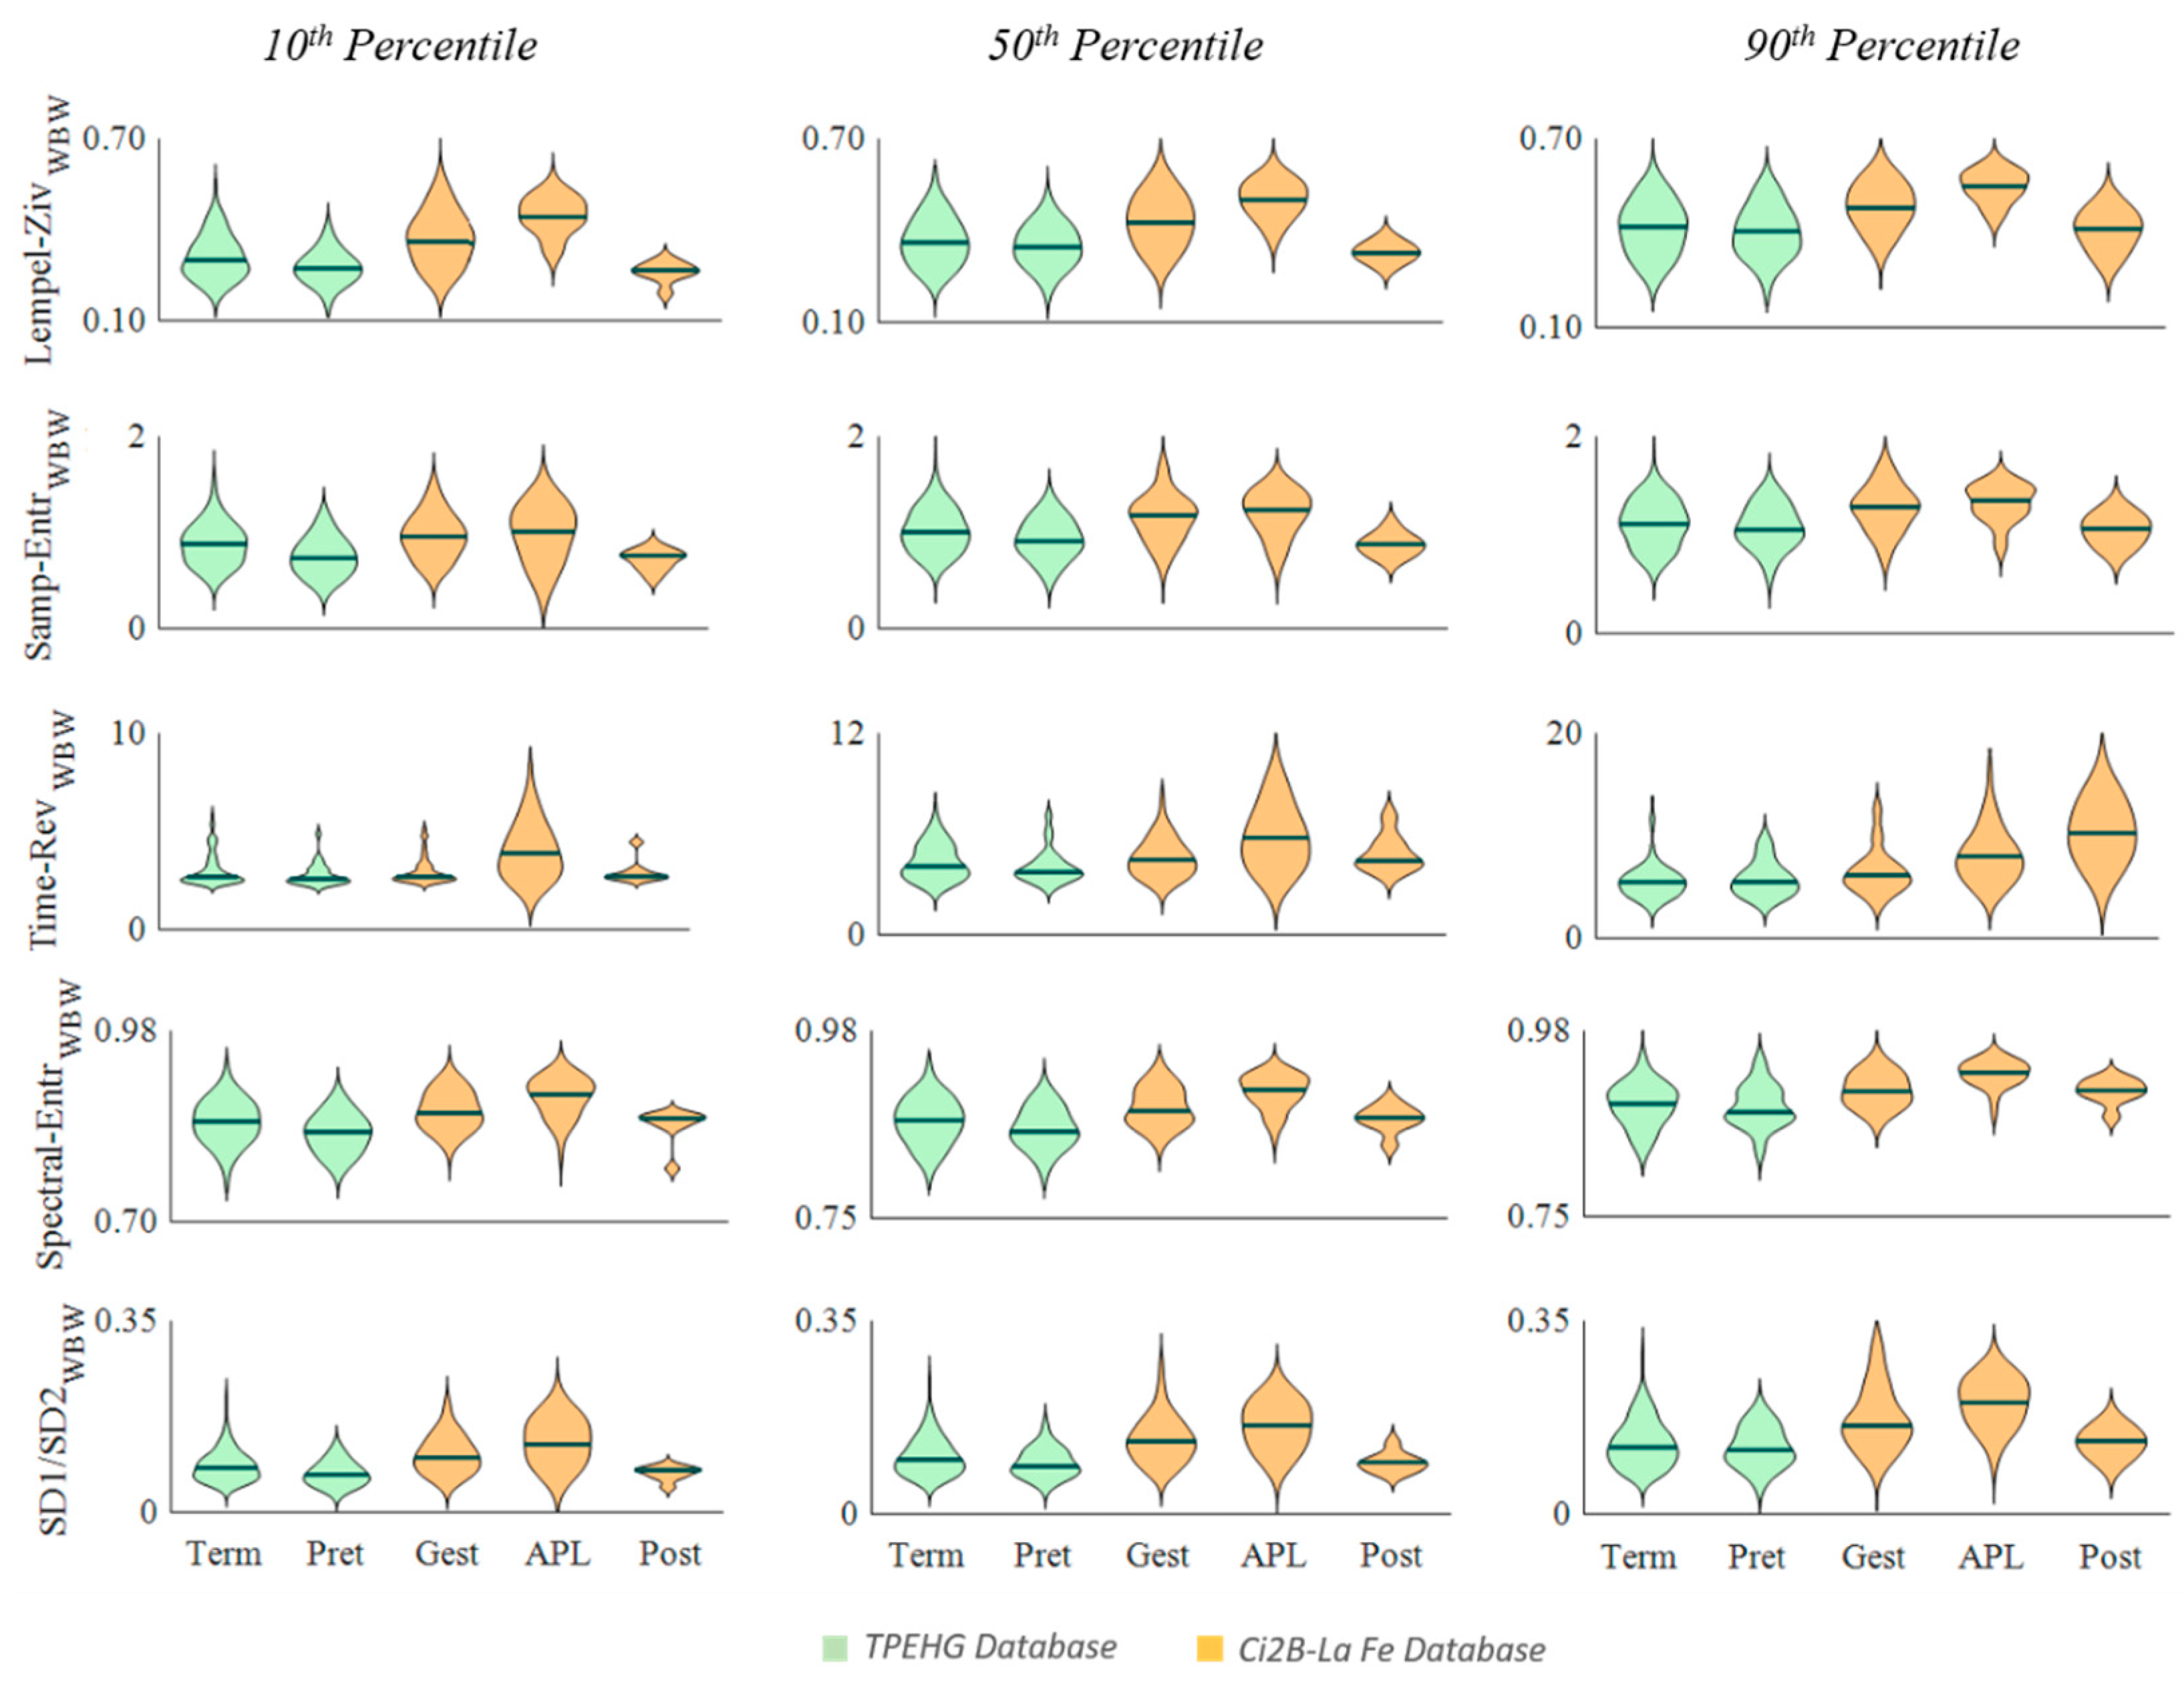
| Term vs. Preterm | Gest. vs. APL | Post. vs. APL | |||||||
|---|---|---|---|---|---|---|---|---|---|
| 10th | 50th | 90th | 10th | 50th | 90th | 10th | 50th | 90th | |
| Lempel-Ziv | 0.03 | 0.38 | 0.46 | <0.01 | <0.01 | <0.01 | <0.01 | <0.01 | <0.01 |
| Samp. Entropy | <0.01 | 0.07 | 0.49 | 0.43 | 0.17 | 0.21 | 0.01 | <0.01 | <0.01 |
| Time Rev | 0.09 | 0.11 | 0.98 | <0.01 | <0.01 | <0.01 | 0.04 | 0.22 | 0.11 |
| Spec. Entropy | <0.01 | 0.12 | 0.57 | <0.01 | <0.01 | <0.01 | <0.01 | <0.01 | <0.01 |
| RatioSD1/SD2 | <0.01 | 0.12 | 0.56 | <0.01 | <0.01 | <0.01 | <0.01 | <0.01 | <0.01 |
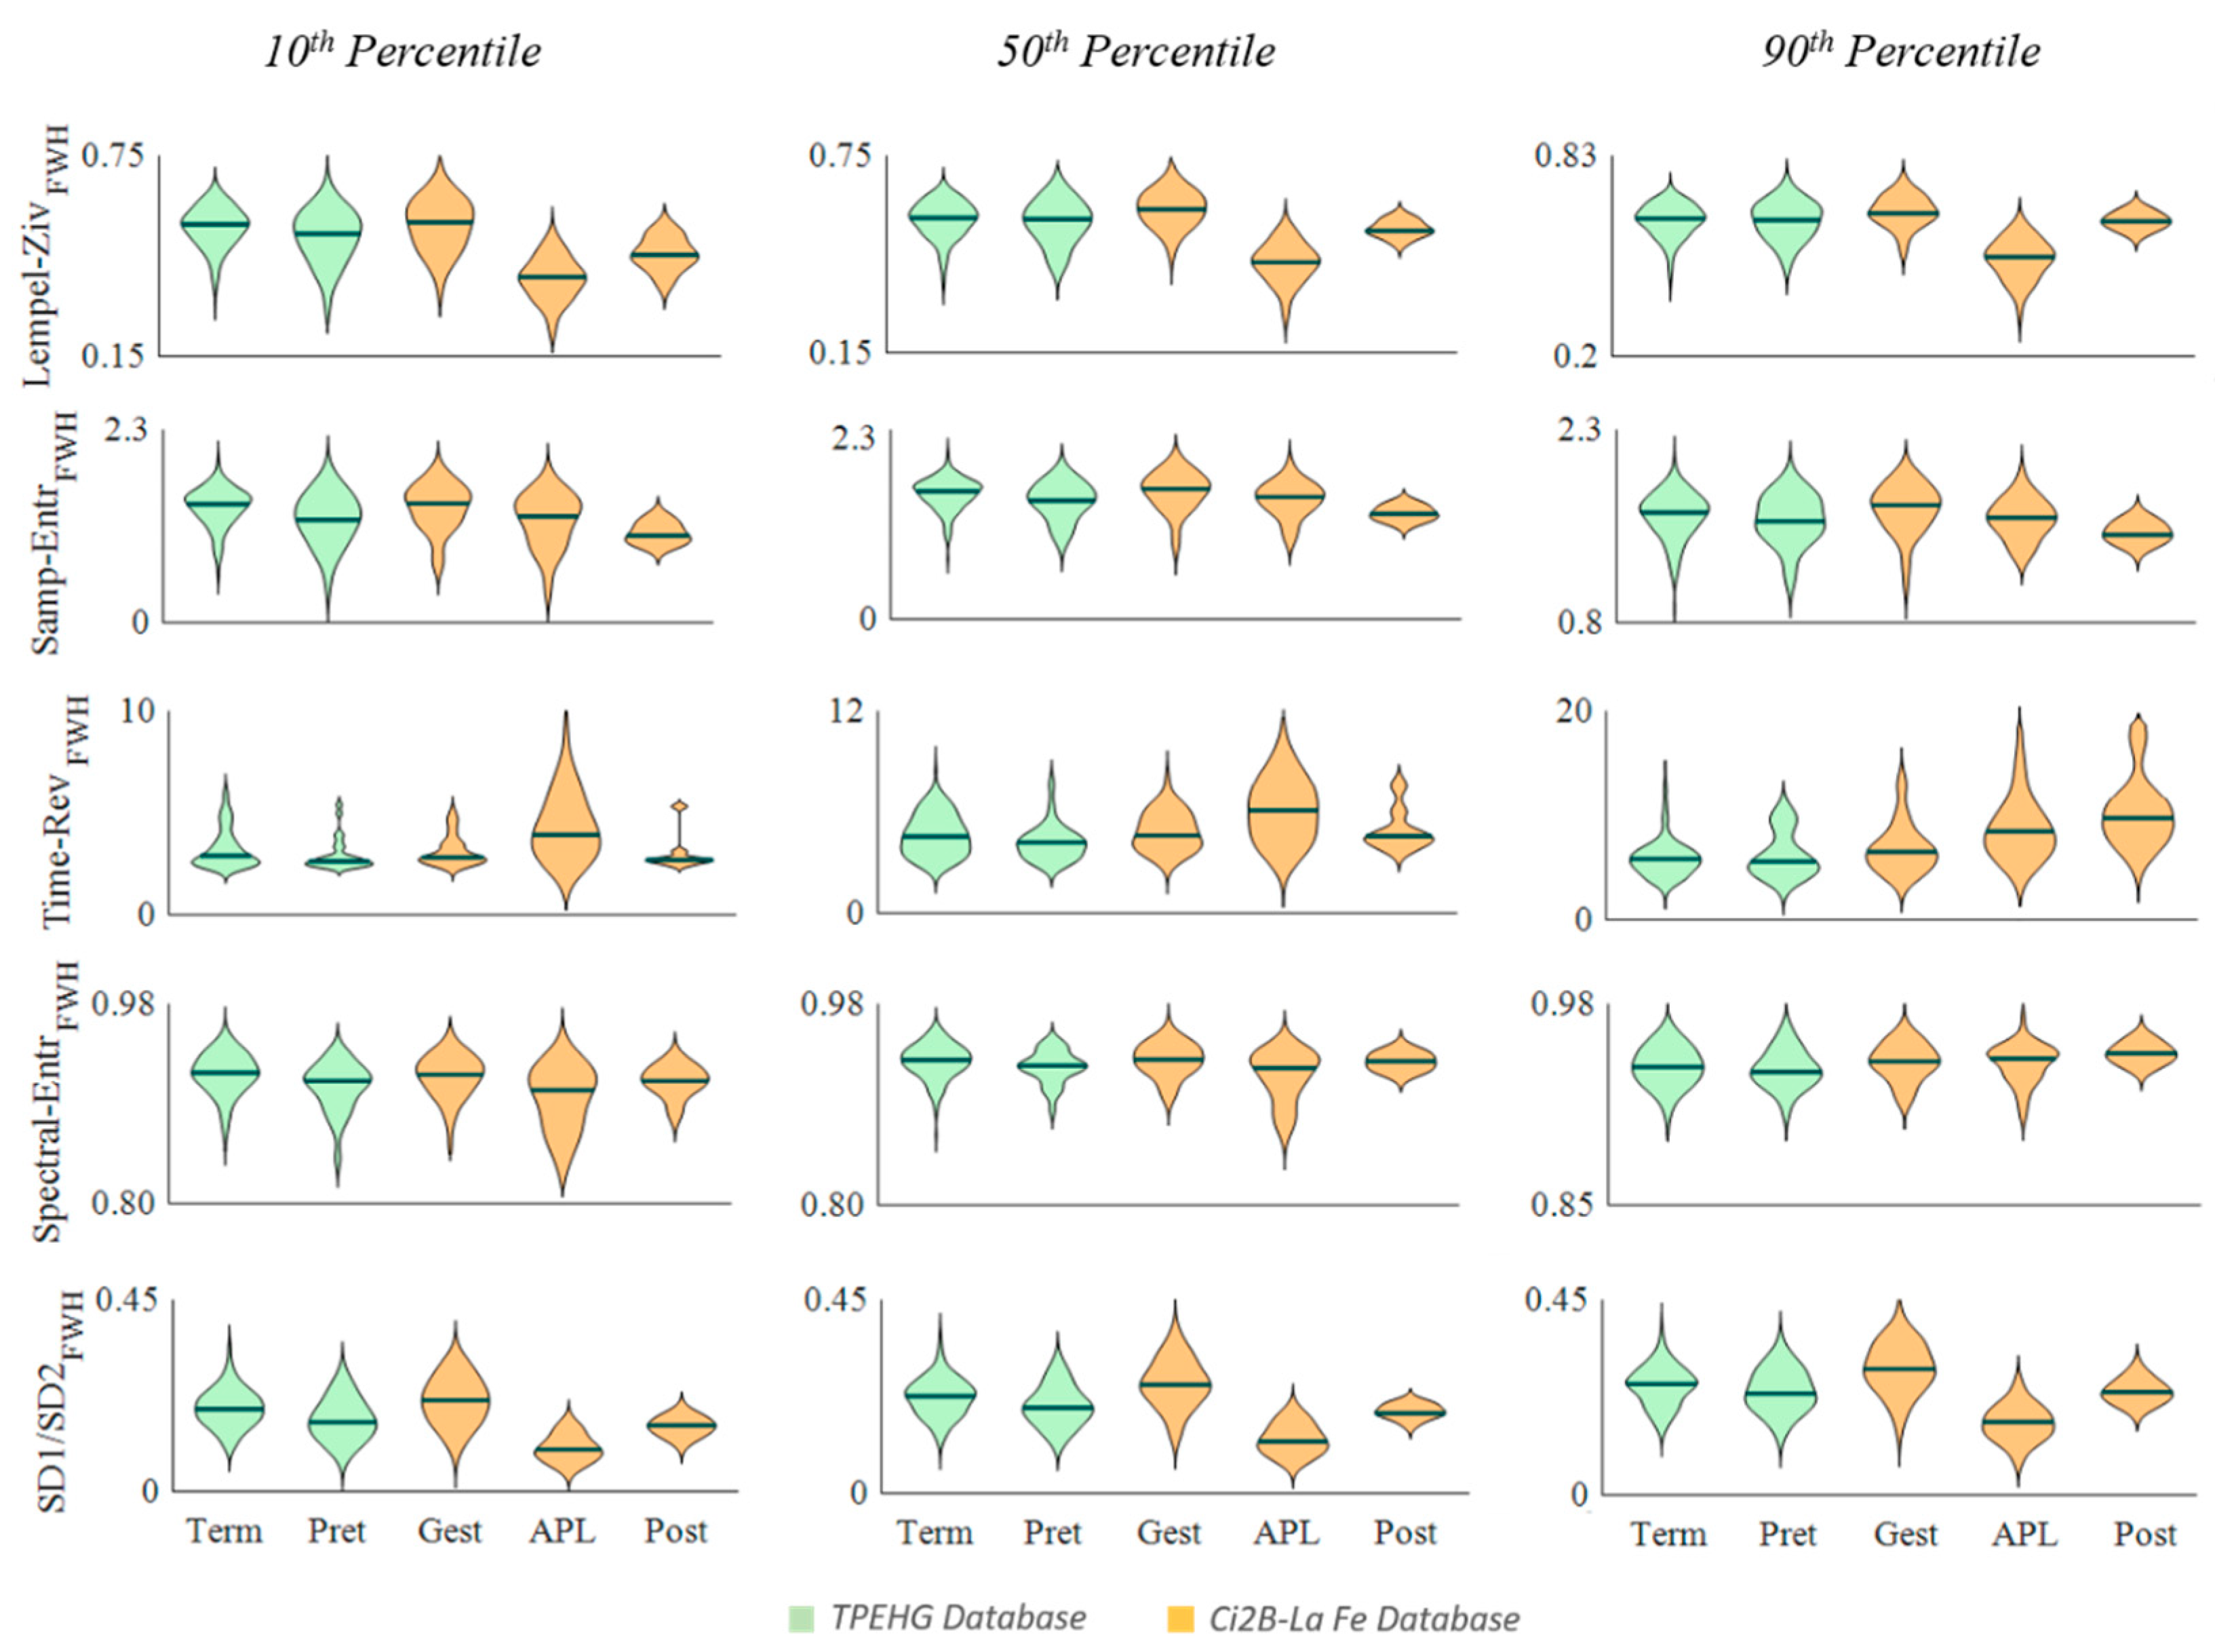
| Term vs. Preterm | Gest. vs. APL | Post. vs. APL | |||||||
|---|---|---|---|---|---|---|---|---|---|
| 10th | 50th | 90th | 10th | 50th | 90th | 10th | 50th | 90th | |
| Lempel-Ziv | 0.07 | 0.55 | 0.91 | <0.01 | <0.01 | <0.01 | <0.01 | <0.01 | <0.01 |
| Samp. Entropy | <0.01 | 0.05 | 0.37 | 0.01 | 0.01 | 0.01 | 0.12 | 0.010 | 0.04 |
| Time Rev | 0.09 | 0.04 | 0.76 | <0.01 | <0.01 | <0.01 | 0.01 | 0.08 | 0.07 |
| Spec. Entropy | <0.01 | <0.01 | 0.82 | <0.01 | <0.01 | 0.81 | 0.18 | 0.16 | 0.16 |
| RatioSD1/SD2 | <0.01 | 0.03 | 0.27 | <0.01 | <0.01 | <0.01 | <0.01 | <0.01 | <0.01 |
© 2020 by the authors. Licensee MDPI, Basel, Switzerland. This article is an open access article distributed under the terms and conditions of the Creative Commons Attribution (CC BY) license (http://creativecommons.org/licenses/by/4.0/).
Share and Cite
Mas-Cabo, J.; Ye-Lin, Y.; Garcia-Casado, J.; Díaz-Martinez, A.; Perales-Marin, A.; Monfort-Ortiz, R.; Roca-Prats, A.; López-Corral, Á.; Prats-Boluda, G. Robust Characterization of the Uterine Myoelectrical Activity in Different Obstetric Scenarios. Entropy 2020, 22, 743. https://0-doi-org.brum.beds.ac.uk/10.3390/e22070743
Mas-Cabo J, Ye-Lin Y, Garcia-Casado J, Díaz-Martinez A, Perales-Marin A, Monfort-Ortiz R, Roca-Prats A, López-Corral Á, Prats-Boluda G. Robust Characterization of the Uterine Myoelectrical Activity in Different Obstetric Scenarios. Entropy. 2020; 22(7):743. https://0-doi-org.brum.beds.ac.uk/10.3390/e22070743
Chicago/Turabian StyleMas-Cabo, Javier, Yiyao Ye-Lin, Javier Garcia-Casado, Alba Díaz-Martinez, Alfredo Perales-Marin, Rogelio Monfort-Ortiz, Alba Roca-Prats, Ángel López-Corral, and Gema Prats-Boluda. 2020. "Robust Characterization of the Uterine Myoelectrical Activity in Different Obstetric Scenarios" Entropy 22, no. 7: 743. https://0-doi-org.brum.beds.ac.uk/10.3390/e22070743