
Portfolio Optimization with a Mean–Absolute Deviation–Entropy Multi-Objective Model


1
Department of Physical and Mathematical Science, Faculty of Science, Kampar Campus, Universiti Tunku Abdul Rahman, Jalan Universiti, Bandar Barat, Kampar 31900, Perak, Malaysia
2
Department of Mathematical Sciences, Faculty of Science and Technology, Universiti Kebangsaan Malaysia UKM, Bangi 43600, Selangor, Malaysia
*
Authors to whom correspondence should be addressed.
Entropy 2021, 23(10), 1266; https://0-doi-org.brum.beds.ac.uk/10.3390/e23101266
Submission received: 31 August 2021
/
Revised: 23 September 2021
/
Accepted: 26 September 2021
/
Published: 28 September 2021
(This article belongs to the Section Multidisciplinary Applications)
Abstract
:Investors wish to obtain the best trade-off between the return and risk. In portfolio optimization, the mean-absolute deviation model has been used to achieve the target rate of return and minimize the risk. However, the maximization of entropy is not considered in the mean-absolute deviation model according to past studies. In fact, higher entropy values give higher portfolio diversifications, which can reduce portfolio risk. Therefore, this paper aims to propose a multi-objective optimization model, namely a mean-absolute deviation-entropy model for portfolio optimization by incorporating the maximization of entropy. In addition, the proposed model incorporates the optimal value of each objective function using a goal-programming approach. The objective functions of the proposed model are to maximize the mean return, minimize the absolute deviation and maximize the entropy of the portfolio. The proposed model is illustrated using returns of stocks of the Dow Jones Industrial Average that are listed in the New York Stock Exchange. This study will be of significant impact to investors because the results show that the proposed model outperforms the mean-absolute deviation model and the naive diversification strategy by giving higher a performance ratio. Furthermore, the proposed model generates higher portfolio mean returns than the MAD model and the naive diversification strategy. Investors will be able to generate a well-diversified portfolio in order to minimize unsystematic risk with the proposed model.
1. Introduction
Complex economic relations and models due to unprecedented events in the ever-evolving financial markets make estimating stock market returns and volatility become complex nonlinear relations, in need of advancements in mathematical models to adapt to changes in the financial markets and mental resources of the investors. The COVID-19 pandemic has led investors to demand portfolios that are resilient towards the disease.
Investors aim to minimize the risk as well as maximize the return in their portfolio investments. In past studies, portfolio management has been analyzed and solved with optimization models [1,2,3]. Markowitz [4] was the pioneer in portfolio optimization by introducing the mean-variance (MV) model to minimize the risk and achieve the investor’s mean return. In MV model, the risk and mean return of investors are measured with portfolio variance and portfolio mean return, respectively. The MV model has been studied in portfolio management according to past research [5,6,7,8,9].
Konno and Yamazaki [10] have introduced the mean-absolute deviation (MAD) model by using absolute deviation in replacement of variance as the portfolio risk measure, because the MV model assumes that the assets’ returns are normally distributed. Konno and Yamazaki [10] have studied the MAD model for the Tokyo stock market. The MAD model has been studied in portfolio optimization [11,12,13,14]. Zenios and Kang [11] have used mortgage-backed securities for portfolio optimization with the MAD model. Zenios [12] has investigated the MAD model for fixed-income securities. Konno [13] has studied the MAD model for small-scale funds. The MAD model has been studied for stock–bond portfolio optimization [14]. Erdas [15] has investigated the MAD model for the Borsa Istanbul 30 Index. Ghahtarani and Najafi [16] have studied the MAD model in portfolio optimization for investments. Kasenbacher et al. [17] have generated the optimal portfolio of stocks with the MAD model. However, the maximization of entropy is not considered in the MAD model of Konno and Yamazaki [10].
Entropy is an important element in portfolio selection [18]. Shannon [19] has introduced entropy as the uncertainty measure. An entropy-based portfolio is constructed based on Shannon entropy. Entropy is a wide measure of diversity [20,21]. According to the principle of maximum entropy, a higher value of entropy for the portfolio will give a higher portfolio diversification, which can reduce the unsystematic risk of the portfolio. Bera and Park [20] constructed a well-diversified portfolio based on the entropy measure for portfolio optimization. Jana et al. [21] incorporated entropy as an objective function in their optimization model, to increase the diversification degree of an optimal portfolio. According to Murialdo et al. [22], the entropy measure generates a high level of diversity and stability in portfolio selection.
Zhou et al. [18] conducted a review on the principles of entropy and their applications in finance, such as portfolio selection. Lu et al. [23] presented an optimization model based on the principle of entropy in portfolio investment. Li and Zhang [24] studied a mean-variance-entropy model by considering the level of diversification in the optimal portfolio. The mean return is measured by expected value, whereas the risk is measured by variance. Entropy is used to measure the level of diversification in the optimal portfolio. The results showed that the level of diversification had an effect on the optimal portfolio investment. The principle of maximum Shannon entropy has been incorporated into the portfolio-optimization model to improve the level of optimal diversification. Therefore, Shannon entropy is used to measure the level of diversification in portfolio selection. Olbryś and Ostrowski [25] introduced a market-depth indicator to investigate the market depth based on Shannon entropy. Other than achieving optimal diversification using a portfolio-optimization model, naive diversification is another investment strategy which aims to reduce the risk measure by forming an equally weighted portfolio, or naive 1/N portfolio, without using a mathematical model [26].
The maximization of entropy is not considered in the MAD model according to past studies. Therefore, this paper aims to propose a multi-objective optimization model, namely a mean-absolute deviation-entropy model, by incorporating the maximization of entropy to generate a well-diversified portfolio, to minimize unsystematic risk in portfolio optimization. Maximization of entropy increases the heterogeneity of the portfolio and makes asset allocation more practicable than models without entropy. The proposed model is a multi-objective model with three objective functions that maximizes the mean return, minimizes the absolute deviation and maximizes the entropy of the portfolio, which has not been studied by past researchers. Furthermore, the proposed multi-objective model incorporates the optimal values of each objective function and is solved using a goal-programming approach. Section 2 describes the research development, methodology of the MAD model and the proposed model. Section 3 presents the empirical results of this research and discussion. The conclusion is presented in the last section of the paper.
2. Methodology
2.1. Research Development
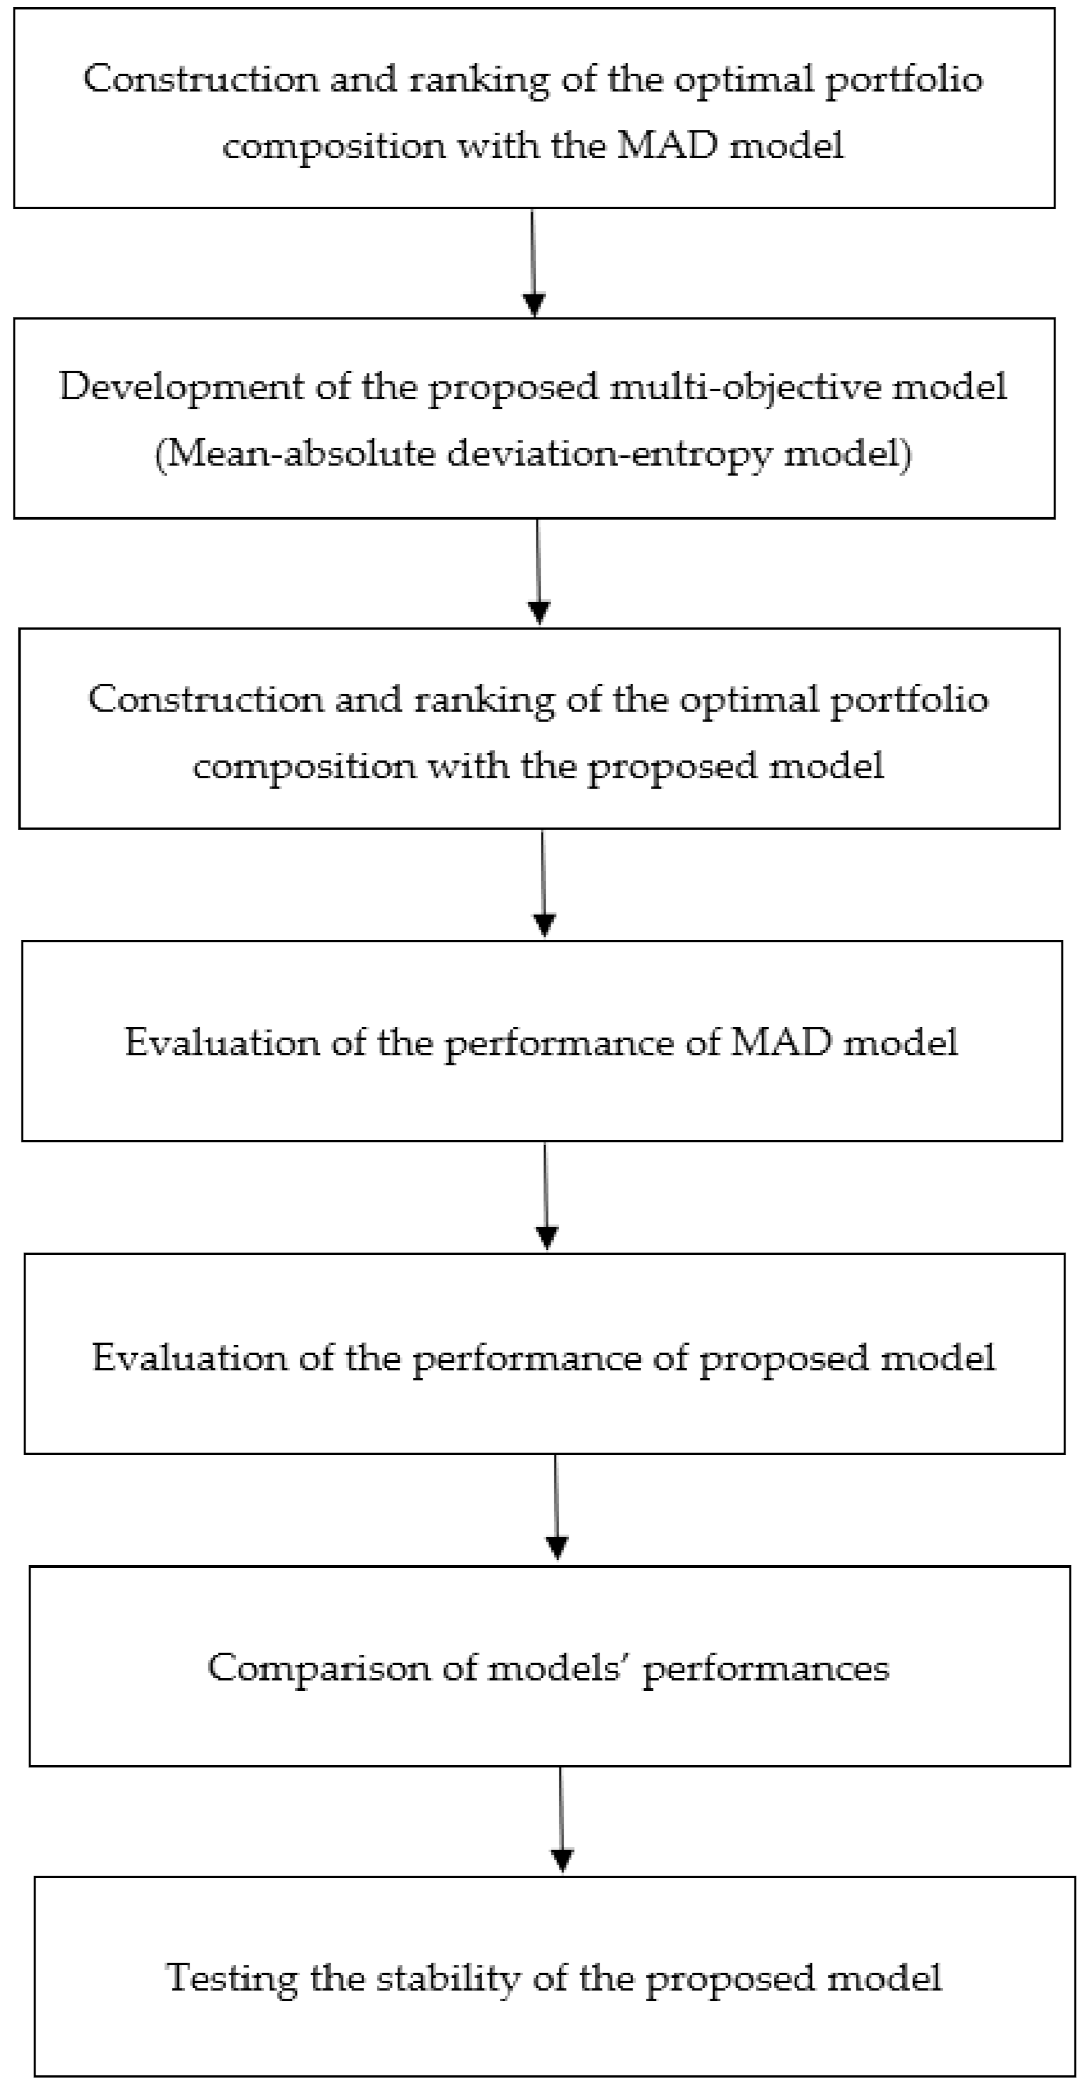
In this research, we propose a multi-objective model for portfolio optimization, namely mean-absolute deviation-entropy model. Figure 1 presents a flowchart of the research framework in this paper.
Based on Figure 1, the details of the research framework are presented as follows:
Step 1: Construction and ranking of the composition of the optimal portfolio with the MAD model. Firstly, the optimal portfolio is constructed with the MAD model. Next, the stocks are ranked based on weight, in descending order.
Step 2: Development of the proposed multi-objective model, namely a mean-absolute deviation-entropy model, by incorporating the maximization of entropy as an objective function. In addition, the proposed model incorporates the optimal value of each objective function using a goal-programming approach. The objective functions of the proposed model are to maximize the mean return, minimize the absolute deviation and maximize the entropy of the portfolio.
Step 3: Construction and ranking of the composition of the optimal portfolio with the proposed model. Firstly, the optimal portfolio is constructed with the proposed model. Next, the stocks are ranked based on weight, in descending order.
Step 4: Evaluation of the performance of the MAD model. The optimal portfolio performance of the MAD model is measured using performance ratio.
Step 5: Evaluation of the performance of the proposed model. The optimal portfolio performance of the proposed model is measured using performance ratio.
Step 6: Comparison of the models’ performances. The optimal portfolio performance among the MAD model, proposed model and benchmark naive diversification strategy, are compared using performance ratio.
Step 7: Testing the stability of the proposed model. Simulation analyses are performed on the portfolio return of the MAD model, proposed model and the naive diversification strategy using bootstrap simulation. Based on the simulation analyses, the optimal portfolio performance among the MAD model, proposed model and the naive diversification strategy are compared using performance ratio.
The MAD model, proposed model and the naive diversification strategy are tested with a numerical example that consists of weekly returns of stocks of the Dow Jones Industrial Average (DJIA), which are listed in the New York Stock Exchange (NYSE), by comparing the performance of the optimal portfolio for the two periods, which are January 2016–December 2019 (before the COVID-19 pandemic period) and January 2020–March 2021 (within the COVID-19 pandemic period). The returns of stocks of the DJIA have been used as data in studies on portfolio optimization by past researchers [27,28,29].
The methodologies of the MAD model and the proposed model are presented in Section 2.2 and Section 2.3, respectively. Table 1 presents the symbols of the MAD model and the proposed model used in this study.
2.2. Mean-Absolute Deviation Model
Konno and Yamazaki [10] have proposed the absolute-deviation risk function, as shown in Equation (1), to replace the standard-deviation risk function, , of Markowitz [4].
Minimizing is equivalent to minimizing if are multivariate and normally distributed, leading to the following MAD model:
subject to
In the MAD model, the objective function is to minimize the absolute deviation of the portfolio. can be approximated as follows:
Denoting
Assume to be the realization of random variable during period t (t = 1,2,...,T).
The model (2)–(5) converts to the following model:
The model above [(8), (9), (4), (5)] is equivalent to the linear programming model as shown below:
According to Konno and Yamazaki [10], short sale is not allowed for the MAD model as shown in Equation (5).
2.3. Proposed Mean-Absolute Deviation-Entropy Model
Shannon [19] has introduced entropy, , as the uncertainty measure, as shown in Equation (13).
The main advantage of entropy is to generate a well-diversified portfolio. As shown in Equation (13), the entropy function is a concave function of the portfolio weights , which has its maximum value lnn, when for Therefore, due to this property, entropy is a good indicator of diversity in a probability distribution for generation of a well-diversified portfolio.
Another advantage of the principle of maximum entropy is the prevention of extreme weight on asset allocation due to a very small number of assets in portfolio selection. For the extreme case, according to Equation (13), the entropy function achieves the minimum value 0, when and , for This implies that the entropy achieves the minimum value 0 when only one asset is selected in the portfolio. Therefore, a higher value of the entropy measure for portfolio weights will give higher portfolio diversification. Diversification can reduce unsystematic risk in the portfolio.
Additionally, the incorporation of entropy as an objective function in the optimization model can increase the diversification degree of the optimal portfolio. A multi-objective optimization model, namely mean-absolute deviation-entropy model is proposed in this section by incorporating the maximization of entropy. This is because the incorporation of entropy can diversify the allocation of various assets in portfolio selection. The proposed multi-objective optimization model consists of three objective functions that focus on the mean return, absolute deviation and entropy of the portfolio. The three objective functions of the proposed model are to maximize the mean return, minimize the absolute deviation and maximize the entropy of the portfolio. In addition, the proposed multi-objective optimization model incorporates the optimal value of each objective function and is solved using a goal-programming approach. This is because the goal-programming approach can solve multi-objective problems [30,31,32]. The proposed model is formulated as follows:
subject to
The optimal value for portfolio mean return, R*, can be obtained by solving the following model.
The optimal value for portfolio absolute deviation, W*, can be determined by solving the following model.
Then, the optimal values and are substituted into the following model based on the goal-programming approach:
subject to
The target value for portfolio entropy is set as lnn, because it is the maximum value of portfolio entropy. The objective function of the proposed model is to minimize deviations from the optimal values , and target value, lnn using a goal-programming approach.
Short sale is not allowed for the proposed model as shown in Equation (18). This is because the proposed model is developed based on the MAD model [10] and the entropy that has been introduced by Shannon [19]. Both the MAD model and entropy function require positive weights of assets as shown in Equations (5) and (13), respectively. These are the limitations of the proposed model.
2.4. Model Performance
The performance of the model is measured with performance ratio. The performance ratio is measured based on the mean-absolute deviation ratio [10] as shown in Equation (25). Higher performance ratio indicates higher performance of the model.
The computational works of the MAD model and the proposed model are performed using LINGO software. The performance of the optimal portfolio for the MAD model, the proposed model and benchmark naive diversification strategy (1/N portfolio) are compared for the two periods which are January 2016–December 2019 (before the COVID-19 pandemic period) and January 2020–March 2021 (within the COVID-19 pandemic period). The January 2016–December 2019 period (before the COVID-19 pandemic period) is denoted by D1 period, while the January 2020–March 2021 period (within the COVID-19 pandemic period) is denoted by D2 period.
2.5. Bootstrap Simulation
In this study, we test the stability of the proposed model using bootstrap simulation [33,34]. Bootstrap simulation is an important financial tool in portfolio optimization [34,35]. We simulate the portfolio return of the proposed model, the MAD model and the naive diversification strategy (1/N portfolio). Bootstrapping is repeated 5000 times for the tested D1 period and D2 period in this study with R software. Based on the simulation analyses, the performance of the optimal portfolios among the MAD model, the proposed model and the naive diversification strategy are compared using performance ratio.
3. Results and Discussion
3.1. Descriptive Statistics of the Returns of Stocks
Table 2 displays descriptive statistics of the returns of stocks of the DJIA that are used as the data of this study.
As shown in Table 2, the descriptive statistics of returns of stocks which are mean, standard deviation, skewness and kurtosis, are presented. AAPL gives the highest mean (0.0063) while WBA gives the lowest mean (−0.0010). In addition, BA has the highest standard deviation (0.0775), whereas PG has the lowest standard deviation (0.0249). Furthermore, BA exhibits the highest skewness (2.1565), while KO exhibits the lowest skewness (−1.5923). Moreover, BA shows the highest kurtosis (31.7449), whereas AMGN shows the lowest kurtosis (0.5722). This implies that the mean, standard deviation, skewness and kurtosis of the returns of stocks are different.
3.2. Optimal Portfolio Composition
Table 3 presents the composition and ranking of stocks in the optimal portfolio that was constructed with the MAD model for the D1 period and D2 period.
As presented in Table 3, PG is ranked the highest because it gives the largest weight to the portfolio composition using the MAD model for the D1 period. Conversely, VZ is ranked the lowest as it gives the smallest weight to the portfolio composition using the MAD model for the D1 period.
For the D2 period, VZ is ranked the highest since it gives the largest weight to the portfolio composition using the MAD model. In contrast, JNJ is ranked the lowest as it gives the smallest weight to the portfolio composition using the MAD model for the D2 period.
Table 4 presents the composition and ranking of stocks in the optimal portfolio that was constructed with the proposed mean-absolute deviation-entropy model for the D1 period and D2 period.
Based on Table 4, MSFT is ranked the highest because it gives the largest weight to the portfolio composition using the proposed model for the D1 period. In contrast, WBA is ranked the lowest as it gives the smallest weight to the portfolio composition using the proposed model for the D1 period.
According to Table 4, MSFT is ranked the highest because it gives the largest weight to the portfolio composition using the proposed model for the D2 period. Conversely, BA is ranked the lowest as it gives the smallest weight to the portfolio composition using the proposed model for the D2 period.
The MAD model (Table 3) and the proposed model (Table 4) led to different compositions of the optimal portfolio in both the D1 period and the D2 period. This implies that the incorporation of entropy in the proposed model will change the optimal portfolio composition. It shows that the proposed model is able to generate a well-diversified portfolio. This is because the proposed model gives a higher portfolio entropy value than the MAD model for the D1 period and the D2 period. Based on Equation (13), the portfolio entropy values of the MAD model and the proposed model are 2.2156 and 2.7054, respectively, for the D1 period. Furthermore, the portfolio entropy values of the MAD model and the proposed model are 1.6357 and 2.5124, respectively, for the D2 period.
Table 3 indicates that the ranking of all stocks in the optimal portfolio of the MAD model for the D1 period and D2 period are different. The symbol—implies that the stock is not selected in the optimal portfolio of the MAD model for the D1 period and D2 period. AAPL, CAT and JNJ are not selected in the optimal portfolio of the MAD model for the D1 period. On the other hand, AXP, BA, CVX, KO, JPM, MRK, PG, CRM and UNH are not selected in the optimal portfolio of the MAD model for the D2 period. Furthermore, Table 4 indicates that the ranking of all stocks in the optimal portfolio of the proposed model for the D1 period and D2 period are different, except for MSFT.
3.3. Model Performance
Table 5 shows the performance comparison of the optimal portfolios among the MAD model, the proposed model and the naive diversification strategy for the D1 period.
Based on Table 5, the MAD model generates the portfolio mean return at 0.3000% for the D1 period. Furthermore, the portfolio performance ratio of the MAD model is 0.2970. The performance ratio is measured based on the mean-absolute deviation ratio.
On the other hand, the proposed model generates the portfolio mean return at 0.4000% for the D1 period. In addition, the portfolio performance ratio of the proposed model is 0.3254.
Besides that, the naive diversification strategy generates the portfolio mean return at 0.2425% for the D1 period. Moreover, the portfolio performance ratio of the naive diversification strategy is 0.2245.
Table 6 shows the performance comparison of the optimal portfolios among the MAD model, the proposed model and the naive diversification strategy for the D2 period.
Based on Table 6, the MAD model generates the portfolio mean return at 0.3400% for the D2 period. Furthermore, the portfolio performance ratio of the MAD model is 0.1762. The performance ratio is measured based on the mean-absolute deviation ratio.
On the other hand, the proposed model generates the portfolio mean return at 0.4400% for the D2 period. In addition, the portfolio performance ratio of the proposed model is 0.2041.
Finally, the naive diversification strategy generates the portfolio mean return at 0.3185% for the D2 period. Moreover, the portfolio performance ratio of the naive diversification strategy is 0.1313.
The proposed model outperforms the MAD model and the naive diversification strategy by giving a higher performance ratio for the D1 period (Table 5) and the D2 period (Table 6). In addition, the proposed model generates higher portfolio mean return than the MAD model and the naive diversification strategy for both periods. This is because the proposed model is a multi-objective model that maximizes the mean return, minimizes the absolute deviation and maximizes the entropy of the portfolio. Moreover, the proposed model incorporates the optimal value of each objective function and is solved using a goal-programming approach.
3.4. Simulation Analyses
Table 7 presents the bootstrap simulation analysis on the portfolio return of the MAD model, proposed model and the naive diversification strategy for the D1 period.
As shown in Table 7, the MAD model generates the portfolio mean return at 0.2984% with a 95% confidence interval of 0.2955–0.3012% for the D1 period. The portfolio performance ratio of the MAD model is 0.2909. The proposed model generates the portfolio mean return at 0.4011% with a 95% confidence interval of 0.3979–0.4043% for the D1 period. The portfolio performance ratio of the proposed model is 0.3798. On the other hand, the naive diversification strategy generates the portfolio mean return at 0.2445% with a 95% confidence interval of 0.2416–0.2474% for the D1 period. The portfolio performance ratio of the naive diversification strategy is 0.2340.
The simulation analysis shows that the proposed model outperforms the MAD model and the naive diversification strategy by giving a higher performance ratio for the D1 period. In addition, the proposed model generates a higher portfolio mean return than the MAD model and the naive diversification strategy for the D1 period. The simulation analysis is consistent with the results for actual portfolio mean return and performance ratio, which are presented in Table 5.
Table 8 presents the bootstrap simulation analysis on the portfolio return of the MAD model, proposed model and the naive diversification strategy for the D2 period.
Based on Table 8, the MAD model generates the portfolio mean return at 0.3507% with a 95% confidence interval of 0.3417–0.3597% for the D2 period. The portfolio performance ratio of the MAD model is 0.1927. The proposed model generates the portfolio mean return at 0.4341% with a 95% confidence interval of 0.4234–0.4447% for the D2 period. The portfolio performance ratio of the proposed model is 0.2242. In contrast, the naive diversification strategy generates the portfolio mean return at 0.3073% with a 95% confidence interval of 0.2947–0.3199% for the D2 period. The portfolio performance ratio of the naive diversification strategy is 0.1635.
Based on the simulation analysis, the proposed model outperforms the MAD model and the naive diversification strategy by giving a higher performance ratio for the D2 period. Furthermore, the proposed model generates a higher portfolio mean return than the MAD model and the naive diversification strategy for the D2 period. This shows that the simulation analysis is consistent with the results for actual portfolio mean return and performance ratio, which are presented in Table 6.
The simulation analyses show that proposed model generates a higher portfolio mean return and a higher performance ratio than the MAD model, as well as the naive diversification strategy, consistently for both periods of study, which are before the COVID-19 pandemic period (Table 7) and within the COVID-19 pandemic period (Table 8). This implies that the proposed model is robust and stable for portfolio investment. This is because the proposed model is a multi-objective model that maximizes the mean return, minimizes the absolute deviation and maximizes the entropy of the portfolio. Furthermore, the proposed model incorporates the optimal value of each objective function and is solved using a goal-programming approach.
4. Conclusions
In conclusion, a multi-objective optimization model, namely a mean-absolute deviation-entropy model is proposed in this paper by incorporating the entropy as well as the optimal value of each objective function using a goal-programming approach. The results indicate that the MAD model and the proposed model give different portfolio composition for both periods of study, which are before the COVID-19 pandemic period as well as within the COVID-19 pandemic period. In addition, the results show that the proposed model is able to generate well-diversified portfolios consistently, because the proposed model gives a higher portfolio entropy value than the MAD model for both periods of study. The incorporation of entropy in the proposed model will change the optimal portfolio composition in order to generate well-diversified portfolio.
The proposed model outperforms the MAD model and the naive diversification strategy by giving higher performance ratios consistently for both periods of study. Besides that, the proposed model generates higher portfolio mean returns than the MAD model and the naive diversification strategy consistently, both before the COVID-19 pandemic period as well as within the COVID-19 pandemic period. Based on the simulation analyses, the proposed model generates higher portfolio mean returns and higher performance ratios than the MAD model, as well as the naive diversification strategy, consistently for both periods of study. This implies that the proposed model is robust and stable for portfolio investment.
As presented in this paper, the proposed mean-absolute deviation-entropy model is superior to both the MAD model and the naive diversification strategy, as it gives higher performance ratios and higher portfolio mean returns. This study will contribute to the portfolio management of investors. This is because investors will be able to maximize the portfolio mean return, minimize the portfolio absolute deviation and maximize the portfolio entropy, therefore generating well-diversified portfolios and reducing the unsystematic risk of the portfolios using the proposed model. Portfolio optimization with the proposed model should be extended to the stock market of the other countries for future research. This proposed model can be applied using data from other markets, be it developed, emerging, or developing markets, with promising results, benefiting investors in various countries.
Author Contributions
Conceptualization, W.S.L. and W.H.L.; methodology, W.S.L. and W.H.L.; software, W.S.L. and W.H.L.; validation, W.H.L. and S.H.J.; formal analysis, W.S.L. and W.H.L.; investigation, W.S.L., W.H.L. and S.H.J.; resources, W.S.L. and S.H.J.; data curation, W.S.L. and W.H.L.; writing—original draft preparation, W.S.L., W.H.L. and S.H.J.; writing—review and editing, W.S.L., W.H.L. and S.H.J.; supervision, W.S.L. and S.H.J. All authors have read and agreed to the published version of the manuscript.
Funding
This research was funded by research grant provided by Universiti Kebangsaan Malaysia, GUP-2019-038.
Institutional Review Board Statement
Not applicable.
Informed Consent Statement
Not applicable.
Acknowledgments
This study is supported by Universiti Kebangsaan Malaysia grant GUP-2019-038 and Universiti Tunku Abdul Rahman.
Conflicts of Interest
The authors declare no conflict of interest.
References
- Lim, A.E.B.; Wimonkittiwat, P. Dynamic portfolio selection with market impact costs. Oper. Res. Lett. 2014, 42, 299–306. [Google Scholar] [CrossRef] [Green Version]
- Choi, B.G.; Rujeerapaiboon, N.; Jiang, R. Multi-period portfolio optimization: Translation of autocorrelation risk to excess variance. Oper. Res. Lett. 2016, 44, 801–807. [Google Scholar] [CrossRef] [Green Version]
- Sun, Y.F.; Aw, G.; Loxton, R.; Teo, K.L. Chance-constrained optimization for pension fund portfolios in the presence of default risk. Eur. J. Oper. Res. 2017, 256, 205–214. [Google Scholar] [CrossRef] [Green Version]
- Markowitz, H. Portfolio Selection. J. Financ. 1952, 7, 77–91. [Google Scholar] [CrossRef]
- Kuzmanovic, M.; Nikolic, D.M.; Nikolic, N. Preference based portfolio for private investors: Discrete choice analysis approach. Mathematics 2020, 8, 30. [Google Scholar] [CrossRef] [Green Version]
- Xiao, H.; Ren, T.; Zhou, Z. Time-consistent strategies for the generalized multiperiod mean-variance portfolio optimization considering benchmark orientation. Mathematics 2019, 7, 723. [Google Scholar] [CrossRef] [Green Version]
- Ivanova, M.; Dospatliev, L.K. Application of Markowitz portfolio optimization on Bulgarian stock market from 2013 to 2016. Int. J. Pure Appl. Math. 2017, 117, 291–307. [Google Scholar] [CrossRef] [Green Version]
- Khan, A.H.; Cao, X.; Katsikis, V.N.; Stanimirović, P.; Brajević, I.; Li, S.; Kadry, S.; Nam, Y. Optimal portfolio management for engineering problems using nonconvex cardinality constraint: A computing perspective. IEEE Access 2020, 8, 57437–57450. [Google Scholar] [CrossRef]
- Chen, W.; Wang, Y.; Gupta, P.; Mehlawat, M.K. A novel hybrid heuristic algorithm for a new uncertain mean-variance-skewness portfolio selection model with real constraints. Appl. Intell. 2018, 48, 2996–3018. [Google Scholar] [CrossRef]
- Konno, H.; Yamazaki, H. Mean-absolute deviation portfolio optimization model and its applications to Tokyo stock market. Manag. Sci. 1991, 37, 519–531. [Google Scholar] [CrossRef] [Green Version]
- Zenios, S.A.; Kang, P. Mean-absolute deviation portfolio optimization for mortgage-backed securities. Ann. Oper. Res. 1993, 45, 433–450. [Google Scholar] [CrossRef]
- Zenios, S.A. Asset/liability management under uncertainty for fixed-income securities. Ann. Oper. Res. 1995, 59, 77–97. [Google Scholar] [CrossRef]
- Konno, H. Portfolio optimization of small scale fund using mean-absolute deviation model. Int. J. Theor. Appl. Financ. 2003, 6, 403–418. [Google Scholar] [CrossRef]
- Konno, H.; Kobayashi, K. An integrated stock-bond portfolio optimization model. J. Econ. Dyn. Control. 1997, 21, 1427–1444. [Google Scholar] [CrossRef]
- Erdas, M.L. Developing a portfolio optimization model based on linear programming under certain constraints: An application on Borsa Istanbul 30 Index. Tesam Acad. Derg. 2020, 7, 115–141. [Google Scholar] [CrossRef]
- Ghahtarani, A.; Najafi, A.A. Robust optimization in portfolio selection by m-MAD model approach. Econ. Comput. Econ. Cybern. Stud. Res. 2018, 52, 279–291. [Google Scholar] [CrossRef]
- Kasenbacher, G.; Lee, J.; Euchukanonchai, K. Mean-variance vs. mean-absolute deviation: A performance comparison of portfolio optimization models. Thesis 2017, 1, 22. [Google Scholar] [CrossRef]
- Zhou, R.; Cai, R.; Tong, G. Applications of entropy in finance: A review. Entropy 2013, 15, 4909–4931. [Google Scholar] [CrossRef]
- Shannon, C.E. A Mathematical Theory of Communication. Bell Syst. Tech. J. 1948, 27, 379–423. [Google Scholar] [CrossRef] [Green Version]
- Bera, A.K.; Park, S.Y. Optimal portfolio diversification using the maximum entropy principle. Econom. Rev. 2008, 27, 484–512. [Google Scholar] [CrossRef]
- Jana, P.; Roy, T.K.; Mazumder, S.K. Multi-objective possibilistic model for portfolio selection with transaction cost. J. Comput. Appl. Math. 2009, 228, 188–196. [Google Scholar] [CrossRef] [Green Version]
- Murialdo, P.; Ponta, L.; Carbone, A. Inferring multi-period optimal portfolios via detrending moving average cluster entropy. EPL 2021, 133, 1–8. [Google Scholar] [CrossRef]
- Lu, S.; Zhang, N.; Jia, L. A multiobjective multiperiod mean—semientropy—skewness model for uncertain portfolio selection. Appl. Intell. 2021, 51, 5233–5258. [Google Scholar] [CrossRef]
- Li, B.; Zhang, R. A new mean-variance-entropy model for uncertain portfolio optimization with liquidity and diversification. Chaos Solitons Fractals 2021, 146, 1–6. [Google Scholar] [CrossRef]
- Olbryś, J.; Ostrowski, K. An entropy-based approach to measurement of stock market depth. Entropy 2021, 23, 568. [Google Scholar] [CrossRef] [PubMed]
- DeMiguel, V.; Garlappi, L.; Uppal, R. Optimal versus naive diversification: How inefficient is the 1/N portfolio strategy? Rev. Financ. Stud. 2009, 22, 1915–1953. [Google Scholar] [CrossRef] [Green Version]
- Vaezi, F.; Sadjadi, S.J.; Makui, A. A portfolio selection model based on the knapsack problem under uncertainty. PLoS ONE 2019, 14, 1–19. [Google Scholar] [CrossRef] [Green Version]
- Hu, Y.; Lindquist, W.B.; Rachev, S.T. Portfolio optimization constrained by performance attribution. J. Risk Financ. Manag. 2021, 14, 201. [Google Scholar] [CrossRef]
- Glabadanidis, P. Portfolio strategies to track and outperform a benchmark. J. Risk Financ. Manag. 2020, 13, 171. [Google Scholar] [CrossRef]
- Chunhachinda, P.; Dandapani, K.; Hamid, S.; Prakash, A.J. Portfolio selection and skewness: Evidence from international stock markets. J. Bank. Financ. 1997, 21, 143–167. [Google Scholar] [CrossRef]
- Prakash, A.J.; Chang, C.H.; Pactwa, T.E. Selecting a portfolio with skewness: Recent evidence from US, European, and Latin American equity markets. J. Bank. Financ. 2003, 27, 1375–1390. [Google Scholar] [CrossRef]
- Naqvi, B.; Mirza, N.; Naqvi, W.A.; Rizvi, S.K.A. Portfolio optimization with higher moments of risk at the Pakistan Stock Exchange. Econ. Res. Ekon. Istraz. 2017, 30, 1594–1610. [Google Scholar] [CrossRef] [Green Version]
- Efron, B. Bootstrap methods: Another look at the Jackknife. Ann. Stat. 1979, 7, 1–6. [Google Scholar] [CrossRef]
- Grootveld, H.; Hallerbach, W. Variance as downside risk: Is there really that much difference? Eur. J. Oper. Res. 1999, 114, 304–319. [Google Scholar] [CrossRef]
- Novotna, V.; Skapa, S. Bootstrap estimation of expected risk and return of strategy equity indices. Period. Polytech. Manag. Sci. 2020, 28, 111–120. [Google Scholar] [CrossRef] [Green Version]
Figure 1.
Flowchart of the research framework.


Table 1.
Symbols of the MAD model and the proposed model.
| Symbol | Description |
|---|---|
| return of asset j | |
| weight of asset j | |
| minimum return set by the investor | |
| portfolio mean return | |
| portfolio absolute deviation | |
| portfolio entropy | |
| optimal value for portfolio mean return | |
| optimal value for portfolio absolute deviation | |
| deviation of portfolio mean return from the optimal value | |
| deviation of portfolio absolute deviation from the optimal value | |
| deviation of portfolio entropy from the optimal value |
Table 2.
Descriptive statistics of returns of stocks.
| Stocks | Mean | Standard Deviation | Skewness | Kurtosis |
|---|---|---|---|---|
| MMM | 0.0015 | 0.0322 | −0.7917 | 2.1866 |
| AXP | 0.0037 | 0.0474 | 0.1840 | 10.4748 |
| AMGN | 0.0022 | 0.0349 | −0.0553 | 0.5722 |
| AAPL | 0.0063 | 0.0393 | −0.2796 | 2.8098 |
| BA | 0.0048 | 0.0775 | 2.1565 | 31.7449 |
| CAT | 0.0053 | 0.0418 | −0.2800 | 1.4749 |
| CVX | 0.0014 | 0.0405 | −1.1459 | 11.2163 |
| CSCO | 0.0030 | 0.0338 | −0.2415 | 1.9929 |
| KO | 0.0012 | 0.0293 | −1.5923 | 12.5853 |
| GS | 0.0031 | 0.0449 | 0.4427 | 5.7500 |
| HD | 0.0038 | 0.0381 | −0.3786 | 14.4991 |
| HON | 0.0035 | 0.0353 | −0.8228 | 11.6518 |
| IBM | 0.0006 | 0.0350 | −0.2287 | 3.6550 |
| INTC | 0.0031 | 0.0411 | −0.3729 | 2.6244 |
| JNJ | 0.0020 | 0.0257 | −0.4792 | 2.5670 |
| JPM | 0.0039 | 0.0396 | 0.1057 | 6.3517 |
| MCD | 0.0028 | 0.0290 | −0.7580 | 7.1262 |
| MRK | 0.0018 | 0.0284 | −0.0812 | 0.9399 |
| MSFT | 0.0057 | 0.0301 | −0.4318 | 2.5895 |
| NKE | 0.0034 | 0.0380 | 0.6587 | 5.3541 |
| PG | 0.0022 | 0.0249 | −0.1018 | 3.4584 |
| CRM | 0.0046 | 0.0447 | 1.1580 | 8.4621 |
| TRV | 0.0017 | 0.0354 | 0.1498 | 6.1128 |
| UNH | 0.0050 | 0.0400 | −0.5416 | 7.4587 |
| VZ | 0.0011 | 0.0254 | 0.1536 | 1.0952 |
| V | 0.0042 | 0.0310 | −0.6160 | 5.6441 |
| WBA | −0.0010 | 0.0408 | −0.0805 | 2.0924 |
| WMT | 0.0033 | 0.0280 | 0.1636 | 2.5789 |
| DIS | 0.0027 | 0.0354 | 0.0463 | 4.4153 |
Table 3.
Composition and ranking of stocks in the optimal portfolio (MAD model) for the D1 period and D2 period.
Table 3.
Composition and ranking of stocks in the optimal portfolio (MAD model) for the D1 period and D2 period.
| Stocks | Weights (%) [D1 Period] | Ranking [D1 Period] | Weights (%) [D2 Period] | Ranking [D2 Period] |
|---|---|---|---|---|
| AXP | 0.7904 | 12 | - | - |
| AAPL | - | - | 2.9198 | 6 |
| BA | 2.3983 | 10 | - | - |
| CAT | - | - | 10.1117 | 4 |
| CVX | 11.2762 | 4 | - | - |
| KO | 9.5720 | 5 | - | - |
| JNJ | - | - | 1.4497 | 7 |
| JPM | 6.0708 | 7 | - | - |
| MCD | 15.8696 | 3 | 7.6486 | 5 |
| MRK | 4.5878 | 8 | - | - |
| MSFT | 3.7366 | 9 | 23.4267 | 2 |
| PG | 18.5039 | 1 | - | - |
| CRM | 1.2556 | 11 | - | - |
| UNH | 9.2145 | 6 | - | - |
| VZ | 0.0759 | 13 | 31.1050 | 1 |
| WMT | 16.6482 | 2 | 23.3385 | 3 |
Table 4.
Composition and ranking of stocks in the optimal portfolio (Proposed model) for the D1 period and D2 period.
Table 4.
Composition and ranking of stocks in the optimal portfolio (Proposed model) for the D1 period and D2 period.
| Stocks | Weights (%) [D1 Period] | Ranking [D1 Period] | Weights (%) [D2 Period] | Ranking [D2 Period] |
|---|---|---|---|---|
| MMM | 0.0287 | 27 | 4.0459 | 9 |
| AXP | 0.9634 | 20 | 0.0246 | 26 |
| AMGN | 0.2127 | 25 | 1.4396 | 15 |
| AAPL | 7.7781 | 6 | 4.0520 | 8 |
| BA | 7.2796 | 7 | 0.77584 × 10 −7 | 29 |
| CAT | 1.3159 | 14 | 8.6001 | 4 |
| CVX | 1.0525 | 17 | 0.0140 | 28 |
| CSCO | 0.3132 | 22 | 1.8066 | 14 |
| KO | 1.3468 | 13 | 0.1865 | 22 |
| GS | 0.0261 | 28 | 0.8782 | 17 |
| HD | 1.2611 | 15 | 3.0300 | 10 |
| HON | 0.9761 | 19 | 0.0896 | 24 |
| IBM | 0.0316 | 26 | 0.4680 | 19 |
| INTC | 0.3000 | 23 | 0.4319 | 20 |
| JNJ | 1.0515 | 18 | 4.3079 | 7 |
| JPM | 3.1691 | 11 | 0.6681 | 18 |
| MCD | 6.6089 | 8 | 4.9987 | 5 |
| MRK | 4.3922 | 9 | 1.3984 | 16 |
| MSFT | 15.1745 | 1 | 25.6371 | 1 |
| NKE | 1.1007 | 16 | 2.3731 | 12 |
| PG | 8.1654 | 5 | 1.9720 | 13 |
| CRM | 3.8759 | 10 | 2.4811 | 11 |
| TRV | 0.2590 | 24 | 0.0879 | 25 |
| UNH | 10.6100 | 3 | 0.2193 | 21 |
| VZ | 1.7637 | 12 | 13.2411 | 2 |
| V | 9.5210 | 4 | 0.1586 | 23 |
| WBA | 0.0015 | 29 | 0.0175 | 27 |
| WMT | 11.0766 | 2 | 12.5844 | 3 |
| DIS | 0.3443 | 21 | 4.7879 | 6 |
Table 5.
Performance comparison of the optimal portfolios among the MAD model, the proposed model and the naive diversification strategy for the D1 period.
Table 5.
Performance comparison of the optimal portfolios among the MAD model, the proposed model and the naive diversification strategy for the D1 period.
| Optimal Portfolio | MAD Model | Proposed Model | Naive Diversification Strategy |
|---|---|---|---|
| Portfolio mean return (%) | 0.3000 | 0.4000 | 0.2425 |
| Performance ratio | 0.2970 | 0.3254 | 0.2245 |
Table 6.
Performance comparison of the optimal portfolios among the MAD model, the proposed model and the naive diversification strategy for the D2 period.
Table 6.
Performance comparison of the optimal portfolios among the MAD model, the proposed model and the naive diversification strategy for the D2 period.
| Optimal Portfolio | MAD Model | Proposed Model | Naive Diversification Strategy |
|---|---|---|---|
| Portfolio mean return (%) | 0.3400 | 0.4400 | 0.3185 |
| Performance ratio | 0.1762 | 0.2041 | 0.1313 |
Table 7.
Bootstrap simulation analysis on the portfolio return of the MAD model, proposed model and the naive diversification strategy for the D1 period.
Table 7.
Bootstrap simulation analysis on the portfolio return of the MAD model, proposed model and the naive diversification strategy for the D1 period.
| Optimal Portfolio | MAD Model | Proposed Model | Naive Diversification Strategy |
|---|---|---|---|
| Portfolio mean return (%) | 0.2984 | 0.4011 | 0.2445 |
| 95% Confidence Interval | 0.2955–0.3012 | 0.3979–0.4043 | 0.2416–0.2474 |
| Performance ratio | 0.2909 | 0.3798 | 0.2340 |
Table 8.
Bootstrap simulation analysis on the portfolio return of the MAD model, proposed model and the naive diversification strategy for the D2 period.
Table 8.
Bootstrap simulation analysis on the portfolio return of the MAD model, proposed model and the naive diversification strategy for the D2 period.
| Optimal Portfolio | MAD Model | Proposed Model | Naive Diversification Strategy |
|---|---|---|---|
| Portfolio mean return (%) | 0.3507 | 0.4341 | 0.3073 |
| 95% Confidence Interval | 0.3417–0.3597 | 0.4234–0.4447 | 0.2947–0.3199 |
| Performance ratio | 0.1927 | 0.2242 | 0.1635 |
Publisher’s Note: MDPI stays neutral with regard to jurisdictional claims in published maps and institutional affiliations. |
© 2021 by the authors. Licensee MDPI, Basel, Switzerland. This article is an open access article distributed under the terms and conditions of the Creative Commons Attribution (CC BY) license (https://creativecommons.org/licenses/by/4.0/).
Share and Cite
MDPI and ACS Style
Lam, W.S.; Lam, W.H.; Jaaman, S.H. Portfolio Optimization with a Mean–Absolute Deviation–Entropy Multi-Objective Model. Entropy 2021, 23, 1266. https://0-doi-org.brum.beds.ac.uk/10.3390/e23101266
AMA Style
Lam WS, Lam WH, Jaaman SH. Portfolio Optimization with a Mean–Absolute Deviation–Entropy Multi-Objective Model. Entropy. 2021; 23(10):1266. https://0-doi-org.brum.beds.ac.uk/10.3390/e23101266
Chicago/Turabian StyleLam, Weng Siew, Weng Hoe Lam, and Saiful Hafizah Jaaman. 2021. "Portfolio Optimization with a Mean–Absolute Deviation–Entropy Multi-Objective Model" Entropy 23, no. 10: 1266. https://0-doi-org.brum.beds.ac.uk/10.3390/e23101266
Note that from the first issue of 2016, this journal uses article numbers instead of page numbers. See further details here.