
A New Total Uncertainty Measure from A Perspective of Maximum Entropy Requirement


School of Electronics And Information, Northwestern Polytechnical University, Xi’an 710072, China
*
Author to whom correspondence should be addressed.
Entropy 2021, 23(8), 1061; https://0-doi-org.brum.beds.ac.uk/10.3390/e23081061
Submission received: 30 July 2021
/
Revised: 12 August 2021
/
Accepted: 12 August 2021
/
Published: 17 August 2021
(This article belongs to the Special Issue Recent Progress of Deng Entropy)
Abstract
:The Dempster-Shafer theory (DST) is an information fusion framework and widely used in many fields. However, the uncertainty measure of a basic probability assignment (BPA) is still an open issue in DST. There are many methods to quantify the uncertainty of BPAs. However, the existing methods have some limitations. In this paper, a new total uncertainty measure from a perspective of maximum entropy requirement is proposed. The proposed method can measure both dissonance and non-specificity in BPA, which includes two components. The first component is consistent with Yager’s dissonance measure. The second component is the non-specificity measurement with different functions. We also prove the desirable properties of the proposed method. Besides, numerical examples and applications are provided to illustrate the effectiveness of the proposed total uncertainty measure.
1. Introduction
With the development of sensor technology, it has become a trend for complex systems to be equipped with multiple sensors. Compared with single-sensor monitoring, multi-sensor monitoring could have higher reliability. Obviously, it is a key issue to effectively fuse the multi-sensor information. Many techniques are proposed to solve the issue, such as the Dempster-Shafer theory (DST) [1,2], Kalman filtering (KF) [3,4], fuzzy theory [5], Bayesian reasoning method [6,7], neural network [8], and so on. However, there are many uncertainties, for example, randomness and imprecision, in the real world. The treatment of uncertainty is an important aspect in information fusion theories. Among them, DST is an effective framework to deal with uncertain information. This theory was first proposed by Dempster [9] and further developed by Shafer [10]. It is widely used in fault diagnosis [11,12,13,14], decision-making [15,16], risk assessment [17], and so on. Many studies in recent years have focused on conflict resolution [18,19,20], evidence revision [21], combination rules [22,23,24,25], and information volume [26,27]. Many methods about uncertainty quantification have also been proposed [28]. However, the existing methods have some limitations, and the uncertainty measure of BPAs is still an open issue in DST.
The concept of entropy was first proposed by the German physicist Clausius in 1865. In thermodynamics, entropy is a measure of the “chaos” of a system [29]. In information theory, entropy, also known as Shannon entropy, represents a measure of the uncertainty of a random variable [30]. Besides, Ilya Prigogine proposed a famous statement: “The entropy …leads to an ordering process” [31]. Parker and Jeynes also showed from a MaxEnt standpoint that the (stupendously gigantic) entropy of the supermassive black hole at the centre of the Milky Way can account for the geometrical stability of the galaxy [32]. Among them, the Shannon entropy, verified in the past few decades, is an effective way to measure uncertainty in probability theory (PT), but its direct application in DST is inappropriate. That is because that PT describes the probability of the occurrence of singletons, while the evidence theory is based on the theory of non-additive probabilities, which can represent the possibility of the occurrence of propositions with multiple elements [33].
Based on the above analysis, many scholars have proposed different entropy-like measures to quantify the uncertainty of a body of evidences (BOEs) in DST. For instance, Nguyen proposed a belief entropy based on the original basic probability assignment (BPA) [34]. Dubois and Prade proposed a weighted Hartley entropy for measuring the non-specificity of BPAs [35]. In addition, many other belief entropies have been proposed, including Höhle’s entropy [36], Yager’s dissonance measure [37], Klir and Ramer’s discord measure [38], Klir and Parviz’s strife measure [39], Jousselme’s ambiguity measure (AM) [40], Deng entropy [41], Yang and Han’s measure [42], the aggregated uncertainty measure (AU) [43], Wang and Song’s measure (SU) [44], Jirousek and Shenoy’s entropy (JS) [45], Deng’s measure [46], and so on [47,48,49]. These methods can effectively measure the uncertainty of BOEs in some cases, and satisfy some desirable properties of uncertainty quantification in DST [50]. Intuitively, when the system is completely unknown, that is, , represents a frame of discernment (FOD), the uncertainty of evidence is the greatest, which is called the maximum entropy property. Some of the existing methods do not support this property. However, we think that maximum entropy should be a property that must be satisfied.
Motivated by the above discussions, a new total uncertainty measure from a perspective of maximum entropy requirement is proposed. The proposed method can measure both dissonance conflict and non-specificity in BPA, which includes two components. The first component is consistent with Yager’s dissonance measure. The second component is the non-specificity with different functions. We also prove the majority of the desired properties of the proposed method, such as non-negativity, monotonicity, probability consistency, and so on. The main contributions are summarized as follows.
- We propose a new total uncertainty measure from the perspective of the maximum entropy requirement to quantify the uncertainty of BPAs in DST. Besides, properties of the proposed method have also been proved, such as non-negativity, monotonicity, maximum entropy, and so on.
- We conduct some numerical examples to evaluate the effectiveness of our proposed method. The simulation results indicated that our proposed total uncertainty measure could be degraded to Shannon entropy when BPA is a Bayesian mass function. Furthermore, the proposed entropy could effectively deal with the redundant information of the focal element.
The remainder of this paper is organized as follows. Section 1 reviews the related concepts and works. Some preliminaries are introduced in Section 2. In Section 3, we illustrate the proposed method in detail. Simulation results and discussion compared with other methods are presented in Section 4. In Section 5, we give an application in feature evaluation for pattern classification based on the Iris dataset. Section 6 is a conclusion of the paper.
2. Preliminaries
Some basic concepts and existing methods are briefly introduced in this section.
2.1. Dempster-Shafer Theory
The Dempster-Shafer theory, proposed by Dempster [9] and expanded by Shafer [10], is a mathematical theory of multi-source information. This method can effectively cope with uncertainty. It is widely used in target identification, fusion decision, and so on. Some definitions about this theory are as follows.
- Let and be two BPAs, and then the Dempster combination rule is as follows [9]:where .
2.2. Belief and Plausibility Function
is the plausibility function that is defined as follows:
is the degree to which you do not disagree with proposition S.
2.3. Shannon Entropy
Let X be a sample space with possible values , then, the Shannon entropy is defined as [30]:
where is the probability of . It also satisfies .
2.4. Some Existing Entropies in DST
In the information theory, Shannon entropy has been widely used, but it has an inherent limitation of handling the uncertainty in DST. Nonetheless, the idea of Shannon entropy still plays a crucial role in guiding the uncertainty measurement of BPA. Many scholars proposed methods of uncertainty measurements. Let X be a FOD, and some existing uncertainty measures in DST are listed as follows.
- Nguyen’s entropy.
- Nguyen [34] proposed a belief entropy based on the original BPA:
- Weighted Hartley entropy.
- Dubois and Prade [35] proposed a entropy for the non-specificity measure:where is the cardinality of S.
- Aggregated uncertainty measure (AU).
- Harmanec and Klir [43] proposed a total uncertainty measure of non-specificity and inconsistency:where is defined as:
- Yager’s entropy.
- Yager [37] proposed a dissonance measure of BPAs based on the plausibility function:where is the plausibility measurement of S in m.
- Deng entropy.
- Deng [41] proposed a new uncertainty measurement method, namely, ”Deng entropy”. It is defined as:
- Höhle entropy.
- Höhle [36] proposed a belief entropy based on a belief function, which is defined as:where is the belief measurement of S.
- Yang and Han’s measure ().
- Yang and Han [42] defined a total uncertainty measurement. The formula is defined as:where n is the elements number of FOD X. The interval distance is defined as:
- Deng’s measure ().
- In addition, Deng et al. [46] proposed an improved total uncertainty measurement method based on belief intervals:where indicates the Euclidean distance between two interval numbers and .
3. Proposed Uncertainty Measure in DST
3.1. The Proposed Method
In this section, a new total uncertainty measure of BPAs in DST is proposed, which is from a perspective of maximum entropy requirement. It can quantify the total uncertainty of BPAs, including conflict and non-specificity. As for the conflict measure of BPAs, we utilize the method of Yager’s dissonance entropy [37]. As for the non-specificity measure of BPAs, , we think that should be consistent with the maximum entropy requirement. For example, the uncertainty of BPA defined on FOD X, , should equal to the uncertainty of vacuous BPA , where is the FOD and . Furthermore, the uncertainty of should hence be a function of a and the uncertainty degree of BPA , but not measured by the weighted Hartley entropy.
Based on the above idea, the proposed new total uncertainty measure is defined as follows:
where X is the FOD, and represents the maximum entropy in S, that is, the uncertainty of . Logically, for , is a monotonically increasing function of the cardinality of S, that is, . In addition, when the BPA is a Bayesian mass function, we expect the new entropy to be degraded to Shannon’s entropy. Therefore, when . In summary, is a function , satisfying (i) ; and (ii) .
3.2. Properties of the Proposed Method
Similar to the probability theory (PT), there are some properties which need to be satisfied for the uncertainty measurement in DST, such as probability consistency, additivity, non-negativity, and so forth. The properties analysis of the proposed entropy is explored as follows.
Property 1
(Non-negativity). , the equation holds if, and only if and .
Proof.
Given , for any ,
then,
hence, . If , there must be or , that is, and . □
Property 2
(Set Monotonicity). Let be a vacuous BPA on FOD , and be also a vacuous BPA on FOD , if , then .
Proof.
For any vacuous BPA , there is , then
From the analysis in Section 3.1, it can be obtained that is a monotonically increasing function of , and we have if . Hence, the proposed method satisfies the set monotonicity property. □
Property 3
(Maximum entropy). For all BPAs defined on a FOD X, the vacuous BPA has the most uncertainty.
Proof.
Let m be a BPA on FOD X. According to the analysis of Section 3.1, is a monotonically increasing function of the cardinality of S. Therefore, the proposed method obviously satisfies the maximum entropy property. □
Property 4
(Probability consistency). For a Bayesian BPA defined on FOD X, its uncertainty equals to the form of Shannon entropy
Proof.
If m is a Bayesian BPA, then , hence,
Therewith, the proposed method satisfies the property of probability consistency. □
Property 5
(Range). The range of the proposed entropy is , where is a function of .
Property 6
(Non-Additivity). Let and be two BPAs that are defined on FOD X and Y, respectively. Then, .
Proof.
Let Z be the Cartesian product space , where and , is the corresponding joint focal element on Z, , and . Then, the new entropy of is:
Therefore, the proposed method does not satisfy the additivity property. □
Property 7
(Generalized Set Consistency). When , S is any subset of a FOD, , where f is a monotonically increasing function of .
Proof.
Assuming m is a BPA defined on FOD X, for and , the uncertainty measurement based on the proposed entropy is:
Therefore, the proposed entropy satisfies the property of generalized set consistency if, and only if .
4. Numerical Examples
In this section, we give three different forms of . Some numerical examples are given to verify the rationality and effectiveness of the proposed method.
- Case 1 ().
- According to [45], the maximum entropy is , where X is a FOD. In this paper, represents the maximum entropy in S. Hence, based on the above analysis, one function form of can be defined as:
- Case 2 ().
- According to [26], the maximum Deng entropy is . Theoretically, should be . However, the Deng entropy’s maximum uncertainty is obtained at , which is inconsistent with our idea. In this paper, we think that the uncertainty of should be a function of a and uncertainty degree of BPA . Hence, for any , there is only one situation, . Therefore, another function form of can be defined as:
- Case 3 ().
Then, the proposed entropy could be written as follows:
4.1. Example 1
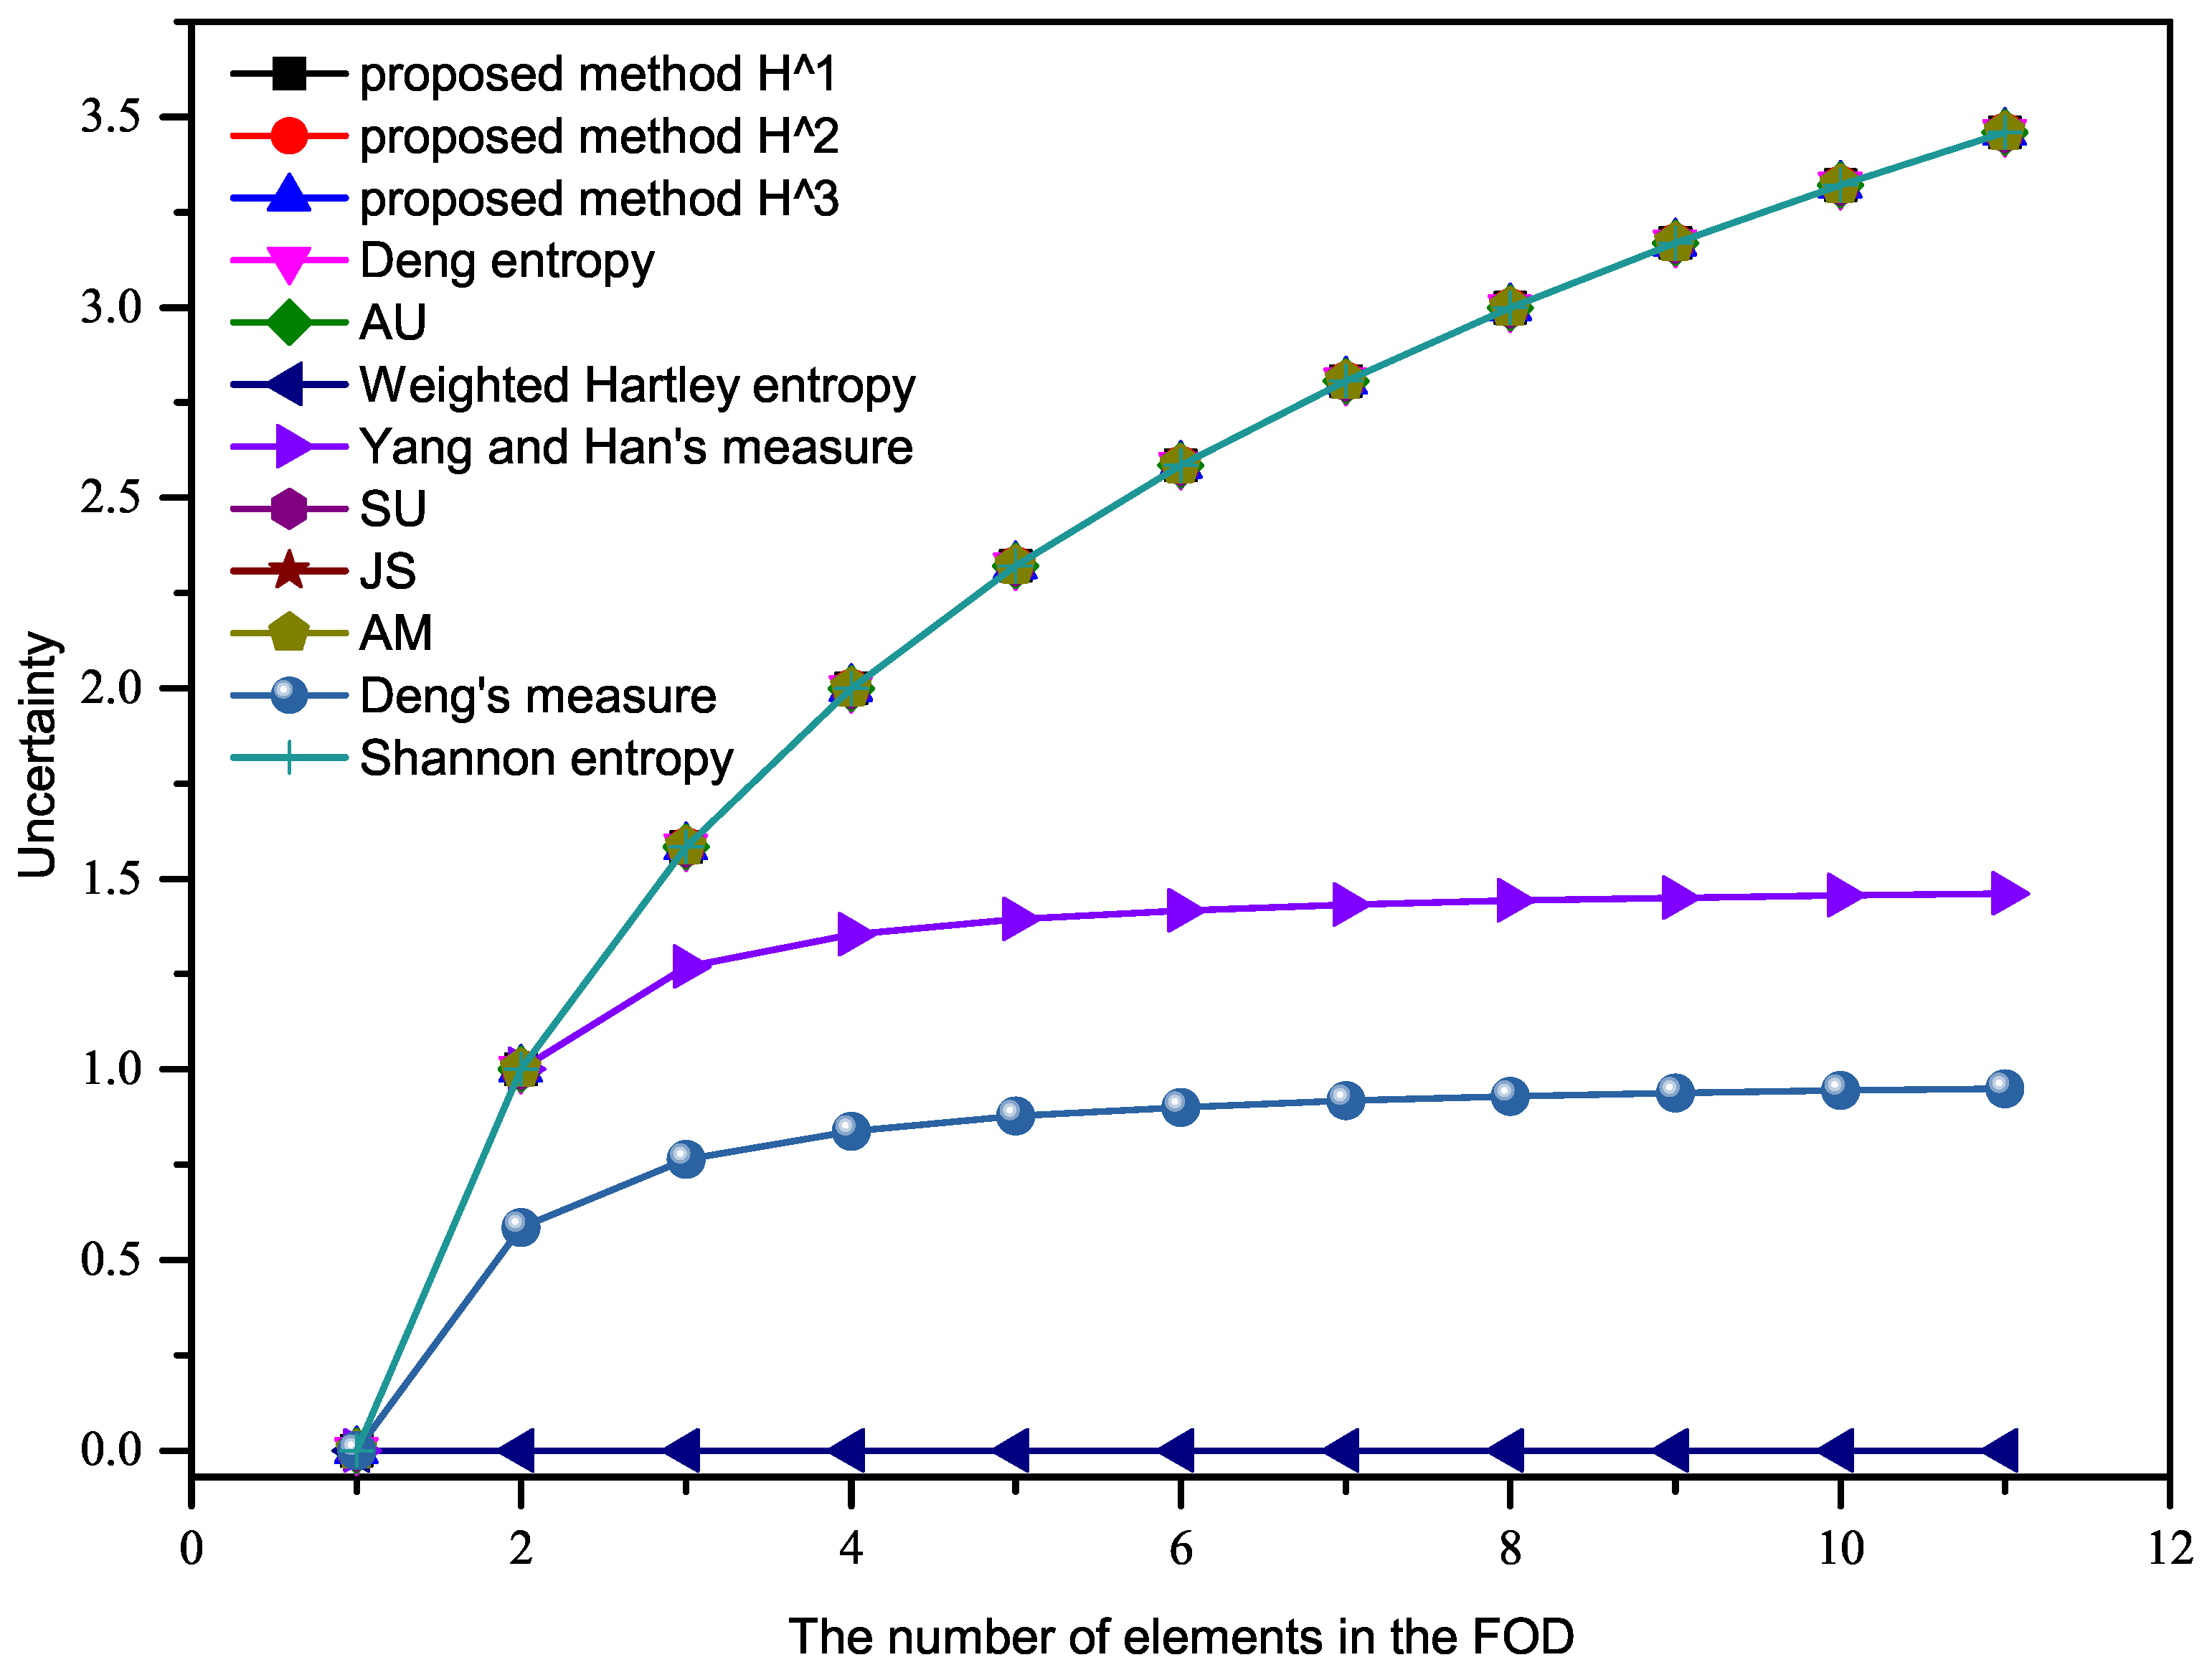
This example is adapted from [53]. Let the FOD be . We give a BPA as . Then, we calculate the uncertainty of this BPA when n changes.
According to the definition and the desired properties of the entropy, it can be inferred that as n increases, the uncertainty of this BPA increases. In addition, when the BPA is a Bayesian mass function, the uncertainty of the BPA should be consistent with Shannon entropy.
We calculate the uncertainty of this BPA in this example based on the proposed method and some existing methods, as shown in Figure 1.
For this example, all the methods gave exactly the same result as the Deng Entropy (except the weighted Hartley entropy, and the two different “measures” of Deng, as well as Yang and Han). In this paper, the “Deng entropy“ was proposed by Deng to measure the uncertainty of BPAs in 2016, while “Deng’s measure ()“, proposed by Deng et al. in 2017, is an improved total uncertainty measure method based on the belief interval.
In Figure 1, the uncertainty calculated by Yang and Han’s measure, and the weighted Hartley entropy show a downward trend with the increase of n, which was inconsistent with our intuition. However, the uncertainty calculated by the proposed methods in this paper and the remaining existing methods gradually increases with the increase of n, which is consistent with the results calculated by Shannon entropy. Therefore, the proposed methods in this paper are effective when BPA is a Bayesian mass function.
4.2. Example 2
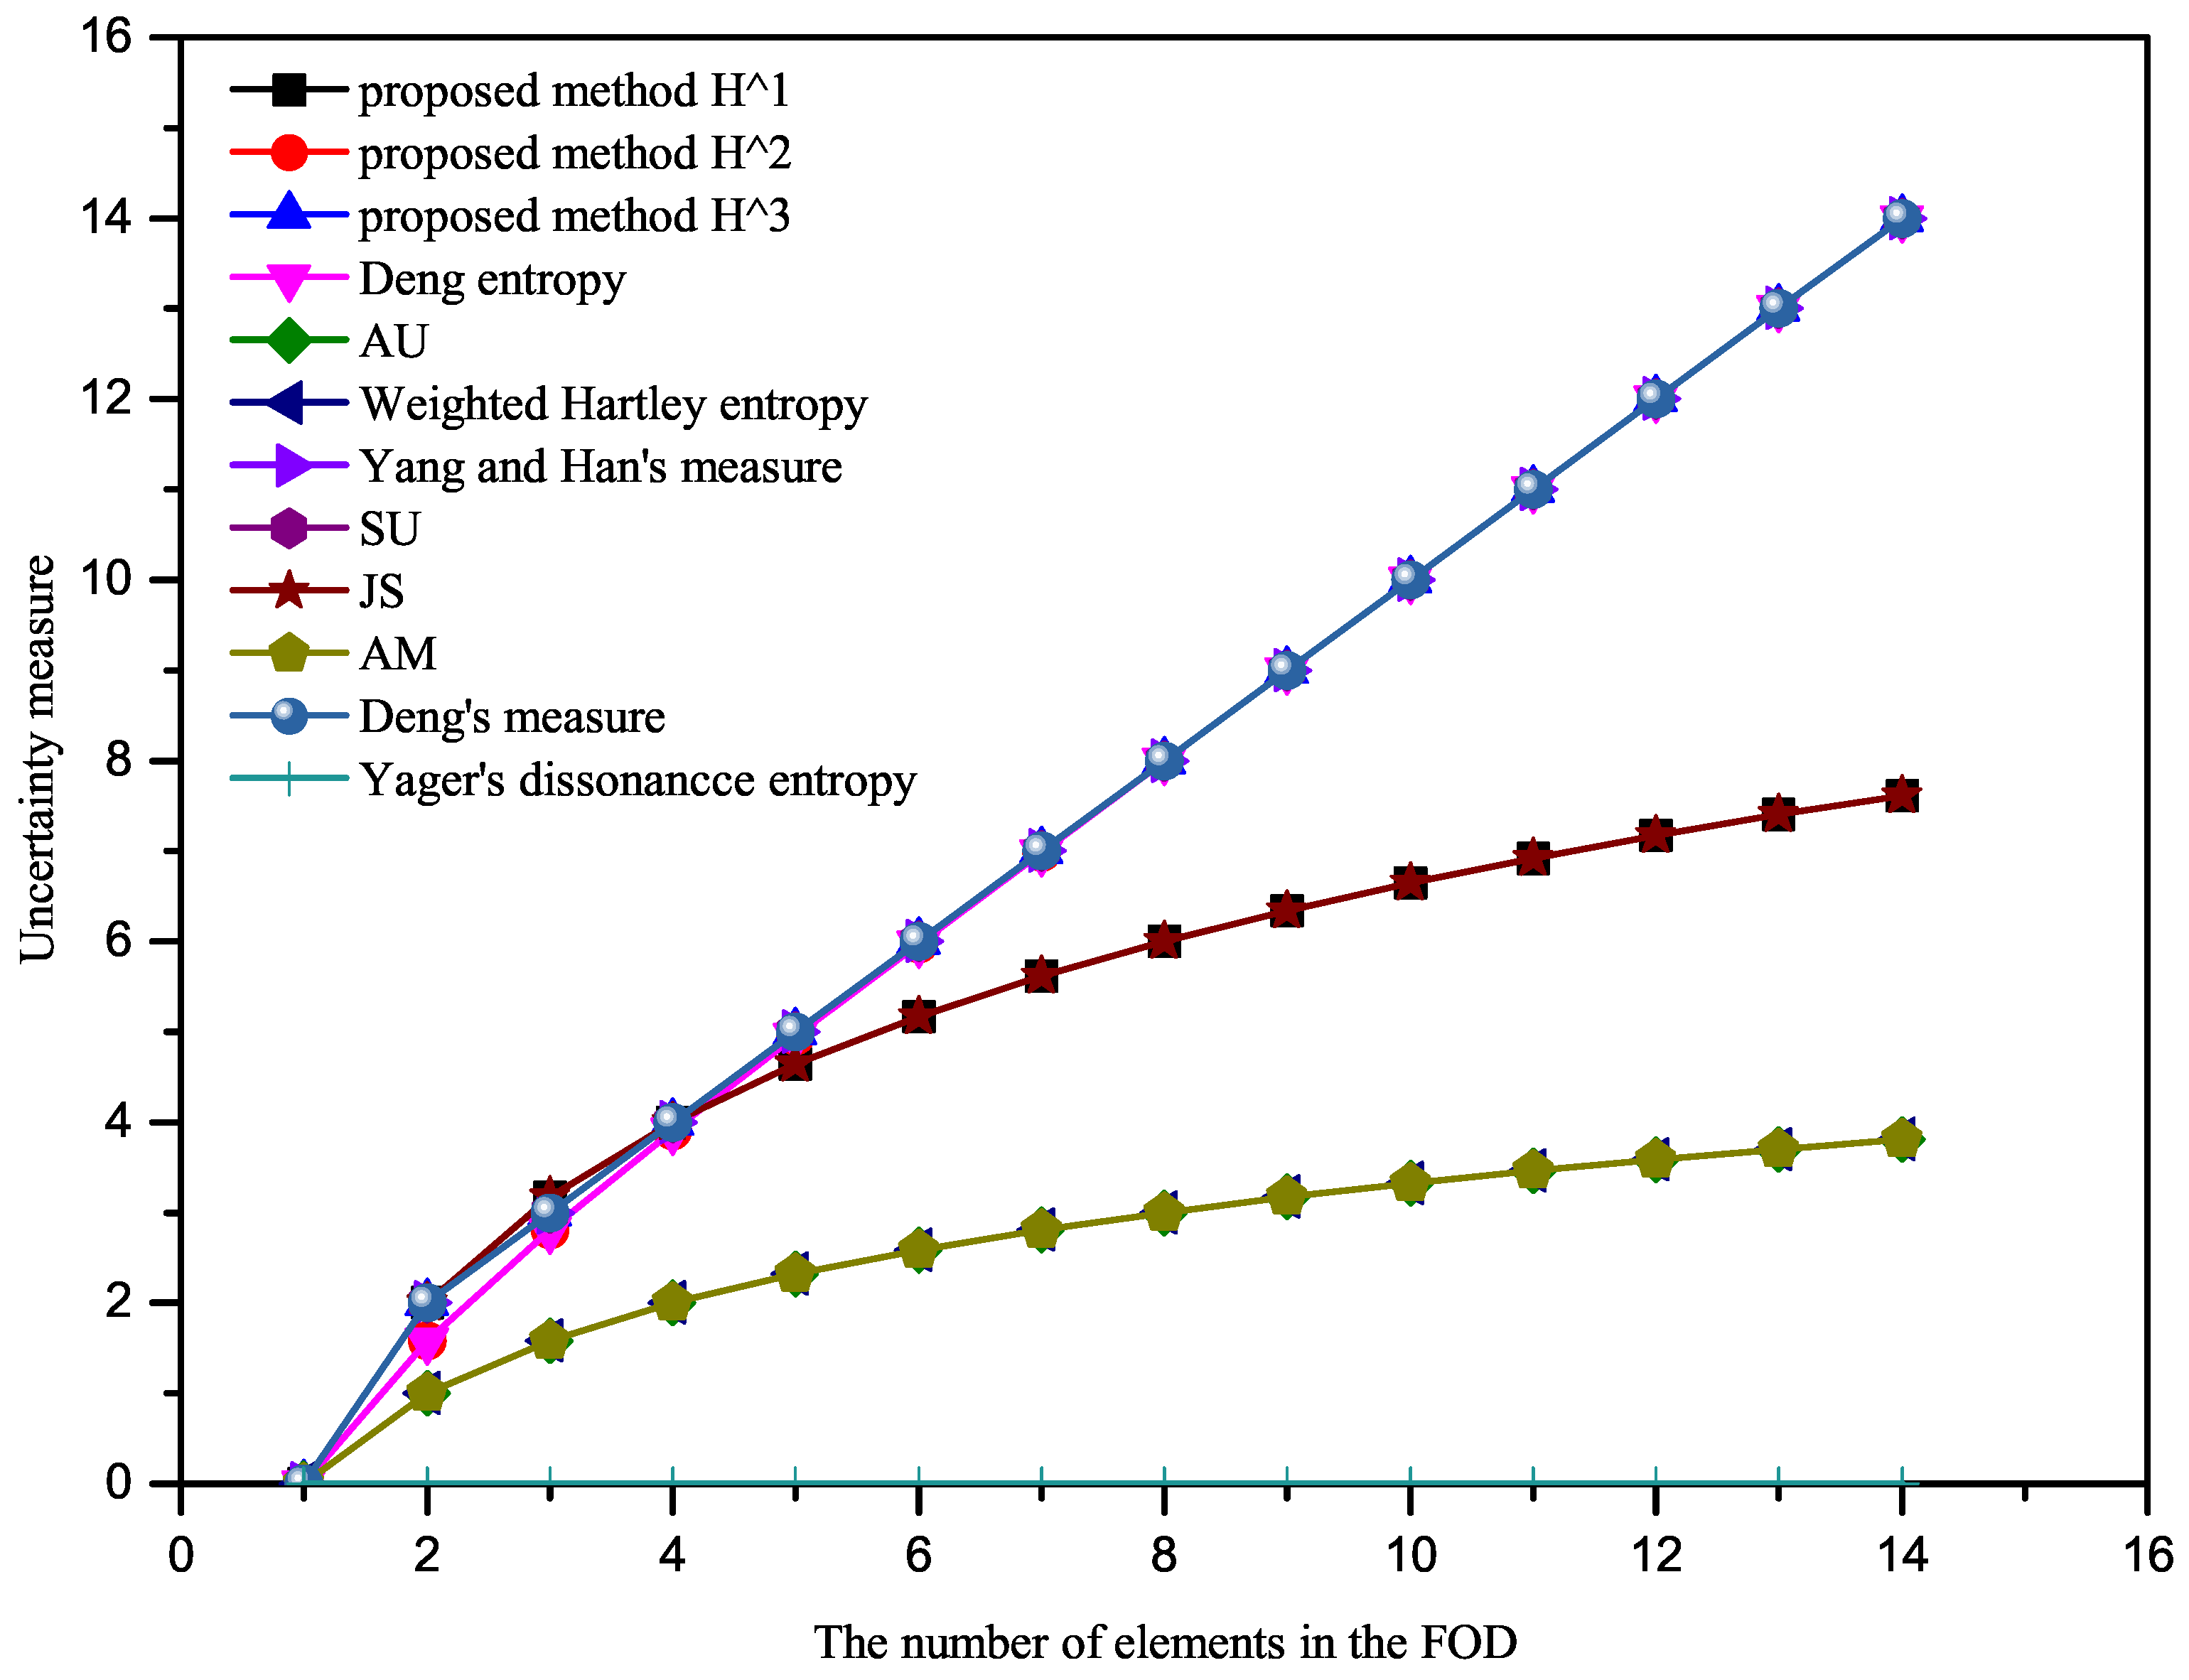
Let the FOD be . We also give a BPA as . When n increases from 1 to 14, the uncertainty measure of BPAs based on the proposed method and other existing methods are shown in Table 1. In addition, in order to visualize the change of uncertain measurement results with n, the uncertainty measurement results of different methods are given in Figure 2.
As shown in Figure 2, it is obvious that the uncertainty degree measured by the Yager’s dissonance entropy is always 0. Intuitively, however, the uncertainty of this BPA should increase as n increases. Therefore, Yager’s dissonance entropy will obtain wrong results when m is a vacuous BPA in this example.
The uncertainty measure results obtained by AU, weighted Hartley entropy, and AM are the same. This is because when BPA is a vacuous BPA, the three methods give us the same result . The degree of uncertainty obtained by these three methods increases with the increase of n, which is consistent with expectations. Similarly, the degree of uncertainty calculated based on the methods proposed in this paper (, , ), Deng’s entropy, SU, JS, Yang and Han’s measure, and also increases with the increase of n. Additionally, the growth trend of the proposed method in this paper is basically the same as that of the Deng entropy. This is because for a vacuous BPA, . Hence, the two methods have the same function form. The proposed method and SU, Yang and Han’s measure, also have the same growth trend. However, we think that when the change trend is consistent with the theoretical connotation of uncertainty, it can be considered as a reasonable and effective measure method. Hence, the proposed methods are all effective when BPA is a vacuous BPA.
For this example, the proposed method gave the same results as the Deng entropy.
4.3. Example 3
Let be the FOD. We give two BPAs as follows.
For ,
for ,
then the uncertainty based on the proposed method are:
In addition, the uncertainty measured by other methods, as shown in Table 2.
Obviously, owing to differences in the focal elements in these BPAs, the uncertainty degree of and are different, though the values of the two BPAs are the same, and should be less than . However, the results obtained by the Deng entropy and weighted Hartley entropy are the same for and . The results obtained by other methods are as expected. However, Yager’s dissonance entropy method did not consider the non-specificity measure. The methods proposed in this paper obtain reasonable results and consider the total uncertainty. Therefore, when the focal elements are different but the BPA values are the same, the proposed method in this paper can effectively measure the degree of uncertainty.
4.4. Example 4
Let be a FOD. Two BPAs defined on the FOD are given as follows. There is an intersection relationship between propositions.
The uncertainties are measured by different methods, as shown in Table 3.
For the body of evidence (BOE) , the intersection between the two propositions and is empty. For BOE , the intersection between the two propositions and is a single element c. However, the values of BPAs are the same. Based on the above analysis, the uncertainties of two BOEs are obviously different. However, according to Table 3, the results are the same for and , measured by Deng entropy, AU, weighted Hartley entropy, Yang and Han’s measure, and Deng’s measure. Besides, the uncertainty of BOE calculated by Yager’s dissonance entropy is 0. This result is clearly wrong. This is because there is an intersection between two propositions of , and Yager’s dissonance entropy eliminates the distinction between the two propositions when calculating a plausibility function. On the contrary, the three methods we propose can all distinguish the uncertainty difference between the two BOEs. Therefore, the proposed method can effectively distinguish the uncertainty when there is an intersection relationship between propositions.
4.5. Example 5
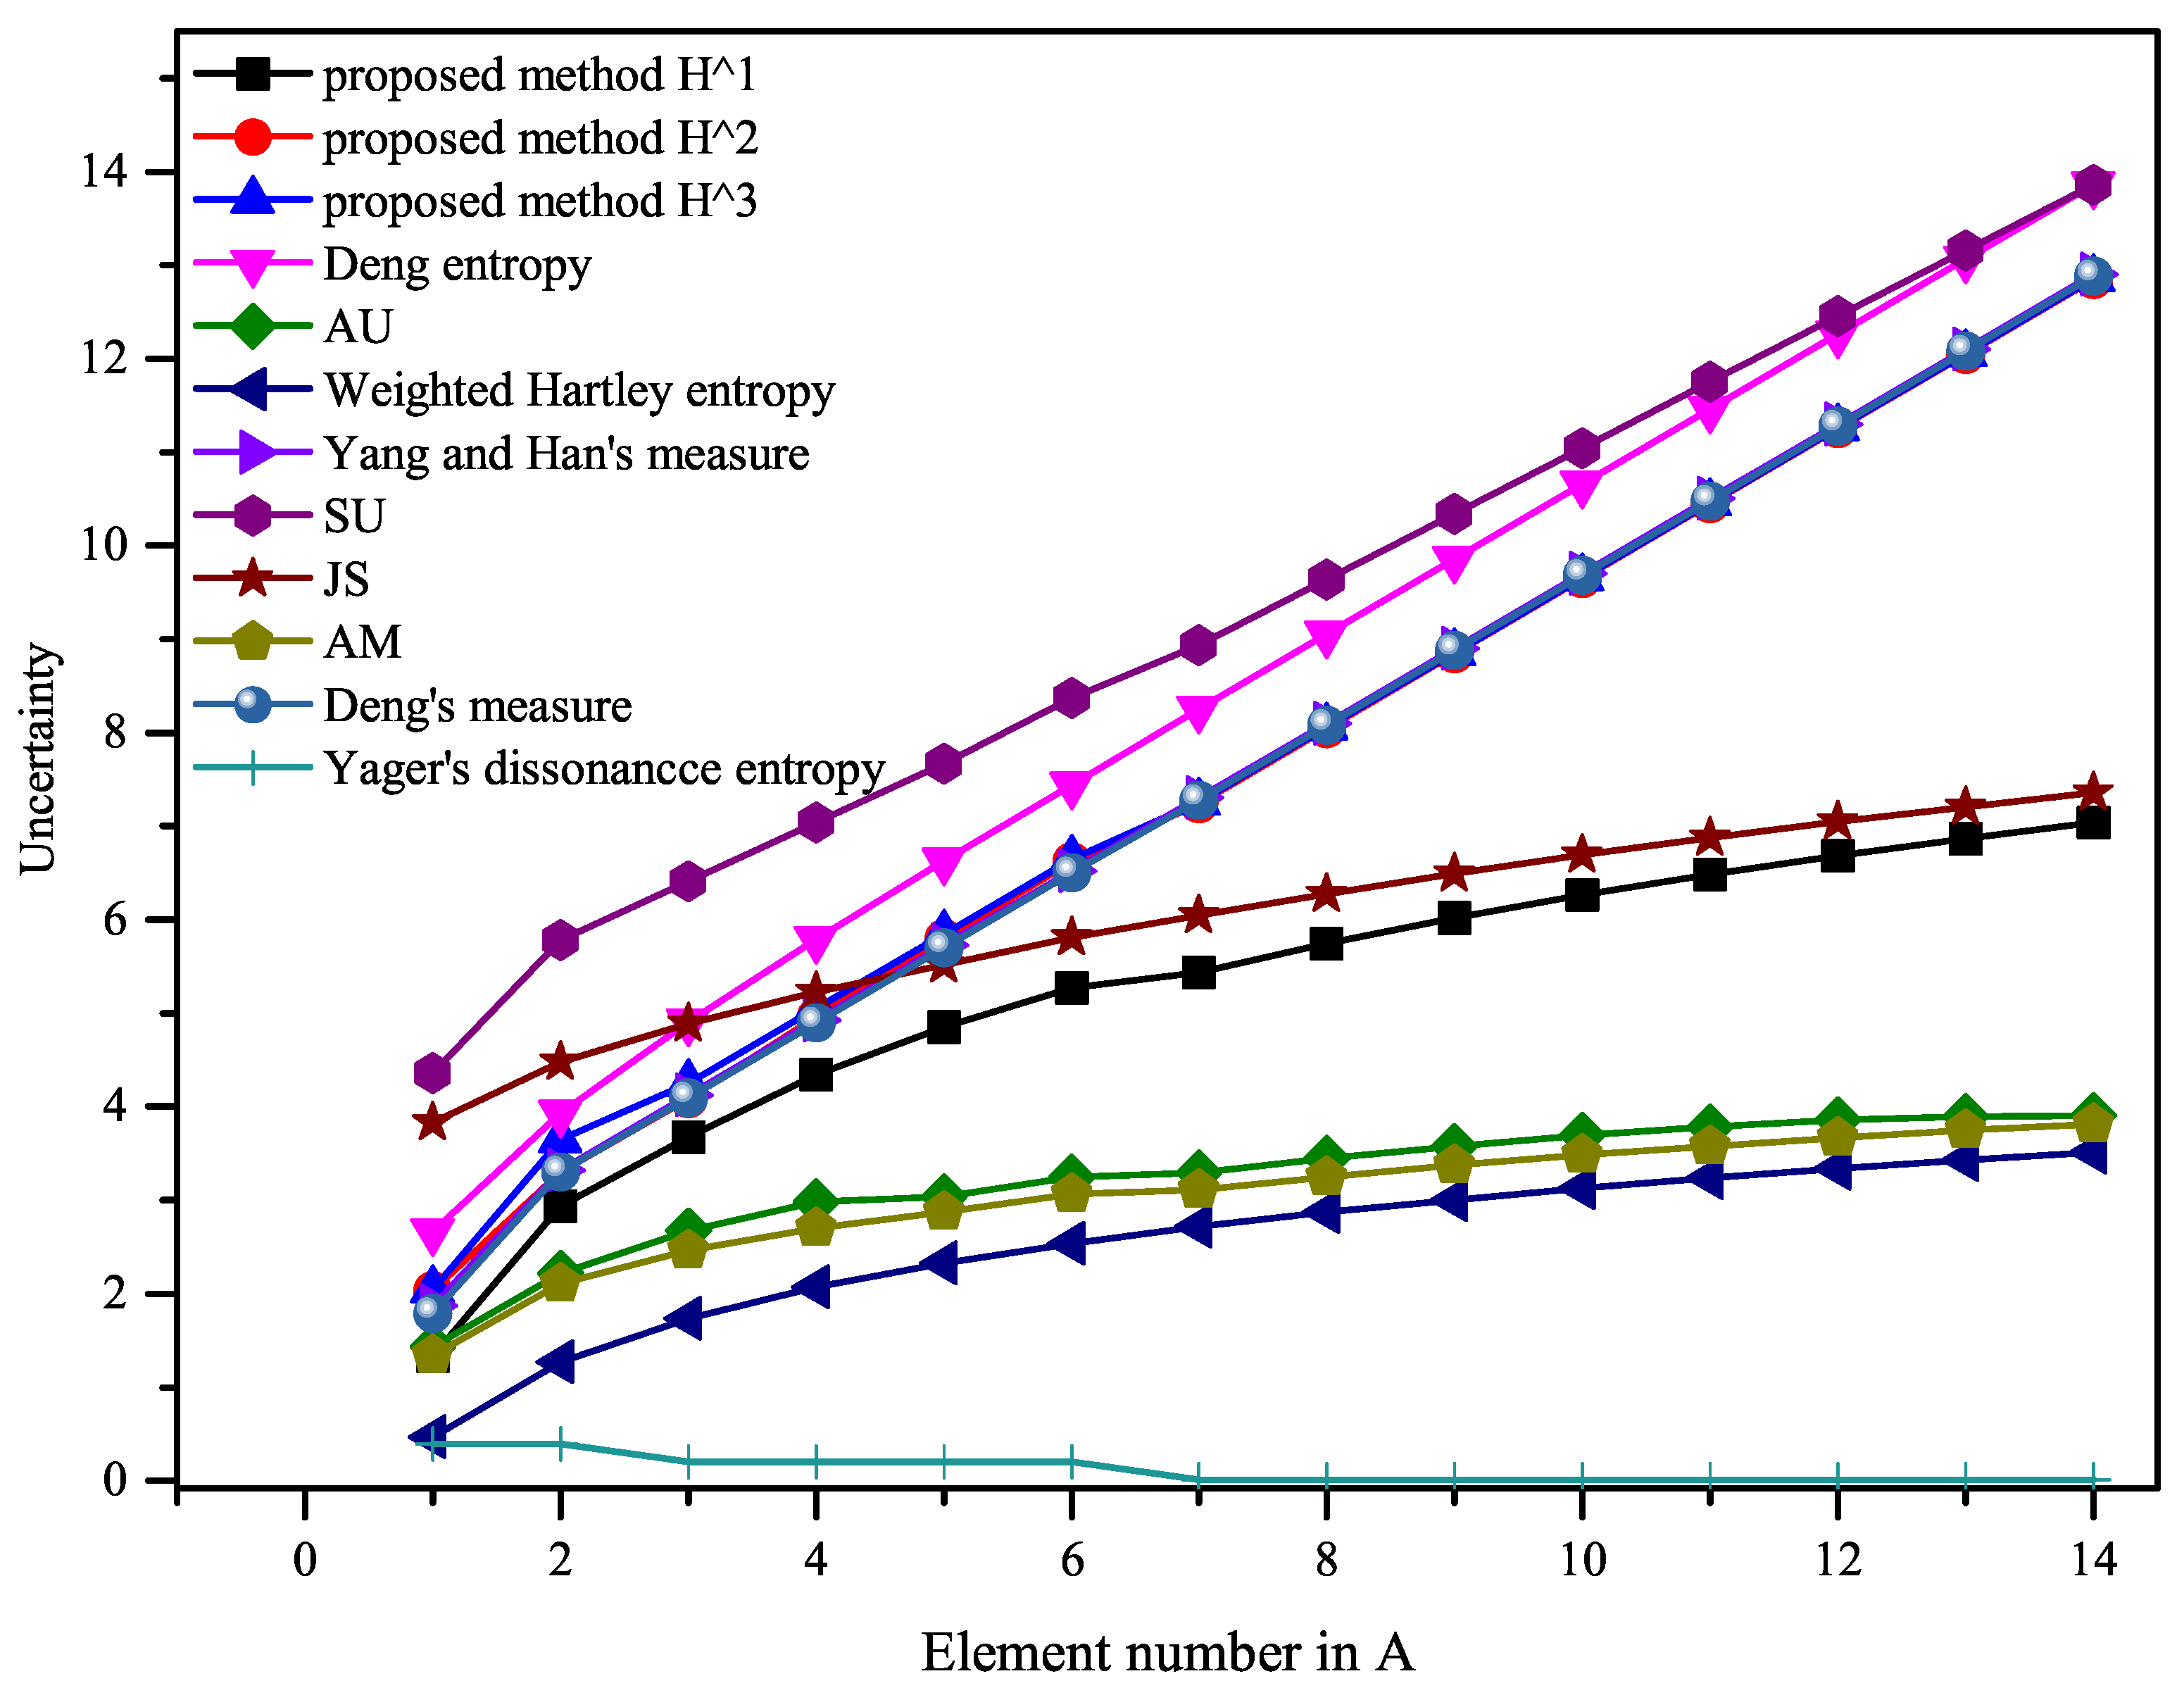
Let be a FOD with 15 elements. A BPA defined on the FOD is:
where A is a variable subset of X, with the number of single elements changing from 1 to 14. This example was adopted from [53].
The results are shown in Table 4 and Table 5, and Figure 3. Table 4 shows changes in the number of elements in S from 1 to 7, and Table 5 shows changes in the number of elements in A from 8 to 14. All the results are plotted in Figure 3.
As shown in Figure 3, with the increase of the number of elements in A, the uncertainty calculated by Yager’s dissonance entropy shows a downward trend, which is inconsistent with the connotation of uncertainty. The reason is that when the number of elements in A gradually increases, it gradually intersects with other propositions, and Yager’s entropy does not show this difference. This suggests that Yager’s entropy does not correctly measure the uncertainty of the evidence in this example.
From a “common sense” point of view, the uncertainty of BPA increases as the number of elements increases in A. Additionally, other methods except Yager’s dissonance entropy show an increasing trend on the whole. The corresponding values can be found in Table 4 and Table 5. However, it should be noted that when A changes from to , A begins to intersect with the proposition . Therefore, the change of the uncertainty should be slightly less than the change of A from to . From Figure 4, it can be obtained that the proposed methods in this paper present this change. As for the uncertainty measure of BOEs, as far as we know, there is no reasonable evaluation index at present, and it is not certain that the greater the uncertainty, the better. Nevertheless, when its change trend is consistent with the theoretical connotation of uncertainty, it can be considered as a reasonable and effective measurement method.
4.6. Example 6
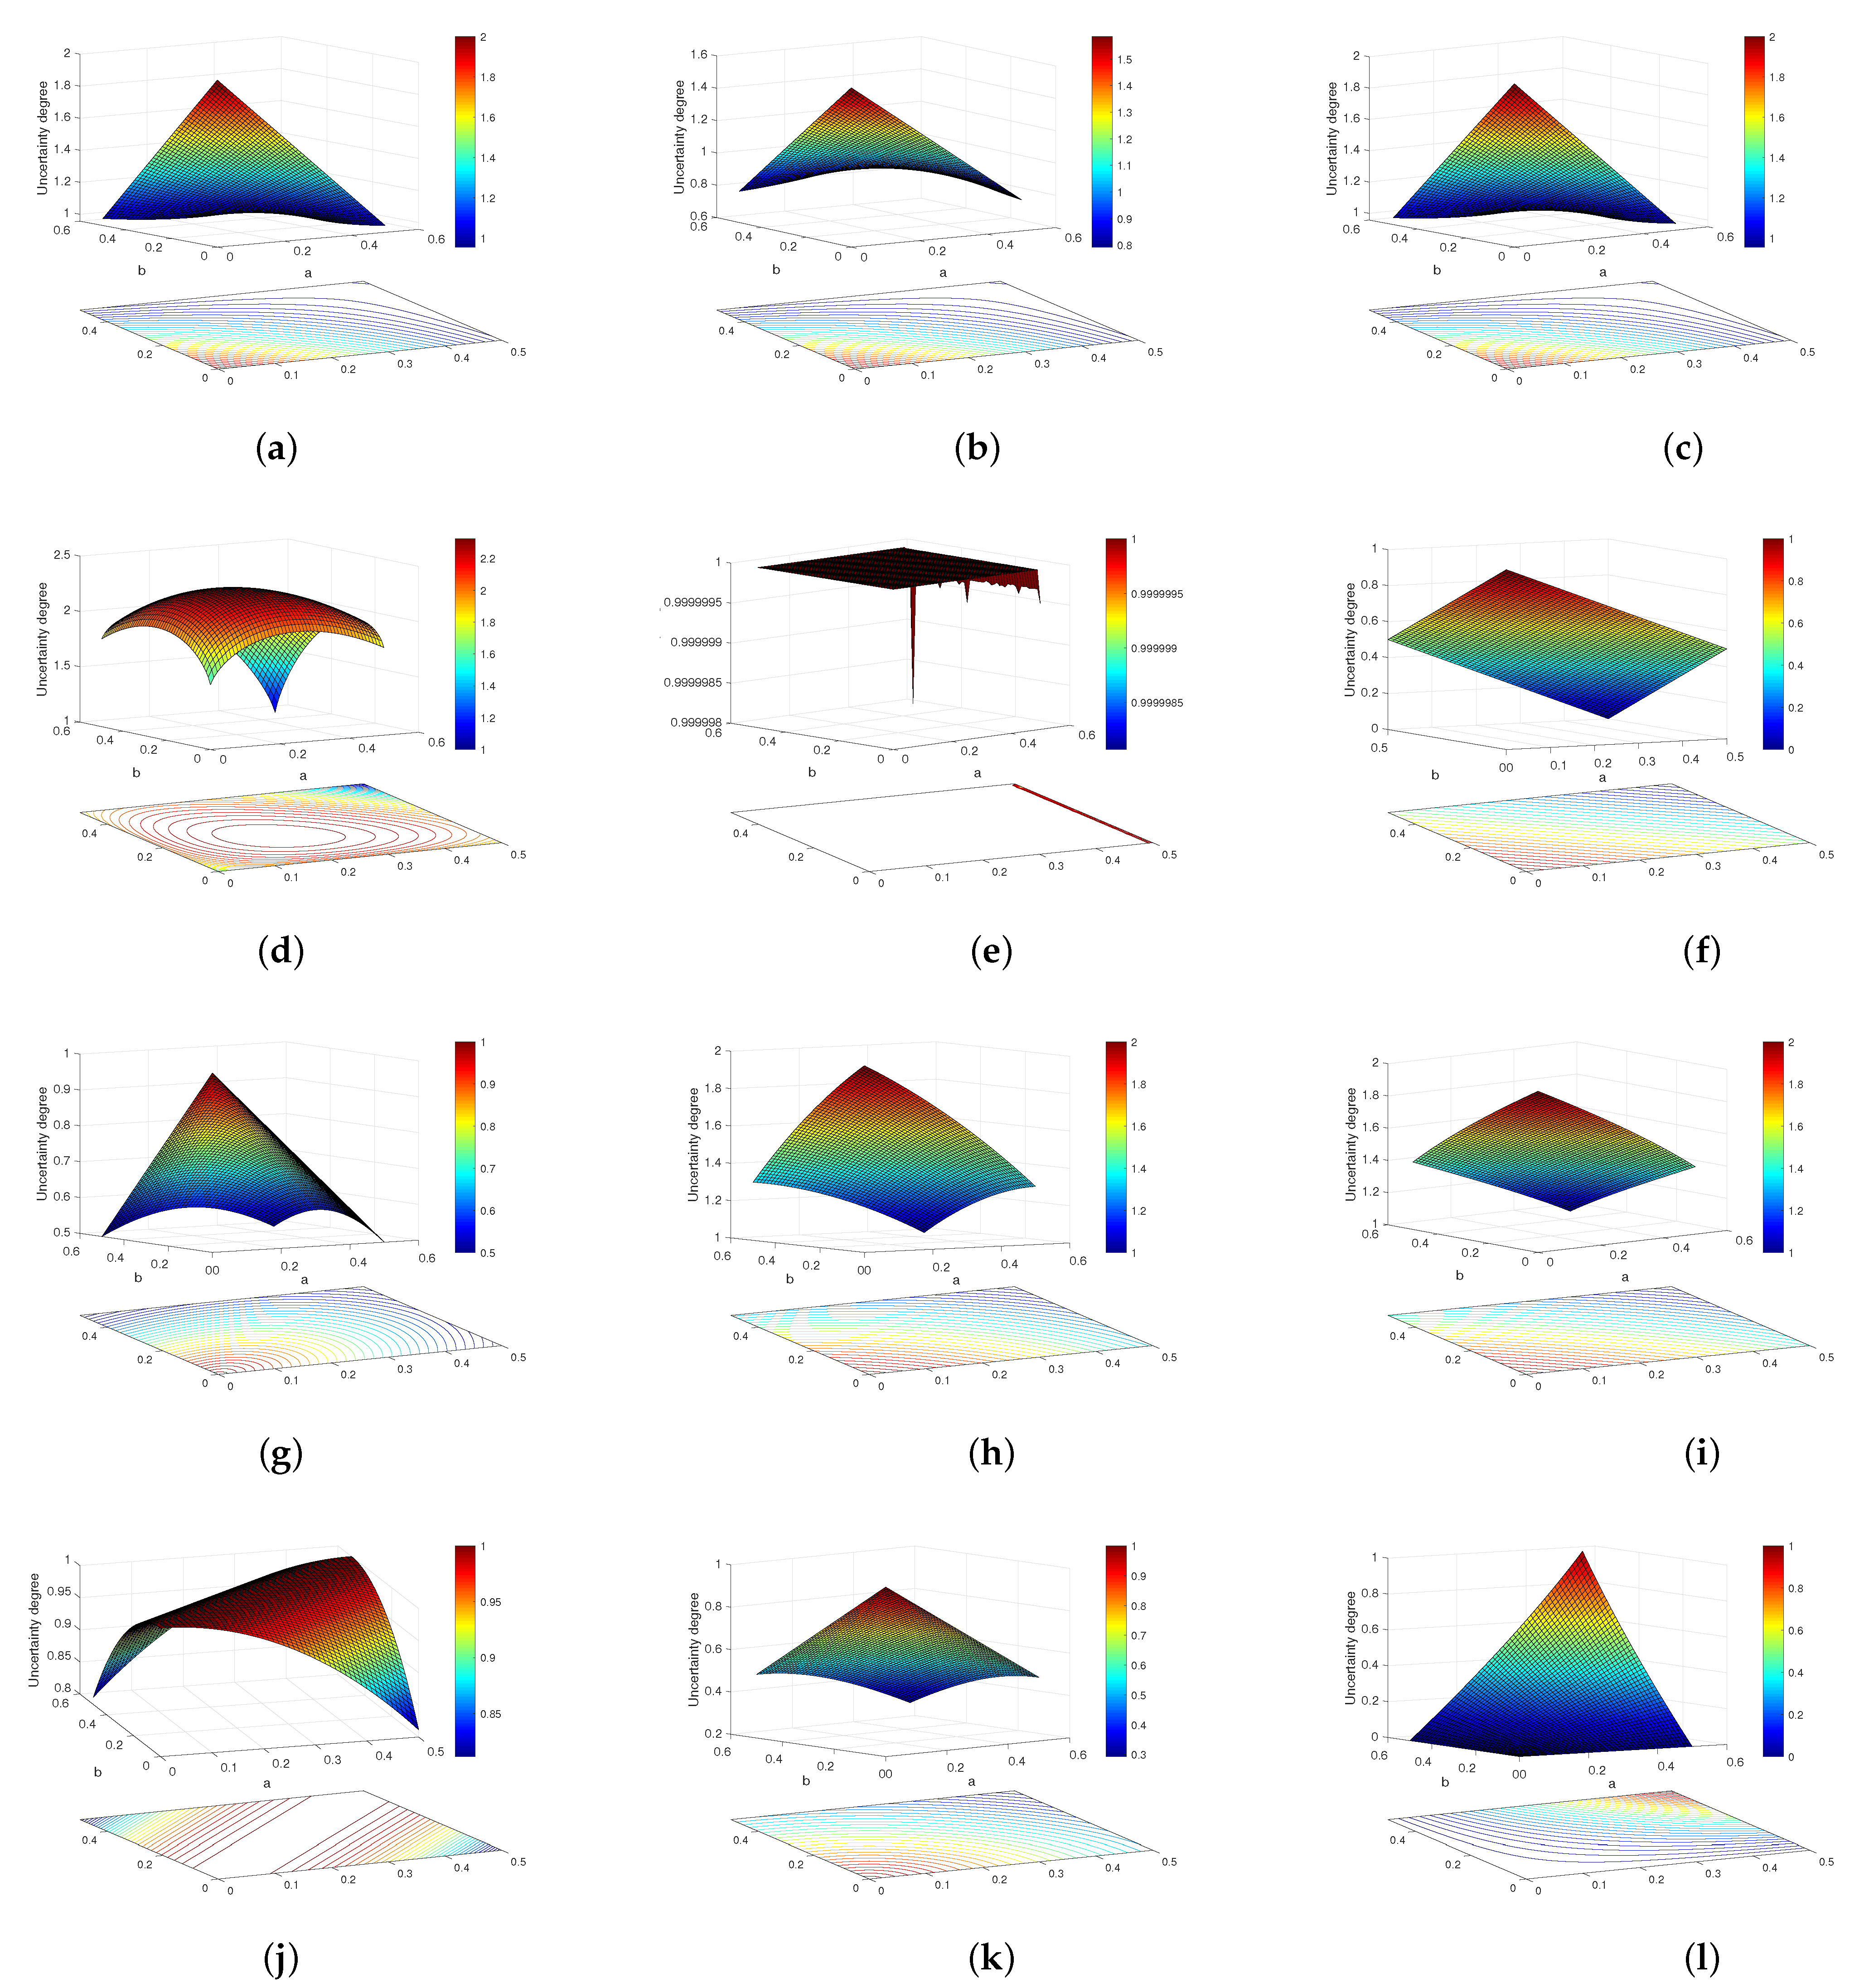
Let be a FOD with two elements. Additionally, we give a BPA as:
where . This example is adopted from [53]. Here, we calculate the uncertainty values based on the proposed methods and some existing methods with the changes of a and b. The results are shown in Figure 4.
For the proposed methods , , and , Yang and Han’s measure, weighted Hartley entropy, SU, JS, and Deng’s measure (), it can be found that the maximum uncertainty is obtained when , which is consistent with the property of maximum entropy. In addition, as the value of decreases, the uncertainty of BOE decreases gradually. As for Deng entropy, according to [26], its maximum uncertainty is obtained at , , and , which is consistent with Figure 4d and does not satisfy the maximum entropy property. For Yager’s dissonance entropy, the maximum uncertainty is obtained at . As the value of decreases, the uncertainty also increases, which is counter-intuitive. Hence, in this example, Yager’s dissonance entropy fails to measure the uncertainty of BOEs. Besides, for the method of AU, it obviously fails to measure the uncertainty of BOEs in this example.
The above numerical examples are analyzed and summarized. For Example 1, since we give a Bayesian mass function, the uncertainty of the Bayesian BPA is proportional to the number of elements n in FOD based on the proposed method. It can also be understood from the concept of entropy that with the increase of the elements number of FOD, the “chaos” degree of information in this example also increases. The results obtained by all methods are consistent with this understanding, except weighted Hartley entropy, and two different “measures” of Yang and Han, as well as Deng. For Example 2, we give a vacuous BPA. Obviously, as the number of elements in the FOD increases, the disorder of the system increases. This is true for all methods except Yager’s dissonance entropy. It is because Yager’s dissonance entropy only measures dissonance, not non-specificity. For Examples 3 and 4, the two BPAs given in each example are assigned the same belief value, but with different propositions. Because the uncertainty of a BPA is related to its belief value and proposition, the uncertainty is obviously different when the propositions are completely disjointed and partially intersected. Example 5 further illustrates the problem. In this example, the degree of intersection between the different propositions of the BPA changes gradually, that is, the belief values for elements in the FOD change gradually. Therefore, the degree of confusion in the system changes gradually, and the results of the uncertainty measure change accordingly. However, overall, as the number of elements in A increases, the confusion of BPA to the system should also increase. For Example 6, different belief values are assigned to BPA, but the propositions are the same. Obviously, when , the system is in a completely unknown state, so the uncertainty should be at the maximum, which is the maximum entropy.
The proposed method in this paper can effectively measure the uncertainty of BOEs in the above examples. However, for the non-specificity measure of BPA, function is determined based on the maximum entropy of three existing uncertainty measures. Actually, there are many other entropies which can be considered, such as info-entropy [32]. This is a good guide for our future research direction.
5. Application
In this section, feature evaluation is performed with the Iris dataset to further verify the rationality of the proposed uncertainty measure. In the Iris dataset, three types of iris plants are surveyed, including “Setosa“, “Versicolour“, and “Virginica“. Besides, sepal length (SL), sepal width (SW), petal length (PL), and petal width (PW) are taken as four features. With respect to each iris class, each feature of instances is a Gaussian distribution with different standard deviations and means, as shown in Table 6 and Figure 5.
As shown in Figure 5, intuitively, has the best class discriminability, which is attributed to the best separation of Gaussian probability density functions (PDFs) of the three iris types, while the PDFs of the three iris types in almost overlap. Thus, the class discriminability of is the worst.
In addition, the method proposed in [54] is utilized to quantify the discriminability of different fault features, which is as shown below.
where is the trace of a matrix, and and are the within-types scatter matrix and between-types scatter matrix, respectively.
with
where X is a feature vector of a sample and M is the mean of all fault types’ centroids.
The smaller the value of J, the better the discriminability of the corresponding fault feature. For the fault features, the J values are
The above results are the same as those intuitively obtained in Figure 5. The rank of the four fault features is .
Now, we turn to using uncertainty measures for feature evaluation, including weighted Hartley entropy, AU, Yang and Han’s measure, Deng’s measure, AM, JS, Deng entropy, SU, and the proposed method.
- Step1 (BPA generation).
- For different features in , we generate the BPA corresponding to each sample in the fault dataset according to [55].
- Step2 (Uncertainty measure of BPAs).
- For each feature, calculate the uncertainty of each BPA on it by using all the above uncertainty measures.
- Step3 (Average uncertainty measure).
- Calculate the average uncertainty value on different features corresponding to different methods.
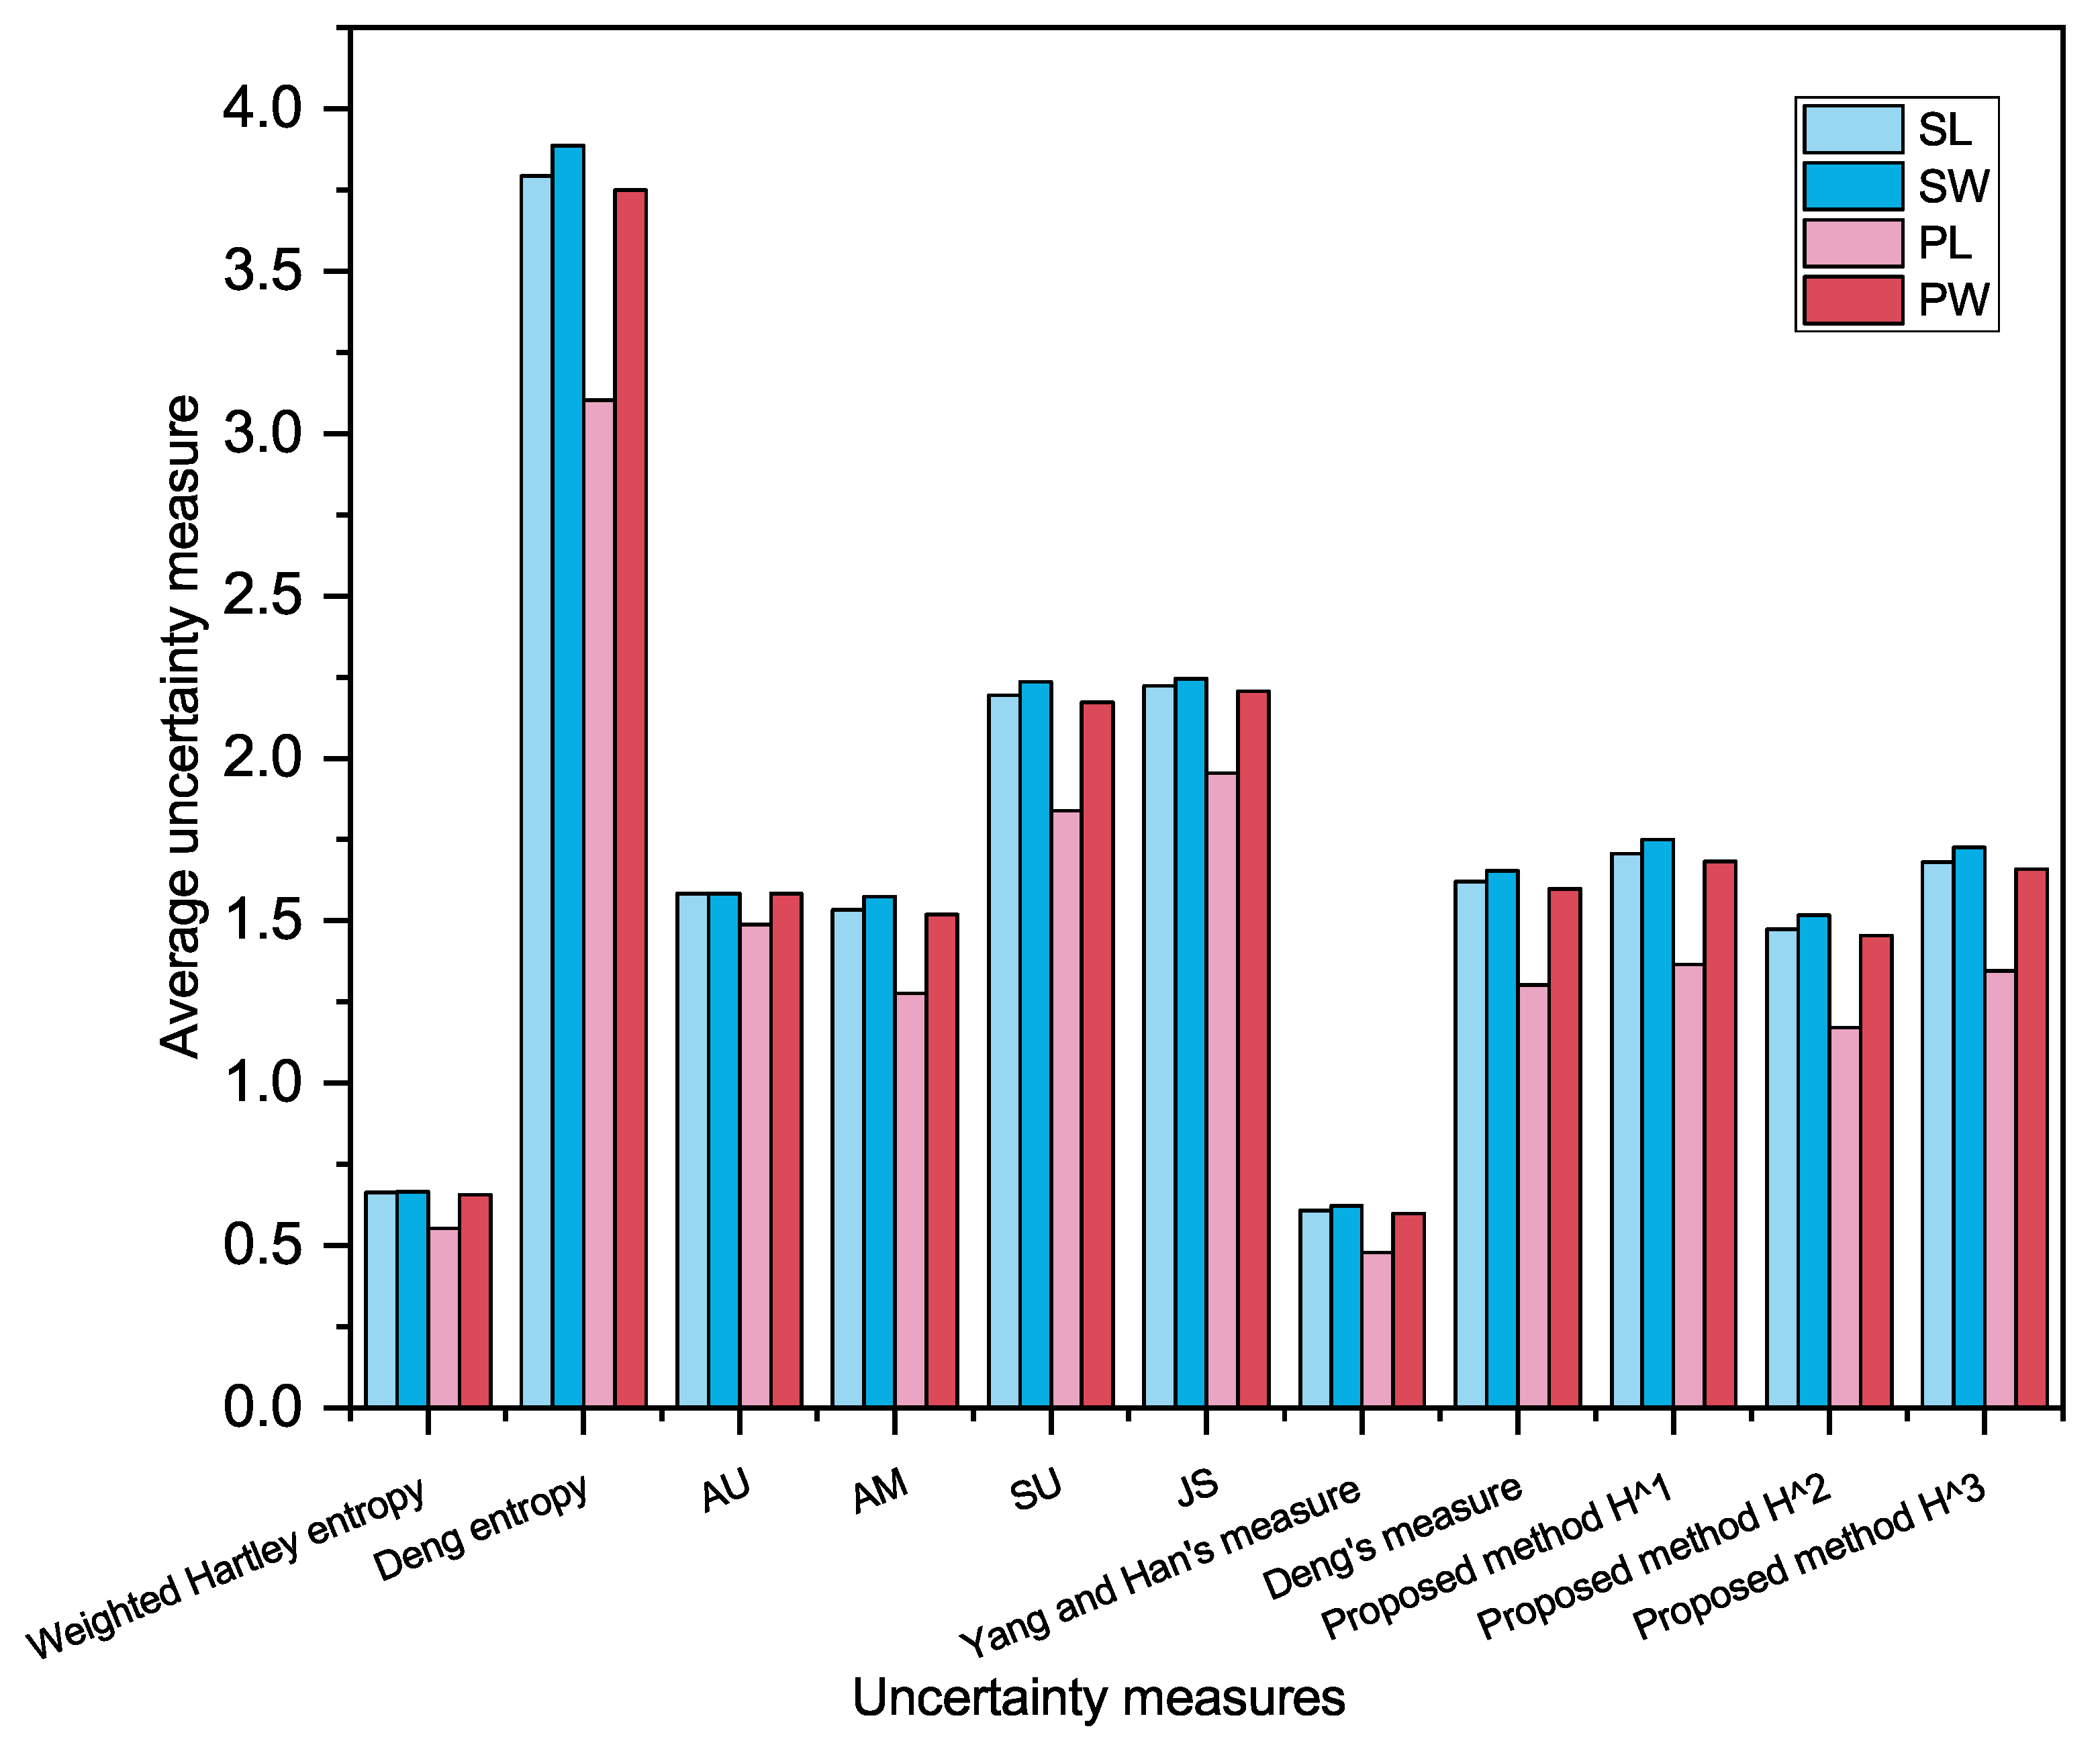
The results are shown in Table 7, and visually represented in the histogram, which are shown in Figure 6.
Features with smaller average uncertainty have better discriminability. It can be found in Table 7 and Figure 6 that for the proposed methods , and , the average uncertainty on feature PL is the smallest. The result indicates the feature PL has the best ability to distinguish the iris types. The ranking of the discrimination of the four features is , which is consistent with intuition obtained by Figure 5. The same result can be obtained by Deng entropy, AM, SU, JS, Yang and Han’s measure, and Deng’s measure except weighted Hartley entropy and AU. Therefore, the application has demonstrated the effectiveness of the proposed method.
6. Conclusions
In this work, we proposed a new total uncertainty measure from the perspective of maximum entropy requirement. The properties of the proposed method are analyzed, such as non-negativity, monotonicity, maximum entropy, and so on. Besides, we give three uncertainty measure functions for the body of evidences, and analyze the effectiveness and reasonableness of the proposed methods through several different numerical examples and an application. It can be seen from these examples that our methods are in general agreement with the connotation of uncertainty. Compared with Deng entropy, the proposed method can effectively measure the uncertainty of BPA when the propositions intersect with the same reliability value, and satisfy the maximum entropy property. In addition, it is not that the greater the uncertainty for a BPA, the better the measure. How do we evaluate uncertainty measure methods more rationally in DST? Is there a reasonable indicator system for the evaluation? Actually, we think that when we adapt the proposed method, and the uncertainty trend of the measured evidence is consistent with the theory, it can be considered as a reasonable and effective method. Our study provides the framework for further studies to assess the performance characteristics of uncertainty function. Our results are encouraging and should be validated in application areas, such as decision-making, fault diagnosis, target recognition, and many other areas. We will be devoted to the applications in depth in further work. Beyond that, a maximum entropy from the Parker and Jeynes argument showed that the entropy of the supermassive black hole at the centre of the Milky Way can account for the geometrical stability of the galaxy. We believe that this is a good guide for our future work about uncertainty measures.
Author Contributions
Conceptualization, Y.Z., X.D. and W.J.; methodology, Y.Z., X.D. and W.J.; software, Y.Z. and F.H.; validation, Y.Z. and F.H.; data curation, Y.Z. and F.H.; writing—original draft preparation, Y.Z.; writing—review and editing, Y.Z. and F.H.; supervision, X.D. and W.J. All authors have read and agreed to the published version of the manuscript.
Funding
This work was supported by the Shaanxi Key Research and Development Program (Grant No.2021ZDLGY01-04), the Innovation Foundation for Doctor Dissertation of Northwestern Polytechnical University (Grant No.CX2021078) and the National Natural Science Foundation of China (Grant No.61671384).
Institutional Review Board Statement
Not applicable.
Informed Consent Statement
Not applicable.
Data Availability Statement
Not applicable.
Conflicts of Interest
The authors declare no conflict of interest for publishing in this journal.
Abbreviations
The following abbreviations are used in this manuscript:
| PT | probability theory |
| DST | Dempster-Shafer evidence theory |
| FOD | Frame of Discernment |
| BPA | basic probability assignment |
| BOE | body of evidence |
References
- Denoeux, T. A k-nearest neighbor classification rule based on Dempster-Shafer theory. IEEE Trans. Syst. Man Cybern. 1995, 25, 804–813. [Google Scholar] [CrossRef] [Green Version]
- Xiao, F. Multi-sensor data fusion based on the belief divergence measure of evidences and the belief entropy. Inf. Fusion 2019, 46, 23–32. [Google Scholar] [CrossRef]
- Farag, W. Kalman-filter-based sensor fusion applied to road-objects detection and tracking for autonomous vehicles. Proc. Inst. Mech. Eng. Part I J. Syst. Control. Eng. 2021, 23, 1125–1138. [Google Scholar]
- Liu, X.; Zhou, B.; Huang, P.; Xue, W.; Li, Q.; Zhu, J.; Qiu, L. Kalman Filter-Based Data Fusion of Wi-Fi RTT and PDR for Indoor Localization. IEEE Sens. J. 2021, 21, 8479–8490. [Google Scholar] [CrossRef]
- Xiao, F. CaFtR: A Fuzzy Complex Event Processing Method. Int. J. Fuzzy. Syst. 2021. [Google Scholar] [CrossRef]
- Sauta, E.; Demartini, A.; Vitali, F.; Riva, A.; Bellazzi, R. A Bayesian data fusion based approach for learning genome-wide transcriptional regulatory networks. BMC Bioinform. 2020, 21, 1–28. [Google Scholar] [CrossRef]
- Chen, H.; Maduranga, D.A.K.; Mundra, P.; Zheng, J. Bayesian Data Fusion of Gene Expression and Histone Modification Profiles for Inference of Gene Regulatory Network. IEEE-ACM Trans. Comput. Biol. Bioinform. 2020, 17, 516–525. [Google Scholar] [CrossRef] [PubMed]
- Holzinger, A.; Malle, B.; Saranti, A.; Pfeifer, B. Towards multi-modal causability with Graph Neural Networks enabling information fusion for explainable AI. Inf. Fusion 2021, 71, 28–37. [Google Scholar] [CrossRef]
- Dempster, A. Upper and Lower Probabilities Induced by a Multivalued Mapping. Ann. Mathmatical Stat. 1967, 38, 325–339. [Google Scholar] [CrossRef]
- Shafer, G. A Mathematical Theory of Evidence; Princeton University Press: Princeton, NJ, USA, 1976. [Google Scholar]
- Lin, Y.; Li, Y.; Yin, X.; Dou, Z. Multisensor Fault Diagnosis Modeling Based on the Evidence Theory. IEEE Trans. Reliab. 2018, 67, 513–521. [Google Scholar] [CrossRef]
- Zhang, Y.; Jiang, W.; Deng, X. Fault diagnosis method based on time domain weighted data aggregation and information fusion. Int. J. Distrib.Sens. Netw. 2019, 15. [Google Scholar] [CrossRef]
- Liu, Z.; Xiao, F. An Intuitionistic Evidential Method for Weight Determination in FMEA Based on Belief Entropy. Entropy 2019, 21, 211. [Google Scholar] [CrossRef] [Green Version]
- Ji, X.; Ren, Y.; Tang, H.; Shi, C.; Xiang, J. An intelligent fault diagnosis approach based on Dempster-Shafer theory for hydraulic valves. Measurement 2020, 165, 108129. [Google Scholar] [CrossRef]
- Pisano, R.; Sozzo, S. A Unified Theory of Human Judgements and Decision-Making under Uncertainty. Entropy 2020, 22, 738. [Google Scholar] [CrossRef] [PubMed]
- Zhang, H.; Jiang, W.; Deng, X. Data-driven multi-attribute decision-making by combining probability distributions based on compatibility and entropy. Appl. Intell. 2020, 50, 4081–4093. [Google Scholar] [CrossRef]
- Seiti, H.; Hafezalkotob, A.; Najafi, S.E.; Khalaj, M. A risk-based fuzzy evidential framework for FMEA analysis under uncertainty: An interval-valued DS approach. J. Int, Fuzzy Syst. 2018, 35, 1419–1430. [Google Scholar] [CrossRef]
- Zhang, W.; Deng, Y. Combining conflicting evidence using the DEMATEL method. Soft Comput. 2018. [Google Scholar] [CrossRef]
- Li, H.; Xiao, F. A method for combining conflicting evidences with improved distance function and Tsallis entropy. Int. J. Intell. Syst. 2020, 35, 1814–1830. [Google Scholar] [CrossRef]
- Liang, H.; Cai, R. A new correlation coefficient of BPA based on generalized information quality. Int. J. Intell. Syst. 2021. [Google Scholar] [CrossRef]
- Ni, S.; Lei, Y.; Tang, Y. Improved Base Belief Function-Based Conflict Data Fusion Approach Considering Belief Entropy in the Evidence Theory. Entropy 2020, 22, 801. [Google Scholar] [CrossRef] [PubMed]
- Smets, P. The Combination of Evidence in the Transferable Belief Model. IEEE Trans. Pattern Anal. Mach. Intell. 1990, 12, 447–458. [Google Scholar] [CrossRef]
- Zhan, J.; Jiang, W. A modified combination rule in generalized evidence theory. Appl. Intell. 2017, 46, 630–640. [Google Scholar]
- Wang, J.; Qiao, K.; Zhang, Z. An improvement for combination rule in evidence theory. Futur. Gener. Comp. Syst. 2019, 91, 1–9. [Google Scholar] [CrossRef]
- Matsuyama, T. Belief formation from observation and belief integration using virtual belief space in Dempster-Shafer probability model. In Proceedings of the 1994 IEEE International Conference on MFI’94. Multisensor Fusion and Integration for Intelligent Systems 1994, Las Vegas, NV, USA, 2–5 October 1994; pp. 379–386. [Google Scholar] [CrossRef]
- Deng, Y. Information Volume of Mass Function. arXiv 2020, arXiv:2012.07507. [Google Scholar]
- Zhou, Q.; Deng, Y. Higher order information volume of mass function. Int. J. Comput. Commun. Control 2020, 15. [Google Scholar] [CrossRef]
- Xiao, F. CEQD: A complex mass function to predict interference effects. IEEE Trans. Cybern. 2021. [Google Scholar] [CrossRef]
- Rényi, A. On measures of entropy and information. Virology 1985, 142, 158–174. [Google Scholar]
- Shannon, C. A mathematical theory of communication. ACM Sigmobile Mob. Comput. Commun. Rev. 2001, 5, 3–55. [Google Scholar] [CrossRef]
- Prigogine, I. The End of Certainty; Free Press: New York, NY, USA, 1997; ISBN 9780684837055. [Google Scholar]
- Parker, M.C.; Jeynes, C. Maximum Entropy (Most Likely) Double Helical and Double Logarithmic Spiral Trajectories in Space-Time. Sci. Rep. 2019, 1, 10779. [Google Scholar] [CrossRef]
- Zhou, M.; Liu, X.; Yang, J.; Chen, Y.; Wu, J. Evidential reasoning approach with multiple kinds of attributes and entropy-based weight assignment. Knowl. Syst. 2019, 163, 358–375. [Google Scholar] [CrossRef]
- Nguyen, H.T. On entropy of random sets and possibility distributions. Anal. Fuzzy Inf. 1987, 1, 145–156. [Google Scholar]
- Dubois, D.; Prade, H. Properties of measures of information in evidence and possibility theories. Fuzzy Sets Syst. 1987, 24, 161–182. [Google Scholar] [CrossRef]
- Höhle, U. Entropy with respect to plausibility measures. In Proceedings of the 12th International Symposium on Multiple-Valued Logic, Paris, France, 25–27 May 1982. [Google Scholar]
- Yager, R. Entropy and specificity in a mathematical theory theory of evidence. Int. J. Gen. Syst. 1983, 9, 249–260. [Google Scholar] [CrossRef]
- Klir, G.J.; Ramer, A. Uncertainty in the Dempster-Shafer theory: A critycal re-examination. Int. J. Gen. Syst. 1990, 18, 155–166. [Google Scholar] [CrossRef]
- Klir, G.J.; Parviz, B. A note on the measure of discord. Uncertain. Artificaial Intell. Proc. Eighth Conf. 1992, 18, 138–141. [Google Scholar]
- Jousselme, A.L.; Liu, C.; Grenier, D.; Bosse, E. Measuring ambiguity in the evidence theory. IEEE Trans. Syst. Man Cybern. Part A Syst. Hum. 2006, 36, 890–903. [Google Scholar] [CrossRef]
- Deng, Y. Deng entropy. Chaos, Solitons Fractals 2016, 91, 549–553. [Google Scholar] [CrossRef]
- Yang, Y.; Han, D. A New Distance-Based Total Uncertainty Measure in the Theory of Belief Functions. Know. Based Syst. 2016, 94, 114–123. [Google Scholar] [CrossRef]
- Harmanec, D.; Klir, G.J. Measuring total uncertainty in Dempster-Shafer theory: A novel approach. Int. J. Gen. Syst. 1994, 22, 405–419. [Google Scholar] [CrossRef]
- Wang, X.; Song, Y. Uncertainty measure in evidence theory with its applications. Appl. Intell. 2018, 48, 1672–1688. [Google Scholar] [CrossRef]
- Jirousek, R.; Shenoy, P. A new definition of entropy of belief functions in the Dempster-Shafer theory. Int. J. Approx. Reason. 2018, 92, 49–65. [Google Scholar] [CrossRef] [Green Version]
- Deng, X. Analyzing the monotonicity of belief interval based uncertainty measures in belief function theory. Int. J. Intell. Syst. 2018, 33, 1775–1985. [Google Scholar] [CrossRef]
- Abellán, J.; Moral, S. Completing a total uncertainty measure in the Dempster-Shfer theory. Int. J. Gen. Syst. 1999, 28, 299–314. [Google Scholar] [CrossRef]
- Yager, R.R. Interval valued entropies for Dempster–Shafer structures. Know. Based Syst. 2018, 161, 390–397. [Google Scholar] [CrossRef]
- Xue, Y.; Deng, Y. Interva1-va1ued be1ief entropies for Dempster Shafer structures. Soft Comput. 2021, 25, 8063–8071. [Google Scholar] [CrossRef] [PubMed]
- Abellán, J.; Masegosa, A. Requirements for total uncertainty measures in Dempster–Shafer theory of evidence. Int. J. Gen. Syst. 2008, 37, 733–747. [Google Scholar] [CrossRef]
- Deng, X.; Jiang, W.; Zhang, J. Zero-Sum Matrix Game with Payoffs of Dempster-Shafer Belief Structures and Its Applications on Sensors. Sensors 2017, 17, 922. [Google Scholar] [CrossRef] [Green Version]
- Jiang, W.; Hu, W. An improved soft likelihood function for Dempster–Shafer belief structures. Int. J. Intell. Syst. 2018, 33, 1264–1282. [Google Scholar] [CrossRef]
- Deng, Y. Uncertainty measure in evidence theory. Sci. China Inf. Sci. 2020, 63, 210201. [Google Scholar] [CrossRef]
- Duda, R.O.; Hart, P.E.; Stork, D.G. Pattern Classification; John Willey & Sons: Hoboken, NJ, USA, 2012. [Google Scholar]
- Masson, M.; Denoeux, T. ECM: An evidential version of the fuzzy c-means algorithm. Pattern Recognit 2008, 41, 1384–1397. [Google Scholar] [CrossRef]
Figure 1.
Comparison results of Example 1.

Figure 2.
Comparison results of Example 2.

Figure 3.
Comparison results of Example 5.

Figure 4.
Comparison results of Example 7. (a) The proposed method ; (b) the proposed method ; (c) the proposed method ; (d) Deng entropy; (e) AU; (f) weighted Hartley entropy; (g) Yang and Han’s measure; (h) SU; (i)JS; (j) AM; (k) Deng’s measure(); (l) Yager’s dissonance entropy.
Figure 4.
Comparison results of Example 7. (a) The proposed method ; (b) the proposed method ; (c) the proposed method ; (d) Deng entropy; (e) AU; (f) weighted Hartley entropy; (g) Yang and Han’s measure; (h) SU; (i)JS; (j) AM; (k) Deng’s measure(); (l) Yager’s dissonance entropy.

Figure 5.
Probability density functions (PDFs) of different features of samples in the Iris dataset.
Figure 5.
Probability density functions (PDFs) of different features of samples in the Iris dataset.

Figure 6.
Average uncertainty of samples on each feature based on different uncertainty measures.


Table 1.
The comparison between the proposed method and some existing methods in Example 2.
| Uncertainty Measures | ||||||||||||||
|---|---|---|---|---|---|---|---|---|---|---|---|---|---|---|
| Deng entropy | 0 | 1.5850 | 2.8074 | 3.9069 | 4.9542 | 5.9773 | 6.9887 | 7.9944 | 8.9972 | 9.9986 | 10.9993 | 11.9996 | 12.9998 | 13.9999 |
| AU | 0 | 1 | 1.5850 | 2 | 2.3219 | 2.5850 | 2.8074 | 3 | 3.1699 | 3.3219 | 3.4594 | 3.5850 | 3.7004 | 3.8074 |
| Weighted Hartley entropy | 0 | 1 | 1.5850 | 2 | 2.3219 | 2.5850 | 2.8074 | 3 | 3.1699 | 3.3219 | 3.4594 | 3.5850 | 3.7004 | 3.8074 |
| Yang and Han’s measure | 0 | 2 | 3 | 4 | 5 | 6 | 7 | 8 | 9 | 10 | 11 | 12 | 13 | 14 |
| SU | 0 | 2 | 3 | 4 | 5 | 6 | 7 | 8 | 9 | 10 | 11 | 12 | 13 | 14 |
| JS | 0 | 2 | 3.1699 | 4 | 4.6439 | 5.1699 | 5.6147 | 6 | 6.3399 | 6.6439 | 6.9189 | 7.1699 | 7.4009 | 7.6147 |
| AM | 0 | 1 | 1.5850 | 2 | 2.3219 | 2.5850 | 2.8074 | 3 | 3.1699 | 3.3219 | 3.4594 | 3.5850 | 3.7004 | 3.8074 |
| Deng’s measure() | 0 | 2 | 3 | 4 | 5 | 6 | 7 | 8 | 9 | 10 | 11 | 12 | 13 | 14 |
| Yager’s dissonance entropy | 0 | 0 | 0 | 0 | 0 | 0 | 0 | 0 | 0 | 0 | 0 | 0 | 0 | 0 |
| Proposed method | 0 | 2 | 3.1699 | 4 | 4.6439 | 5.1699 | 5.6147 | 6 | 6.3399 | 6.6439 | 6.9189 | 7.1699 | 7.4009 | 7.6147 |
| Proposed method | 0 | 1.5850 | 2.8074 | 3.9069 | 4.9542 | 5.9773 | 6.9887 | 7.9944 | 8.9972 | 9.9986 | 10.9993 | 11.9996 | 12.9998 | 13.9999 |
| Proposed method | 0 | 2 | 3 | 4 | 5 | 6 | 7 | 8 | 9 | 10 | 11 | 12 | 13 | 14 |
Table 2.
The uncertainty measured by other methods in Example 3.
| Uncertainty Measures | ||
|---|---|---|
| Deng entropy | 2.3219 | 2.3219 |
| AU | 1 | 1.9710 |
| Weighted Hartley entropy | 0.6 | 0.6 |
| Yang and Han’s measure | 0.4 | 0.4394 |
| SU | 1.6 | 2.5710 |
| JS | 1.6 | 2.4113 |
| AM | 1 | 1.9710 |
| Deng’s measure () | 0.3586 | 0.3877 |
| Yager’s dissonance entropy | 0.1288 | 1.3710 |
Table 3.
The uncertainty measured by different methods in Example 4.
| Uncertainty Measures | ||
|---|---|---|
| Deng entropy | 2.5559 | 2.5559 |
| AU | 1.9710 | 1.9710 |
| Weighted Hartley entropy | 1.0000 | 1.0000 |
| Yang and Han’s measure | 0.5000 | 0.5000 |
| SU | 2.9710 | 2.4855 |
| JS | 2.9710 | 2.4855 |
| AM | 1.9710 | 1.4855 |
| Deng’s measure () | 0.5000 | 0.5000 |
| Yager’s dissonance entropy | 0.9710 | 0 |
| Proposed method | 2.9710 | 2.0000 |
| Proposed method | 2.5559 | 1.5850 |
| Proposed method | 2.9710 | 2.0000 |
Table 4.
The comparison between the proposed method and some existing methods in Example 5.
| Uncertainty Measures | |||||||
|---|---|---|---|---|---|---|---|
| Deng entropy | 2.6623 | 2.9303 | 4.9082 | 5.7878 | 6.6256 | 7.4441 | 8.2532 |
| AU | 1.4328 | 2.2180 | 2.6707 | 2.9821 | 3.0378 | 3.2447 | 3.2956 |
| Weighted Hartley entropy | 0.4699 | 1.2699 | 1.7379 | 2.0699 | 2.3275 | 2.5379 | 2.7158 |
| Yang and Han’s measure | 0.1246 | 0.2216 | 0.2749 | 0.3283 | 0.3816 | 0.4349 | 0.4867 |
| SU | 4.3583 | 5.7797 | 6.4096 | 7.0394 | 7.6693 | 8.3716 | 8.9394 |
| JS | 3.8322 | 4.4789 | 4.8870 | 5.2250 | 5.5200 | 5.8059 | 6.0425 |
| AM | 1.3461 | 2.1037 | 2.4623 | 2.7011 | 2.8762 | 3.0684 | 3.1083 |
| Deng’s measure ( ) | 0.1195 | 0.2199 | 0.2732 | 0.3266 | 0.3799 | 0.4332 | 0.4853 |
| Yager’s dissonance entropy | 0.3953 | 0.3953 | 0.1997 | 0.1997 | 0.1997 | 0.1997 | 0.0074 |
| Proposed method | 1.3352 | 2.9352 | 3.6756 | 4.3396 | 4.8547 | 5.2756 | 5.4390 |
| Proposed method | 2.0357 | 3.3036 | 4.0860 | 4.9656 | 5.8035 | 6.6219 | 7.2387 |
| Proposed method | 2.0453 | 3.6453 | 4.2497 | 5.0497 | 5.8497 | 6.6497 | 7.2574 |
Table 5.
The comparison between the proposed method and some existing methods in Example 5.
| Uncertainty Measures | |||||||
|---|---|---|---|---|---|---|---|
| Deng entropy | 9.0578 | 9.8600 | 10.6612 | 11.4617 | 12.2620 | 13.0622 | 13.8622 |
| AU | 3.4497 | 3.5796 | 3.6909 | 3.7824 | 3.8538 | 3.8986 | 3.9069 |
| Weighted Hartley entropy | 2.8699 | 3.0059 | 3.1275 | 3.2375 | 3.3379 | 3.4303 | 3.5158 |
| Yang and Han’s measure | 0.5400 | 0.5933 | 0.6467 | 0.7000 | 0.7533 | 0.8067 | 0.8600 |
| SU | 9.6417 | 10.3440 | 11.0463 | 11.7486 | 12.4510 | 13.1533 | 13.8556 |
| JS | 6.2772 | 6.4921 | 6.6903 | 6.8743 | 7.0461 | 7.2071 | 7.3587 |
| AM | 3.2511 | 3.3747 | 3.4833 | 3.5797 | 3.6663 | 3.7446 | 3.8160 |
| Deng’s measure () | 0.5386 | 0.5920 | 0.6453 | 0.6986 | 0.7520 | 0.8053 | 0.8586 |
| Yager’s dissonance entropy | 0.0074 | 0.0074 | 0.0074 | 0.0074 | 0.0074 | 0.0074 | 0.0074 |
| Proposed method | 5.7473 | 6.0192 | 6.2624 | 6.4824 | 6.6832 | 6.8680 | 7.0390 |
| Proposed method | 8.0432 | 8.8455 | 9.6466 | 10.4472 | 11.2475 | 12.0476 | 12.8477 |
| Proposed method | 8.0574 | 8.8574 | 9.6574 | 10.4574 | 11.2574 | 12.0574 | 12.8574 |
Table 6.
The mean value and standard deviation value for features.
| Features | Setosa | Versicolour | Virginica | |
|---|---|---|---|---|
| SL | Mean | 5.0060 | 5.9360 | 6.5880 |
| Standard deviation | 0.3525 | 0.5162 | 0.6359 | |
| SW | Mean | 3.4180 | 2.7700 | 2.9740 |
| Standard deviation | 0.3810 | 0.3138 | 0.3225 | |
| PL | Mean | 1.4640 | 4.2600 | 5.5520 |
| Standard deviation | 0.1735 | 0.4699 | 0.5519 | |
| PW | Mean | 0.2440 | 1.3260 | 2.0260 |
| Standard deviation | 0.1072 | 0.1978 | 0.2747 |
Table 7.
The average uncertainty for different features.
| Uncertainty Measures | SL | SW | PL | PW |
|---|---|---|---|---|
| Weighted Hartley entropy | 0.6642 | 0.6660 | 0.5540 | 0.6556 |
| Deng entropy | 3.7394 | 3.8863 | 3.1025 | 3.7501 |
| AU | 1.5850 | 1.5850 | 1.4869 | 1.5850 |
| AM | 1.5333 | 1.5756 | 1.2764 | 1.5183 |
| SU | 2.1950 | 2.2364 | 1.8396 | 2.1723 |
| JS | 2.2226 | 2.2463 | 1.9536 | 2.2068 |
| Yang and Han’s measure | 0.6072 | 0.6227 | 0.4787 | 0.5986 |
| Deng’s measure | 1.6208 | 1.6532 | 1.3023 | 1.5981 |
| Proposed method | 1.7057 | 1.7509 | 1.3665 | 1.6833 |
| Proposed method | 1.4729 | 1.5178 | 1.1709 | 1.4542 |
| Proposed method | 1.6810 | 1.7260 | 1.3467 | 1.6586 |
Publisher’s Note: MDPI stays neutral with regard to jurisdictional claims in published maps and institutional affiliations. |
© 2021 by the authors. Licensee MDPI, Basel, Switzerland. This article is an open access article distributed under the terms and conditions of the Creative Commons Attribution (CC BY) license (https://creativecommons.org/licenses/by/4.0/).
Share and Cite
MDPI and ACS Style
Zhang, Y.; Huang, F.; Deng, X.; Jiang, W. A New Total Uncertainty Measure from A Perspective of Maximum Entropy Requirement. Entropy 2021, 23, 1061. https://0-doi-org.brum.beds.ac.uk/10.3390/e23081061
AMA Style
Zhang Y, Huang F, Deng X, Jiang W. A New Total Uncertainty Measure from A Perspective of Maximum Entropy Requirement. Entropy. 2021; 23(8):1061. https://0-doi-org.brum.beds.ac.uk/10.3390/e23081061
Chicago/Turabian StyleZhang, Yu, Fanghui Huang, Xinyang Deng, and Wen Jiang. 2021. "A New Total Uncertainty Measure from A Perspective of Maximum Entropy Requirement" Entropy 23, no. 8: 1061. https://0-doi-org.brum.beds.ac.uk/10.3390/e23081061
Note that from the first issue of 2016, this journal uses article numbers instead of page numbers. See further details here.