Article

Quantitative Evaluation and Obstacle Factor Diagnosis of Agricultural Drought Disaster Risk Using Connection Number and Information Entropy

1
School of Civil Engineering, Hefei University of Technology, Hefei 230009, China
2
Institute of Water Resources and Environmental Systems Engineering, Hefei University of Technology, Hefei 230009, China
*
Author to whom correspondence should be addressed.
Submission received: 21 April 2022 / Revised: 9 June 2022 / Accepted: 23 June 2022 / Published: 25 June 2022

Abstract

:
To promote the application of entropy concepts in uncertainty analysis of water resources complex system, a quantitative evaluation and obstacle factor diagnosis model of agricultural drought disaster risk was proposed using connection number and information entropy. The results applied to Suzhou City showed that the agricultural drought disaster risks in Suzhou during 2007–2017 were all in middle-risk status, while it presented a decreasing trend from 2010. The information entropy values of the difference degree item bI were markedly lower than those of the difference degree b, indicating that bI provided more information in the evaluation process. Furthermore, the status of drought damage sensitivity and drought hazard were improved significantly. Nevertheless, high exposure to drought and weak drought resistance capacity seriously impeded the reduction of risk. Thus, the key to decreasing risk was to maintain the level of damage sensitivity, while the difficulties were to reduce exposure and enhance resistance. In addition, the percentage of the agricultural population, population density, and percentage of effective irrigation area were the main obstacle factors of risk and also the key points of risk control in Suzhou. In short, the results suggest that the evaluation and diagnosis method is effective and conducive to regional drought disaster risk management.

1. Introduction

Food security is a hot topic that arouses constant attention from the international community [1,2]. With the increasing global climate change and the impact of human activities, the frequency, intensity, and scope of influence of drought increase significantly; thus, the drought disaster risk continues to increase. Drought disaster has seriously threatened food security in many countries and regions [3,4]. China is located in the southeast of Eurasia, characterized by a remarkable monsoon climate, uneven spatial and temporal distribution of precipitation, and frequent agricultural drought disasters [5,6,7]. According to the statistics, the annual average drought-affected area in China from 2006 to 2020 is 1.39 × 10⁷ hectares, causing grain losses of 2.14 × 10¹⁰ kg and direct economic losses of RMB 8.19 × 10⁹ billion [8]. Agricultural drought disaster has become one of the severe challenges facing food security and rural revitalization in China [9,10]. Since the 21st century, with the transformation from passive drought relief and emergency management to active drought relief and risk management, drought disaster risk management has gradually emerged [11,12,13]. Quantitative evaluation and obstacle factor diagnosis of drought disaster risks are the core contents and key points of risk management [14]. Therefore, the accurate evaluation and diagnosis of agricultural drought disaster risk in China’s main grain production areas are of great significance for improving the human ability to cope with droughts and providing guidance for regional drought disaster risk management [15,16].
Drought disaster risk evaluation is a hot spot in the field of natural disaster research. The existing methods mainly include three kinds [17]: (1) A probability statistics-based method. First, the great work of Kolmogorov [18] laid the foundation of probability and stochastics, which realized the axiomatization of probability theory. Koutsoyiannis et al. [19] pointed out that modern statistical and quantum physics promoted a new understanding and modeling of physical processes, such as drought disaster risk formation. Hao et al. [20] built a drought disaster loss frequency analysis model based on historical data and information diffusion theory and analyzed the agricultural drought disaster risk. Koutsoyiannis [21] proposed a general methodology for more theoretically justified stochastic processes, which provided an important thought for drought disaster risk evaluation from a probability statistics aspect. Xie et al. [22] used information diffusion and information matrix to analyze the probability and distribution of agricultural drought disaster risk. Yu et al. [23] established a natural disaster risk evaluation model composed of an evaluation index, relative loss calculation, and information diffusion. (2) A system-theory-based method. Kim et al. [24] built drought hazard index and vulnerability index, respectively, and multiplied these two to obtain the drought disaster risk index. Luo et al. [25] established a drought disaster risk evaluation system from four aspects and proposed a panel-data-based grey cloud clustering evaluation model. Hoque et al. [26] presented a comprehensive evaluation method for agricultural drought disaster risk by fuzzy superposition of all risk elements. (3) A formation cause-based method. Zhang et al. [27] used the CERES model to fit the relationship between the physical vulnerability curve of crops and the drought hazard index and established a dynamic evaluation model for drought disaster risk of maize. Wang et al. [28] adopted the APSIM model to establish the relationship between the frequency of drought intensity and the percentage of crop yield loss and evaluated the drought disaster risk of spring maize. Yin et al. [29] used the GEPIC-Vulnerability–Risk model to assess the occurrence probability and likelihood of yield losses from drought and conducted a quantitative evaluation of drought disaster risk for global-scale maize. However, considering the connection and evolution among drought disaster risk elements, as well as the feasibility of evaluation principle, data, and model, the current most effective and most widely used method for quantitative evaluation of drought disaster risk is to select representative evaluation indexes from drought disaster risk system, and adopt a system comprehensive evaluation thought [17,30].
Under the combined influence of natural conditions and social economy, the drought disaster risk system is a typical complex system [31]. At present, the multi-index system comprehensive evaluation by establishing an evaluation system and model is still an effective drought disaster risk evaluation method [17]. However, most models fail to take the uncertainty between the evaluation sample and evaluation criteria into full consideration, resulting in the deviation of evaluation results. Set pair analysis is a new quantitative analysis method of uncertainty [32]. The identical–different–inverse relation structure of the connection number for the set pair composed of two sets, i.e., evaluation sample and evaluation criteria, can be used to fully reflect the certainty and uncertainty between these two sets, which has been widely applied to natural disasters risk evaluation [33]. Wang et al. [34] proposed a set pair analysis method for the evaluation of flood damage risk. Zou et al. [35] adopted a set pair analysis-variable fuzzy set model to evaluate flood risk. Chen et al. [36] used set pair analysis and connection entropy to conduct a quantitative evaluation and diagnosis of agricultural drought disaster resistance capacity. Ge et al. [37] conducted an environmental impact risk evaluation of dam break based on set pair analysis and cloud model. Lyu et al. [38] adopted interval fuzzy numbers and set pair analysis to establish an evaluation model for urban water quality risk. Qu et al. [39] coupled unascertained measurement evaluation and set pair analysis to assess the risk of limestone karst water pouring out from the floor. Nevertheless, when set pair analysis is adopted for comprehensive system evaluation, most studies only reflect the evaluation results by the components of the connection number; they cannot determine the complete connection number value, which may cause information loss and restrict the development of set pair analysis [40]. What is more, the calculation of the difference degree coefficient is the key to determining the connection number value. In addition, only a few studies have been conducted on the quantitative evaluation of agricultural drought disaster risk in grain production areas, let alone the diagnosis of risk obstacle factors based on set pair analysis.
As an important part of the connection number, the difference degree coefficient is used for describing the uncertainty of set pair at a micro level, which has a significant impact on research results [32]. Some scholars have conducted studies on the calculation of the difference degree coefficient. Li et al. [41] derived the difference degree coefficient from the target value of the connection number. Tang [42] proposed an expert estimation approach of the difference degree coefficient. Pan et al. [43] built a trapezoidal fuzzy number of the difference degree coefficient and determined its value range within a confidence interval. Li et al. [40] adopted a full and partial connection number to distribute the difference degree coefficient. However, most of the calculation methods of the difference degree coefficient are rough, and they can only obtain the approximate value or interval range, which may cause a deviation between the research result and the actual situation. Moreover, the difference degree coefficient should be calculated fully combined with the information provided by evaluation samples. Therefore, a reasonable method for determining the difference degree coefficient is urgently needed.
What is more, some key studies have been completed, which provide effective thoughts for drought disaster risk evaluation and diagnosis. Wang et al. [44] assessed the agricultural drought disaster risk based on the set pair analysis theory. Chen et al. [33] conducted the risk assessment of agricultural drought disasters using the improved connection number and entropy information diffusion. Jin et al. [30] adopted semipartial subtraction set pair potential of ternary connection number to evaluate the drought disaster risk and identify its influencing factors. However, the connection number value method combined with the dynamic difference degree coefficient has not been used in the field of drought disaster risk.
According to the analysis of the characteristics and problems of agricultural drought disaster risk in China’s main grain production areas, an agricultural drought disaster risk system is composed of four subsystems, i.e., drought hazard, drought damage sensitivity, exposure to drought, and drought resistance, as well as the evaluation grade criteria, were established, from the perspective of natural disaster risk system structure. Based on set pair analysis theory, a calculation method of dynamic difference degree coefficient varying with evaluation sample was used to determine the connection number value. In addition, the information provided by connection number components and connection number value in the evaluation process were compared according to the information entropy method. Then a quantitative evaluation and diagnosis model of agricultural drought disaster risk was established to assess the risk level and diagnose its key obstacle factors. Furthermore, an empirical study was conducted in Suzhou City of Anhui Province, China, to provide an important scientific basis for regional drought disaster risk regulation and control.

2. Materials and Methods

2.1. Agricultural Drought Disaster Risk Evaluation and Diagnosis Model Based on Connection Number and Information Entropy

The establishment of the agricultural drought disaster risk evaluation and obstacle factor diagnosis model included the following steps, as shown in Figure 1. Firstly, an agricultural drought disaster risk system composed of four subsystems was built and based on connection number and its adjoint function, the similarity degree, difference degree, and opposition degree between evaluation index value and evaluation grade criteria were calculated. Then, combined with the proposed dynamic difference degree coefficient, the connection number value of each evaluation index was obtained. In addition, information entropy theory was used to compare the information provided by connection number value and connection number components in evaluation process. Finally, according to the weights of subsystem and evaluation index obtained by improved fuzzy analytic hierarchy process method, a quantitative evaluation and diagnosis model of agricultural drought disaster risk was established and applied to Suzhou City. Meanwhile, the results of semipartial subtraction set pair potential and level eigenvalue method were compared.
(1) According to the structure analysis and function analysis of agricultural drought disaster risk system composed of drought hazard, drought damage sensitivity, exposure to drought, and drought resistance [17], as well as the practical investigation, expert consultation, and reference statistics [30,44] in study area, an evaluation system of agricultural drought disaster risk {xkj|k = 1, 2, 3; j = 1, 2, …, nk} was established, and the corresponding sample set of index was described as {xikj|i = 1, 2, …, m; k = 1, 2, 3; j = 1, 2, …, nk}. Among them, xikj is the value of index j in subsystem k of evaluation sample i, m is the number of samples, k = 1, 2, 3, 4, which represents four subsystems, i.e., drought hazard, drought damage sensitivity, exposure to drought, and drought resistance, nk is the number of indexes in subsystem k. Without loss of generality, in this study, the drought disaster risk was divided into three grades, and the evaluation grade criteria were described as {sgkj|g = 1, 2, 3; k = 1,2, 3, 4; j = 1, 2,…, nk}, where g = 1, 2, 3, representing low, middle, and high risk, respectively.
(2) The improved fuzzy analytic hierarchy process based on accelerating genetic algorithm (AGA-FAHP) [45] was adopted to calculate the weights of each subsystem and each evaluation index {wkj|k = 1, 2, 3, 4; j = 1, 2, …, nk} as follows:
For a given agricultural drought disaster risk subsystem k, experts were invited to compare the importance of any two indexes in this subsystem for drought disaster risk so as to obtain the fuzzy complementary judgment matrix Ak = (akjl)nk×nk. AGA-FAHP was used to check and correct the consistency of Ak and calculate the weight of each index, i.e., wkj. Ak needed to be corrected if its consistency was unsatisfactory. Assume that the corrected matrix of Ak was Bk = (bkjl)nk×nk. For simplicity, the sorting weight of elements in Bk was still described as {wkj|k = 1, 2, 3, 4; j = 1, 2, …, nk}. Then, when the following formula [45]
min C I C ( n k ) = j = 1 n k l = 1 n k | b j l k a j l k | / n k 2 + j = 1 n k l = 1 n k | 0.5 ( n k 1 ) ( w k j w k l ) + 0.5 b j l k | / n k 2 , s . t .       { b j j k = 0.5 1 b l j k = b j l k [ a j l k d , a j l k + d ] [ 0 , 1 ] , k = 1 , 2 , 3 , 4 ; j = 1 , 2 , , n k ; l = j + 1 , j + 2 , , n k j = 1 n k w k j = 1.0 , w k j [ 0 , 1 ]
reached the minimum value, Bk was called the optimal fuzzy consistency judgment matrix of Ak, where CIC(nk) is the consistency index coefficient, d is a non-negative parameter within [0, 0.5]. Accelerating genetic algorithm (AGA) was a universal global optimization method, it was effective to solve the complex optimization problem in Formula (1). When CIC(nk) was smaller than a critical value, it indicated that Ak had satisfactory consistency. Accordingly, the sorting weight of each evaluation index calculated was acceptable; otherwise, d needed to be adjusted until Ak had satisfactory consistency. By a large number of numerical simulations and referring to related research [45], this study considered that when CIC was less than 0.20, the consistency of judgment matrix was regarded as satisfactory, and the obtained weight of each index was reasonable and acceptable.
(3) Set pair analysis (SPA) was a quantitative analysis theory of uncertainty proposed by Zhao Keqin in 1989 [32]. The foundation of SPA was the connection number u which was composed of two sets with a certain relation. Furthermore, the components of the connection number u, i.e., similarity degree a, difference degree b, and opposition degree c, were used to quantitatively describe the certainty and uncertainty of set pair from three aspects, i.e., identity, difference, and inverse, and a + b + c = 1. Specifically, SPA divided the certainty of set pair into identical status and inverse status, which were quantitatively described by a and c, respectively. Meanwhile, SPA divided the uncertainty of set pair between identical status and inverse status into the uncertainty at a macro level, measured by b, and that at a micro level, measured by difference degree coefficient I. Among them, the most commonly used ternary connection number u is expressed as follows [32]:
u = a + b I + c J
where I is the difference degree coefficient, whose value varies with the relation type of set pair. The set pair in this study belonged to positive–negative relation; the value of I ranged within [−1, 1]. J is the opposition degree coefficient and took −1 in this study [32].
Based on SPA and the practical problem of agricultural drought disaster risk evaluation, the evaluation index value and evaluation grade criteria constituted a set pair. The connection number of index was calculated according to the proximity between index value and grade criteria. Specifically, for two sets of evaluation index sample value of agricultural drought disaster risk xikj and evaluation grade criteria sgkj (g = 1, 2, 3), the components of ternary connection number for index, i.e., ugikj are as follows [46]:
u 1 i k j = { 1 , s 0 k j x i k j s 1 k j for positive index , s 0 k j x i k j s 1 k j for negative index 1 2 ( x i k j s 1 k j ) / ( s 2 k j s 1 k j ) , s 1 k j < x i k j s 2 k j for positive index , s 1 k j > x i k j s 2 k j for negative index 1 , s 2 k j < x i k j s 3 k j for positive index , s 2 k j > x i k j s 3 k j for negative index
u 2 i k j = { 1 2 ( s 1 k j x i k j ) / ( s 1 k j s 0 k j ) , s 0 k j x i k j s 1 k j for positive index , s 0 k j x i k j s 1 k j for negative index 1 , s 1 k j < x i k j s 2 k j for positive index , s 1 k j > x i k j s 2 k j for negative index 1 2 ( x i k j s 2 k j ) / ( s 3 k j s 2 k j ) , s 2 k j < x i k j s 3 k j for positive index , s 2 k j > x i k j s 3 k j for negative index
u 3 i k j = { 1 , s 0 k j x i k j s 1 k j for positive index , s 0 k j x i k j s 1 k j for negative index 1 2 ( s 2 k j x i k j ) / ( s 2 k j s 1 k j ) , s 1 k j < x i k j s 2 k j for positive index , s 1 k j > x i k j s 2 k j for negative index 1 , s 2 k j < x i k j s 3 k j for positive index , s 2 k j > x i k j s 3 k j for negative index
where the larger the value of positive (negative) index, the higher (lower) the evaluation grade. s1kj and s2kj are the critical value of grade 1 and grade 2, and that of grade 2 and grade 3 for index j in subsystem k, respectively, while s0kj and s3kj are other critical values of grade 1 and grade 3, respectively.
For the components of ternary connection number in Formulas (3)–(5), i.e., ugikj, depending on whether the evaluation index sample value xikj fell in the same, adjacent, or separated interval of evaluation grade g, and took the value of 1, within [−1, 1], or −1, respectively. Therefore, ugikj can be regarded as a relative difference degree function of variable fuzzy set for the proximity between evaluation index value and evaluation grade criteria. The corresponding relative membership degree is as follows [45]:
a i k j * = 0.5 + 0.5 u 1 i k j , b i k j * = 0.5 + 0.5 u 2 i k j , c i k j * = 0.5 + 0.5 u 3 i k j , i = 1 , 2 , , m ; k = 1 , 2 , 3 , 4 ; j = 1 , 2 , , n k
By the normalization of Formula (6), the components of ternary connection number for evaluation index of agricultural drought disaster risk can be finally obtained [33]:
a i k j = a i k j * / ( a i k j * + b i k j * + c i k j * ) , b i k j = b i k j * / ( a i k j * + b i k j * + c i k j * ) , c i k j = c i k j * / ( a i k j * + b i k j * + c i k j * )
(4) Difference degree coefficient I was the key to describing the uncertainty of set pair at a micro level [32,43], and an important source of this uncertainty was the sample data of research problem. In addition, the physical meaning of I can be interpreted as the quantity of the difference degree b transforming into similarity degree a or opposition degree c. The direction (to a or c) and the scale of transformation should be closely related to the proximity between the actual evaluation sample value and each evaluation grade. That was, the larger a (or c), the more b was transformed into a (or c). Therefore, I should vary with the evaluation sample [46]. In this study, the set pair composed of evaluation index sample value xikj and evaluation grade criteria sgkj belonged to positive–negative relation; the value of I ranged within [−1, 1]. Moreover, when I ranged within [0, 1], b was transformed into a; when I ranged within [−1, 0], b was transformed into c. The absolute value of I represented the scale of transformation. Based on SPA and the above analysis, this study considered that the difference degree coefficient of ternary connection number for evaluation index of agricultural drought disaster risk, i.e., Iikj varied with the evaluation index sample value xikj. The calculation method is shown in Figure 2 and Formula (8) [46]:
I i k j = { 1 ( 1 m ) ( x i k j s 0 k j ) / ( s 1 k j s 0 k j ) , s 0 k j x i j s 1 k j for positive index , s 0 k j x i k j s 1 k j for negative index 2 m [ x i k j ( s 1 k j + s 2 k j ) / 2 ] / ( s 2 k j s 1 k j ) , s 1 k j < x i k j s 2 k j for positive index , s 1 k j > x i k j s 2 k j for negative index 1 + ( 1 m ) ( s 3 k j x i k j ) / ( s 3 k j s 2 k j ) , s 2 k j < x i k j s 3 k j for positive index , s 2 k j > x i k j s 3 k j for negative index
(5) Substitute Formulas (3)–(8) into Formula (2) to calculate the ternary connection number of index j in subsystem k for evaluation sample i, i.e., uikj [45]:
u i k j = a i k j + b i k j I i k j + c i k j J , i = 1 , 2 , , m ; k = 1 , 2 , 3 , 4 ; j = 1 , 2 , , n k
According to the weight of index j in subsystem k obtained by Formula (1), i.e., wkj, calculate the ternary connection number of subsystem k for sample i, i.e., uik [33]:
u i k = j = 1 n k w k j a i k j + j = 1 n k w k j b i k j I i k j + j = 1 n k w k j c i k j J , i = 1 , 2 , , m ; k = 1 , 2 , 3 , 4
Finally, the ternary connection number ui for evaluation sample i of agricultural drought disaster risk was obtained by the following formula [40]:
u i = k = 1 4 j = 1 n k w k w k j a i k j + k = 1 4 j = 1 n k w k w k j b i k j I i k j + k = 1 4 j = 1 n k w k w k j c i k j J , i = 1 , 2 , , m
where wk is the weight of subsystem k, which can be determined by AGA-FAHP [45].
The connection number u calculated by Formulas (10) and (11) were used to evaluate the grade of agricultural drought disaster risk. It can be proved that u ∈ [−1, 1]. According to the grade corresponding to the critical value, u was divided into three grades, which corresponded to three statuses of agricultural drought disaster risk, respectively, i.e., low-risk u ∈ (0.667, 1.000], middle-risk u ∈ [−0.667, 0.667], and high-risk status u ∈ [−1.000, −0.667).
Meanwhile, to compare with the result of the connection number value, level eigenvalue method was used to calculate the grade value hi for evaluation sample i of agricultural drought disaster risk. Similarly, h was divided into three grades, which corresponded to low-risk h ∈ [1.0, 1.5), middle-risk h ∈ [1.5, 2.5], and high-risk status h ∈ (2.5, 3.0] [45]:
h i = k = 1 4 j = 1 n k w k w k j a i k j + 2 k = 1 4 j = 1 n k w k w k j b i k j + 3 k = 1 4 j = 1 n k w k w k j c i k j , i = 1 , 2 , , m
In order to compare the information provided by connection number components and connection number value in agricultural drought disaster risk evaluation process, the difference degree b and difference degree item bI were respectively converted into a probability variable p based on information entropy theory [45,47], according to the following formula:
p i = ( k = 1 4 j = 1 n k w k w k j b i k j ) 2 i = 1 m ( k = 1 4 j = 1 n k w k w k j b i k j ) 2   and   p i = ( k = 1 4 j = 1 n k w k w k j b i k j I i k j ) 2 i = 1 m ( k = 1 4 j = 1 n k w k w k j b i k j I i k j ) 2
Then, the corresponding information entropy value e was obtained as follows [45,47]:
e = i = 1 m p i ln p i ln m
(6) The connection number uikj of evaluation index calculated by Formula (9) was used to diagnose the main factors that made the high risk. It can be proved that uikj ∈ [−1, 1]. According to the principle of equipartition, evaluation index was divided into five types, which were strong obstacle uikj ∈ [−1.0, −0.6), middle obstacle uikj ∈ [−0.6, −0.2), weak obstacle uikj ∈ [−0.2, 0.2], weak promotion uikj ∈ (0.2, 0.6], and strong promotion uikj ∈ (0.6, 1.0]. Among them, strong obstacle index and middle obstacle index were the primary obstacle factors that seriously hindered the reduction of agricultural drought disaster risk, and meanwhile, the key objects of risk regulation and control [46].
Additionally, to compare with the diagnosis result of the connection number value, semipartial subtraction set pair potential s(u) corresponding to the ternary connection number of evaluation index was calculated to identify the obstacle factors of risk as follows [30]:
s ( u i k j ) = { 1 , when a i k j + b i k j = 0 1 , when b i k j + c i k j = 0 [ a i k j + b i k j a i k j / ( a i k j + b i k j ) ] [ c i k j + b i k j c i k j / ( c i k j + b i k j ) ] , when a i k j + b i k j 0 and b i k j + c i k j 0
It can be proved that s(uikj) ∈ [−1, 1]. According to the principle of equipartition, s(uikj) was divided into inverse potential s(uikj) ∈ [−1.0, −0.6), partial inverse potential s(uikj) ∈ [−0.6, −0.2), symmetrical potential s(uikj) ∈ [−0.2, 0.2], partial identical potential s(uikj) ∈ (0.2, 0.6], and identical potential s(uikj) ∈ (0.6, 1.0], respectively. Among them, the index of s(uikj) in inverse potential or partial inverse potential was the obstacle factors of agricultural drought disaster risk and should be paid more attention to in risk management [40].

2.2. Study Area

Suzhou City in Anhui Province was chosen as a typical grain production area for empirical study (Figure 3). Suzhou was located in the south of Huang-Huai Plain, the main production area of winter white and the important commodity grain export base in China [30]. However, due to its transition zone between temperate and subtropical monsoon climate, the distribution of annual precipitation was extremely uneven, and the precipitation in summer accounted for 50–60% of the annual precipitation [33]. Meanwhile, the monsoon had a significant impact on precipitation, resulting in a large inter-annual variation and frequent drought disaster [31]. In addition, the average sown area of crops in Suzhou from 2001 to 2020 was 9.99 × 10⁵ hectares, including 7.87 × 10⁵ hectares for grains, and the average grain yield was 3.63 × 10⁹ kg. However, frequent drought disasters have caused serious losses in agricultural production in Suzhou. For instance, the most severe autumn-winter drought disaster in recent ten years continued from October 2008 to February 2009. According to the statistics, the total affected area of wheat by droughts in the city was 3.50 × 10⁵ hectares, accounting for 91.7% of the sown area of wheat, and the seriously affected area was 1.76 × 10⁵ hectares [48]. Furthermore, two-phased drought disasters occurred in 2012. The affected area by the first was 3.99 × 10⁵ hectares, and that of the second was 2.60 × 10⁵ hectares, causing a direct economic loss of about RMB 426 million. A heavy drought disaster happened from the last ten days of July to the middle ten days of August in 2013. The largest affected area was 1.76 × 10⁵ hectares, including 0.4 × 10⁵ hectares seriously affected [49]. Suzhou was a traditional agriculture-oriented city, and agricultural production was an important source of farmers’ income and local economic development. Therefore, conducting the evaluation and diagnosis of agricultural drought disaster risk in Suzhou was of great significance for ensuring stable social economy and food security.

2.3. Data Acquisition

The sample data used for evaluation and obstacle factor diagnosis of agricultural drought disaster risk in Suzhou City were obtained from Water Resources Bulletin of Anhui Province (2007–2017), Statistical Yearbook of Anhui Province (2008–2018), Statistical Yearbook of Suzhou City (2008–2018), Water Conservancy Yearbook of Anhui Province (2008–2018), and Drought Resistance Planning in Anhui Province.
The hydro-meteorological dataset used in this study included precipitation, evaporation, and soil moisture data. The precipitation data (2007–2017) were from the Chinese national meteorological Suzhou station, which can be accessed from The China Meteorological Data Service Center (http://data.cma.cn (accessed on 6 February 2022)). The evaporation data (2007–2017) were calculated by FAO-56 Penman-Monteith method [50] according to daily maximum and minimum air temperature, relative humidity, wind speed, vapor pressure, and duration of sunshine, which were from the Chinese national meteorological Suzhou station, they can be accessed from http://data.cma.cn (accessed on 6 February 2022). The soil moisture data (2007–2017) were from the Chinese national soil moisture monitoring Suzhou station, and the soil moisture report in Anhui Province can be accessed from http://slt.ah.gov.cn/tsdw/swj/sqtx/index.html (accessed on 14 February 2022).

3. Results and Discussion

3.1. Evaluation System and Weights of Agricultural Drought Disaster Risk

According to the evaluation target and construction principle of the evaluation system for agricultural drought disaster risk, based on the system structure of drought disaster risk [17,31], the risk system was divided into four subsystems, i.e., drought hazard, drought damage sensitivity, exposure to drought, and drought resistance. By the analysis of characteristics for these four subsystems, and meanwhile referring to related research [25,30,33,36,44] and the actual situation of water resources, social economy, agricultural production, and water conservancy projects in the study area, an evaluation system of agricultural drought disaster risk (including 4 subsystems, in total 21 indexes, i.e., X1X21) and the corresponding evaluation grade criteria (low, middle, and high risk) were established, as shown in Table 1. Furthermore, AGA-FAHP [45] and related research [30,44] were used to determine the weight of each subsystem and evaluation index (Table 1).

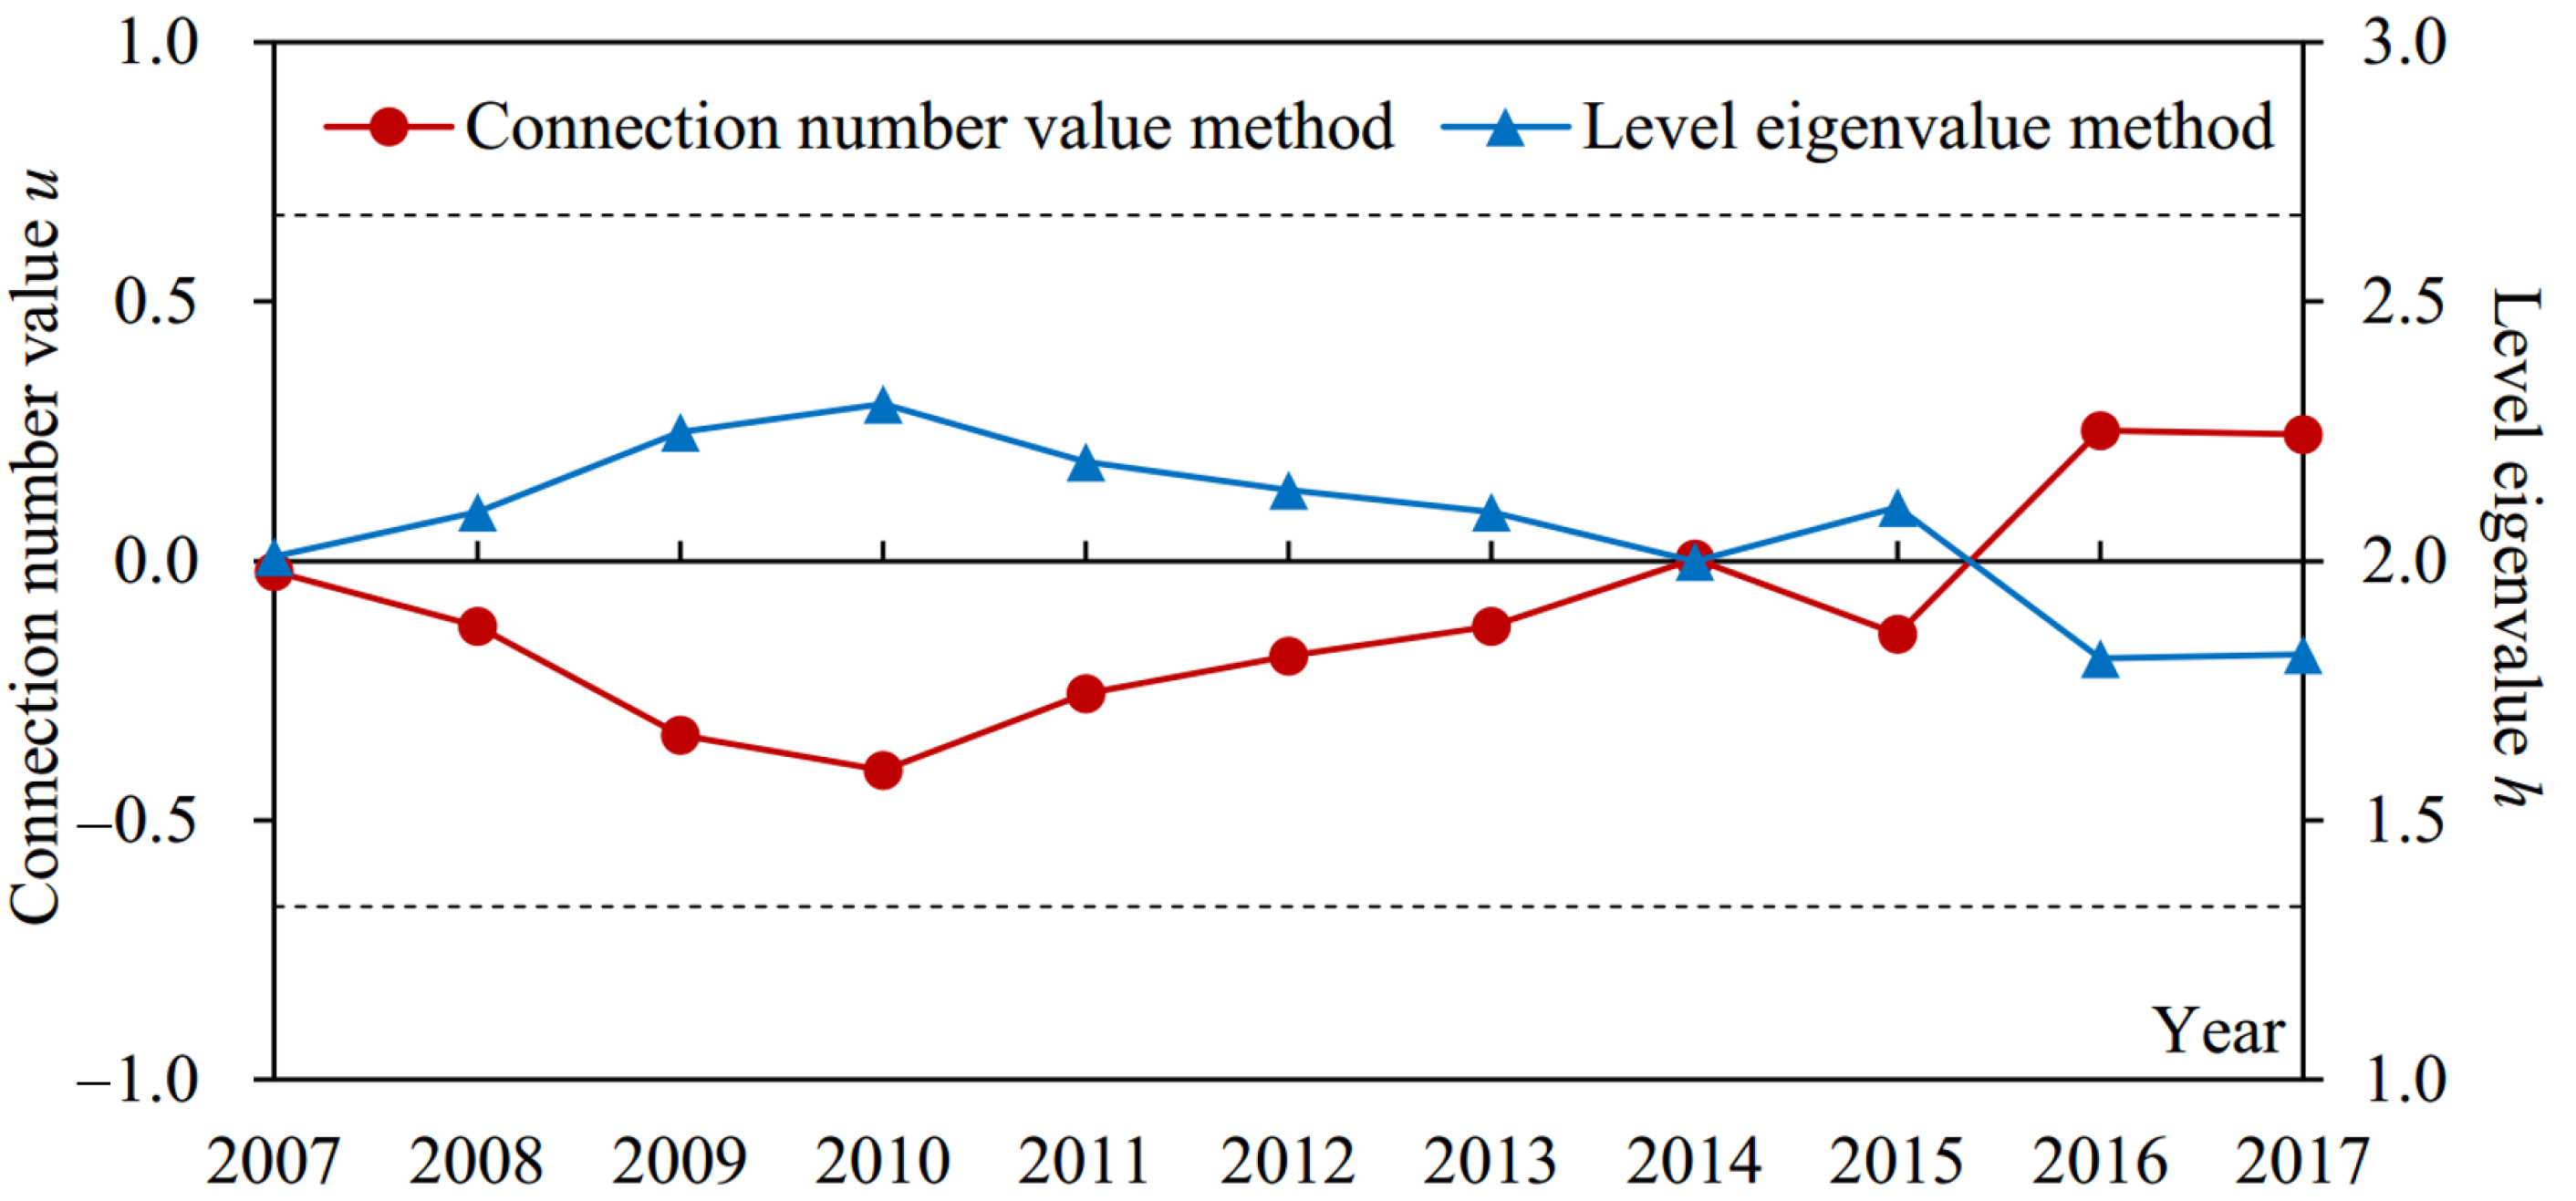
3.2. Evaluation of Agricultural Drought Disaster Risk in Suzhou from 2007 to 2017

The index sample data in Suzhou from 2007 to 2017 and the corresponding grade criteria shown in Table 1 were substituted into Formulas (3)–(7) to obtain the components of the connection number for each index. The dynamic difference degree coefficient of the connection number was calculated according to Figure 2 and Formula (8). Then, the weights of subsystem and index in Table 1 and Formulas (9)–(11) were adopted to calculate the connection number values of index, subsystem, and drought disaster risk system, respectively. Meanwhile, Formula (12) was used to calculate the grade obtained by the level eigenvalue method. Furthermore, although the results of the connection number value and level eigenvalue methods both reflect the evaluation grade, the larger the former, the lower the risk grade, while the larger the latter, the higher the risk grade. The evaluation results of agricultural drought disaster risk in Suzhou are shown in Figure 4, Figure 5, Figure 6, Figure 7, Figure 8 and Figure 9.
(1) From the results obtained by two methods (Figure 4), the variation trends of evaluation grade for agricultural drought disaster risk in Suzhou from 2007 to 2017 calculated by connection number value and level eigenvalue were consistent. Nevertheless, compared with the level eigenvalue, the variation amplitude year by year of the connection number value was more obvious, and the difference among evaluation grades was more significant. For example, the difference between the maximum and minimum of the connection number value relative to its value range ((0.251 − (−0.404))/(1 − (−1)) × 100% = 32.75%)) was higher than that of level eigenvalue ((2.303 − 1.812)/(3 − 1) × 100% = 24.55%)). Moreover, the connection number value in 2016 changed greatly; the difference with 2015 was 0.392, which was higher than that of the level eigenvalue (0.292). It indicated that the evaluation method of agricultural drought disaster risk in this study could take full advantage of the information from samples. The dynamic difference degree coefficient varying with the actual evaluation sample can further quantify the uncertainty between evaluation index value and evaluation grade criteria and determine the complete connection number value. Therefore, the evaluation results were reasonable, reliable, and had a higher sensitivity.
According to the connection number value of agricultural drought disaster risk evaluation in Suzhou from 2007 to 2017 (Figure 4), it decreased from −0.201 in 2007 to −0.404 in 2010 and then increased to 0.243 in 2017. Among them, a fluctuation was found in 2015, and the connection number value decreased. The average connection number values during 2007–2010 and 2011–2017 were −0.222 and −0.030, respectively, and the connection number values in 2016 and 2017 were larger than 0.2 (Figure 4). It reflected that the agricultural drought disaster risk in Suzhou from 2010 to 2017 was always in middle-risk status (−0.667 ≤ u ≤ 0.667). Nevertheless, the risk presented a decreasing trend from 2010, especially since 2016, it had gradually developed to low-risk status. Therefore, in recent years, the agricultural drought disaster risk in Suzhou was still quite severe, but it tended to be improved. The drought disaster risk management may not arouse enough attention before 2010, so it was necessary to strengthen scientific and reasonable risk control measures. These results were consistent with the studies of Wang et al. [44] and Jin et al. [30].
(2) According to the components of the connection number for agricultural drought disaster risk evaluation in Suzhou during 2007–2017 (Figure 5), the similarity degree a first decreased and then increased, while the opposition degree c first increased and then decreased (with 2010 as the boundary), and the difference degree b basically did not change. Moreover, the difference degree item bI presented the same trend as that of a, but the amplitude was smaller. It can be seen that the change trends of a and bI were consistent with that of u, while the trend of c was contrary to that of u. These explained the reason why u first decreased and then increased in Figure 4 combined with Formula (11). Additionally, c was overall larger than a, but the difference decreased gradually; a had exceeded c in 2016 and 2017 (Figure 5). bI was always smaller than a. The average values of a, bI, and c during 2007–2017 were 0.235, −0.026, and 0.308, respectively. These findings accorded with the above results that the situation of agricultural drought disaster risk in Suzhou was still serious, but it presented a trend of improvement (Figure 4).
The change of b was small from 2007 to 2017; the standard deviation was 0.031, but the change of bI was relatively significant; the standard deviation was 0.053 (Figure 5). In addition, according to Formulas (13) and (14), the information entropy values of bI were all lower than those of b for the agricultural drought disaster risk system and its four subsystems, especially for the drought resistance subsystem (Figure 6). The information entropy values of b and bI were 0.992 and 0.501 for drought resistance, respectively (Figure 6). Based on information entropy theory [45,47], it reflected that bI provided more information in the risk evaluation process. Furthermore, according to Formulas (11) and (12), compared with the level eigenvalue method, which only took a, b, and c into account, the connection number value method used in this study additionally considered the effect of the difference degree coefficient I, which varied dynamically with the evaluation sample value and utilized more information, bringing more accurate and reliable evaluation results. It explained why the above risk evaluation results of the connection number value had a higher sensitivity (Figure 4). Overall, the agricultural drought disaster risk in Suzhou showed a decreasing trend, but the situation was still severe. Therefore, it was necessary to analyze the risk driving mechanism from subsystem and index aspects, identify key factors hindering the reduction of risk, and formulate targeted regulation measures.

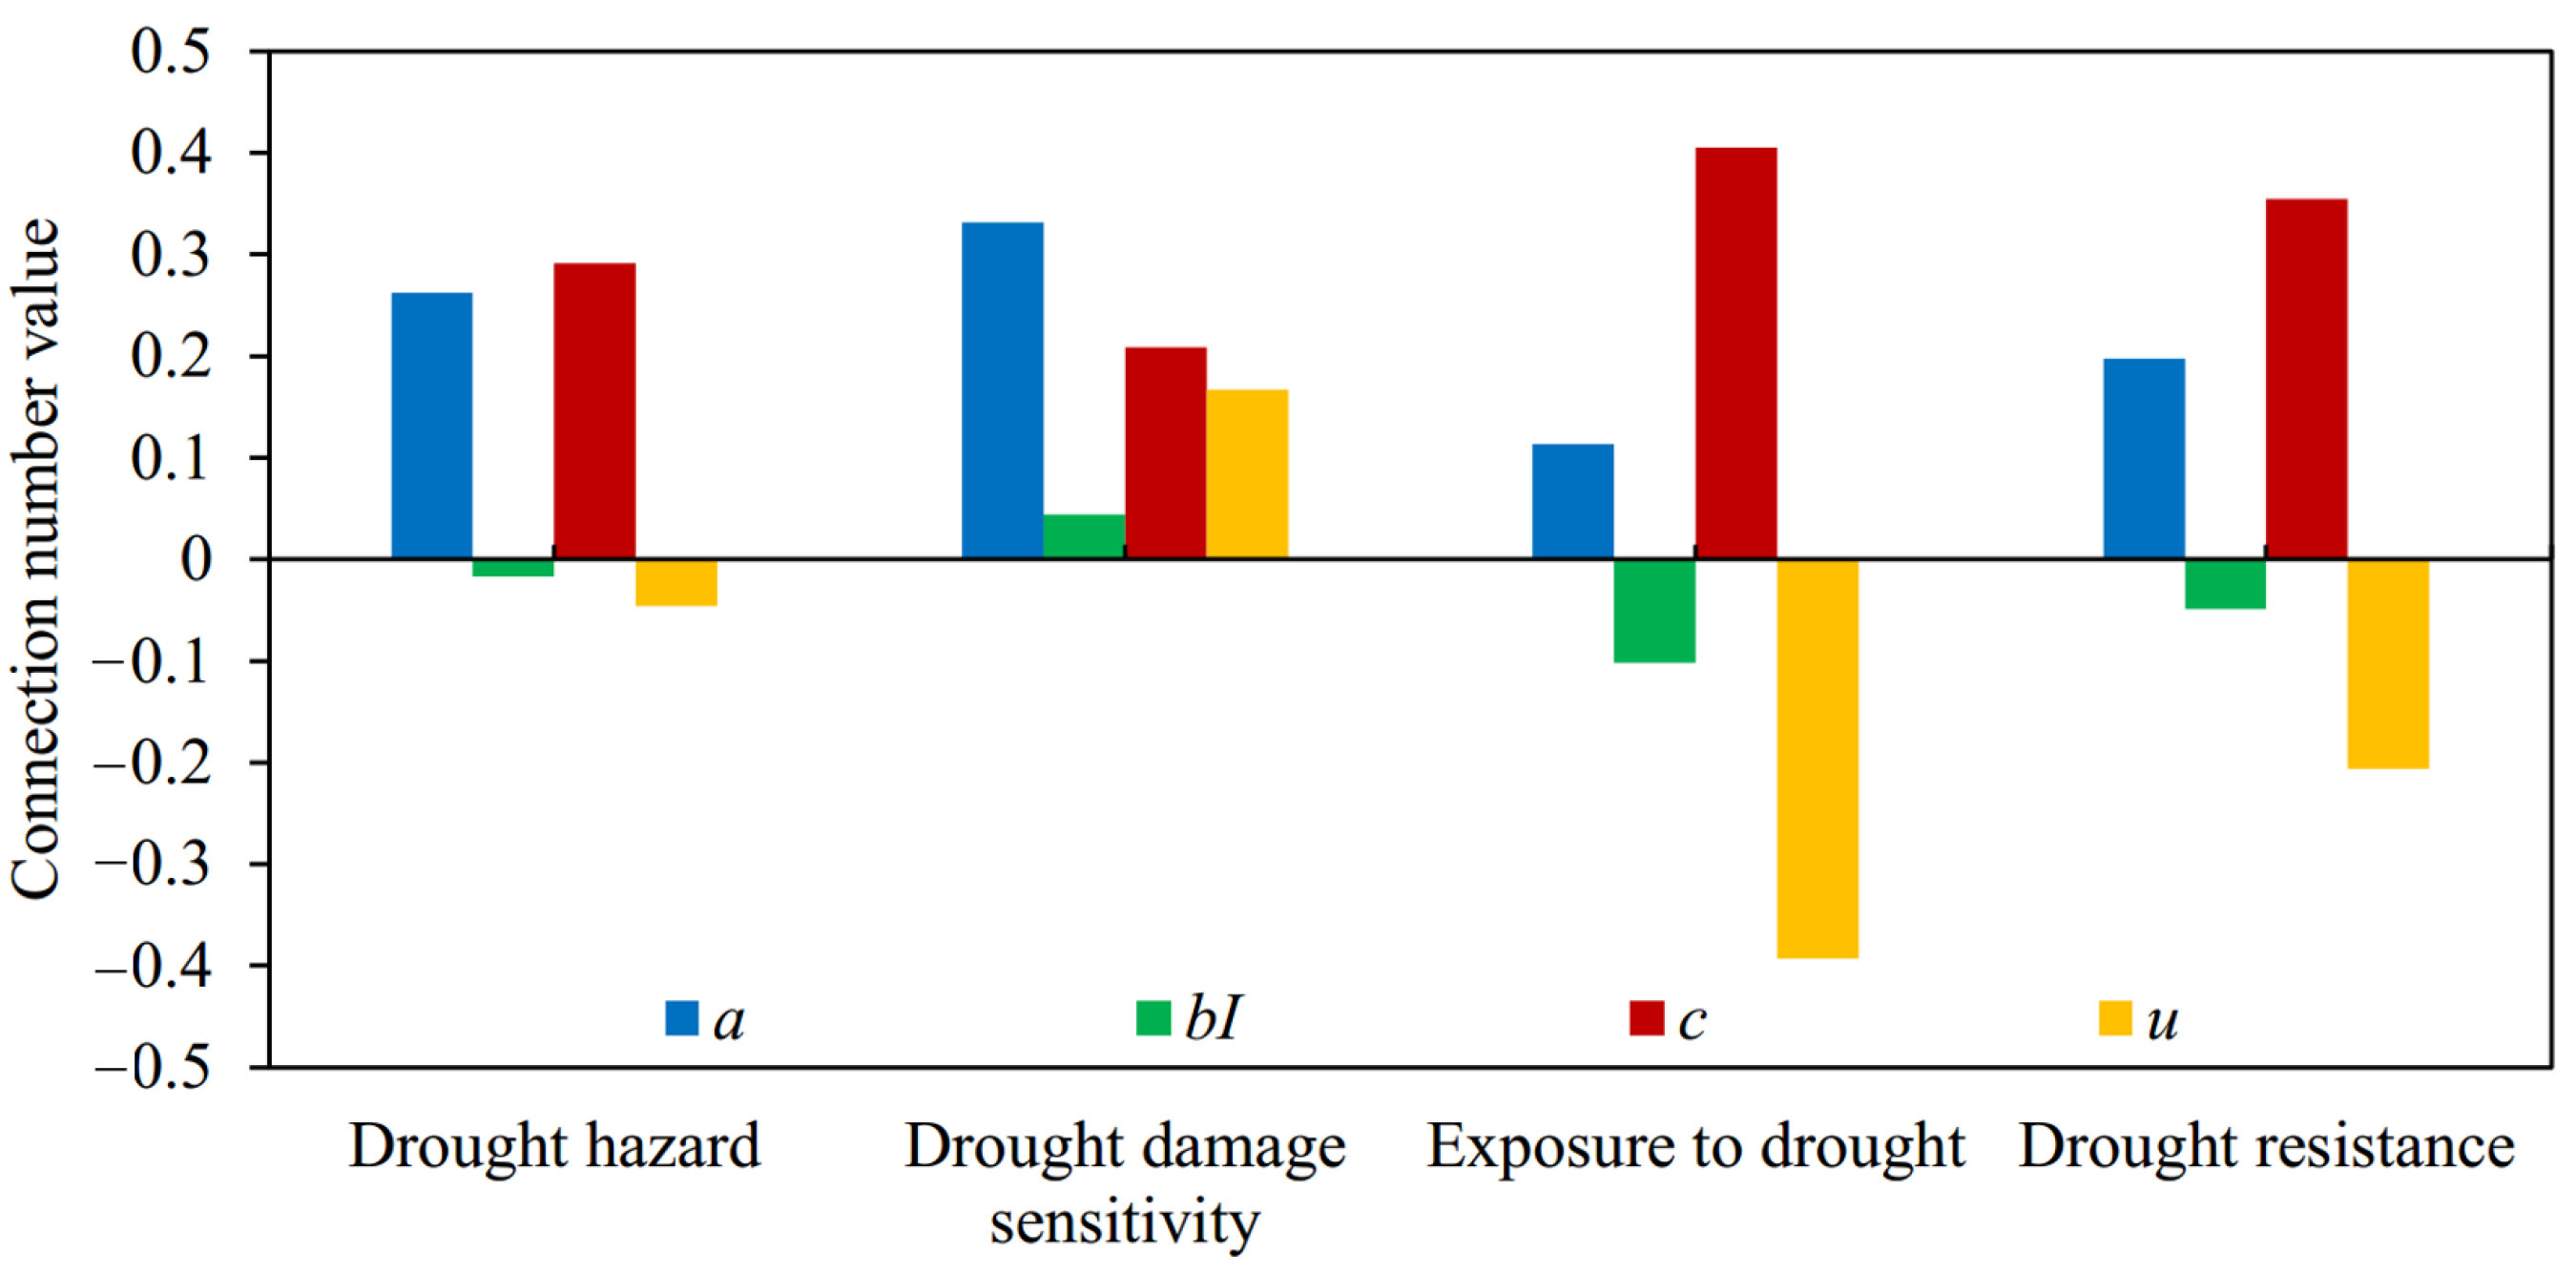
3.3. Evaluation of Agricultural Drought Disaster Risk Subsystems in Suzhou from 2007 to 2017

In order to explain the causes of agricultural drought disaster risk in Suzhou, this study further revealed the key driving elements and obstacle factors of risk from four subsystems.
(1) According to the evaluation results of agricultural drought disaster risk subsystems in Suzhou during 2007–2017 obtained by two methods (Figure 7), the changes in the evaluation grade of four subsystems calculated by connection number value and level eigenvalue methods were consistent, and the difference among evaluation grades calculated by connection number value was more significant. For instance, the difference between the maximum and minimum connection number value for drought damage sensitivity relative to its value range ((0.565 − (−0.132))/(1 − (−1)) × 100% = 34.85%) was larger than that of the level eigenvalue ((2.100 − 1.587)/(3 − 1) × 100% = 25.65%). It indicated that the evaluation results of the risk subsystem were reasonable, reliable, and with higher sensitivity.
The connection number value of drought hazard during 2007–2017 changed greatly. It first decreased and then increased. The connection number values of drought damage sensitivity, exposure to drought, and drought resistance gradually increased, with a small variation amplitude. However, four subsystems were still in middle-risk status (Figure 7). It showed that in recent years, the drought hazard, drought damage sensitivity, and exposure to drought in Suzhou had reduced, and the drought resistance had increased, but their overall situations were still serious, which were consistent with the above connection number values of risk evaluation (Figure 4). In addition, the change in connection number value of each subsystem accorded with its attribute and role in the drought disaster risk system [25]. Drought hazards reflected the natural attributes influencing drought in a study region, including precipitation, evaporation, water resources, etc.; they had strong random uncertainty and thus had a large variation amplitude (Figure 7a) [7,9]. The other three subsystems showed the drought resistance capacity and adaptability of the drought-affected body and reflected the social attributes influencing drought. With the development of economy, science and technology, and the layout of water conservancy projects, the status of these three subsystems has been improved steadily (Figure 7b–d)) [36]. It revealed that the subsystems of agricultural drought disaster risk and their indexes chosen in this study were reasonable and effective and with physical mechanisms.
(2) According to the average values of the connection number and their components for agricultural drought disaster risk evaluation in Suzhou during 2007–2017 (Figure 8), the magnitude sorting of bI among four subsystems was fully consistent with u, which accorded with the above physical meaning of the difference degree coefficient analyzed in this study. That was, when a > c, b was transformed into a, I > 0, when a < c, b was transformed into c, I < 0, and when a = c, I = 0. It showed that the calculation method of dynamic difference degree coefficient varying with the evaluation sample was reasonable and reliable and completely reflected its role and function in the structure of the connection number. Furthermore, the average connection number values of drought hazard, drought damage sensitivity, exposure to drought, and drought resistance were −0.046, 0.167, −0.393, and −0.206, respectively. Therefore, from the perspective of the multi-year average level, the risk status of drought damage sensitivity was optimal, while those of exposure to drought and drought resistance were relatively worse. Combined with Figure 7, the connection number values of exposure to drought and drought resistance were negative in recent years, while those of drought damage sensitivity were basically positive and even gradually improved from middle risk to low risk. Therefore, exposure to drought and drought resistance were the main factors that hindered the reduction of agricultural drought disaster risk in Suzhou and should arouse attention. It was crucial to implement effective measures for reducing the degree of exposure to drought and strengthening drought resistance capacity.
According to the connection number values of agricultural drought disaster risk subsystem evaluation in Suzhou during 2007–2017 (Figure 9), the connection number value of drought hazard first decreased and then increased and became positive since 2016; its absolute value was always relatively large. The connection number value of drought damage sensitivity changed from negative to positive in 2011 and then increased significantly. Nevertheless, those of exposure to drought and drought resistance also increased constantly, but the amplitudes were small, and the values were always negative. It revealed that the drought damage sensitivity and drought hazard in Suzhou during recent years reduced significantly, which were the main reason for the improvement of risk status above (Figure 4). Meanwhile, the exposure to drought and drought resistance had been improved slightly, which had little impact on risk status. The primary subsystems which affected the risk in Suzhou had gradually changed from drought hazard, exposure to drought, and drought resistance in the past, to drought hazard and drought damage sensitivity at present. In addition, in the past few years, the connection number values of four subsystems had not exceeded 0.2, and most of them were negative. Especially the high exposure to drought and the weak drought resistance capacity had become the main factors that seriously impeded the reduction of risk (Figure 4). To sum up, due to the strong random uncertainty of drought hazard [51], this factor cannot be controlled and predicted easily [31]. Therefore, the key to controlling agricultural drought disaster risk in Suzhou was to steady the level of drought damage sensitivity for drought-affected bodies; the difficulties were to reduce exposure to drought and improve resistance capacity.

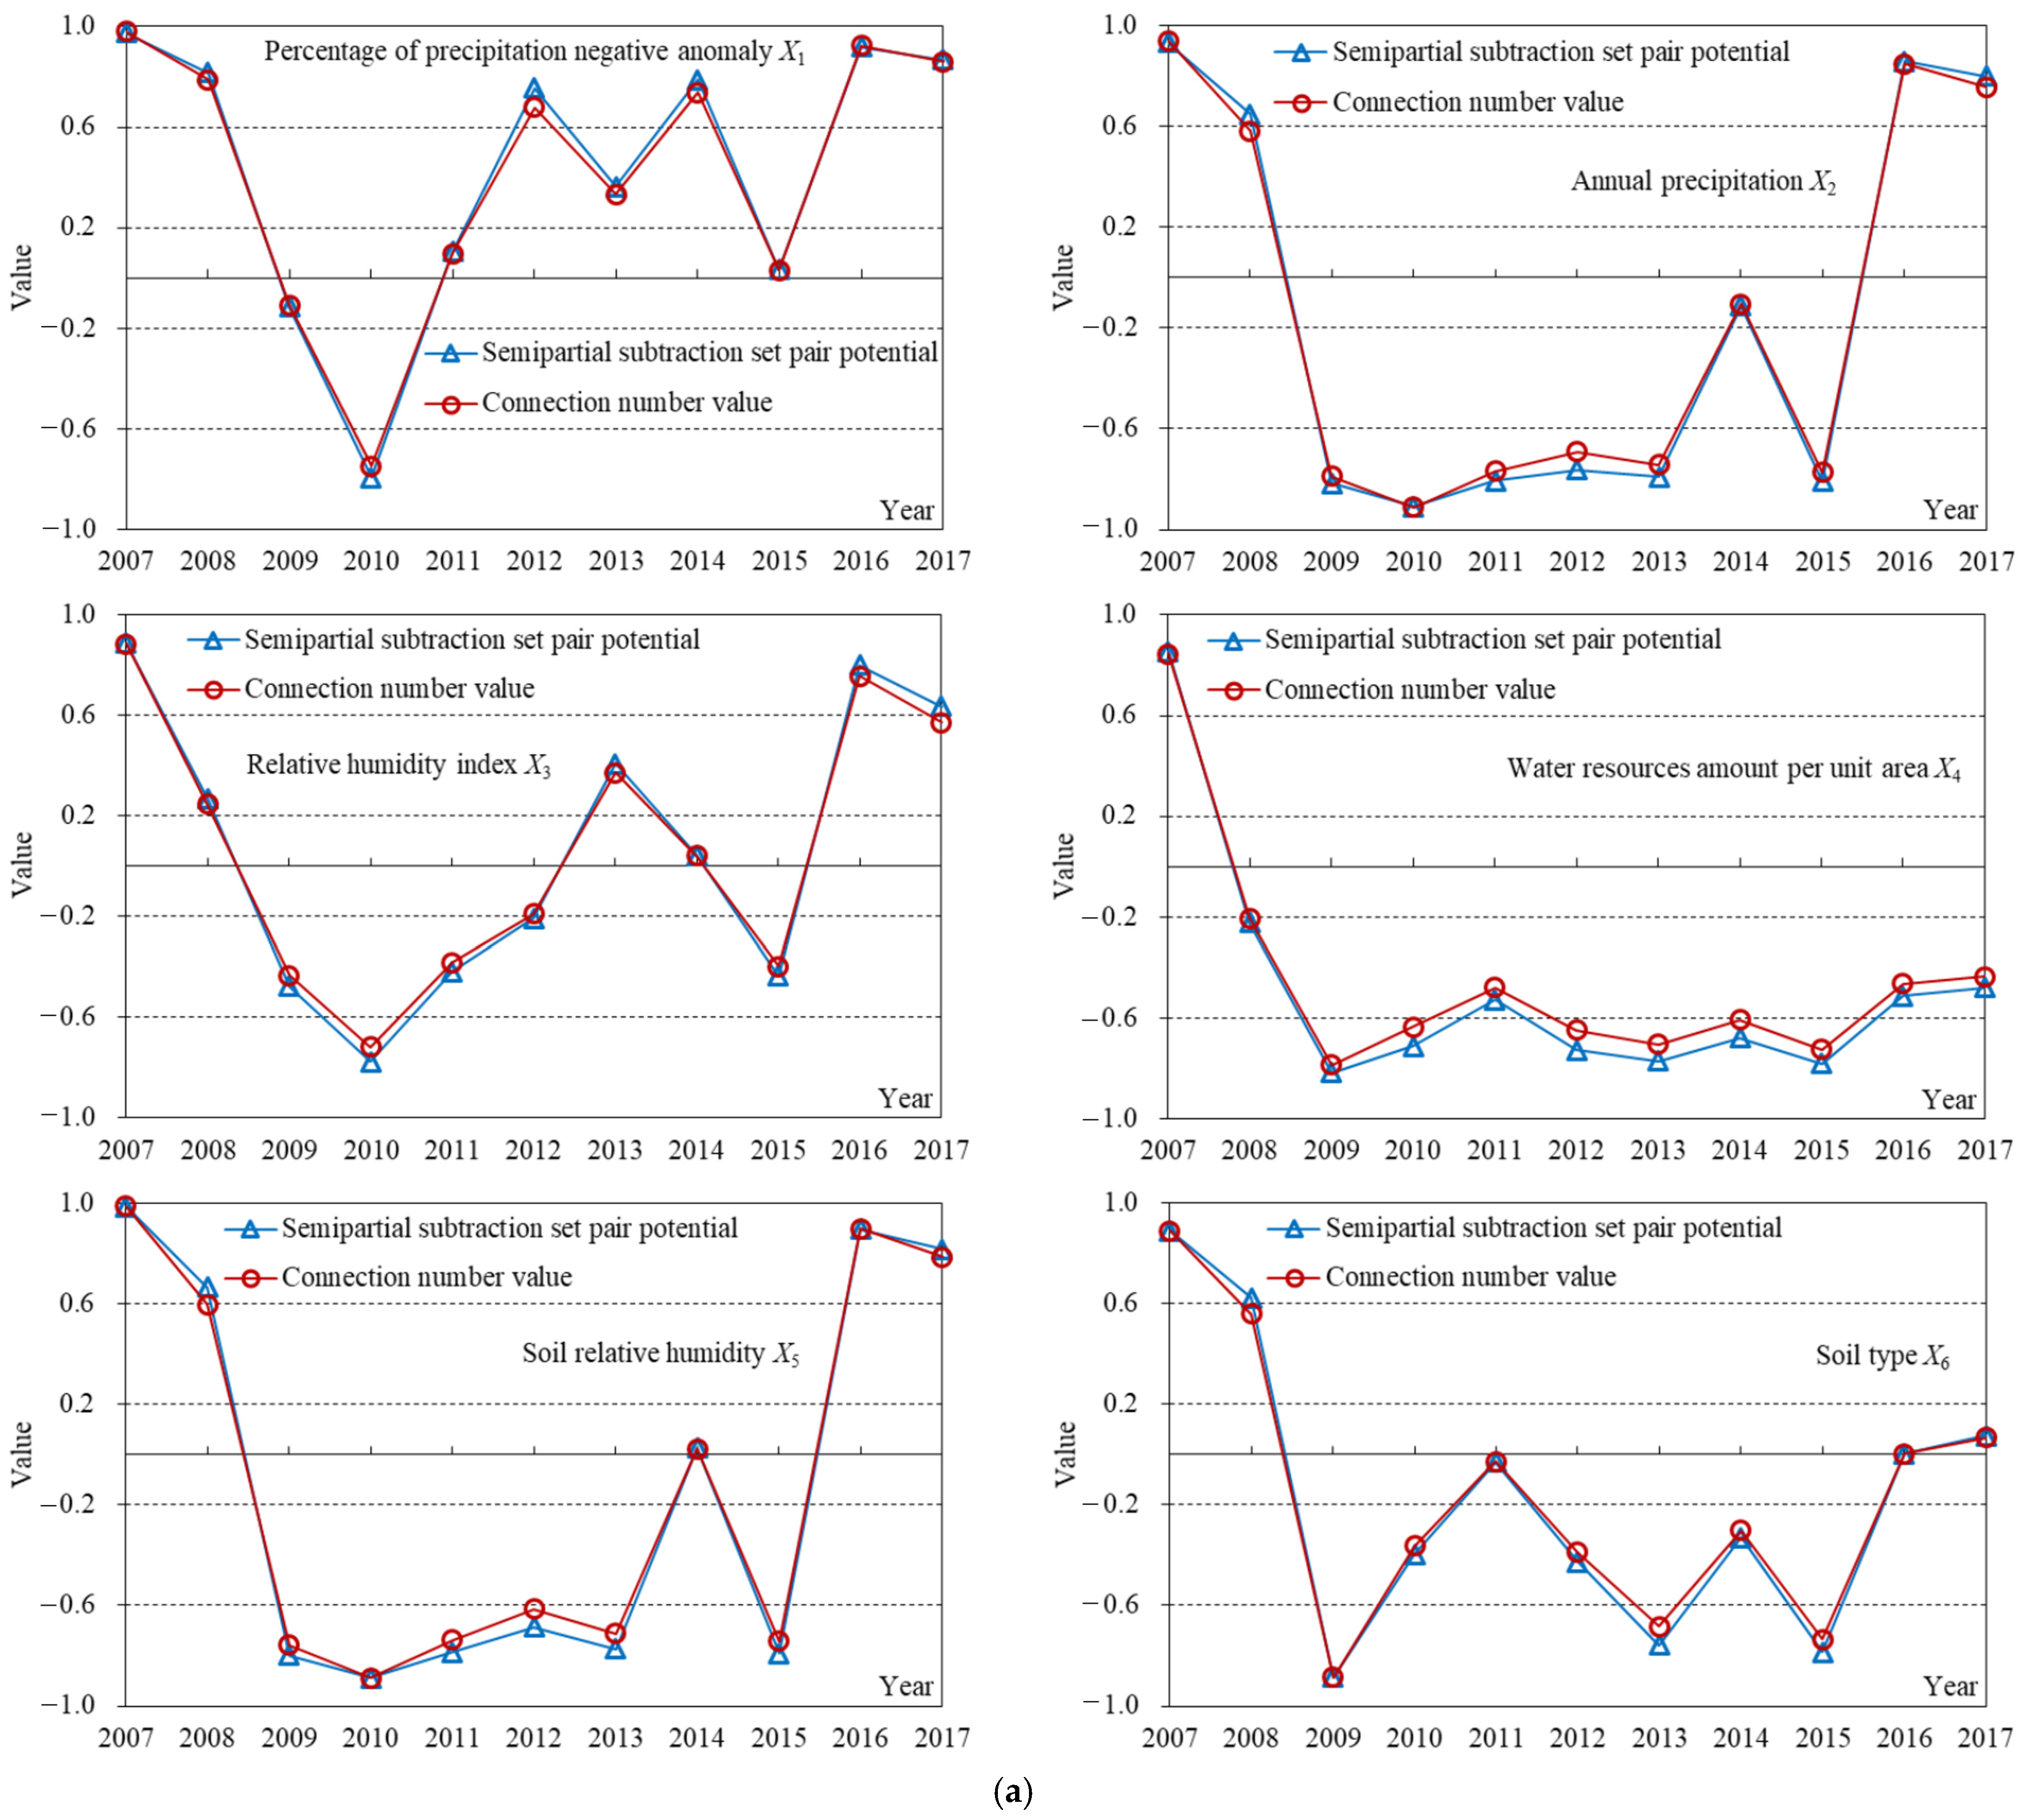
3.4. Obstacle Factor Diagnosis of Agricultural Drought Disaster Risk in Suzhou from 2007 to 2017

The variations in the status of the agricultural drought disaster risk system and its subsystems have been analyzed above. Then, the connection number value and semipartial subtraction set pair potential of evaluation index were used to diagnose the obstacle factors of risk so as to provide a basis for drought disaster risk regulation in Suzhou.
(1) The components of the connection number and the difference degree coefficient of the evaluation index were used to calculate the connection number value and semipartial subtraction set pair potential by Formulas (9) and (15), respectively, as shown in Table 2. It can be seen that, from the multi-year average aspect, the number of indexes that belonged to middle or strong obstacle (−1.0 ≤ u < −0.2) were 1, 1, 3, and 4 in drought hazard, drought damage sensitivity, exposure to drought, and drought resistance subsystems, respectively, and those which belonged to weak or strong promotion (0.2 < u ≤ 1.0) were 1, 2, 0, and 2, respectively. These were consistent with the above result that the overall status of drought damage sensitivity was optimal, while those of exposure to drought and drought resistance were relatively worse (Figure 8). It reflected that the number of indexes that belonged to the strong promotion and strong obstacle in a risk subsystem could approximately judge the risk status of such subsystem. That was, the less strong promotion indexes and the more strong obstacle indexes, the worse the risk status, and vice versa. These basically accorded with the results of semipartial subtraction set pair potential, but there were some differences (Table 2). For example, the average connection number value of annual precipitation X2 was −0.150 (weak obstacle), while that of semipartial subtraction set pair potential was −0.247 (partial inverse potential). The average connection number value of the percentage of cultivated land X12 was −0.597 (middle obstacle), while that of semipartial subtraction set pair potential was −0.608 (inverse potential). It can be found that the value of semipartial subtraction set pair potential was relatively small.
From the perspective of multi-year average level, the percentage of agricultural population X7, population density X11, and percentage of effective irrigation area X18 were strong obstacle indexes. In addition, the water resources amount per unit area X4, percentage of cultivated land X12, multiple cropping index X13, percentage of reservoir regulation and storage X16, monitoring and warning capacity X20, and percentage of water-saving irrigation area X21 were middle obstacle indexes (Table 2). Therefore, these indexes were the main factors that severely hindered the effective reduction of agricultural drought disaster risk, also the key and difficult objects of risk regulation and control in Suzhou.
(2) The connection number values and semipartial subtraction set pair potential of 21 indexes during 2007–2017 were shown in Figure 10. The change in connection number value of each index was analyzed, the key driving factors of risk were identified from the index level. Those indexes which had a small fluctuation of the connection number value and always belonged to strong or middle obstacles were the primary reasons for high risk. They can be diagnosed as the obstacle factors of risk and the crucial objects of risk control [46].
The variation trends of the connection number value for the evaluation index during 2010–2017 were consistent with those of semipartial subtraction set pair potential, whose overall variation amplitude was not significant. Nevertheless, when the change between two years was big, the amplitude of semipartial subtraction set pair potential was larger (Figure 10). For instance, the connection number value of annual precipitation X2 in 2007 and 2008 were 0.939 and 0.583 (with a difference of 0.356), respectively, while the semipartial subtraction set pair potential were 0.933 and 0.649 (0.284), respectively. The connection number value of the percentage of agricultural population X7 in 2012 and 2013 were −0.795 and −0.706 (with a difference of 0.089), respectively, while the semipartial subtraction set pair potential were −0.822 and −0.770 (0.052), respectively. However, the connection number value of multiple cropping index X13 in 2013 and 2014 were −0.717 and 0.676 (with a difference of 1.393), respectively, but the semipartial subtraction set pair potential were −0.776 and 0.755 (1.531), respectively. The connection number value of the percentage of reservoir regulation and storage X16 in 2009 and 2010 were 0.472 and −0.669 (with a difference of 1.141), but the semipartial subtraction set pair potential were 0.521 and −0.751 (1.272), respectively (Figure 10). It indicated that the connection number value calculated in this study was reasonable and reliable, which can identify the status change of the agricultural drought disaster risk evaluation index more accurately and sensitively.
As for the drought hazard subsystem, the obstacle factors of agricultural drought disaster risk, which always belonged to middle or strong obstacle indexes (the connection number value of index u < −0.2), included X2, X4, X5, and X6 (Figure 10a). It reflected that this subsystem was generally in middle-risk status during recent years (Figure 7a), which was due to less amount of precipitation and water resources, low soil moisture content, and poor soil water retention. Additionally, the connection number value of the index was used to analyze the reasons for the change in subsystem status, which provided guidance for risk control. Drought hazard decreased during 2010–2014 (Figure 7a) mainly because the percentage of precipitation negative anomaly X1 gradually developed from a strong obstacle in 2010 (−0.748) to strong promotion in 2014 (0.737) (Figure 10a). Drought hazard suddenly increased in 2015 (Figure 7a), mainly due to the fact that X1 drew back to weak obstacles again (0.031). Meanwhile, the annual precipitation X2 and soil relative humidity X5 deteriorated from a weak obstacle in 2014 to a strong obstacle in 2015 (Figure 10a). Moreover, drought hazards were reduced in 2016 because all indexes in this subsystem had been improved (Figure 7a and Figure 10a). Therefore, precipitation was the main factor that influenced the drought hazard in Suzhou, but it had strong random uncertainty and large fluctuation [51]. In addition, Suzhou was located in the transition zone between temperate and subtropical monsoon climate, characterized by an uneven distribution of annual precipitation, a large difference in inter-annual precipitation, and frequent droughts [33]. For example, from October 2008 to February 2009, the average precipitation in Suzhou was only about 20 mm, accounting for less than 20% of annual precipitation, causing the most serious autumn-winter drought in the past 10 years [48]. Furthermore, from the last ten days of July 2013 to the middle ten days of August 2013, the precipitation was less than the multi-year average value, and the temperature above 35 °C exceeded 27 days, resulting in severe drought [49]. These actual situations can be fully reflected by the obvious deterioration of the status of the drought hazard subsystem (Figure 7a) and its indexes (Figure 10a).
Some studies showed that due to the intensification of global climate change, such as a significant decrease in precipitation but a simultaneous increase in temperature [52], the frequency, intensity, and scope of influence of drought were increasing [53,54]. For instance, the southwest China extreme drought in 2010 [55], the 2010–2013 southern United States drought [56], and the severe drought problems in the Mediterranean area [57,58]. Therefore, climate change might be a main driving force that affects the hydrological cycle [52]. However, Koutsoyiannis [59] made an innovative discovery that although there seemed to be an increase in temperature in the last decades, the hydrological cycle did not seem to intensify from a global-scale analysis of water balance using gridded data. The hydrological cycle is an extremely complex process which influenced by lots of factors. The relationship between climate change and droughts should be further studied by a long series of observational data and coupled with accurate global climate model simulations.
In recent decades, drought has occurred frequently, and the influences have increased remarkably [53,54]. Nevertheless, some research indicated that the droughts were not very rare if one focused beyond the last 50 years on the climate dynamics of the past thousands of years. In fact, H.E. Hurst was one of the first that identified 70 years ago that the droughts might be explained by the so-called Hurst phenomenon [60,61,62,63,64]. Since then, this phenomenon has been identified in numerous key hydrological cycle processes [65]. Therefore, the actual drought hazard and drought disaster risk can be further objectively assessed by considering the periodicity of drought in a long series of climate change data.
The obstacle factor in the drought damage sensitivity subsystem was X7 (Figure 10b). It showed that the transformation of this subsystem from middle risk to low risk in recent years (Figure 7b) was impeded by a large percentage of the agricultural population. This problem was not mitigated until 2015; X7 developed into a weak obstacle in 2017 (−0.123) from a strong obstacle in 2014 (−0.724). Suzhou was a city depending on agricultural production, with a significant influence of drought on agriculture and strong drought damage sensitivity. With the urbanization and industrial upgrading, the percentage of agriculture was decreasing continuously, and the drought damage sensitivity of economic and social drought-affected bodies reduced. Drought damage sensitivity during 2010–2017 reduced significantly (Figure 7b) mainly because the water consumption per RMB104 GDP X9 was gradually improved from a strong obstacle in 2010 (−0.675) to strong promotion in 2017 (0.820) (Figure 10b). It indicated that with the development of the economy, science and technology, and government guidance, social water-saving awareness and industrial water-saving technology were enhanced, and water utilization efficiency significantly raised, which effectively reduced the drought damage sensitivity. In addition, the reason why this subsystem was in a better risk status for a long time (Figure 7b) was that the percentage of paddy field area X8 was always strong promotion; meanwhile, the percentage of forest cover X10 fluctuated around weak promotion (Figure 10b). Therefore, planting drought tolerant crops such as wheat and maize [34] and maintaining a high forest cover [30] were the key to ensuring low drought damage sensitivity in Suzhou.
The obstacle factors in exposure to the drought subsystem included X11 and X12 (Figure 10c). It reflected that the connection number value of this subsystem was always lower than 0 and in middle-risk status (Figure 7c) because of a high population density and a large cultivated land area. When a drought occurred, for the region with a higher population density and a larger cultivated land area, there were more drought-affected bodies exposed to drought, which accorded with the connotation of exposure [19,25]. Furthermore, exposure decreased significantly during 2013–2017 (Figure 7c) because multiple cropping index X13 suddenly developed from a strong obstacle in 2013 (−0.717) to strong and weak promotion in 2014 and later, meanwhile, the percentage of agricultural GDP X14 gradually developed from weak obstacle to strong promotion (Figure 10c). Therefore, optimization of planting structure, appropriate development of agricultural production, improvement of production efficiency, and reasonable scale and layout of urban-rural development were the crucial elements to lower the exposure degree in Suzhou.
The obstacle factors in the drought resistance subsystem included X, X18, and X21 (Figure 10d). It showed that the improvement of this subsystem status was seriously hindered, and the connection number value during 2009–2017 fluctuated around 0 (Figure 7d) because of limited reservoir regulation and storage capacity, small effective irrigation area, and water-saving irrigation area. Drought resistance presented significant enhancement during 2008–2009 (Figure 7d) mainly due to the fact that the existing water supply capacity per unit area X17 was improved from a strong obstacle in 2008 (−0.747) to strong promotion in 2009 (0.681); meanwhile, X16 developed from strong obstacle (−0.813) to weak promotion (0.472) (Figure 10d). Moreover, the continuous increase in per capita GDP, existing water supply capacity, and monitoring and warning capacity strongly guaranteed the drought resistance capacity (Figure 10d). From the perspective of drought disaster risk system structure, the improvement of drought resistance capacity was the most effective and workable means for reducing risk [38]. For this reason, the keys to reducing agricultural drought disaster risk in Suzhou were to implement reservoir dredging and reconstruction, improve water conservancy infrastructure systems such as farm irrigation, lift water-saving irrigation technology, promote social and economic development, and ensure existing water supply capacity and drought warning capacity. These results were in line with the actual drought resistance situations in Suzhou. For instance, 652,000 people, 46,000 electro-mechanical wells, 59 pump stations, and RMB 100.79 million funds were provided for drought resistance in 2009 [50]. Additionally, 57,000 people, 13,000 wells, 16 pump stations, and RMB 52.67 million funds were used for drought resistance in 2013 [51]. These facts were consistent with the results that the drought hazard (Figure 7a) and drought resistance capacity (Figure 7d) both significantly increased in 2009 and 2013.
The calculation method of dynamic difference degree coefficient in this study is only applicable for ternary connection numbers. For the research problems with more than three evaluation grades, such as four-element and five-element connection numbers, the formula of dynamic difference degree coefficient should be deduced again. In addition, the relationship between evaluation index value and difference degree coefficient in Figure 2 and Formula (8) may not always be linear; the result of the nonlinear function could be compared.
The critical values of the grade for the evaluation index in Table 1 are determined and verified according to the actual agricultural drought disaster situation in Suzhou City, and they could not be directly used in other areas. The critical values have a great impact on evaluation results, while they may vary with various natural and social factors affecting drought disaster risk. Therefore, reasonably determining the critical values of grades is an important work for future drought disaster risk evaluation and diagnosis research.

4. Conclusions

In order to deal with the uncertainty between the evaluation sample and evaluation criteria, a calculation method of dynamic difference degree coefficient was adopted to fully utilize the evaluation sample information. Furthermore, information entropy values of the difference degree and difference degree item were respectively calculated to compare the information provided by connection number components and connection number value in the evaluation process. Then a quantitative evaluation and obstacle factor diagnosis model of agricultural drought disaster risk was established, and an empirical study was carried out in Suzhou City of Anhui Province, China. The conclusions are shown as follows:
(1)
The agricultural drought disaster risks in Suzhou during 2010–2017 were all in middle-risk status. Furthermore, the risk presented a decreasing trend from 2010. Especially since 2016, the risk status had been improved significantly and gradually developed to low risk. It is necessary to continue strengthening scientific measures of risk control. In addition, the information entropy values of the difference degree item bI were all lower than those of the difference degree b for the agricultural drought disaster risk system and its four subsystems, reflecting that bI provided more information in the risk evaluation process.
(2)
The drought damage sensitivity and drought hazard in Suzhou reduced markedly during recent years, which mainly accounted for the improvement of agricultural drought disaster risk status. However, high exposure to drought and weak drought resistance capacity were important factors that hindered the effective reduction of risk. The key to regulating risk was to maintain the level of drought damage sensitivity, and the difficulties were to reduce exposure to drought and improve drought resistance capacity.
(3)
The percentage of the agricultural population, population density, and percentage of effective irrigation area were strong obstacle indexes. In addition, the water resources amount per unit area, percentage of cultivated land area, multiple cropping index, percentage of reservoir regulation and storage, monitoring and warning capacity, and percentage of water-saving irrigation were middle obstacle indexes. These were the main obstacle factors of agricultural drought disaster risk in Suzhou, and also the key points and difficulties of risk regulation and control, which should be paid more attention to.
(4)
The evaluation and obstacle factor diagnosis results of agricultural drought disaster risk in Suzhou City in accord with the actual situation. The evaluation and diagnosis method based on connection number and information entropy is reasonable and reliable. It provides an effective approach to identifying the level of agricultural drought disaster risk and its key obstacle factors in important grain production areas and also supports the decisions of regional drought disaster risk prevention and control.

Author Contributions

Conceptualization, J.J. and Y.C.; methodology, Y.C. and J.J.; validation, X.B., L.Z. and C.W.; resources, S.N. and Y.Z.; writing—original draft preparation, Y.C.; writing—review and editing, J.J., X.B. and L.Z.; visualization, S.N. and C.W.; funding acquisition, Y.C. and J.J. All authors have read and agreed to the published version of the manuscript.

Funding

This research was funded by the National Natural Science Foundation of China (grant Nos. 52109009, U2240223), the Natural Science Foundation of Anhui Province, China (grant No. 2108085QE254), and the Fundamental Research Funds for the Central Universities (grant No. JZ2021HGTA0165).

Institutional Review Board Statement

Not applicable.

Informed Consent Statement

Not applicable.

Data Availability Statement

The raw data supporting the conclusion of this article will be made available by the authors, without undue reservation.

Conflicts of Interest

The authors declare no conflict of interest.

References

  1. Farrukh, M.U.; Bashir, M.K.; Hassan, S.; Adil, S.A.; Kragt, M.E. Mapping the food security studies in India, Pakistan and Bangladesh: Review of research priorities and gaps. Glob. Food Secur. 2020, 26, 100370. [Google Scholar] [CrossRef]
  2. Savary, S.; Waddington, S.; Akter, S.; Almekinders, C.J.M.; Harris, J.; Korsten, L.; Rötter, R.P.; Broeck, G.V.D. Revisiting food security in 2021: An overview of the past year. Food Secur. 2022, 14, 1–7. [Google Scholar] [CrossRef] [PubMed]
  3. Sheffield, J.; Wood, E.F.; Roderick, M.L. Little change in global drought over the past 60 years. Nature 2012, 491, 435–438. [Google Scholar] [CrossRef] [PubMed]
  4. Mccabe, G.J.; Wolock, D.M. Variability and trends in global drought. Earth Space Sci. 2015, 2, 223–228. [Google Scholar] [CrossRef]
  5. Li, J.Z.; Zhang, S.Y.; Huang, L.M.; Zhang, T.; Feng, P. Drought prediction models driven by meteorological and remote sensing data in Guanzhong Area, China. Hydrol. Res. 2020, 51, 942–958. [Google Scholar] [CrossRef]
  6. Zhang, Q.; Yao, Y.B.; Li, Y.H.; Huang, J.P.; Ma, Z.G.; Wang, Z.L.; Wang, S.P.; Wang, Y.; Zhang, Y. Causes and changes of drought in China: Research progress and prospects. J. Meteorol. Res. 2020, 34, 460–481. [Google Scholar] [CrossRef]
  7. Song, S.B.; Singh, V.P.; Song, X.Y.; Kang, Y. A probability distribution for hydrological drought duration. J. Hydrol. 2021, 599, 126479. [Google Scholar] [CrossRef]
  8. The Ministry of Water Resources of the People’s Republic of China. China Floods and Droughts Prevention Bulletin; The Ministry of Water Resources of the People’s Republic of China: Beijing, China, 2020.
  9. Dai, M.; Huang, S.Z.; Huang, Q.; Leng, G.Y.; Guo, Y.; Wang, L.; Fang, W.; Li, P.; Zheng, X.D. Assessing agricultural drought risk and its dynamic evolution characteristics. Agric. Water Manag. 2020, 231, 106003. [Google Scholar] [CrossRef]
  10. Du, C.; Chen, J.S.; Nie, T.Z.; Dai, C.L. Spatial–temporal changes in meteorological and agricultural droughts in Northeast China: Change patterns, response relationships and causes. Nat. Hazards 2022, 110, 155–173. [Google Scholar] [CrossRef]
  11. IPCC (Intergovernmental Panel on Climate Change). Managing the Risks of Extreme Events and Disasters to Advance Climate Change Adaptation: Special Report of the Intergovernmental Panel on Climate Change; Cambridge University Press: Cambridge, UK, 2012. [Google Scholar]
  12. Tsakiris, G. Drought risk assessment and management. Water Resour. Manag. 2017, 31, 3083–3095. [Google Scholar] [CrossRef]
  13. Brainard, D.C.; Byl, B.; Hayden, Z.D.; Noyes, D.C.; Bakker, J.; Werling, B. Managing drought risk in a changing climate: Irrigation and cultivar impacts on Michigan asparagus. Agric. Water Manag. 2019, 213, 773–781. [Google Scholar] [CrossRef]
  14. Carrão, H.; Naumann, G.; Barbosa, P. Mapping global patterns of drought risk: An empirical framework based on sub-national estimates of hazard, exposure and vulnerability. Glob. Environ. Chang. 2016, 39, 108–124. [Google Scholar] [CrossRef]
  15. Duinen, R.V.; Filatova, T.; Geurts, P.; Veen, A.V.D. Empirical analysis of farmers’ drought risk perception: Objective factors, personal circumstances, and social influence. Risk Anal. 2015, 35, 741–755. [Google Scholar] [CrossRef]
  16. Yue, Y.J.; Wang, L.; Li, J.; Zhu, A.X. An EPIC model-based wheat drought risk assessment using new climate scenarios in China. Clim. Chang. 2018, 147, 539–553. [Google Scholar] [CrossRef]
  17. Qu, Y.P.; Hui, G.; Lv, J.; Su, Z.C.; Cheng, X.T.; Sun, H.Q. Agricultural drought disaster risk assessment in China based on the regional disaster system theory. J. Hydraul. Eng. 2015, 46, 908–917. [Google Scholar]
  18. Kolmogorov, A.N. Grundbegriffe der Wahrscheinlichkeitsrechnung; Springer: Berlin/Heidelberg, Germany; New York, NY, USA, 1933. [Google Scholar]
  19. Koutsoyiannis, D.; Makropoulos, C.; Langousis, A.; Baki, S.; Efstratiadis, A.; Christofides, A.; Karavokiros, G.; Mamassis, N. HESS opinions: “Climate, hydrology, energy, water: Recognizing uncertainty and seeking sustainability”. Hydrol. Earth Syst. Sci. 2009, 13, 247–257. [Google Scholar] [CrossRef] [Green Version]
  20. Hao, L.; Zhang, X.Y.; Liu, S.D. Risk assessment to China’s agricultural drought disaster in county unit. Nat. Hazards 2012, 61, 785–801. [Google Scholar] [CrossRef]
  21. Koutsoyiannis, D. Generic and parsimonious stochastic modelling for hydrology and beyond. Hydrol. Sci. J. 2016, 61, 225–244. [Google Scholar] [CrossRef]
  22. Xie, Z.T.; Xu, J.P.; Deng, Y.F. Risk analysis and evaluation of agricultural drought disaster in the major grain-producing areas, China. Geomat. Nat. Hazards Risk 2016, 7, 1691–1706. [Google Scholar] [CrossRef]
  23. Yu, X.B.; Li, C.L.; Huo, T.Z.; Ji, Z.H. Information diffusion theory-based approach for the risk assessment of meteorological disasters in the Yangtze River Basin. Nat. Hazards 2021, 107, 2337–2362. [Google Scholar]
  24. Kim, J.S.; Park, S.Y.; Hong, H.P.; Chen, J.; Choi, S.J.; Kim, T.W.; Lee, J.H. Drought risk assessment for future climate projections in the Nakdong River Basin, Korea. Int. J. Climatol. 2020, 40, 4528–4540. [Google Scholar] [CrossRef]
  25. Luo, D.; Ye, L.L.; Sun, D. Risk evaluation of agricultural drought disaster using a grey cloud clustering model in Henan Province, China. Int. J. Disaster Risk Reduct. 2020, 49, 101759. [Google Scholar] [CrossRef]
  26. Hoque, M.A.A.; Pradhan, B.; Ahmed, N.; Sohel, M.S. Agricultural drought risk assessment of Northern New South Wales, Australia using geospatial techniques. Sci. Total Environ. 2021, 756, 143600. [Google Scholar] [CrossRef]
  27. Zhang, F.; Chen, Y.N.; Zhang, J.Q.; Guo, E.L.; Wang, R.; Li, D.J. Dynamic drought risk assessment for maize based on crop simulation model and multi-source drought indices. J. Clean. Prod. 2019, 233, 100–114. [Google Scholar] [CrossRef]
  28. Wang, Y.X.; Lv, J.; Wang, Y.C.; Sun, H.Q.; Hannaford, J.; Su, Z.C.; Barker, L.J.; Qu, Y.P. Drought risk assessment of spring maize based on APSIM crop model in Liaoning province, China. Int. J. Disaster Risk Reduct. 2020, 45, 101483. [Google Scholar] [CrossRef]
  29. Yin, Y.Y.; Gao, Y.; Lin, D.G.; Wang, L.; Ma, W.D.; Wang, J.A. Mapping the global-scale maize drought risk under climate change based on the GEPIC-Vulnerability-Risk model. Int. J. Disaster Risk Sci. 2021, 12, 428–442. [Google Scholar] [CrossRef]
  30. Jin, J.L.; Zhao, X.Y.; Cui, Y.; Zhou, Y.L.; Chen, M.L.; Ning, S.W. Application of semipartial subtraction set pair potential method to the dynamic assessment of regional drought risk. Hydro-Sci. Eng. 2021, 1, 36–44. [Google Scholar]
  31. Cui, Y.; Jiang, S.M.; Jin, J.L.; Ning, S.W.; Feng, P. Quantitative assessment of soybean drought loss sensitivity at different growth stages based on S-shaped damage curve. Agric. Water Manag. 2019, 213, 821–832. [Google Scholar] [CrossRef]
  32. Zhao, K.Q. Set Pair Analysis and Its Preliminary Application; Zhejiang Science and Technology Press: Hangzhou, China, 2000. [Google Scholar]
  33. Chen, M.L.; Ning, S.W.; Jin, J.L.; Wu, C.G.; Zhou, Y.L. Risk assessment of agricultural drought disaster on the Huaibei Plain of China based on the improved connection number and entropy information diffusion method. Water 2020, 12, 1089. [Google Scholar] [CrossRef]
  34. Wang, Z.L.; Ma, H.L.; Lai, C.G.; Song, H.J. Set pair analysis model based on GIS to evaluation for flood damage risk. Procedia Eng. 2012, 28, 196–201. [Google Scholar]
  35. Zou, Q.; Zhou, J.Z.; Zhou, C.; Song, L.X.; Guo, J. Comprehensive flood risk assessment based on set pair analysis-variable fuzzy sets model and fuzzy AHP. Stoch. Environ. Res. Risk Assess. 2013, 27, 525–546. [Google Scholar] [CrossRef]
  36. Chen, M.L.; Ning, S.W.; Cui, Y.; Jin, J.L.; Zhou, Y.L.; Wu, C.G. Quantitative assessment and diagnosis for regional agricultural drought resilience based on set pair analysis and connection entropy. Entropy 2019, 21, 373. [Google Scholar] [CrossRef] [PubMed] [Green Version]
  37. Ge, W.; Li, Z.K.; Li, W.; Wu, M.M.; Li, J.J.; Pan, Y.P. Risk evaluation of dam-break environmental impacts based on the set pair analysis and cloud model. Nat. Hazards 2020, 104, 1641–1653. [Google Scholar] [CrossRef]
  38. Lyu, H.M.; Shen, S.L.; Zhou, A.N. The development of IFN-SPA: A new risk assessment method of urban water quality and its application in Shanghai. J. Clean. Prod. 2021, 282, 124542. [Google Scholar] [CrossRef]
  39. Qu, X.Y.; Shi, L.Q.; Qu, X.W.; Bilal, A.; Qiu, M.; Gao, W.F. Multi-model fusion for assessing risk of inrush of limestone karst water through the mine floor. Energy Rep. 2021, 7, 1473–1487. [Google Scholar] [CrossRef]
  40. Li, Z.; Jin, J.L.; Cui, Y.; Zhang, L.B.; Wu, C.G.; Ning, S.W.; Zhou, Y.L. Dynamic evaluation of regional water resources carrying capacity based on set pair analysis and partial connection number. Water Supply 2022, 22, 2407–2423. [Google Scholar] [CrossRef]
  41. Li, Z.Y.; Wu, M.; Liu, Z.Y.; Li, D.P.; Guo, C. A new approach to i in connection number and application in water quality assessment. J. Sichuan Univ. (Eng. Sci. Ed.) 2009, 41, 8–13. [Google Scholar]
  42. Tang, Y.P. The methods to fetch i in difference degree coefficient of set pair analysis and its applications. Math. Pract. Theory 2009, 39, 67–70. [Google Scholar]
  43. Pan, Z.W.; Jin, J.L.; Zhou, R.X. Assessment method using connection number based on trapezoidal fuzzy numbers and its application. Adv. Sci. Technol. Water Resour. 2016, 36, 69–74. [Google Scholar]
  44. Wang, Y.Y.; Zhou, Y.L.; Zhou, P.; Jin, J.L. Agricultural drought disaster risk assessment in Anhui Province based on set pair analysis. Water Resour. Power 2019, 37, 1–5. [Google Scholar]
  45. Cui, Y.; Feng, P.; Jin, J.L.; Liu, L. Water resources carrying capacity evaluation and diagnosis based on set pair analysis and improved the entropy weight method. Entropy 2018, 20, 359. [Google Scholar] [CrossRef] [PubMed] [Green Version]
  46. Cui, Y.; Zhou, Y.L.; Jin, J.L.; Wu, C.G.; Zhang, L.B.; Ning, S.W. Quantitative evaluation and diagnosis of water resources carrying capacity (WRCC) based on dynamic difference degree coefficient in the Yellow River irrigation district. Front. Earth Sci. 2022, 10, 816055. [Google Scholar] [CrossRef]
  47. Koutsoyiannis, D. Entropy: From thermodynamics to hydrology. Entropy 2014, 16, 1287–1314. [Google Scholar] [CrossRef] [Green Version]
  48. Li, D.; Yang, T.M.; Zhang, X.X.; Zhang, B.Z. Causes and impact assessment of autumn and winter low temperature and drought from 2008 to 2009 in Suzhou. Meteorol. Mon. 2011, 37, 615–621. [Google Scholar]
  49. Shi, X. Flood and drought disaster analysis and countermeasures of Suzhou City. Value Eng. 2015, 34, 289–290. [Google Scholar]
  50. Valiantzas, J.D. Temperature-and humidity-based simplified Penman’s ET0 formulae. Comparisons with temperature-based Hargreaves-Samani and other methodologies. Agric. Water Manag. 2018, 208, 326–334. [Google Scholar] [CrossRef]
  51. Wu, C.G.; Ning, S.W.; Jin, J.L.; Zhou, Y.L.; Zhou, L.Y.; Bai, X.; Zhang, L.B.; Cui, Y. Construction and application of comprehensive drought index based on uncertainty cloud reasoning algorithm. Sci. Total Environ. 2021, 779, 146533. [Google Scholar] [CrossRef]
  52. Li, Y.J.; Ren, F.N.; Li, Y.P.; Wang, P.L.; Yan, H.M. Characteristics of the regional meteorological drought events in Southwest China during 1960–2010. J. Meteorol. Res. 2014, 28, 381–392. [Google Scholar] [CrossRef]
  53. Jehanzaib, M.; Sattar, M.N.; Lee, J.H.; Kim, T.W. Investigating effect of climate change on drought propagation from meteorological to hydrological drought using multi-model ensemble projections. Stoch. Environ. Res. Risk Assess. 2020, 34, 7–21. [Google Scholar] [CrossRef]
  54. Fahimirad, Z.; Shahkarami, N. The impact of climate change on hydro-meteorological droughts using copula functions. Water Resour. Manag. 2021, 35, 3969–3993. [Google Scholar] [CrossRef]
  55. Sun, X.; Lai, P.; Wang, S.; Song, L.; Ma, M.; Han, X. Monitoring of extreme agricultural drought of the past 20 years in southwest China using GLDAS soil moisture. Remote Sens. 2022, 14, 1323. [Google Scholar] [CrossRef]
  56. Ma, M.W.; Ren, L.L.; Singh, V.P.; Tu, X.J.; Jiang, S.H.; Liu, Y. Evaluation and application of the SPDI-JDI for droughts in Texas, USA. J. Hydrol. 2015, 521, 34–45. [Google Scholar] [CrossRef]
  57. Dalezios, N.; Boukouvala, E.; Blanta, A.; Pismichos, N.; Spyropoulos, N.; Psilovikos, A. Validation and Reliability Assessment of Conventional Indices for the Estimation of Hydrometeorological Drought. In Proceedings of the 7th Conference of the Hellenic Society of Agricultural Engineers, Athens, Greece, 24–27 November 2011. [Google Scholar]
  58. Urquijo-Reguera, J.; Gómez-Villarino, M.T.; Pereira, D.; De Stefano, L. An assessment framework to analyze drought management plans: The case of Spain. Agronomy 2022, 12, 970. [Google Scholar] [CrossRef]
  59. Koutsoyiannis, D. Revisiting the global hydrological cycle: Is it intensifying? Hydrol. Earth Syst. Sci. 2020, 24, 3899–3932. [Google Scholar] [CrossRef]
  60. Hurst, H.E. Long-term storage capacity of reservoirs. Trans. Am. Soc. Civ. Eng. 1951, 116, 770–799. [Google Scholar] [CrossRef]
  61. Mandelbrot, B.B.; Wallis, J.R. Noah, Joseph and operational hydrology. Water Resour. Res. 1968, 4, 909–918. [Google Scholar] [CrossRef] [Green Version]
  62. Klemeš, V. The Hurst phenomenon: A puzzle? Water Resour. Res. 1974, 10, 675–688. [Google Scholar] [CrossRef]
  63. Koutsoyiannis, D. Climate change, the Hurst phenomenon, and hydrological statistics. Hydrol. Sci. J. 2003, 48, 3–24. [Google Scholar] [CrossRef]
  64. Beran, J.; Feng, Y.H.; Ghosh, S.; Kulik, R. Long-Memory Processes: Probabilistic Properties and Statistical Methods; Springer: Berlin/Heidelberg, Germany; New York, NY, USA, 2013. [Google Scholar]
  65. Dimitriadis, P.; Koutsoyiannis, D.; Iliopoulou, T.; Papanicolaou, P. A global-scale investigation of stochastic similarities in marginal distribution and dependence structure of key hydrological-cycle processes. Hydrology 2021, 8, 59. [Google Scholar] [CrossRef]
Figure 1. The establishment process of agricultural drought disaster risk evaluation and obstacle factor diagnosis model based on connection number and information entropy.
Entropy 24 00872 g001
Figure 2. The value process of dynamic difference degree coefficient varying with evaluation index sample value for ternary connection number. (a) Positive index; (b) Negative index. The larger the value of positive (negative) index, the higher (lower) the evaluation grade.
Entropy 24 00872 g002
Figure 3. The location of Suzhou City in Anhui Province, China.
Entropy 24 00872 g003
Figure 4. The evaluation grades of agricultural drought disaster risk in Suzhou from 2007 to 2017 obtained by two methods. The two dashed lines from top to bottom represent the boundaries of the connection number value for low risk and middle risk status (0.667), and that for middle risk and high risk status (−0.667), respectively.
Entropy 24 00872 g004
Figure 5. The components of the connection number for agricultural drought disaster risk evaluation in Suzhou from 2007 to 2017.
Entropy 24 00872 g005
Figure 6. The information entropy values of the difference degree b and difference degree item bI for agricultural drought disaster risk system and its four subsystems in Suzhou.
Entropy 24 00872 g006
Figure 7. The evaluation grades of agricultural drought disaster risk subsystems in Suzhou from 2007 to 2017 obtained by two methods. (a) Drought hazard subsystem; (b) Drought damage sensitivity subsystem; (c) Exposure to drought subsystem; (d) Drought resistance subsystem. The two dotted lines from top to bottom represent the boundaries of the connection number value for low risk and middle risk status (0.667), and that for middle risk and high risk status (−0.667), respectively.
Entropy 24 00872 g007
Figure 8. The average values of the connection number and its components for agricultural drought disaster risk subsystem evaluation in Suzhou from 2007 to 2017.
Entropy 24 00872 g008
Figure 9. The connection number values of agricultural drought disaster risk subsystem evaluation in Suzhou from 2007 to 2017.
Entropy 24 00872 g009
Figure 10. The connection number values of agricultural drought disaster risk evaluation index in Suzhou from 2007 to 2017. (a) Drought hazard subsystem; (b) Drought damage sensitivity subsystem; (c) Exposure to drought subsystem; (d) Drought resistance subsystem. The four dotted lines from top to bottom represent the boundaries of the connection number value for strong promotion and weak promotion types (0.6), and those for weak promotion and weak obstacle (0.2), weak obstacle and middle obstacle (−0.2), middle obstacle and strong obstacle types (−0.6), respectively.
Entropy 24 00872 g010aEntropy 24 00872 g010bEntropy 24 00872 g010c
Table 1. Evaluation system and grade criteria of agricultural drought disaster risk [30,44].
Evaluation SystemEvaluation SubsystemEvaluation IndexEvaluation Grade CriteriaSubsystem WeightIndex WeightIndex Type *
Grade 1
(Low Risk)
Grade 2
(Middle Risk)
Grade 3
(High Risk)
agricultural drought disaster risk systemdrought hazard subsystempercentage of precipitation negative anomaly X1 (%)≤10(10, 20]>200.3290.069positive
annual precipitation X2 (mm)≥900[800, 900)<8000.057negative
relative humidity index X3 (%)≥−0.40[−0.60, −0.40)<−0.600.049negative
water resources amount per unit area X4 (104 m3 km−2)≥45[25, 45)<250.057negative
soil relative humidity X5 (%)≥75[65, 75)<650.044negative
soil type X6≥0.70[0.50, 0.70)<0.500.052negative
drought damage sensitivity subsystempercentage of agricultural population X7 (%)≤70(70, 85]>850.2410.060positive
percentage of paddy field area X8 (%)≤2(2, 10]>100.068positive
water consumption per RMB104 GDP X9 (m3 per RMB104)≤100(100, 150]>1500.062positive
percentage of forest cover X10 (%)≥30[20, 30)<200.052negative
exposure to drought subsystempopulation density X11 (person km−2)≤450(450, 650]>6500.1920.047positive
percentage of cultivated land X12 (%)≤40(40, 50]>500.056positive
multiple cropping index X13 (%)≤180(180, 200]>2000.043positive
percentage of agricultural GDP X14 (%)≤20(20, 30]>300.046positive
drought resistance
subsystem
GDP per capita X15 (Yuan per person)≥15,000[10,000, 15,000)<10,0000.2380.030negative
percentage of reservoir regulation and storage X16 (%)≥10[5, 10)<50.053negative
existing water supply capacity per unit area X17 (104 m3 km−2)≥100,000[80,000, 100,000)<80,0000.038negative
percentage of effective irrigation area X18 (%)≥0.85[0.75, 0.85)<0.750.045negative
emergency water supply capacity per unit area X19 (104 m3 km−2)≥4000[3000, 4000)<30000.028negative
monitoring and warning capacity X20 (station per 100 km2)≥0.60[0.40, 0.60)<0.400.019negative
percentage of water-saving irrigation area X21 (%)≥35[25, 35)<250.025negative
* The larger the value of positive (negative) index, the higher (lower) the evaluation grade.
Table 2. The average connection number values and types of evaluation index for agricultural drought disaster risk in Suzhou from 2007 to 2017.
Evaluation SystemEvaluation SubsystemEvaluation IndexConnection Number ValueSemipartial Subtraction Set Pair Potential
ValueTypeValueStatus
agricultural drought disaster risk systemdrought hazard subsystempercentage of precipitation negative anomaly X1 (%)0.416weak promotion0.388partial identical potential
annual precipitation X2 (mm)−0.150weak obstacle−0.247partial inverse potential
relative humidity index X3 (%)0.067weak obstacle0.013symmetrical potential
water resources amount per unit area X4 (104 m3 km−2)−0.441middle obstacle−0.485partial inverse potential
soil relative humidity X5 (%)−0.105weak obstacle−0.205partial inverse potential
soil type X6−0.170weak obstacle−0.207partial inverse potential
drought damage sensitivity subsystempercentage of agricultural population X7 (%)−0.627strong obstacle−0.712inverse potential
percentage of paddy field area X8 (%)0.794strong promotion0.817identical potential
water consumption per RMB104 GDP X9 (m3 per RMB104)0.057weak obstacle−0.021symmetrical potential
percentage of forest cover X10 (%)0.395weak promotion0.400partial identical potential
exposure to drought subsystempopulation density X11 (person km−2)−0.632strong obstacle−0.691inverse potential
percentage of cultivated land X12 (%)−0.597middle obstacle−0.608inverse potential
multiple cropping index X13 (%)−0.231middle obstacle−0.321partial inverse potential
percentage of agricultural GDP X14 (%)−0.054weak obstacle−0.132symmetrical potential
drought resistance subsystemGDP per capita X15 (Yuan per person)0.299weak promotion0.246partial identical potential
percentage of reservoir regulation and storage X16 (%)−0.523middle obstacle−0.538partial inverse potential
existing water supply capacity per unit area X17 (104 m3 km−2)0.435weak promotion0.455partial identical potential
percentage of effective irrigation area X18 (%)−0.642strong obstacle−0.691inverse potential
emergency water supply capacity per unit area X19 (104 m3 km−2)−0.172weak obstacle−0.194symmetrical potential
monitoring and warning capacity X20 (station per 100 km2)−0.355middle obstacle−0.451partial inverse potential
percentage of water-saving irrigation area X21 (%)−0.245middle obstacle−0.222partial inverse potential
Publisher’s Note: MDPI stays neutral with regard to jurisdictional claims in published maps and institutional affiliations.

