
Effect of γ-Aminobutyric Acid (GABA) on the Metabolome of Two Strains of Lasiodiplodia theobromae Isolated from Grapevine

 , , , , , , and
Abstract
:1. Introduction
2. Results
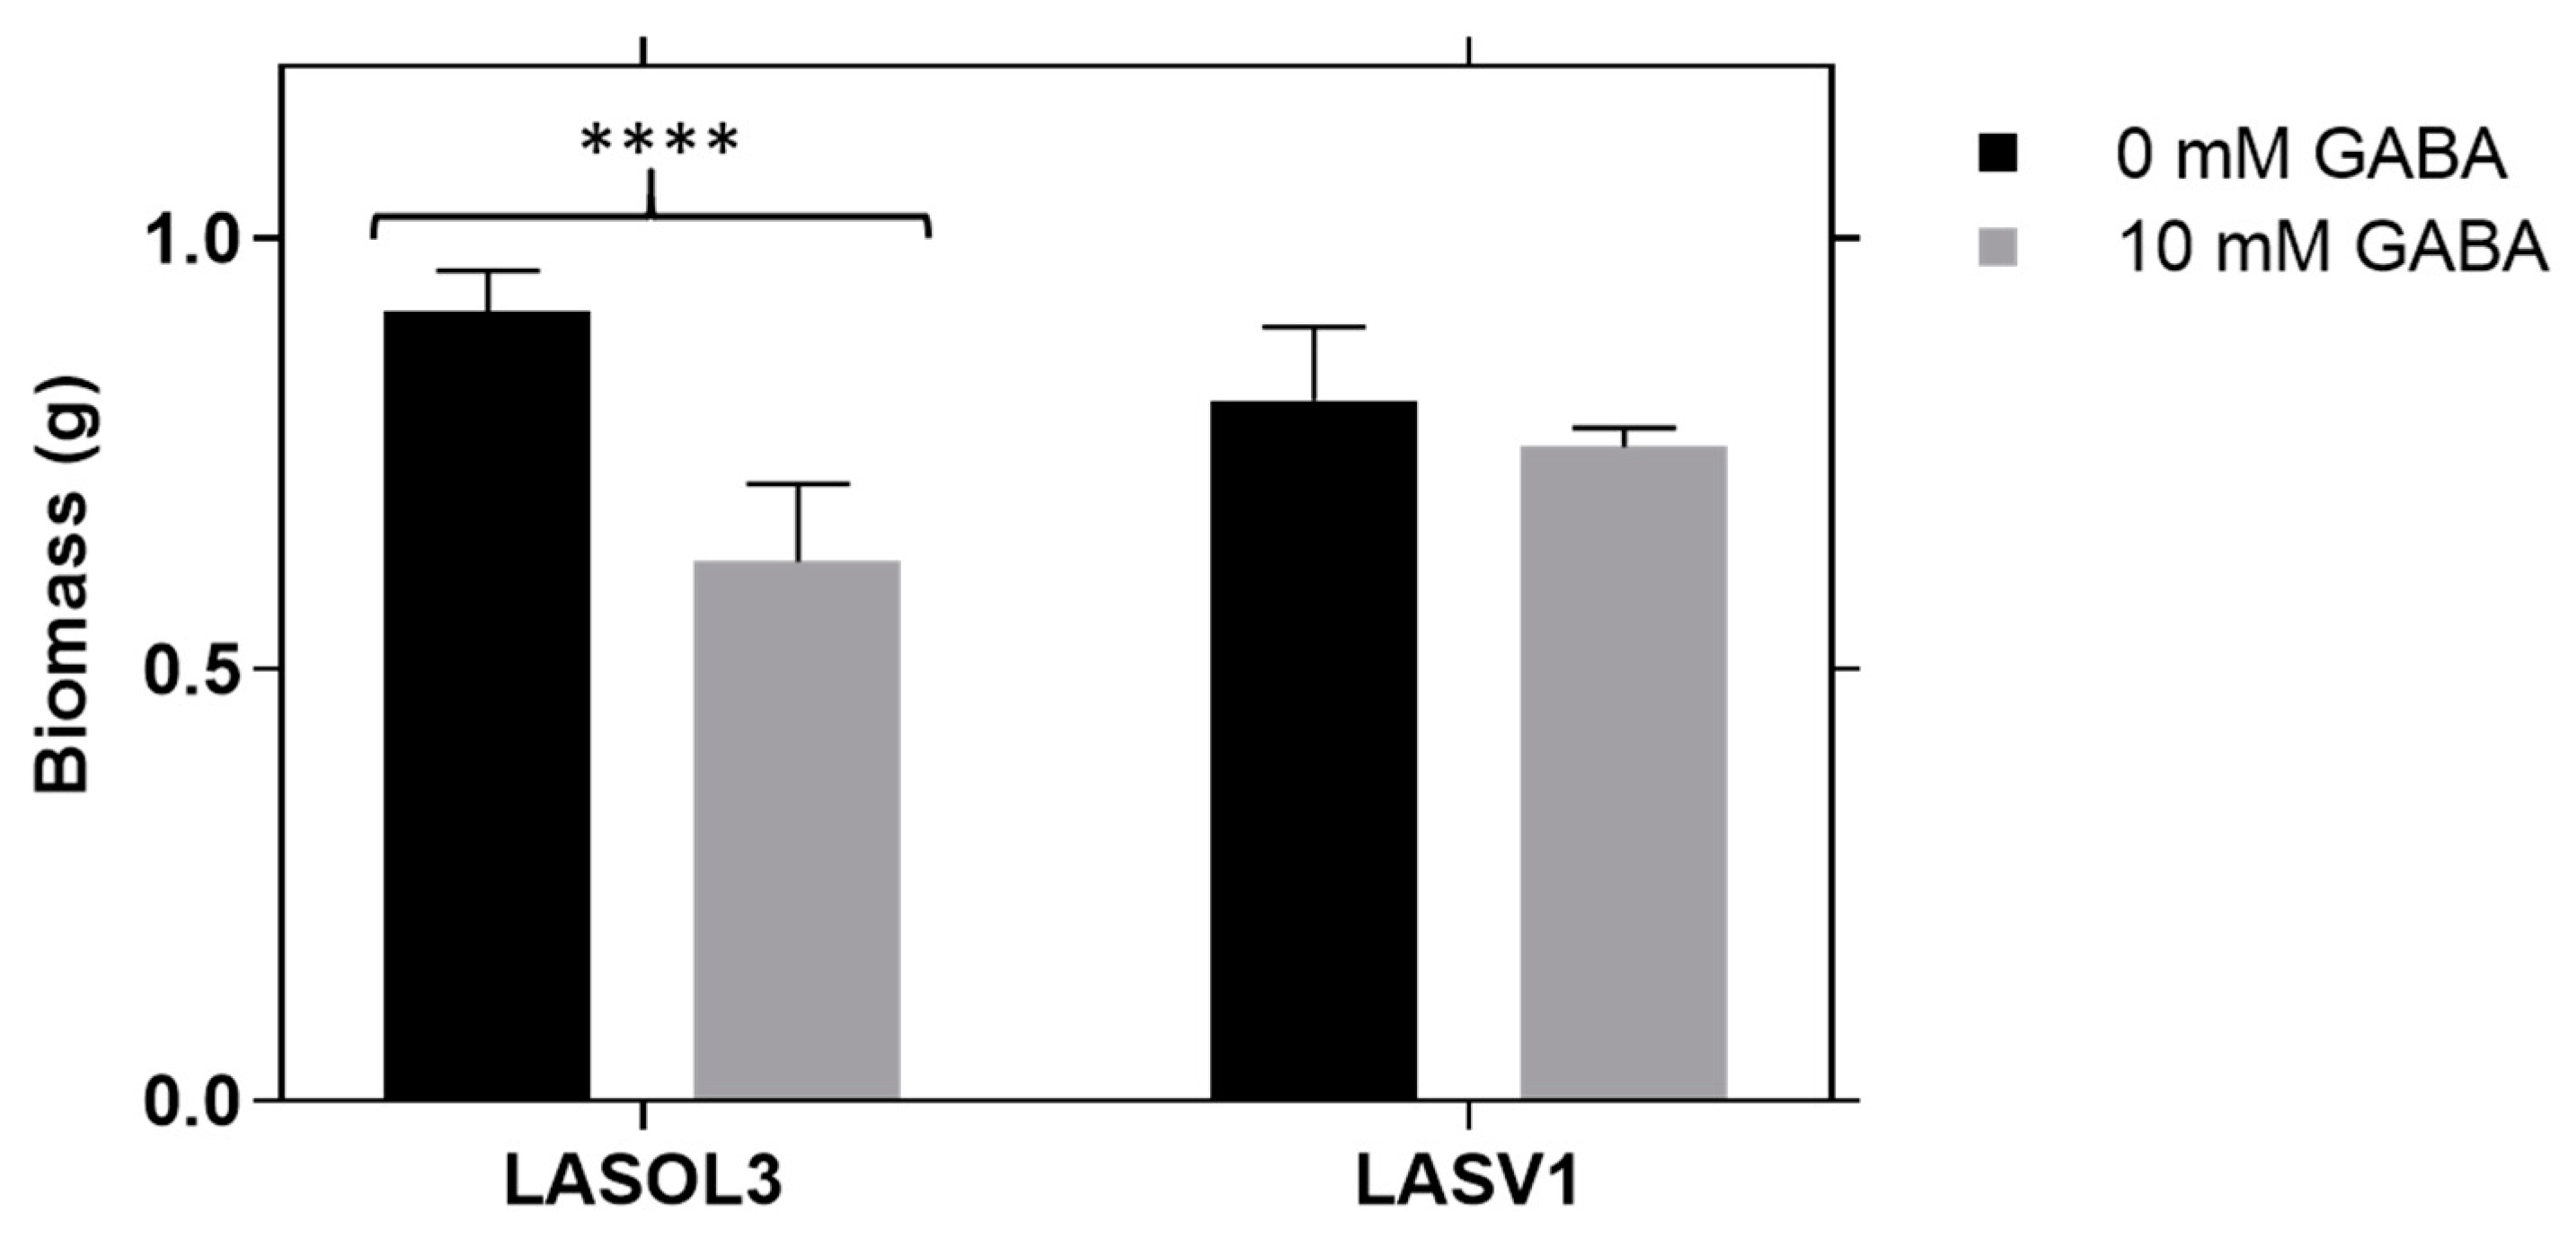
2.1. Biomass
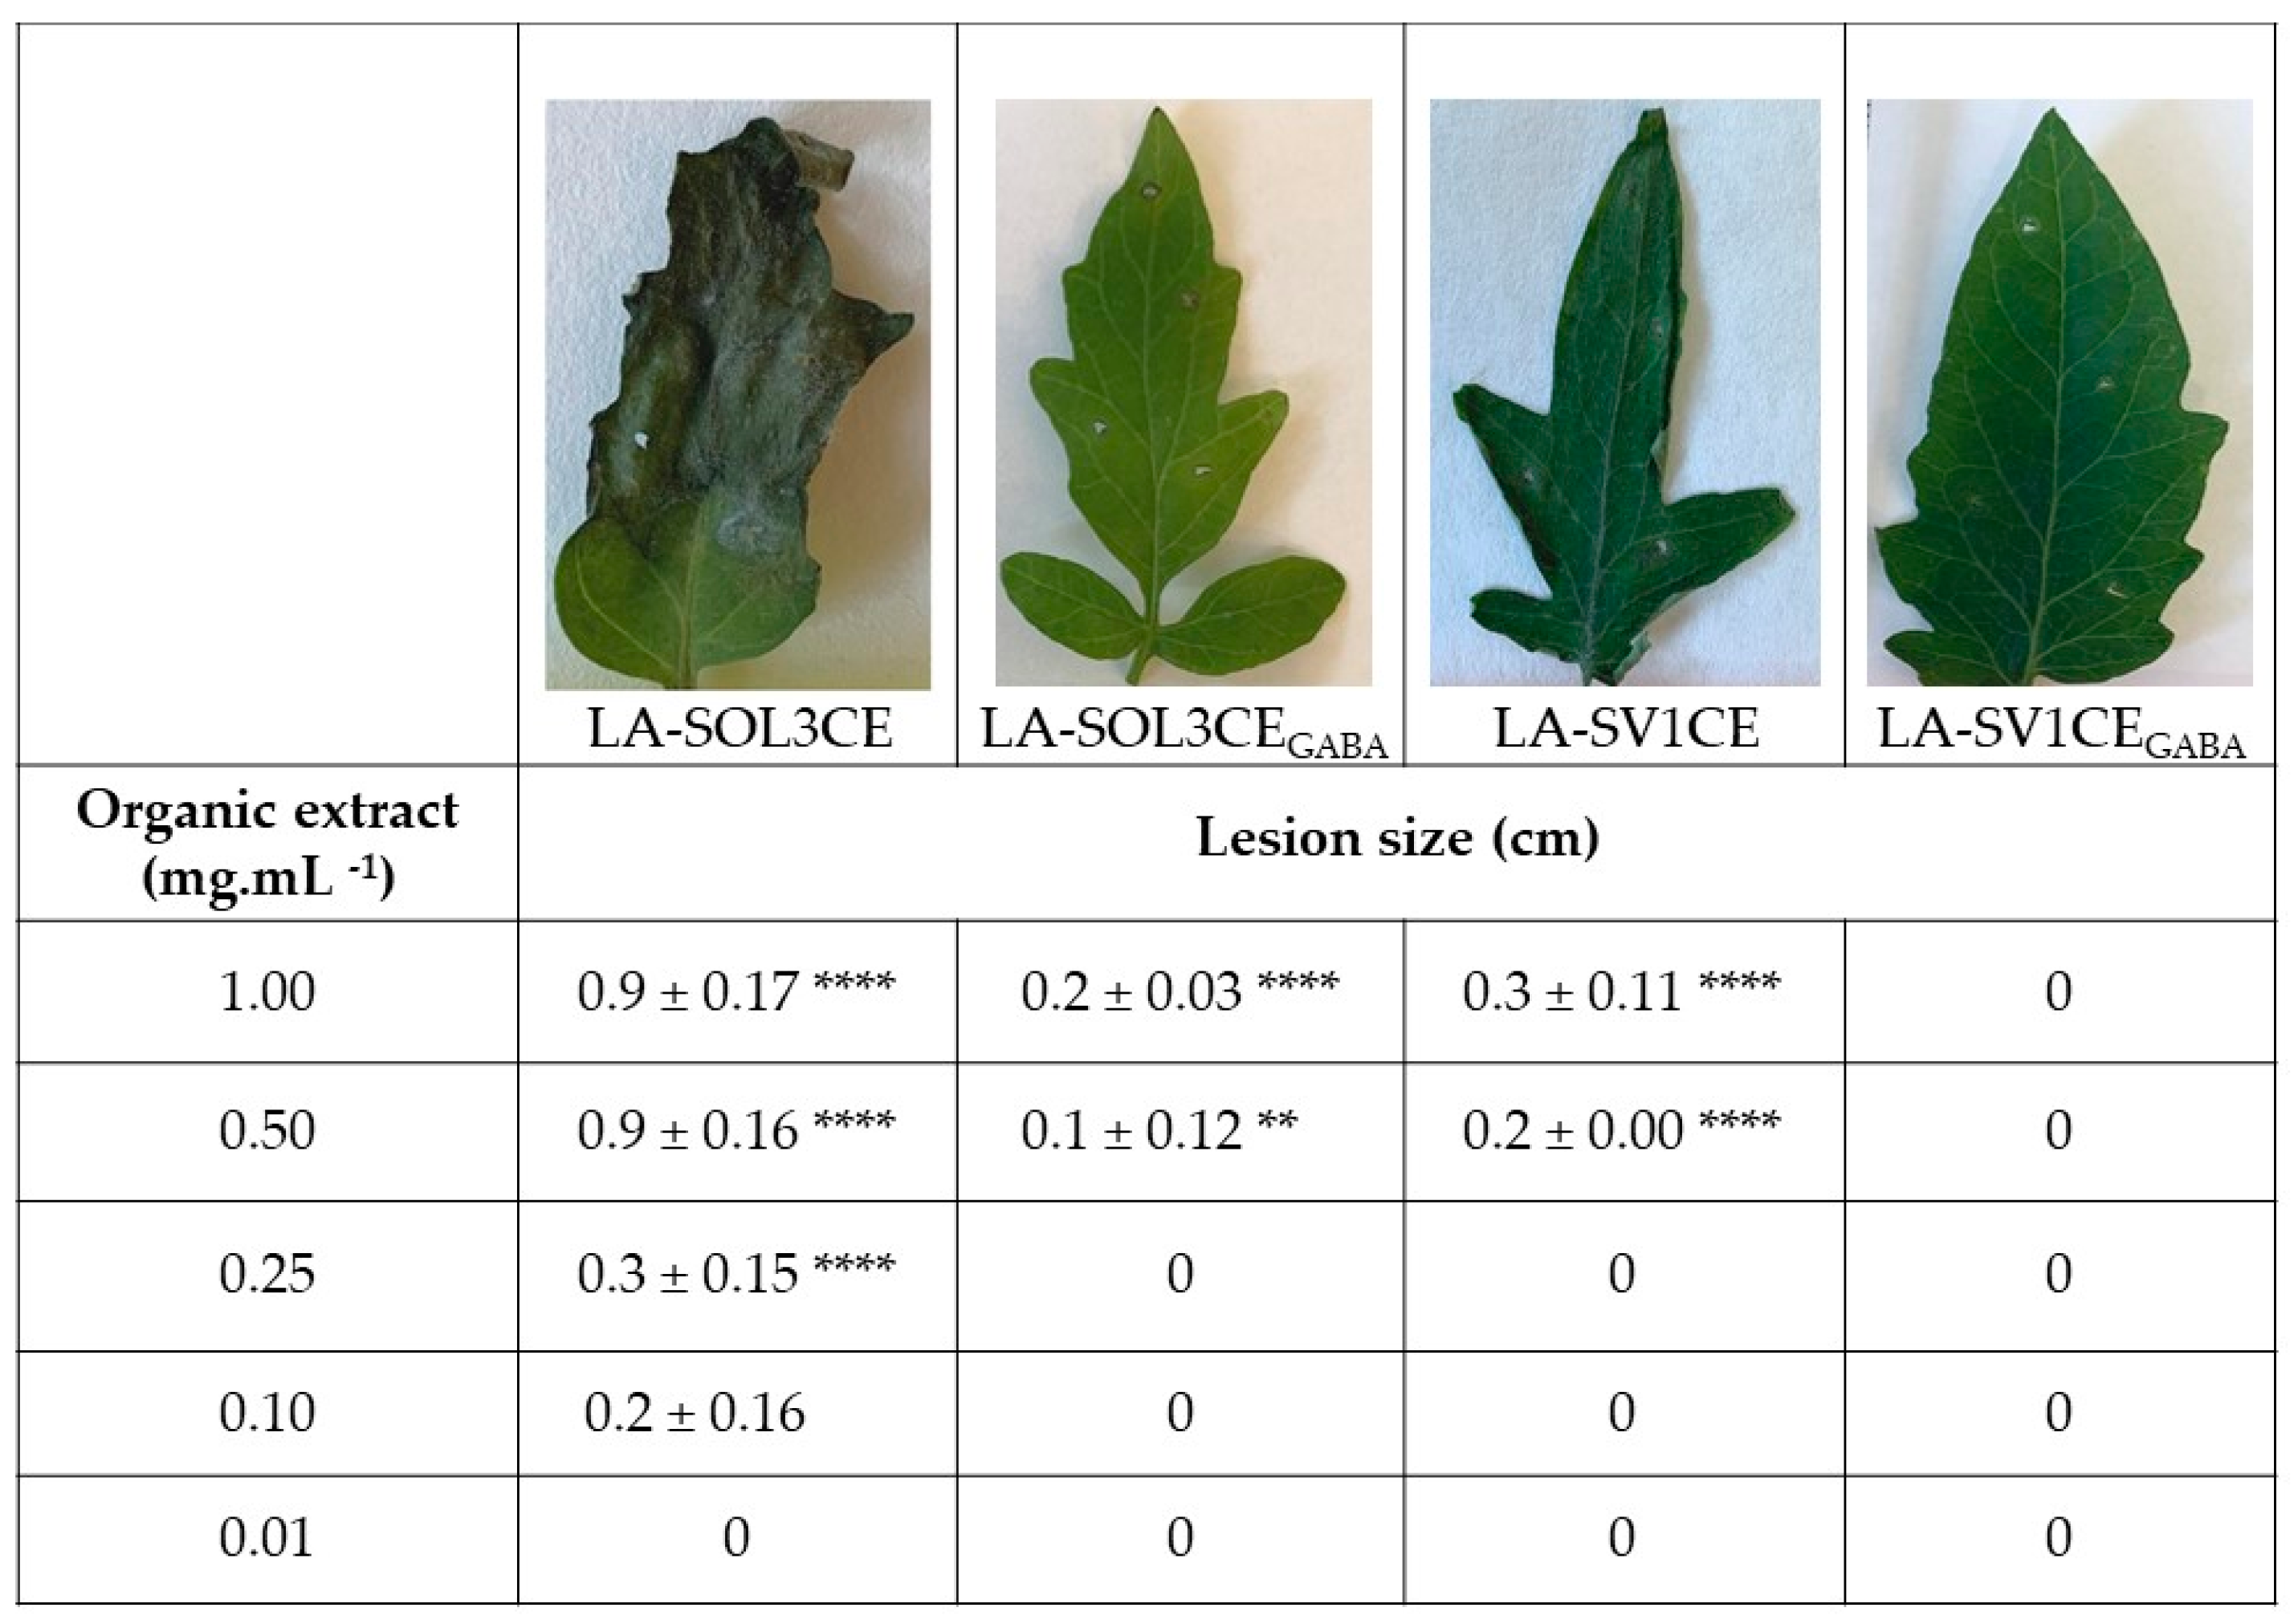
2.2. Phytotoxicity Assays
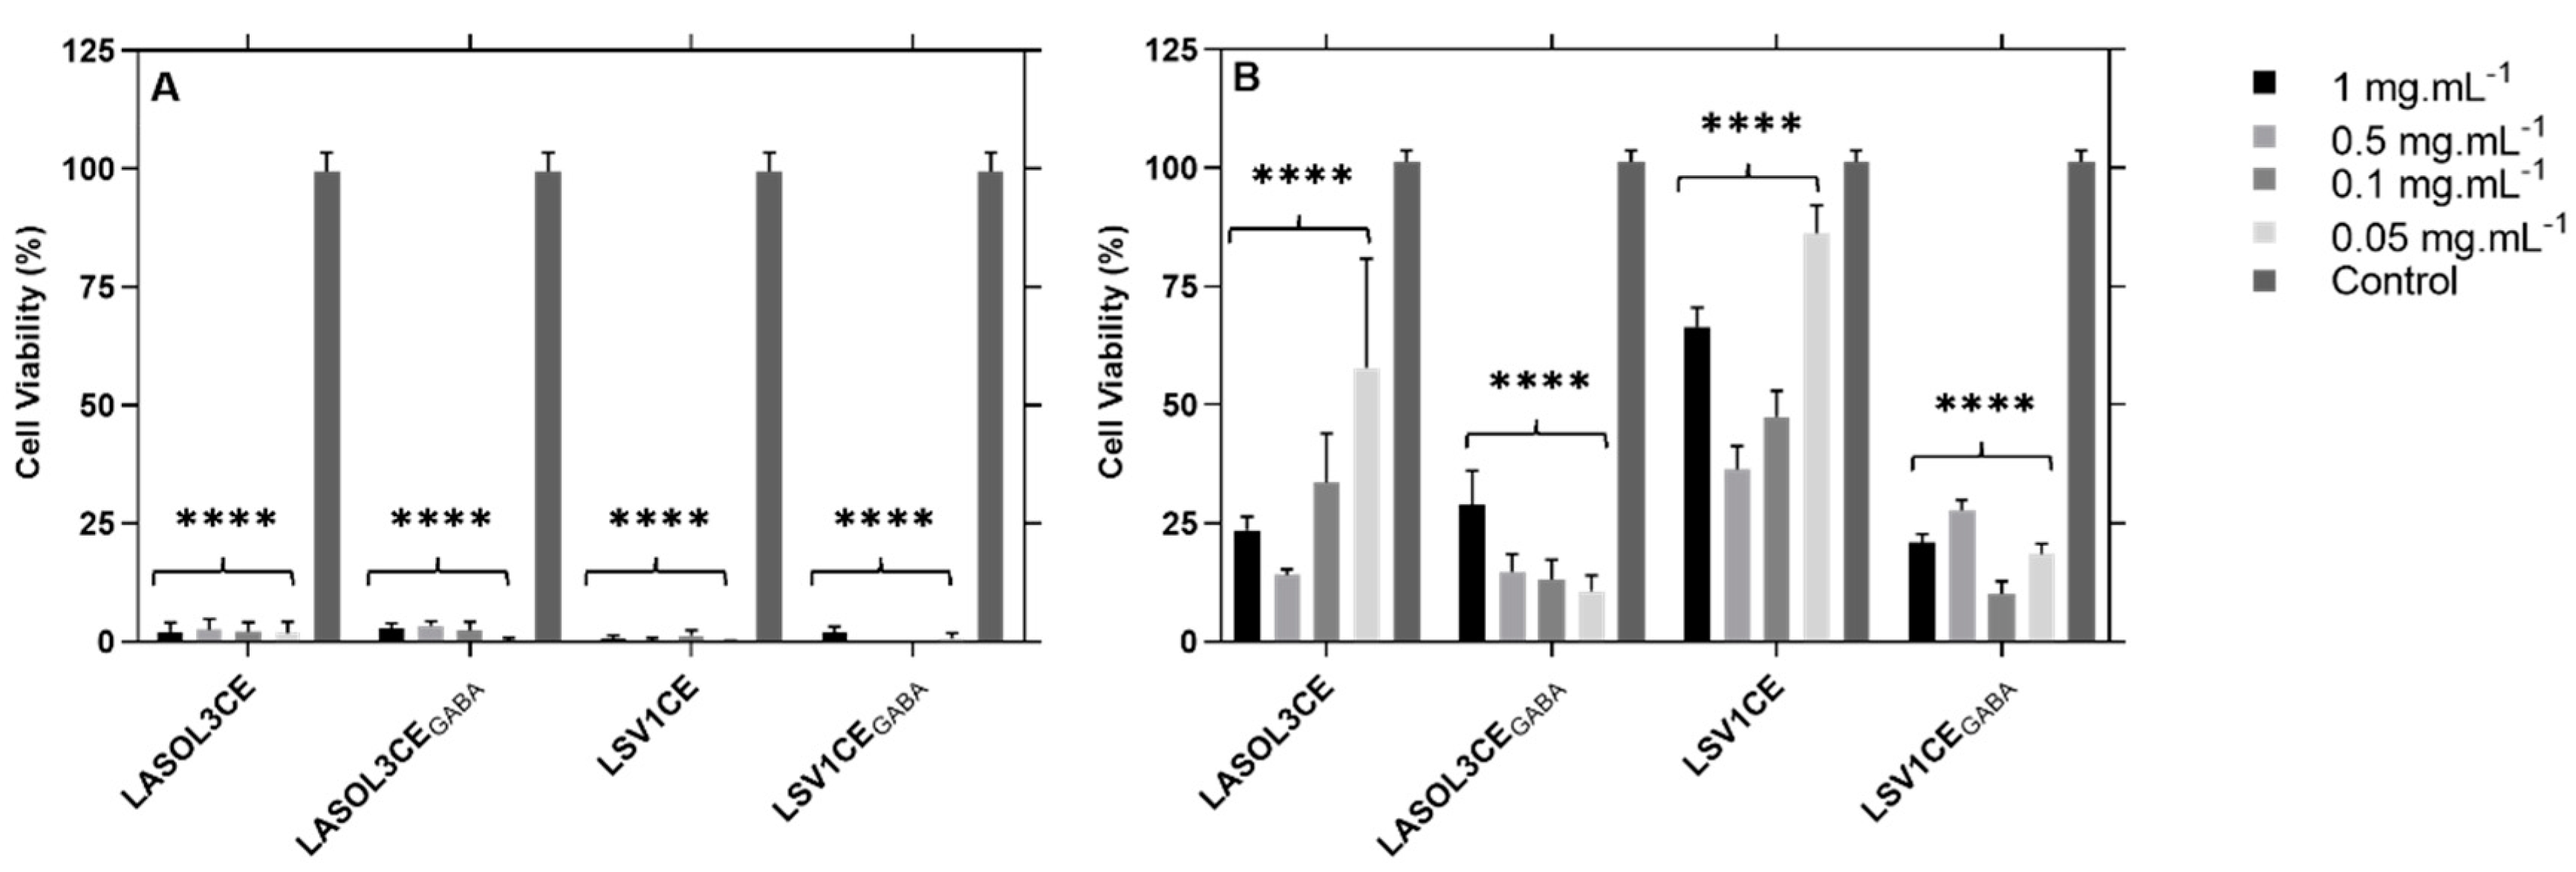
2.3. Cytotoxicity Assays
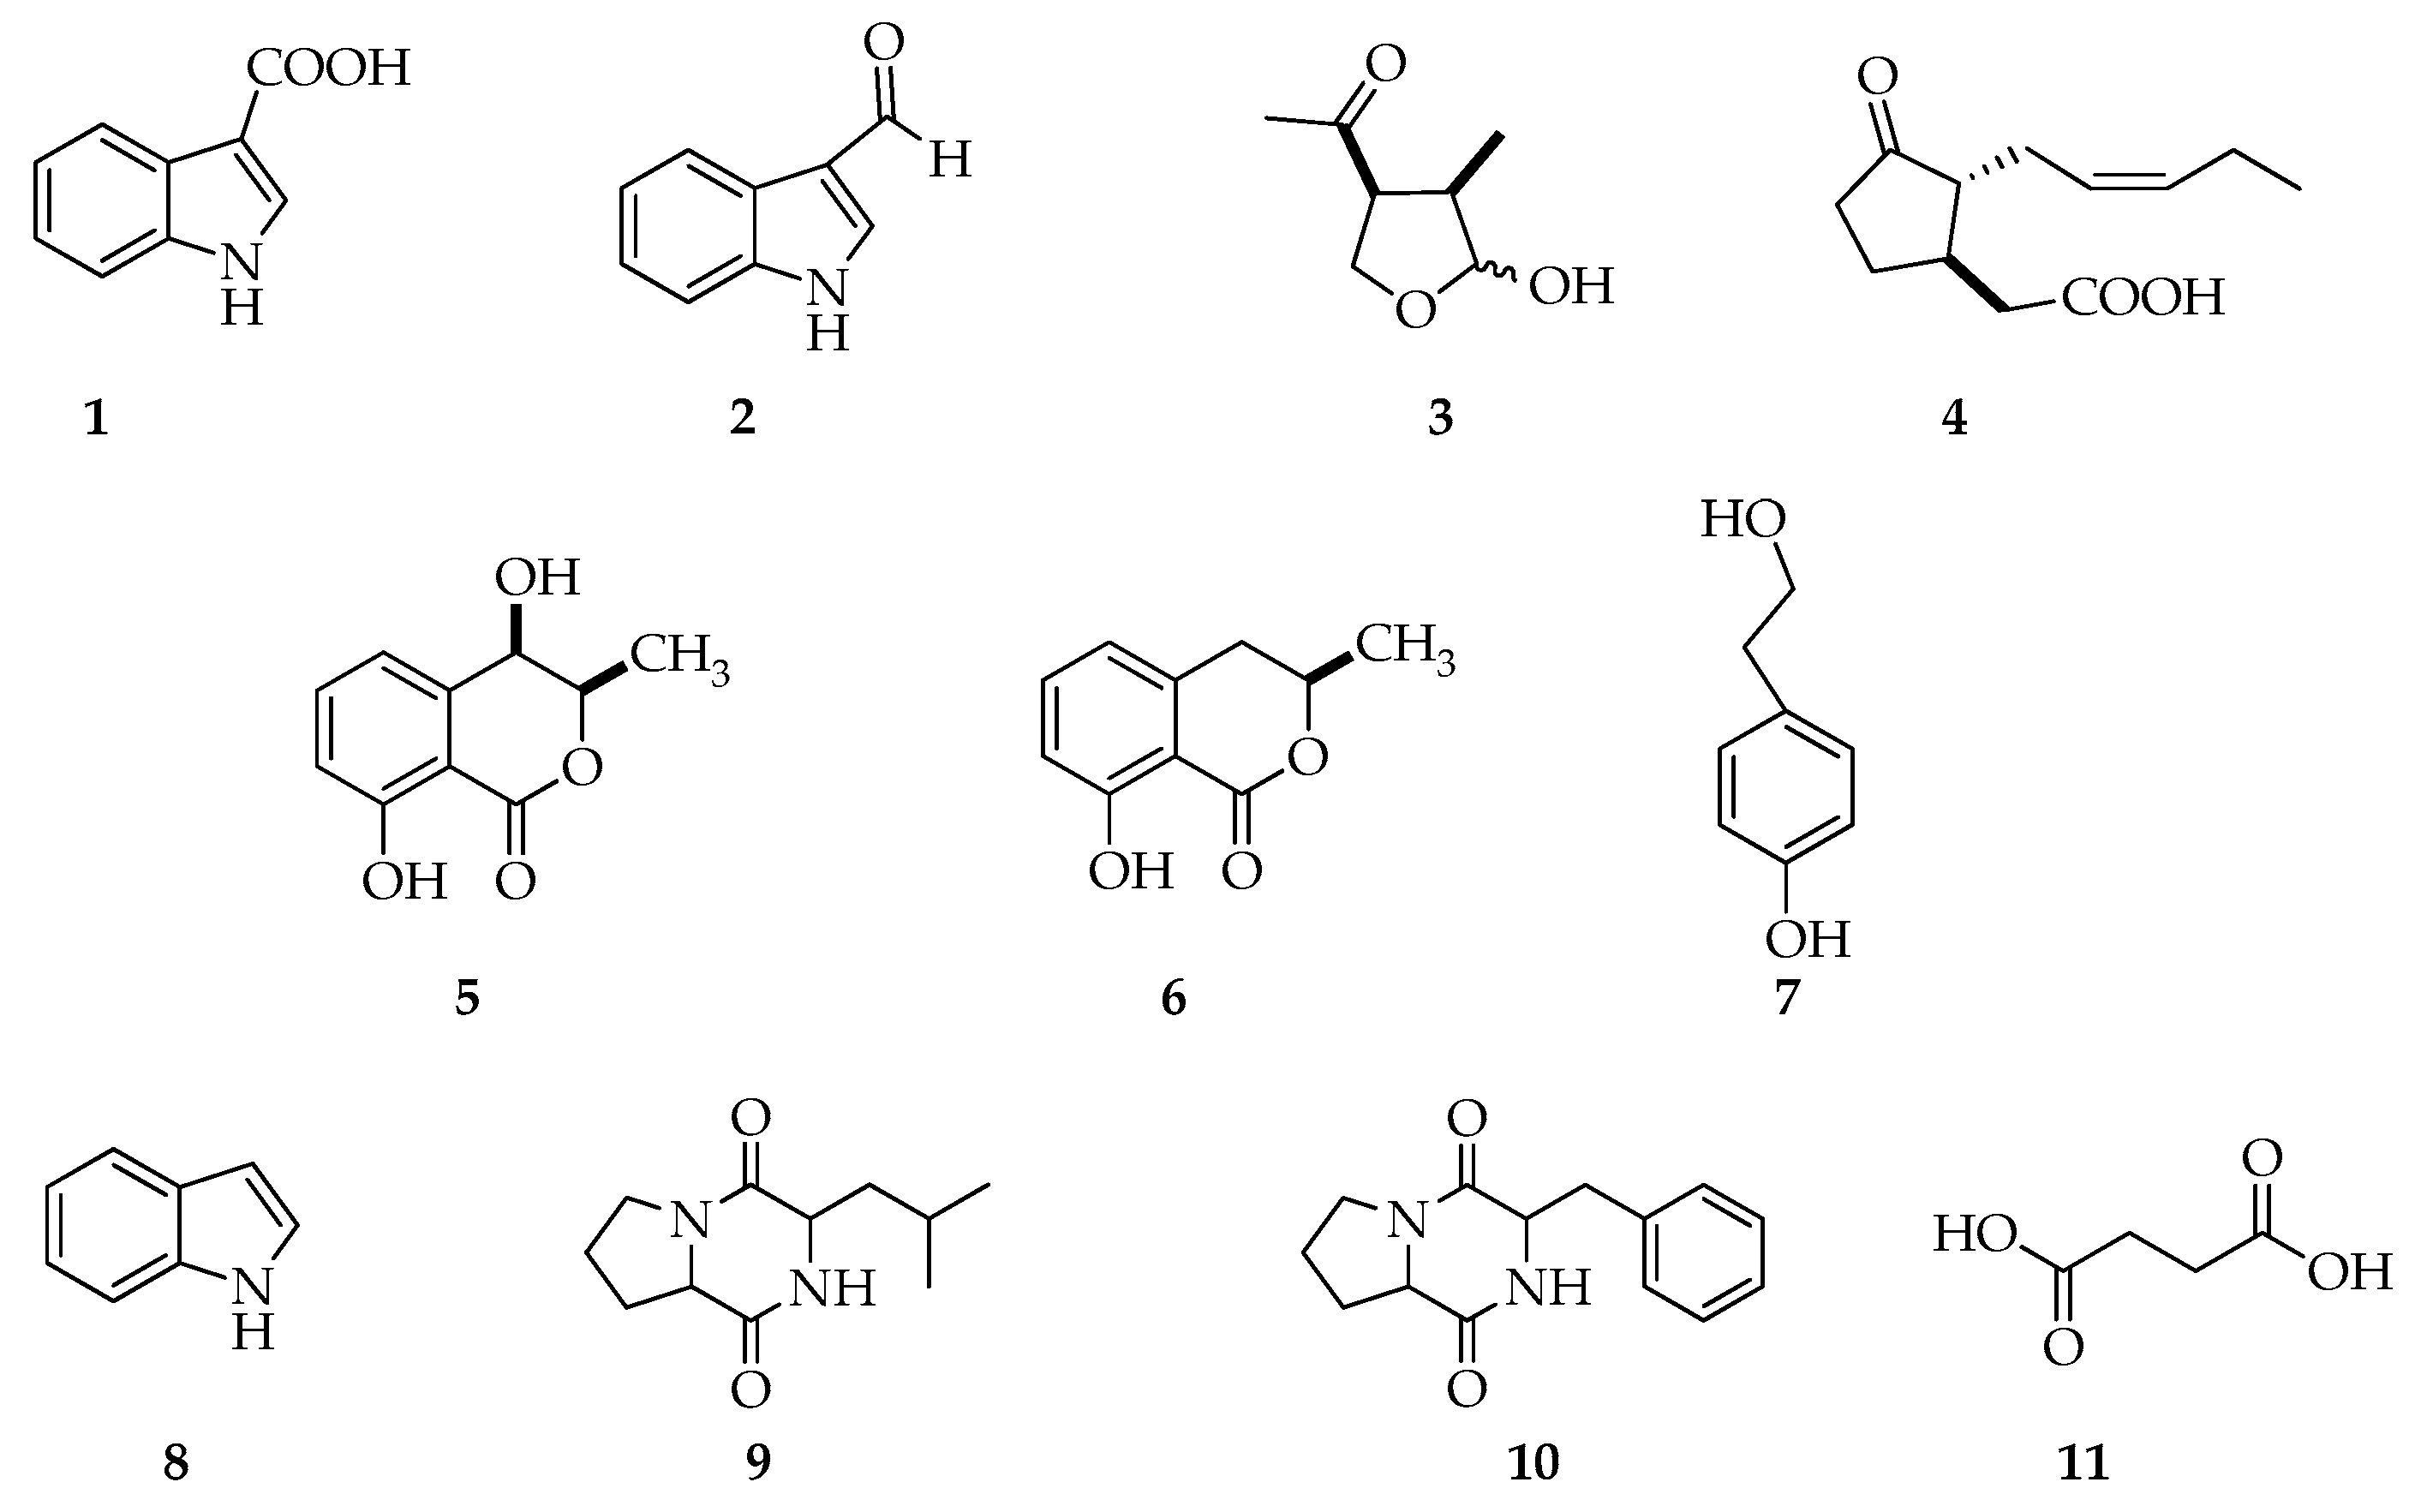
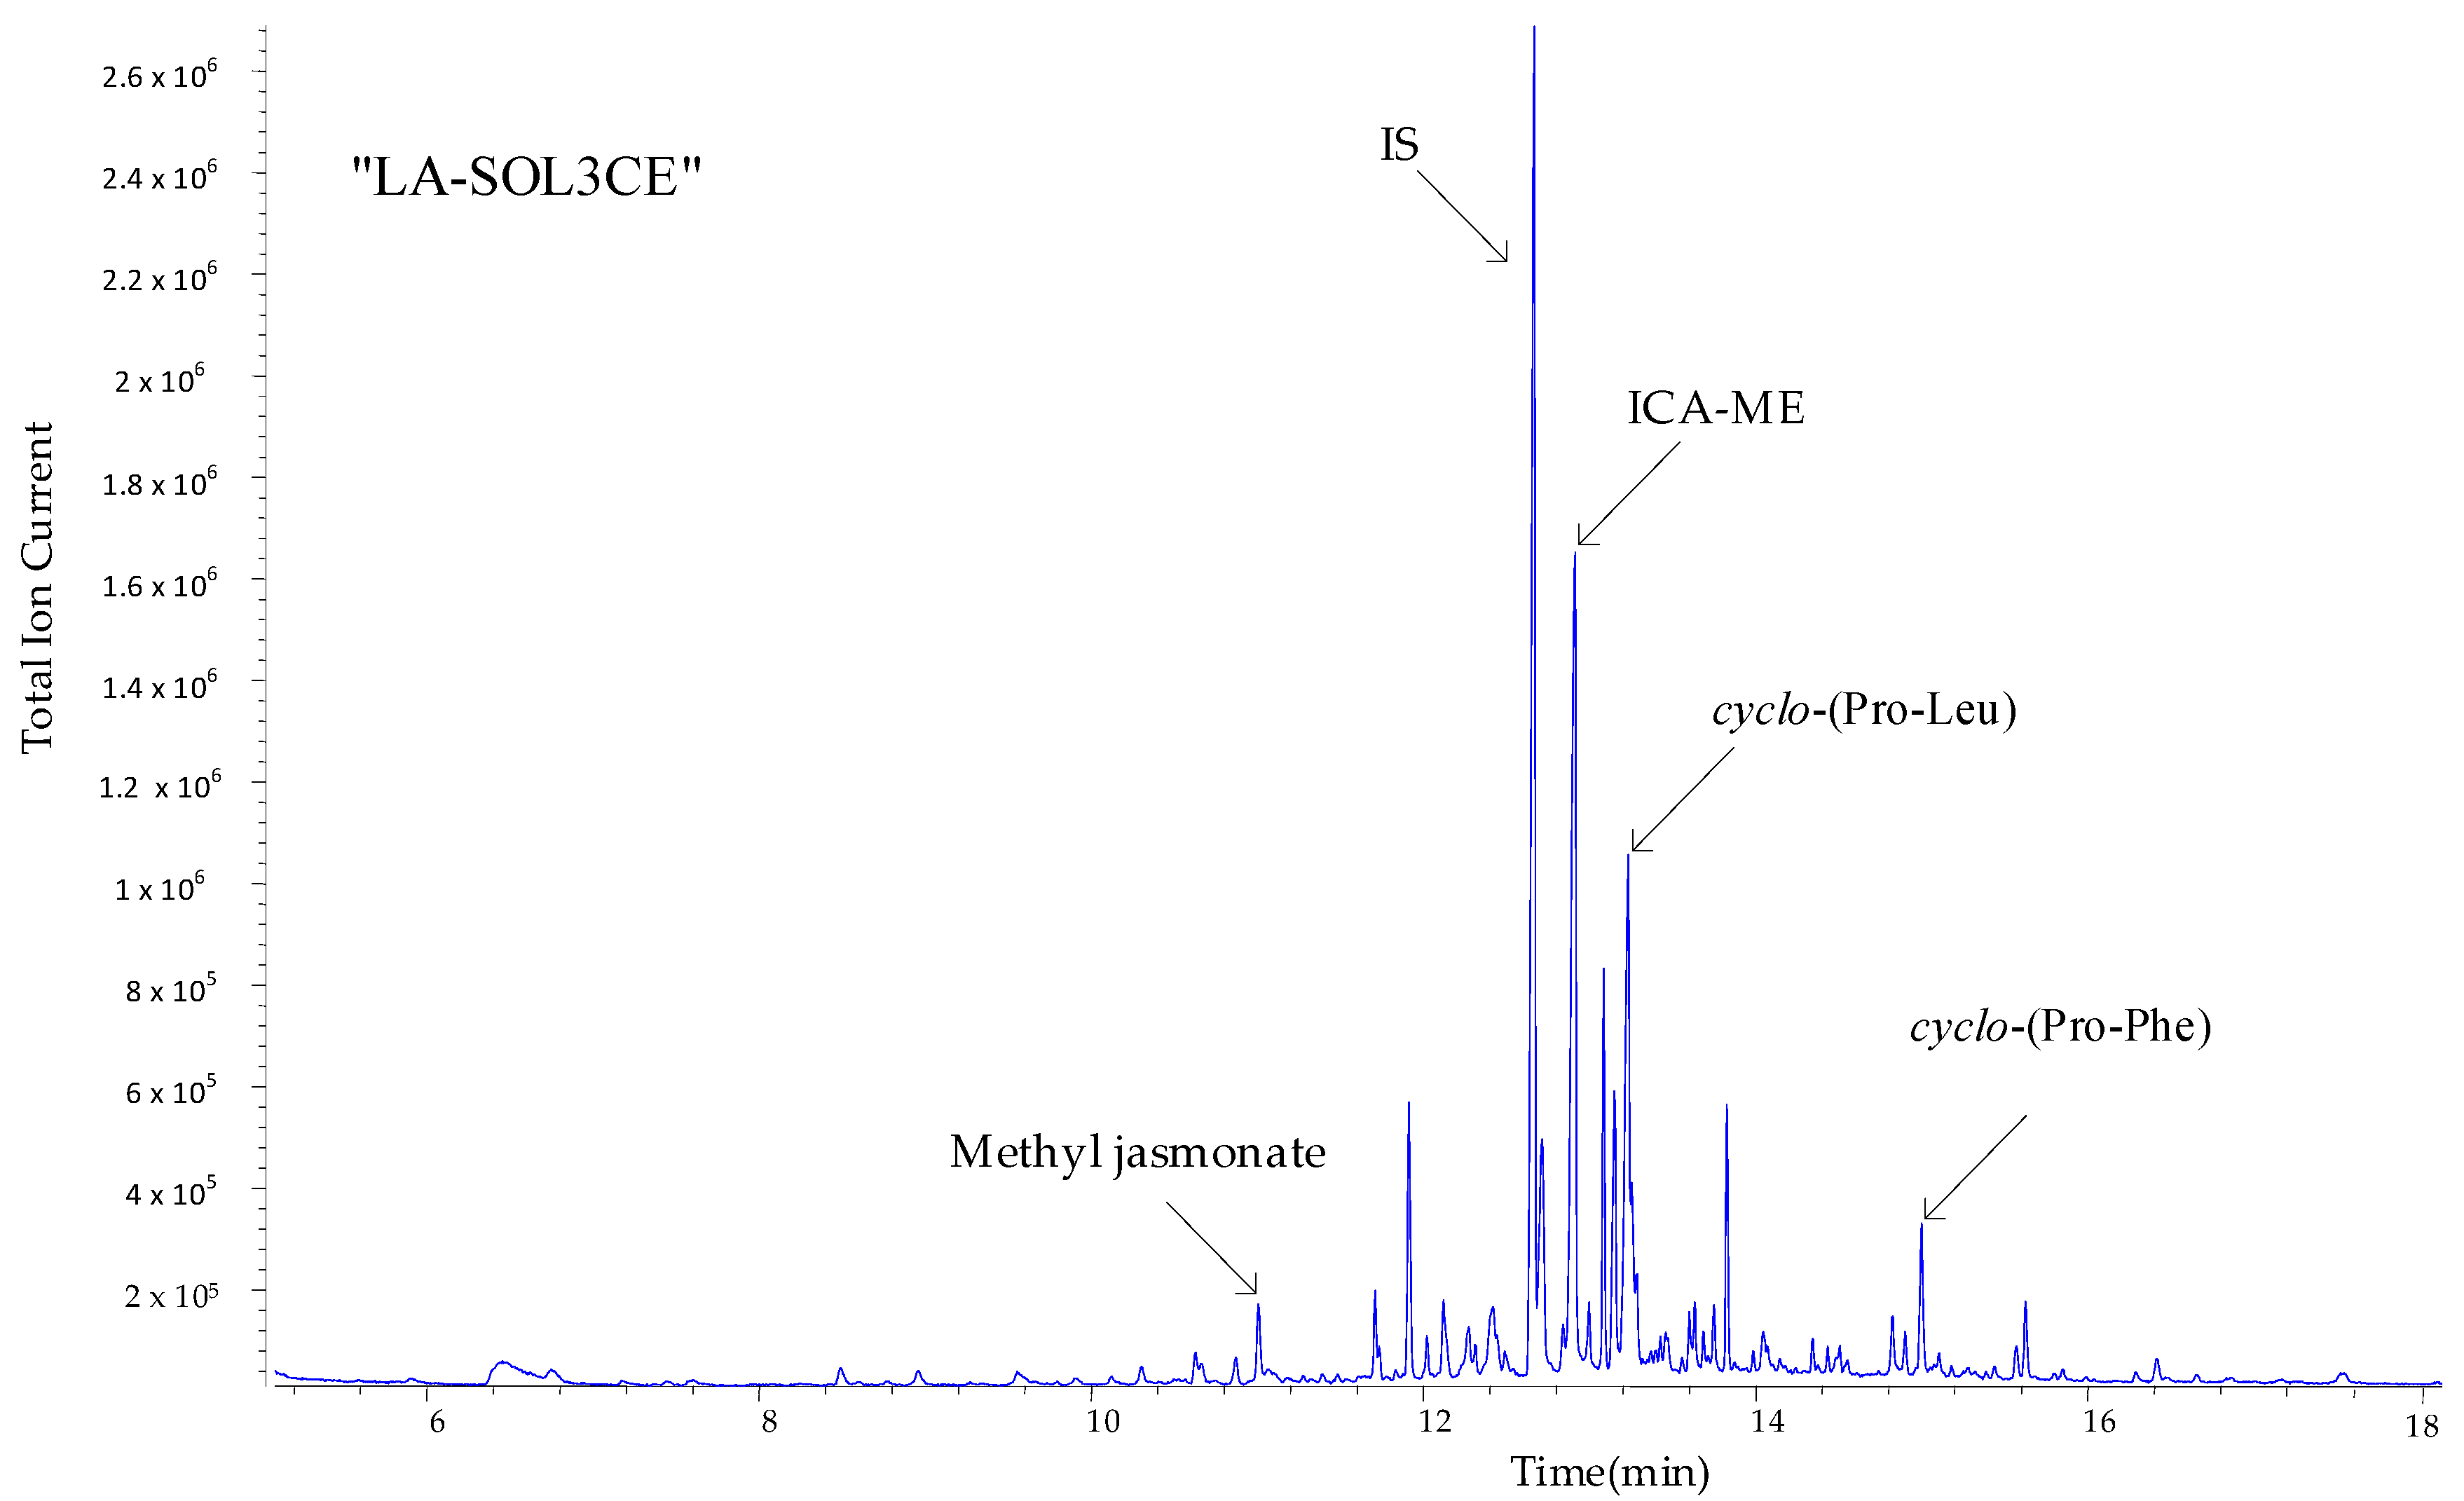
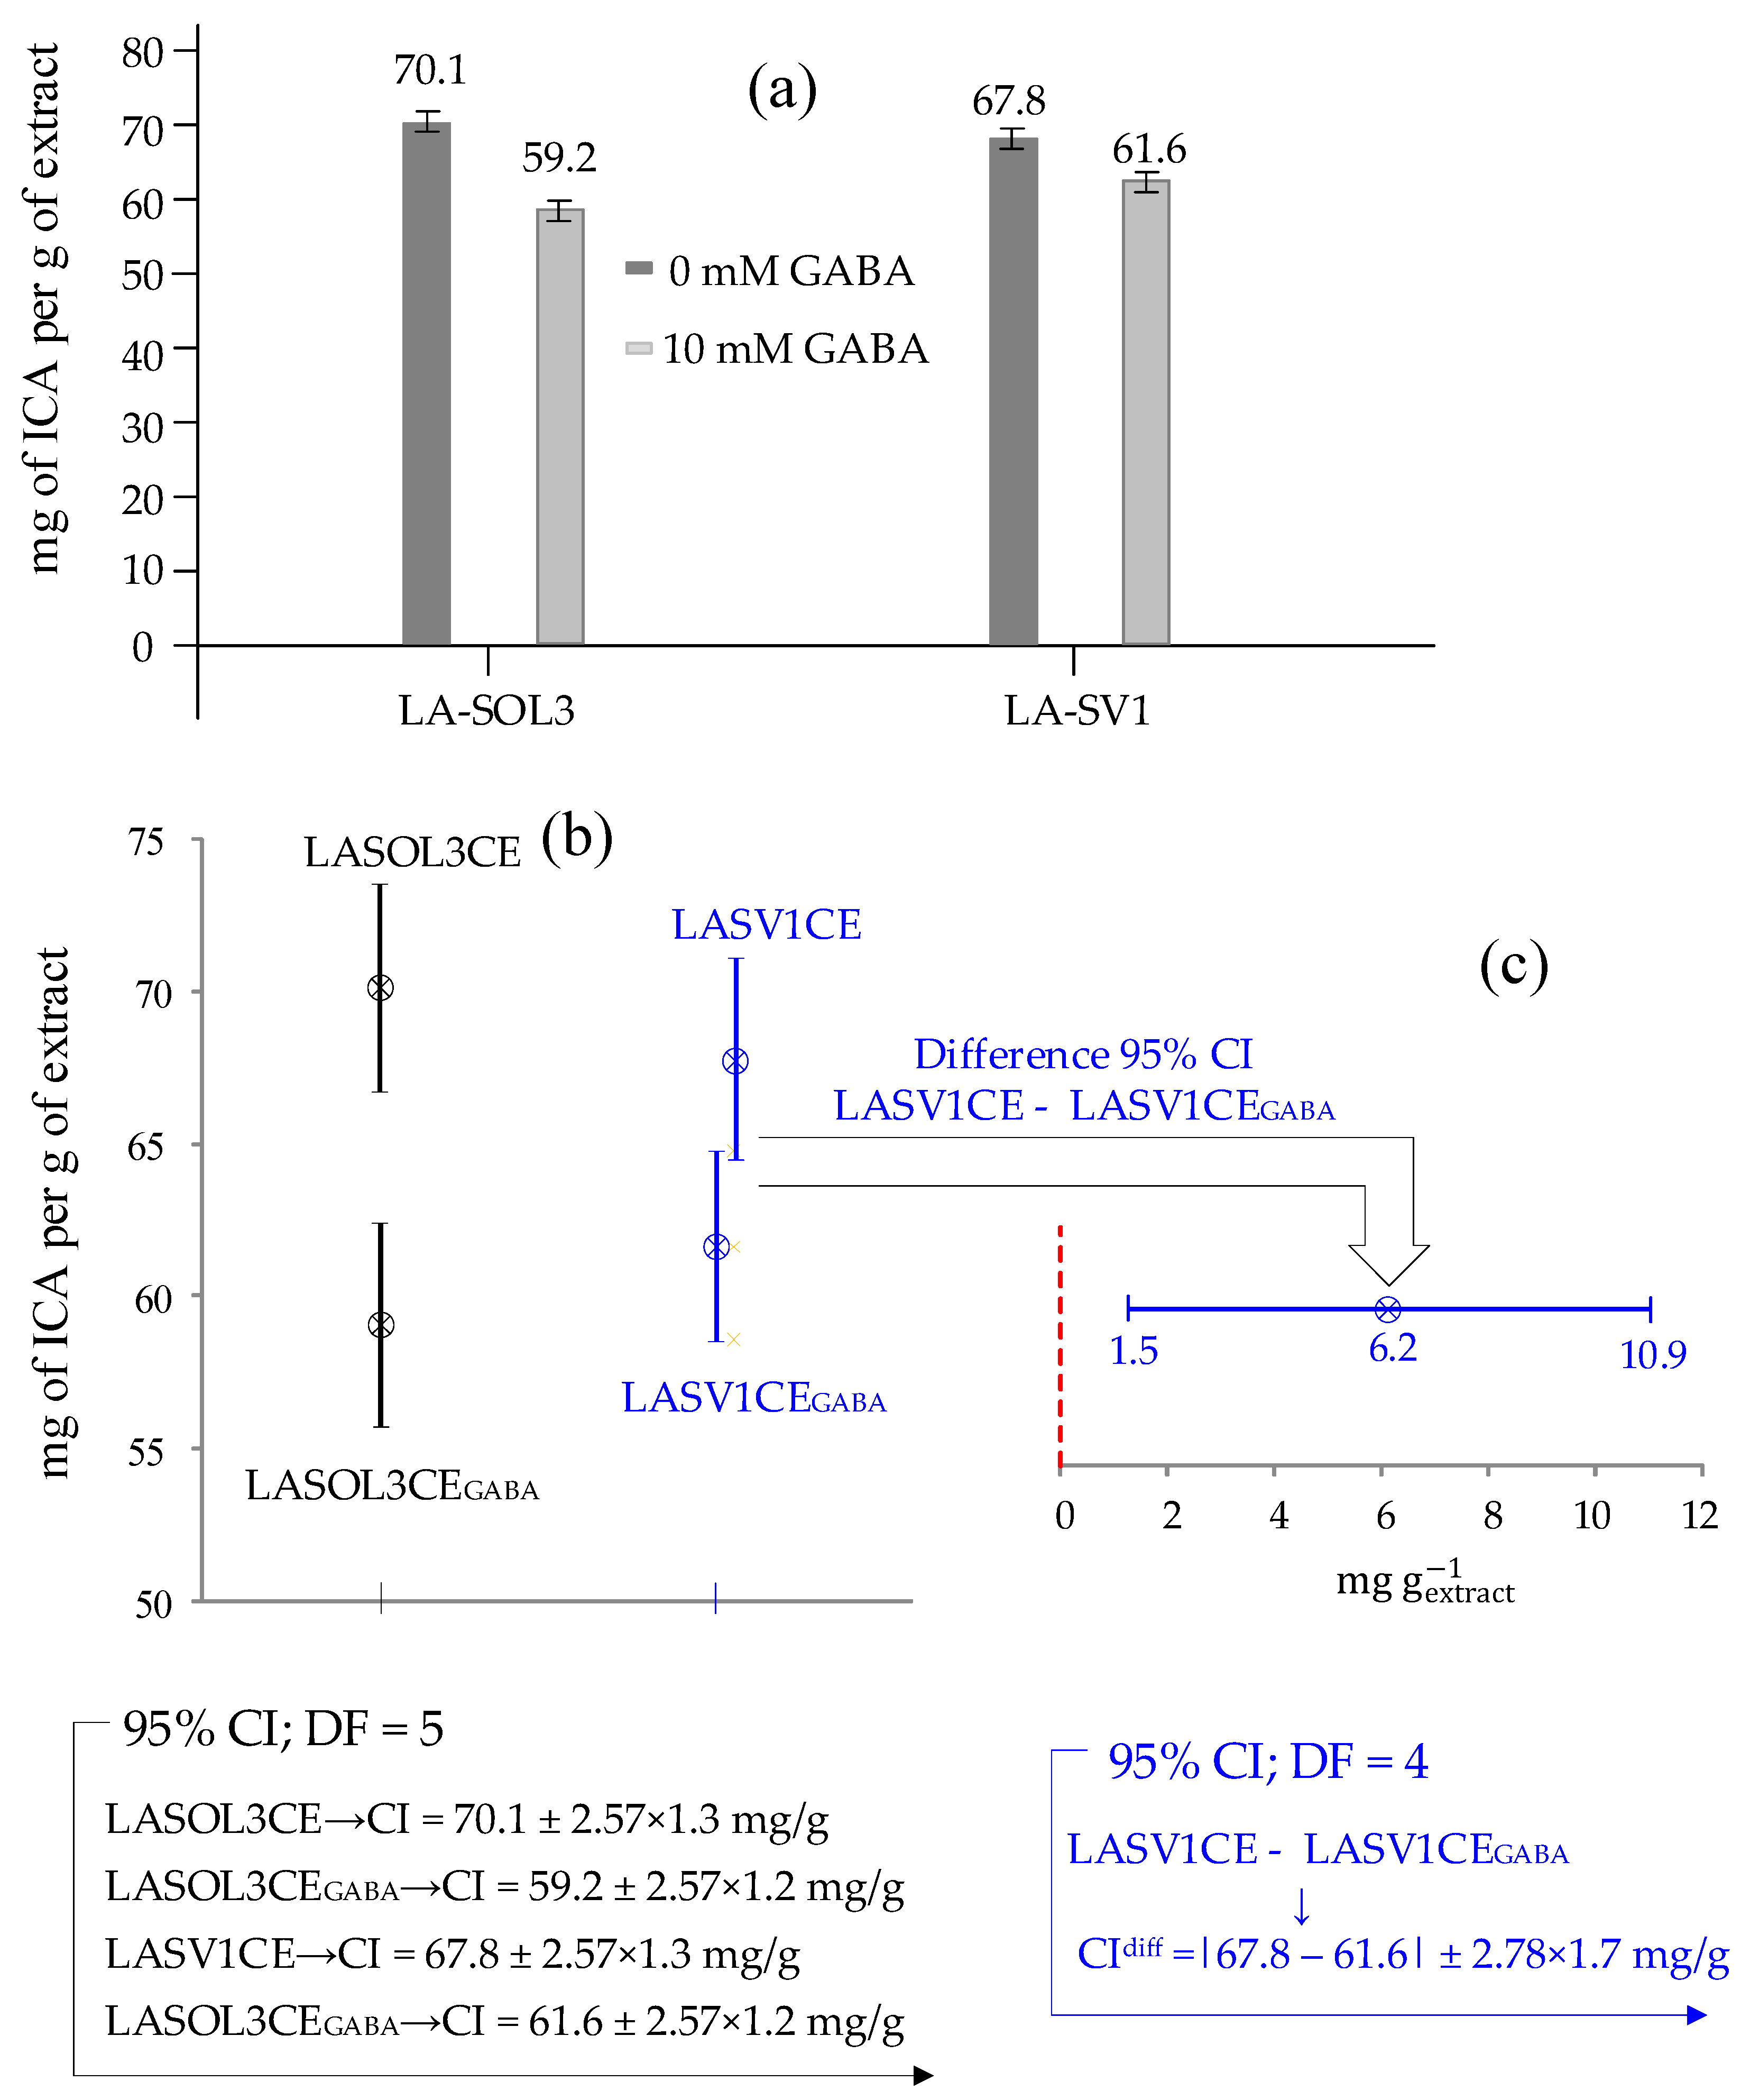
2.4. Metabolites Identification and Quantification of ICA via GC-MS
3. Discussion
4. Conclusions
5. Materials and Methods
5.1. General Experimental Procedures
5.2. Fungal Strains and Growth Conditions
5.3. Biomass
5.4. Extraction and Purification of Fungal Metabolites
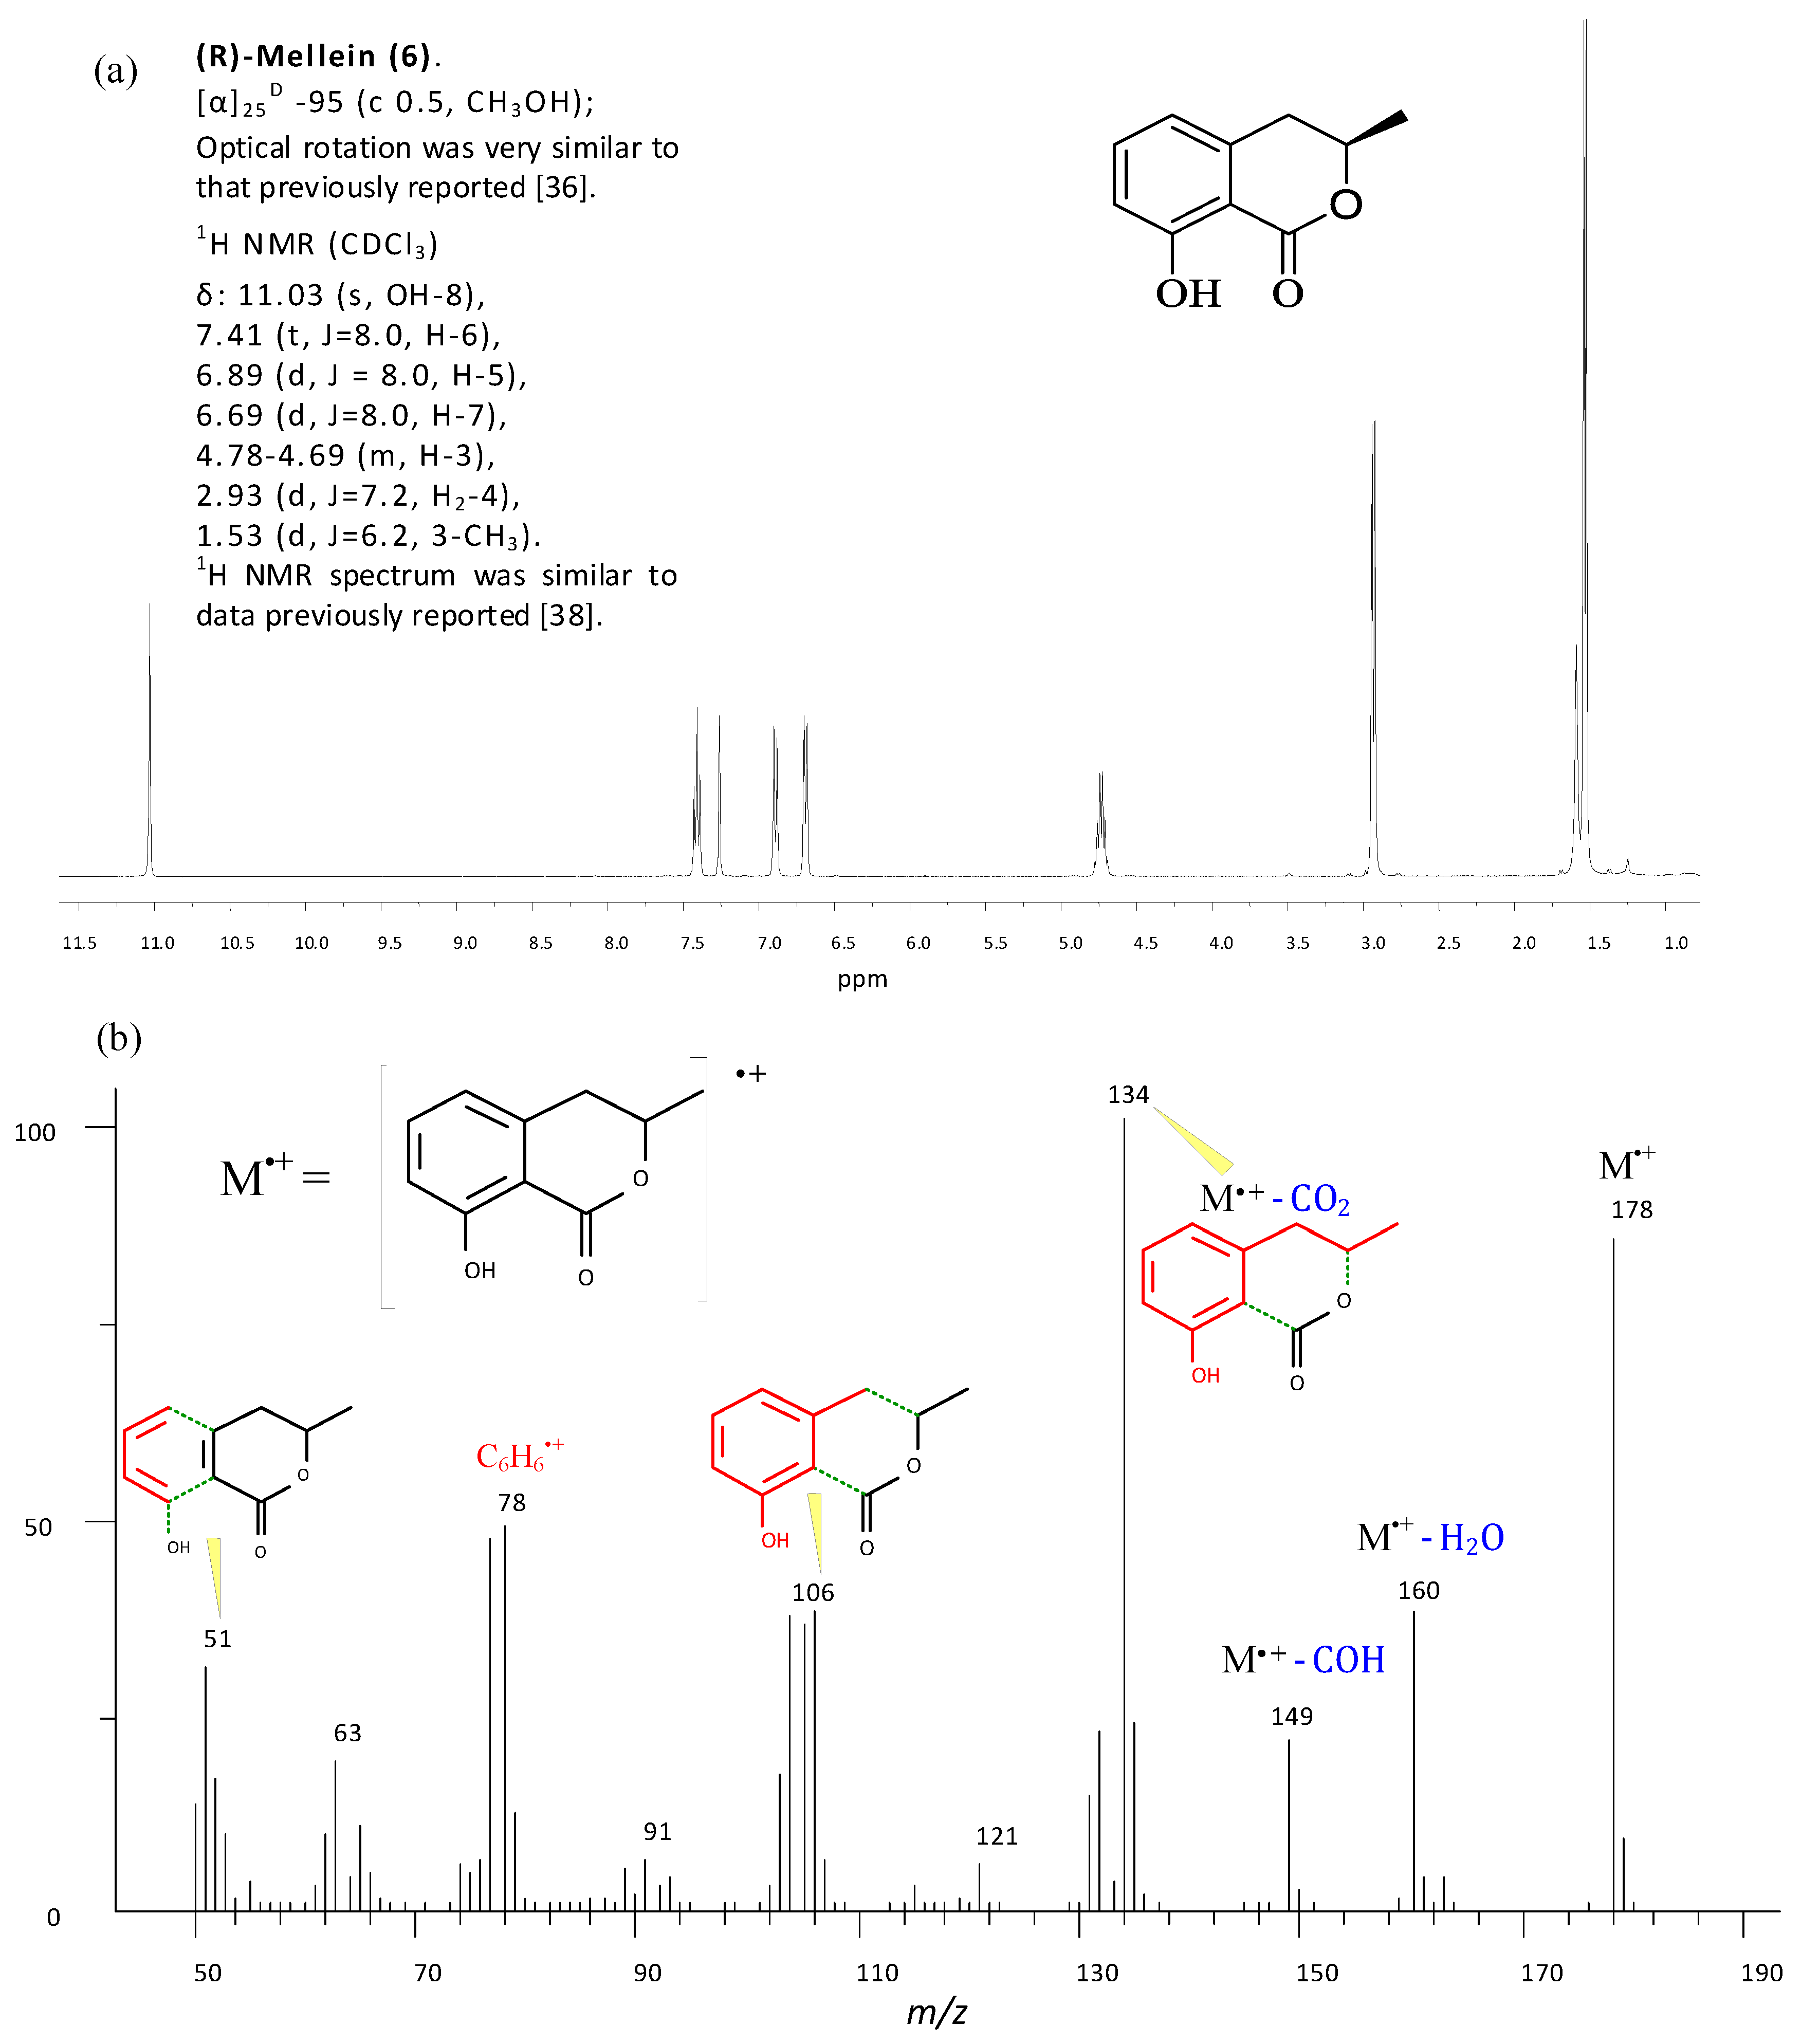
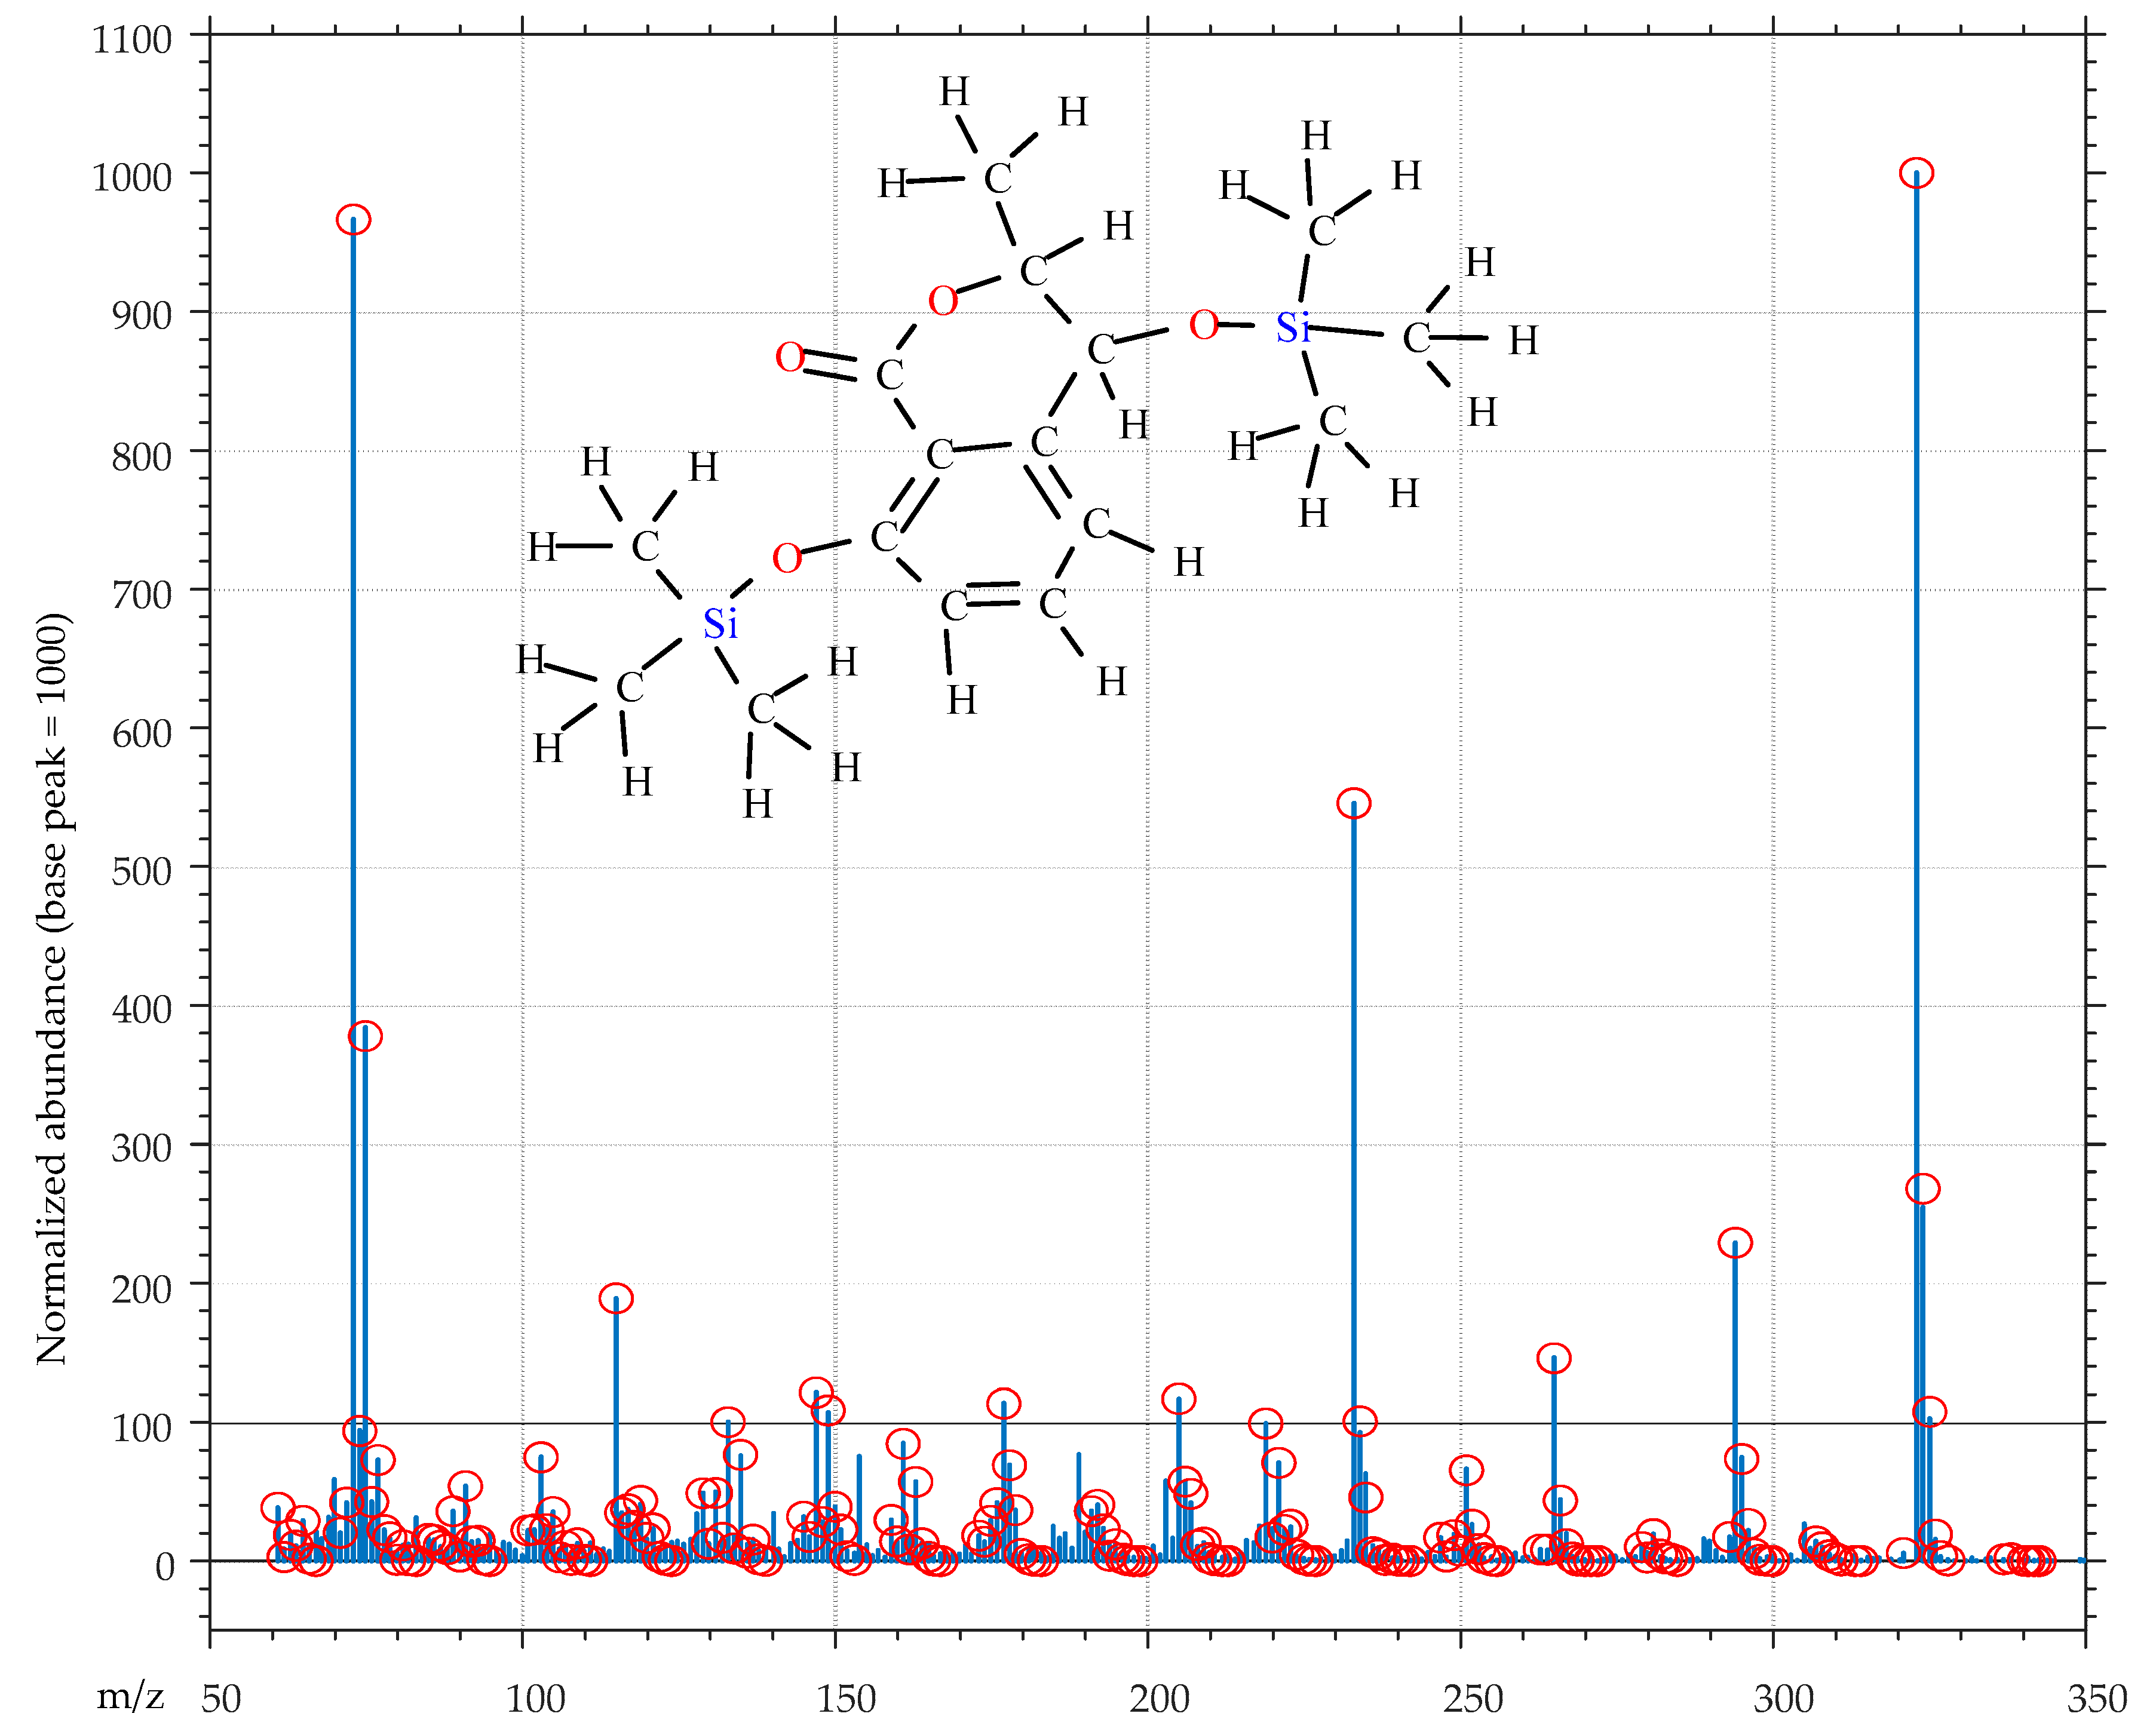
5.5. Metabolites Identification
5.6. Quantification of Indole-3-Carboxylic Acid (ICA)
5.7. Phytotoxicity Assay
5.8. Cytotoxicity Assay on Mammalian Cell Lines
5.9. Statistical Analysis
Supplementary Materials
Author Contributions
Funding
Conflicts of Interest
References
- Pusztahelyi, T.; Holb, I.J.; Pócsi, I. Secondary metabolites in fungus-plant interactions. Front. Plant Sci. 2015, 6, 573. [Google Scholar] [CrossRef] [Green Version]
- Chambergo, F.S.; Valencia, E.Y. Fungal biodiversity to biotechnology. Appl. Microbiol. Biotechnol. 2016, 100, 2567–2577. [Google Scholar] [CrossRef]
- Meyer, V.; Andersen, M.R.; Brakhage, A.A.; Braus, G.H.; Caddick, M.X.; Cairns, T.C.; de Vries, R.P.; Haarmann, T.; Hansen, K.; Hertz-Fowler, C.; et al. Current challenges of research on filamentous fungi in relation to human welfare and a sustainable bio-economy: A white paper. Fungal Biol. Biotechnol. 2016, 3, 6. [Google Scholar] [CrossRef] [PubMed] [Green Version]
- Keller, N.P.; Turner, G.; Bennett, J.W. Fungal secondary metabolism—From biochemistry to genomics. Nat. Rev. Microbiol. 2005, 3, 937. [Google Scholar] [CrossRef] [PubMed]
- Félix, C.; Meneses, R.; Gonçalves, M.F.; Tilleman, L.; Duarte, A.S.; Jorrín-Novo, J.V.; Van de Peer, Y.; Deforce, D.; Van Nieuwerburgh, F.; Estevese, A.C.; et al. A multi-omics analysis of the grapevine pathogen Lasiodiplodia theobromae reveals that temperature affects the expression of virulence-and pathogenicity-related genes. Sci. Rep. 2019, 9, 1–12. [Google Scholar] [CrossRef] [PubMed] [Green Version]
- Salvatore, M.M.; Alves, A.; Andolfi, A. Secondary metabolites of Lasiodiplodia theobromae: Distribution, chemical diversity, bioactivity, and implications of their occurrence. Toxins 2020, 12, 457. [Google Scholar] [CrossRef]
- Félix, C.; Salvatore, M.M.; DellaGreca, M.; Meneses, R.; Duarte, A.S.; Salvatore, F.; Naviglio, D.; Gallo, M.; Jorríno-Novo, J.V.; Alves, A.; et al. Production of toxic metabolites by two strains of Lasiodiplodia theobromae, isolated from a coconut tree and a human patient. Mycologia 2018, 110, 642–653. [Google Scholar] [CrossRef] [PubMed]
- Félix, C.; Salvatore, M.M.; DellaGreca, M.; Ferreira, V.; Duarte, A.S.; Salvatore, F.; Naviglio, D.; Gallo, M.; Alves, A.; Esteves, A.C.; et al. Secondary metabolites produced by grapevine strains of Lasiodiplodia theobromae grown at two different temperatures. Mycologia 2019, 111, 466–476. [Google Scholar] [CrossRef]
- Salvatore, M.M.; Félix, C.; Lima, F.; Ferreira, V.; Naviglio, D.; Salvatore, F.; Duarte, A.S.; Alves, A.; Andolfi, A.; Esteves, A.C. Secondary metabolites produced by Macrophomina phaseolina isolated from Eucalyptus globulus. Agriculture 2020, 10, 72. [Google Scholar] [CrossRef] [Green Version]
- Roberts, M.R. Does GABA act as a signal in plants? Hints from molecular studies. Plant Signal. Behav. 2007, 2, 408–409. [Google Scholar] [CrossRef] [Green Version]
- Kinnersley, A.M.; Turano, F.J. Gamma aminobutyric acid (GABA) and plant responses to stress. Crit. Rev. Plant Sci. 2000, 19, 479–509. [Google Scholar] [CrossRef]
- Solomon, P.S.; Oliver, R.P. The nitrogen content of the tomato leaf apoplast increases during infection by Cladosporium fulvum. Planta 2001, 213, 241–249. [Google Scholar] [CrossRef] [PubMed]
- Félix, C.; Duarte, A.S.; Vitorino, R.; Guerreiro, A.C.; Domingues, P.; Correia, A.C.M.; Alves, A.; Esteves, A.C. Temperature modulates the secretome of the phytopathogenic fungus Lasiodiplodia theobromae. Front. Plant Sci. 2016, 7, 1096. [Google Scholar] [CrossRef] [PubMed]
- Bergeret, M.; Khrestchatisky, M.; Temblay, E.; Bernard, A.; Gregoire, A.; Chany, C. GABA modulates cytotoxicity of immunocompetent cells expressing GABAA receptor subunits. Biomed. Pharmacother. 1998, 52, 214–219. [Google Scholar] [CrossRef]
- Wang, S.; Du, L.; Peng, G.; Li, W. GABA inhibits proliferation and self-renewal of mouse retinal progenitor cell. Cell Death Discov. 2019, 5, 80. [Google Scholar] [CrossRef]
- Salvatore, M.M.; Nicoletti, R.; Salvatore, F.; Naviglio, D.; Andolfi, A. GC–MS approaches for the screening of metabolites produced by marine-derived Aspergillus. Mar. Chem. 2018, 206, 19–33. [Google Scholar] [CrossRef]
- Crous, P.W.; Slippers, B.; Wingfield, M.J.; Rheeder, J.; Marasas, W.F.; Philips, A.J.; Alves, A.; Burgess, T.; Barber, T.; Groenewald, J.Z. Phylogenetic lineages in the Botryosphaeriaceae. Stud. Mycol. 2006, 55, 235–253. [Google Scholar] [CrossRef] [Green Version]
- Dissanayake, A.J.; Phillips, A.J.; Li, X.H.; Hyde, K.D. Botryosphaeriaceae: Current status of genera and species. Mycosphere 2016, 7, 1001–1073. [Google Scholar] [CrossRef]
- Slippers, B.; Wingfield, M.J. Botryosphaeriaceae as endophytes and latent pathogens of woody plants: Diversity, ecology and impact. Fungal Biol. Rev. 2007, 21, 90–106. [Google Scholar] [CrossRef]
- Papacostas, L.J.; Henderson, A.; Choong, K.; Sowden, D. An unusual skin lesion caused by Lasiodiplodia theobromae. Med. Mycol. Case Rep. 2015, 8, 44–46. [Google Scholar] [CrossRef]
- Lekhanont, K.; Nonpassopon, M.; Nimvorapun, N.; Santanirand, P. Treatment with intrastromal and intracameral voriconazole in 2 eyes with Lasiodiplodia theobromae keratitis. Medicine 2015, 94. [Google Scholar] [CrossRef] [PubMed]
- Mohan, M.; Shalin, S.C.; Kothari, A.; Rico, J.C.C.; Caradine, K.; Burgess, M. Lasiodiplodia species fungal osteomyelitis in a multiple myeloma patient. Transpl. Infect. Dis. 2016, 18, 761–764. [Google Scholar] [CrossRef] [PubMed]
- Castillo, G.; Torrecillas, A.; Nogueiras, C.; Michelena, G.; Sánchez-Bravo, J.; Acosta, M. Simultaneous quantification of phytohormones in fermentation extracts of Botryodiplodia theobromae by liquid chromatography–electrospray tandem mass spectrometry. World J. Microbiol. Biotechnol. 2014, 30, 1937–1946. [Google Scholar] [CrossRef] [PubMed]
- Nicoletti, R.; Fiorentino, A. Plant bioactive metabolites and drugs produced by endophytic fungi of Spermatophyta. Agriculture 2015, 5, 918–970. [Google Scholar] [CrossRef] [Green Version]
- Stahl, E.; Bellwon, P.; Huber, S.; Schlaeppi, K.; Bernsdorff, F.; Vallat-Michel, A.; Mauch, F.; Zeier, J. Regulatory and functional aspects of indolic metabolism in plant systemic acquired resistance. Mol. Plant. 2016, 9, 662–681. [Google Scholar] [CrossRef] [Green Version]
- Park, S.W.; Kaimoyo, E.; Kumar, D.; Mosher, S.; Klessig, D.F. Methyl salicylate is a critical mobile signal for plant systemic acquired resistance. Science 2007, 318, 113–116. [Google Scholar] [CrossRef]
- Zottini, M.; Costa, A.; De Michele, R.; Ruzzene, M.; Carimi, F.; Lo Schiavo, F. Salicylic acid activates nitric oxide synthesis in Arabidopsis. J. Exp. Bot. 2007, 58, 1397–1405. [Google Scholar] [CrossRef] [Green Version]
- Wilms, I.; Voss, B.; Hess, W.R.; Leichert, L.I.; Narberhaus, F. Small RNA-mediated control of the Agrobacterium tumefaciens GABA binding protein. Mol. Microbiol. 2011, 80, 492–506. [Google Scholar] [CrossRef]
- Kathiresan, A.; Tung, P.; Chinnappa, C.C.; Reid, D.M. γ-Aminobutyric acid stimulates ethylene biosynthesis in sunfIower. Plant Physiol. 1997, 115, 129–135. [Google Scholar] [CrossRef] [Green Version]
- Yuan, Z.-C.; Haudecouer, E.; Faure, D.; Kerr, K.F.; Nester, E.W. Comparative transcriptome analysis of Agrobacterium tumefaciens in response to plant signal salicylic acid, indole-3-acetic acid and γ-amino butyric acid reveals signalling cross-talk and agrobacterium–Plant co-evolution. Cell Microbiol. 2008, 10, 2339–2354. [Google Scholar] [CrossRef]
- Rodriguez-Galvez, E.; Maldonado, E.; Alves, A. Identification and pathogenicity of Lasiodiplodia theobromae causing dieback of table grapes in Peru. Eur. J. Plant Pathol. 2015, 141, 477–489. [Google Scholar] [CrossRef]
- Guida, M.; Salvatore, M.M.; Salvatore, F. A Strategy for GC/MS quantification of polar compounds via their silylated surrogates: Silylation and quantification of biological amino acids. J. Anal. Bioanal. Tech. 2015, 6, 263–279. [Google Scholar]
- Andolfi, A.; Maddau, L.; Linaldeddu, B.T.; Scanu, B.; Cimmino, A.; Basso, S.; Evidente, A. Bioactivity studies of oxysporone and several derivatives. Phytochem. Lett. 2014, 10, 40–45. [Google Scholar] [CrossRef]
- NIST Standard Reference Data. Available online: http://www.nist.gov/srd/nist1a.cfm (accessed on 5 July 2020).
- MathWorks. Available online: https://www.mathworks.com/ (accessed on 5 July 2020).
- AMDIS NET. Available online: http://www.amdis.net/ (accessed on 5 July 2020).
- Ramezani, M.; Shier, W.T.; Abbas, H.K.; Tonos, J.L.; Baird, R.E.; Sciumbato, G.L. Soybean charcoal rot disease fungus Macrophomina phaseolina in Mississippi produces the phytotoxin (−)-botryodiplodin but no detectable phaseolinone. J. Nat. Prod. 2007, 70, 128–129. [Google Scholar] [CrossRef]
- Cabras, A.; Mannoni, M.A.; Serra, S.; Andolfi, A.; Fiore, M.; Evidente, A. Occurrence, isolation and biological activity of phytotoxic metabolites produced in vitro by Sphaeropsis sapinea, pathogenic fungus of Pinus radiata. Eur. J. Plant Pathol. 2006, 115, 187–193. [Google Scholar] [CrossRef]
- Aldridge, D.C.; Galt, S.; Giles, D.; Turner, W.B. 1971. Metabolites of Lasiodiplodia theobromae. J. Chem. Soc. 1971, 1623–1627. [Google Scholar]
- Dimitriadis, C.; Gill, M.; Harte, M.F. The first stereospecific approach to both enantiomers of mellein. Tetrahedron Asymmetry 1997, 8, 2153–2158. [Google Scholar] [CrossRef]
- Miller, J.; Miller, J.C. Statistics and Chemometrics for Analytical Chemistry, 4th ed.; Pearson Education Limited: Harlow, UK, 2018; p. 312. [Google Scholar]
- Lavagnini, I.; Magno, F. A statistical overview on univariate calibration, inverse regression, and detection limits: Application to gas chromatography/mass spectrometry technique. Mass Spectrom. Rev. 2007, 26, 1–18. [Google Scholar] [CrossRef]
- Salvatore, M.M.; Elvetico, A.; Gallo, M.; Salvatore, F.; DellaGreca, M.; Naviglio, D.; Andolfi, A. Fatty acids from Ganoderma lucidum spores: Extraction, identification and quantification. Appl. Sci. 2020, 10, 3907. [Google Scholar] [CrossRef]
- Duarte, A.S.; Cavaleiro, E.; Pereira, C.; Merino, S.; Esteves, A.C.; Duarte, E.P.; Tomás, J.M.; Correia, A.C. Aeromonas piscicola AH-3 expresses an extracellular collagenase with cytotoxic properties. Lett. Appl. Microbiol. 2015, 60, 288–297. [Google Scholar] [CrossRef]
- Ammerman, N.C.; Beier-Sexton, M.; Azad, A.F. Growth and maintenance of vero cell lines. Curr. Protoc. Microbiol. 2008, S1, A.4E.1–A.4E.7. [Google Scholar] [CrossRef] [PubMed] [Green Version]
Sample Availability: Samples of the compounds 1,3,5,6 are available from the authors. |


| Culture Filtrate | Dilution (v/v) | Symptoms Level (Mean + SD) | Phytotoxic Activity (%) |
|---|---|---|---|
| Control (PDB) | - | 0.7 ± 0.58 | 16.7 |
| Control (H2O) | - | 0 | 0.0 |
| Control (10 mM GABA) | - | 0 | 0.0 |
| LA-SOL3 | 25/100 | 1.0 ± 0.00 ****/- | 25.0 |
| 50/100 | 2.0 ± 0.00 ****/**** | 50.0 | |
| No dilution | 4.0 ± 0.00 ****/**** | 100.0 | |
| LA-SOL3GABA | 25/100 | 1.0 ± 0.00 ****/- | 25.0 |
| 50/100 | 1.0 ± 0.00 ****/- | 25.0 | |
| No dilution | 3.0 ± 0.00 ****/**** | 75.0 | |
| LA-SV1 | 25/100 | 1.0 ± 0.00 ****/- | 25.0 |
| 50/100 | 1.7 ± 0.58 ****/*** | 41.7 | |
| No dilution | 2.7 ± 0.58 ****/**** | 66.7 | |
| LA-SV1GABA | 25/100 | 1.0 ± 0.00 ****/- | 25.0 |
| 50/100 | 1.0 ± 0.00 ****/- | 25.0 | |
| No dilution | 3.0 ± 0.00 ****/**** | 75.0 |
| Code | Name | LA-SOL3 | LA-SV1 | ||
|---|---|---|---|---|---|
| 0 mM GABA | 10 mm GABA | 0 mM GABA | 10 mm GABA | ||
| 2 | 3-Indolecarboxaldehyde | + | + | - | - |
| 3 | (3R,4S)-Botryodiplodin | + | + | - | + |
| 4 | Jasmonic acid | + | + | - | + |
| 5 | (3R,4R)-4-Hydroxymellein | - | + | - | + |
| 6 | (R)-Mellein | + | + | + | + |
| 7 | Tyrosol | - | + | + | - |
| 8 | Indole | - | + | + | + |
| 9 | Cyclo-(Pro-Leu) | + | + | + | + |
| 10 | Cyclo-(Pro-Phe) | + | + | + | + |
| 11 | Succinic acid | + | - | + | + |
| ICA-ME (RI = 1535) | Intercept | Slope | R2 | LOD (mg L−1) | LOQ (mg L−1) | |
| −0.0171 ± 0.0089 | 0.00604 ± 0.00015 | 0.0124 | 0.997 | 4.9 | 14.8 |
© 2020 by the authors. Licensee MDPI, Basel, Switzerland. This article is an open access article distributed under the terms and conditions of the Creative Commons Attribution (CC BY) license (http://creativecommons.org/licenses/by/4.0/).
Share and Cite
Salvatore, M.M.; Félix, C.; Lima, F.; Ferreira, V.; Duarte, A.S.; Salvatore, F.; Alves, A.; Esteves, A.C.; Andolfi, A. Effect of γ-Aminobutyric Acid (GABA) on the Metabolome of Two Strains of Lasiodiplodia theobromae Isolated from Grapevine. Molecules 2020, 25, 3833. https://0-doi-org.brum.beds.ac.uk/10.3390/molecules25173833
Salvatore MM, Félix C, Lima F, Ferreira V, Duarte AS, Salvatore F, Alves A, Esteves AC, Andolfi A. Effect of γ-Aminobutyric Acid (GABA) on the Metabolome of Two Strains of Lasiodiplodia theobromae Isolated from Grapevine. Molecules. 2020; 25(17):3833. https://0-doi-org.brum.beds.ac.uk/10.3390/molecules25173833
Chicago/Turabian StyleSalvatore, Maria Michela, Carina Félix, Fernanda Lima, Vanessa Ferreira, Ana Sofia Duarte, Francesco Salvatore, Artur Alves, Ana Cristina Esteves, and Anna Andolfi. 2020. "Effect of γ-Aminobutyric Acid (GABA) on the Metabolome of Two Strains of Lasiodiplodia theobromae Isolated from Grapevine" Molecules 25, no. 17: 3833. https://0-doi-org.brum.beds.ac.uk/10.3390/molecules25173833