Combination of High Hydrostatic Pressure and Ultrafiltration to Generate a New Emulsifying Ingredient from Egg Yolk

 , ,
, ,
Abstract
:
1. Introduction
2. Materials and Methods
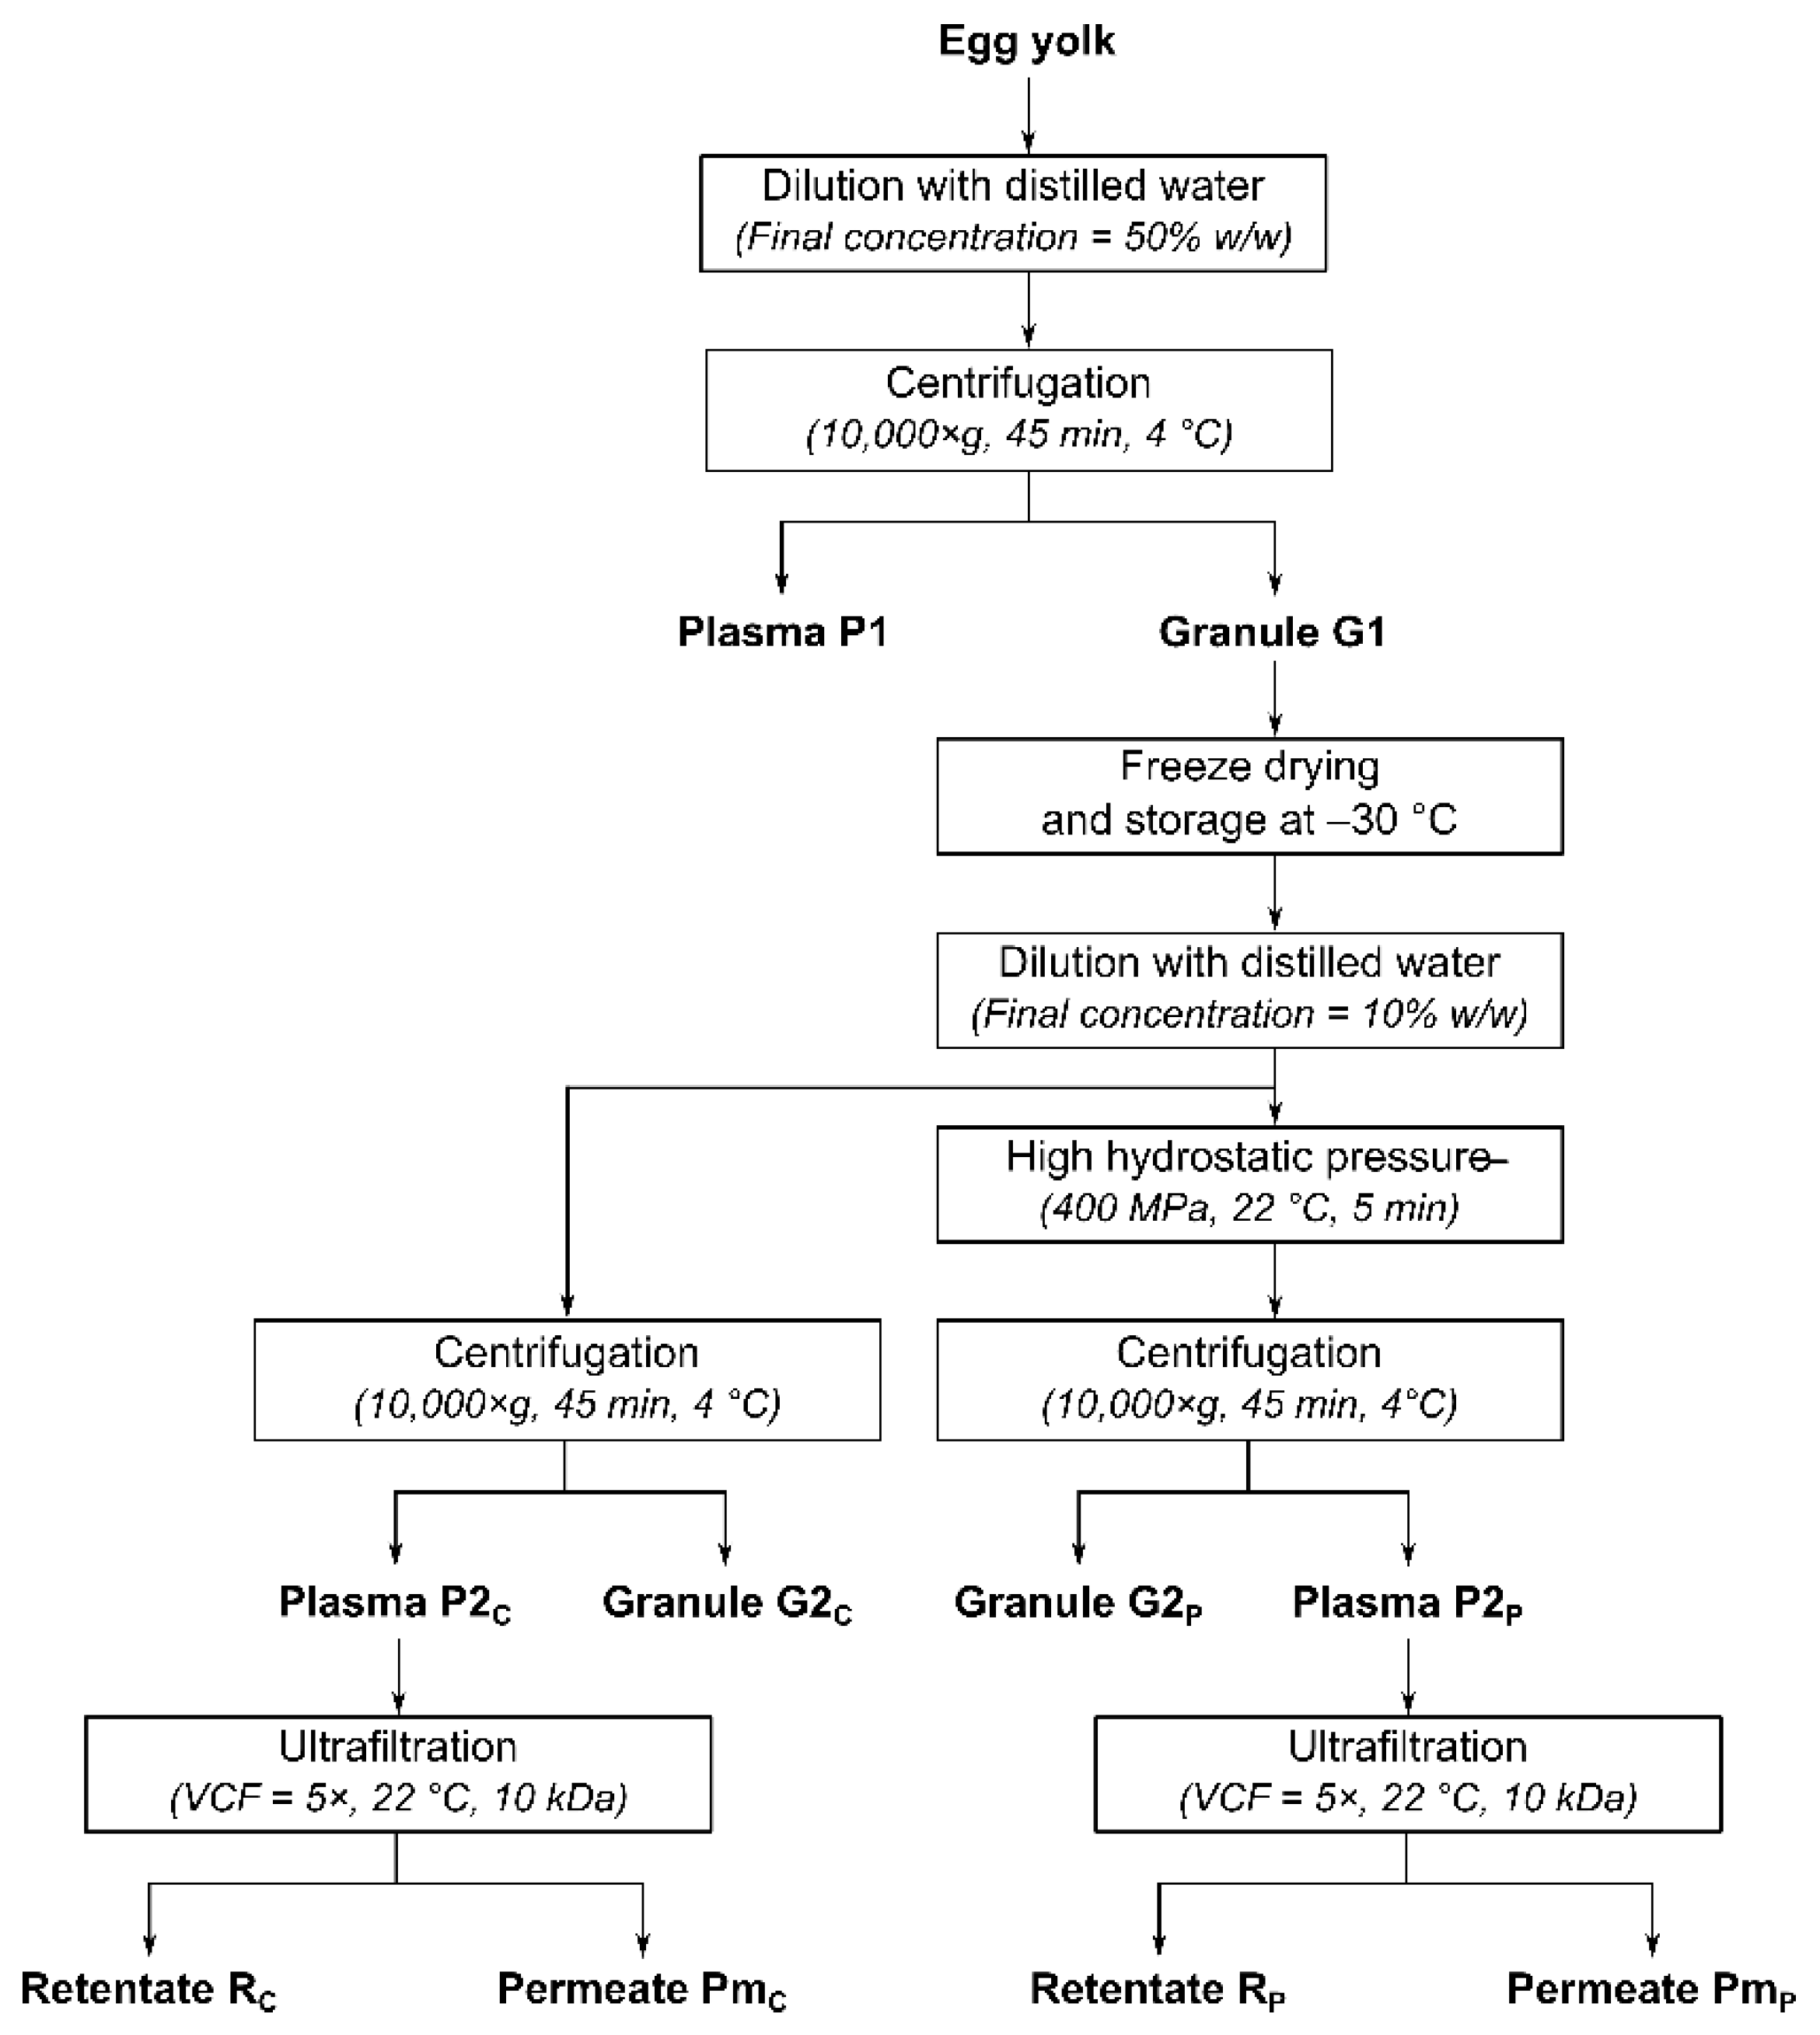
2.1. Granule Preparation
2.2. High Hydrostatic Pressure Treatment
2.3. Ultrafiltration
2.4. Compositional Analysis
2.4.1. Quantification of Phosvitin
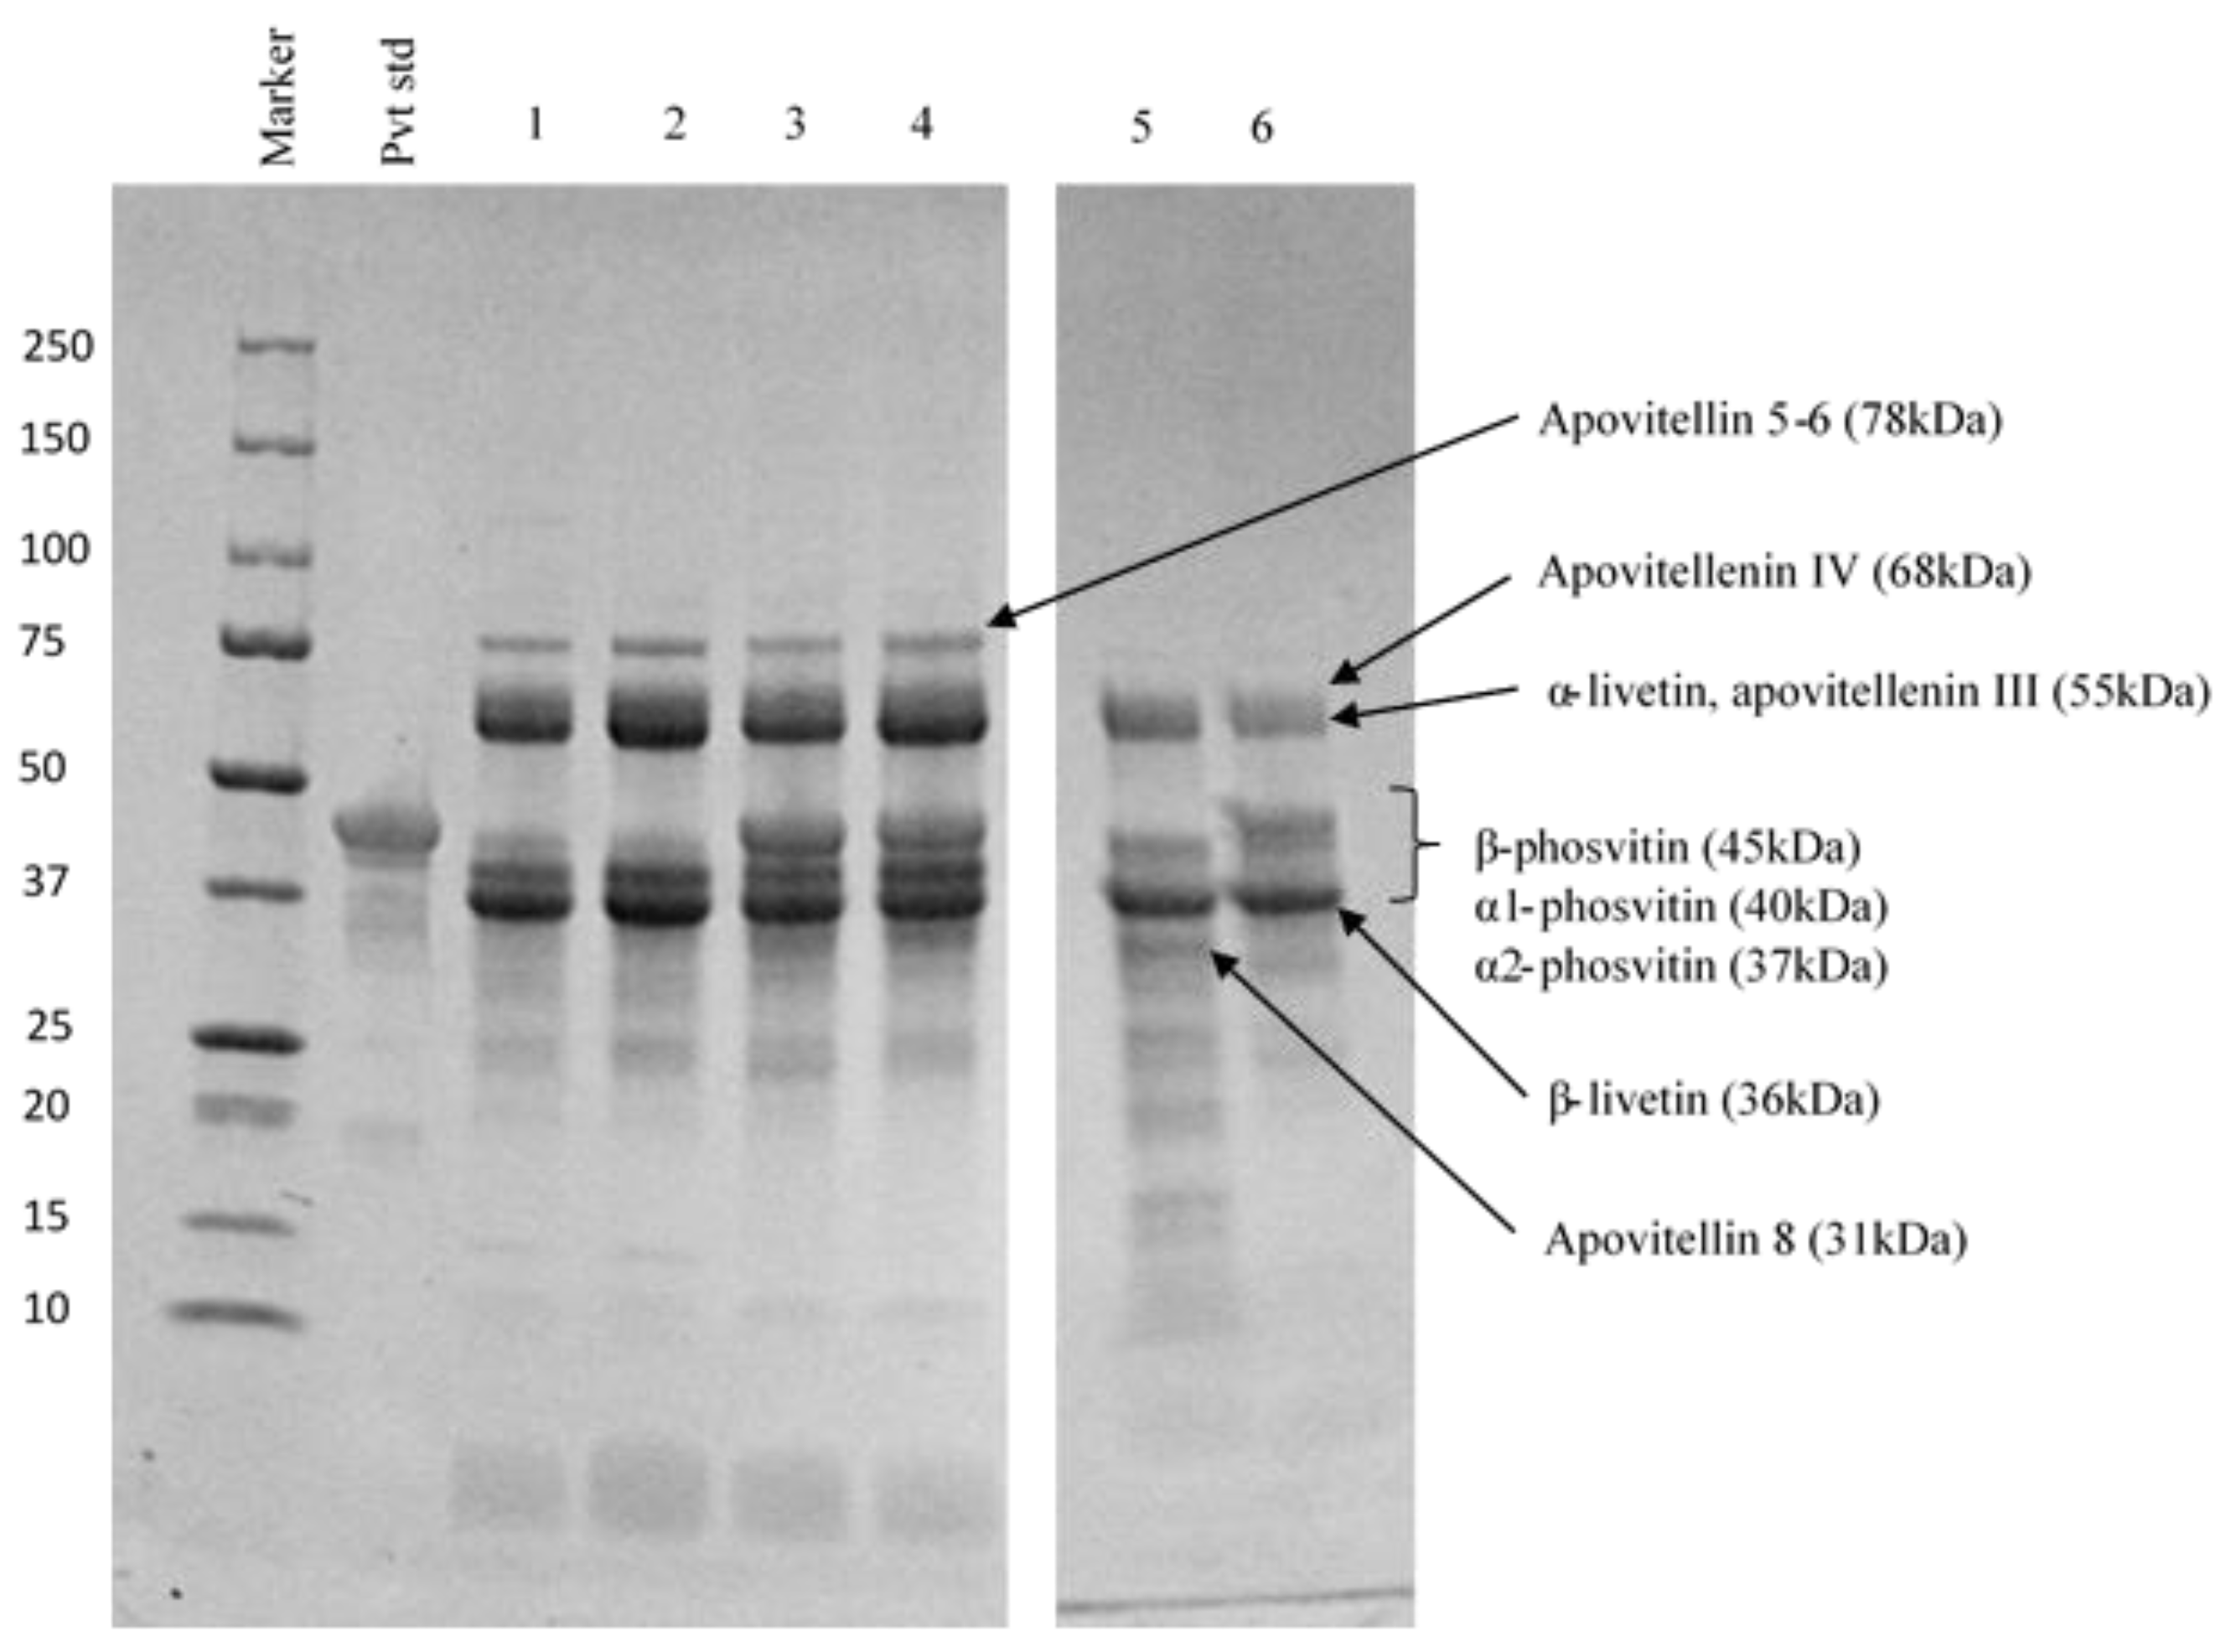
2.4.2. Protein Profiles by SDS-PAGE
2.4.3. Proteomic Analysis
2.5. Determination of Emulsifying Properties
2.5.1. Emulsion Preparation
2.5.2. Particle size Distribution
2.5.3. Creaming Index
2.5.4. Protein Profiles of Emulsion Fractions
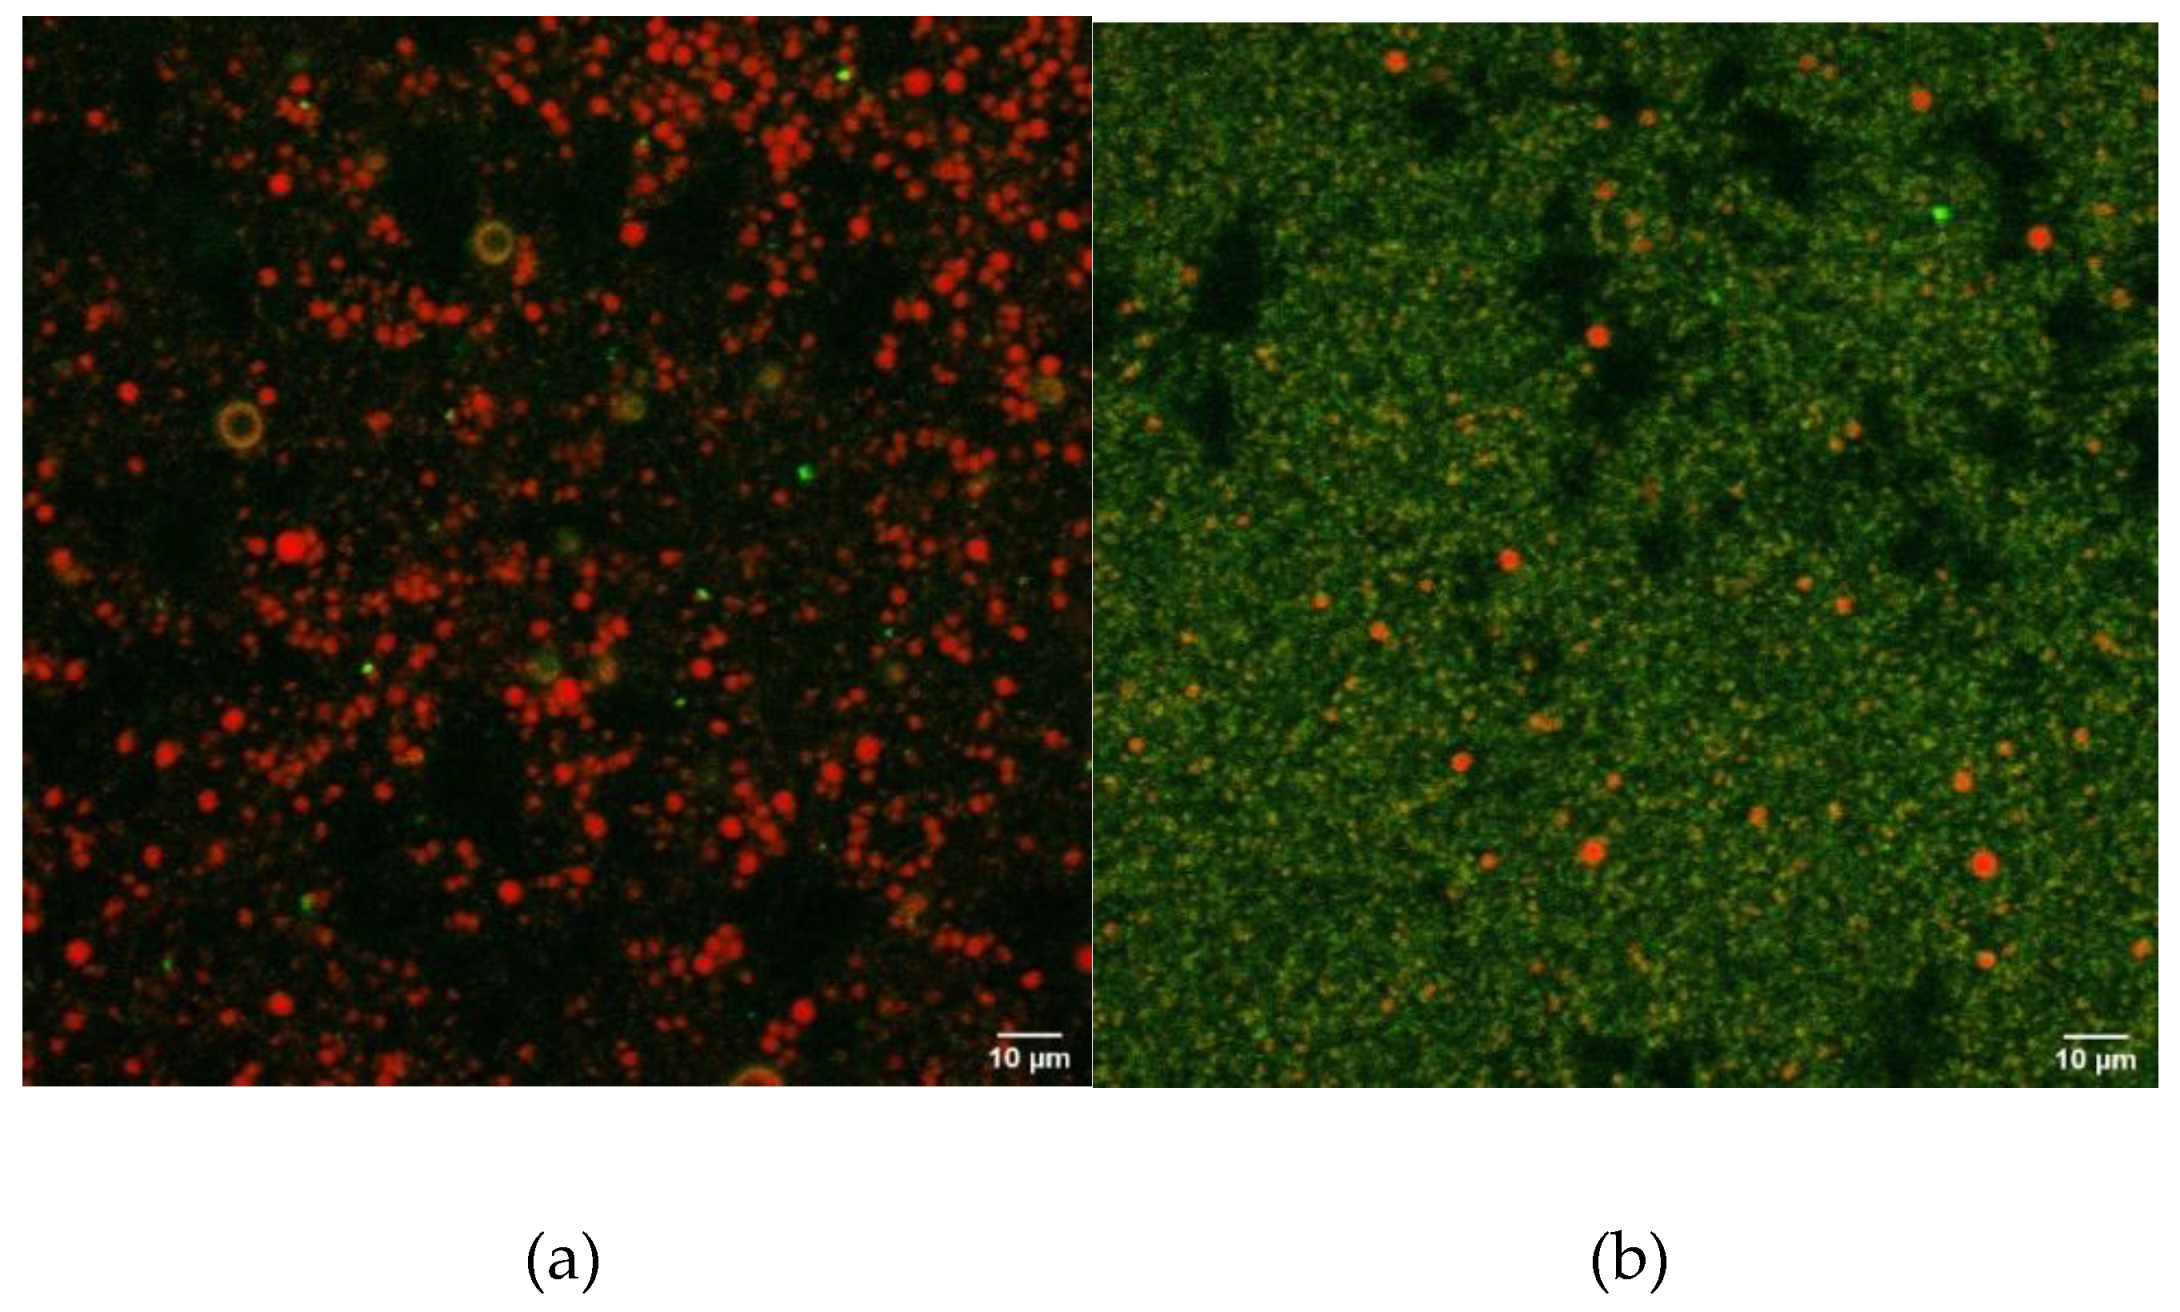
2.5.5. Confocal Laser Scanning Microscopy
2.6. Statistical Analysis
3. Results and Discussion
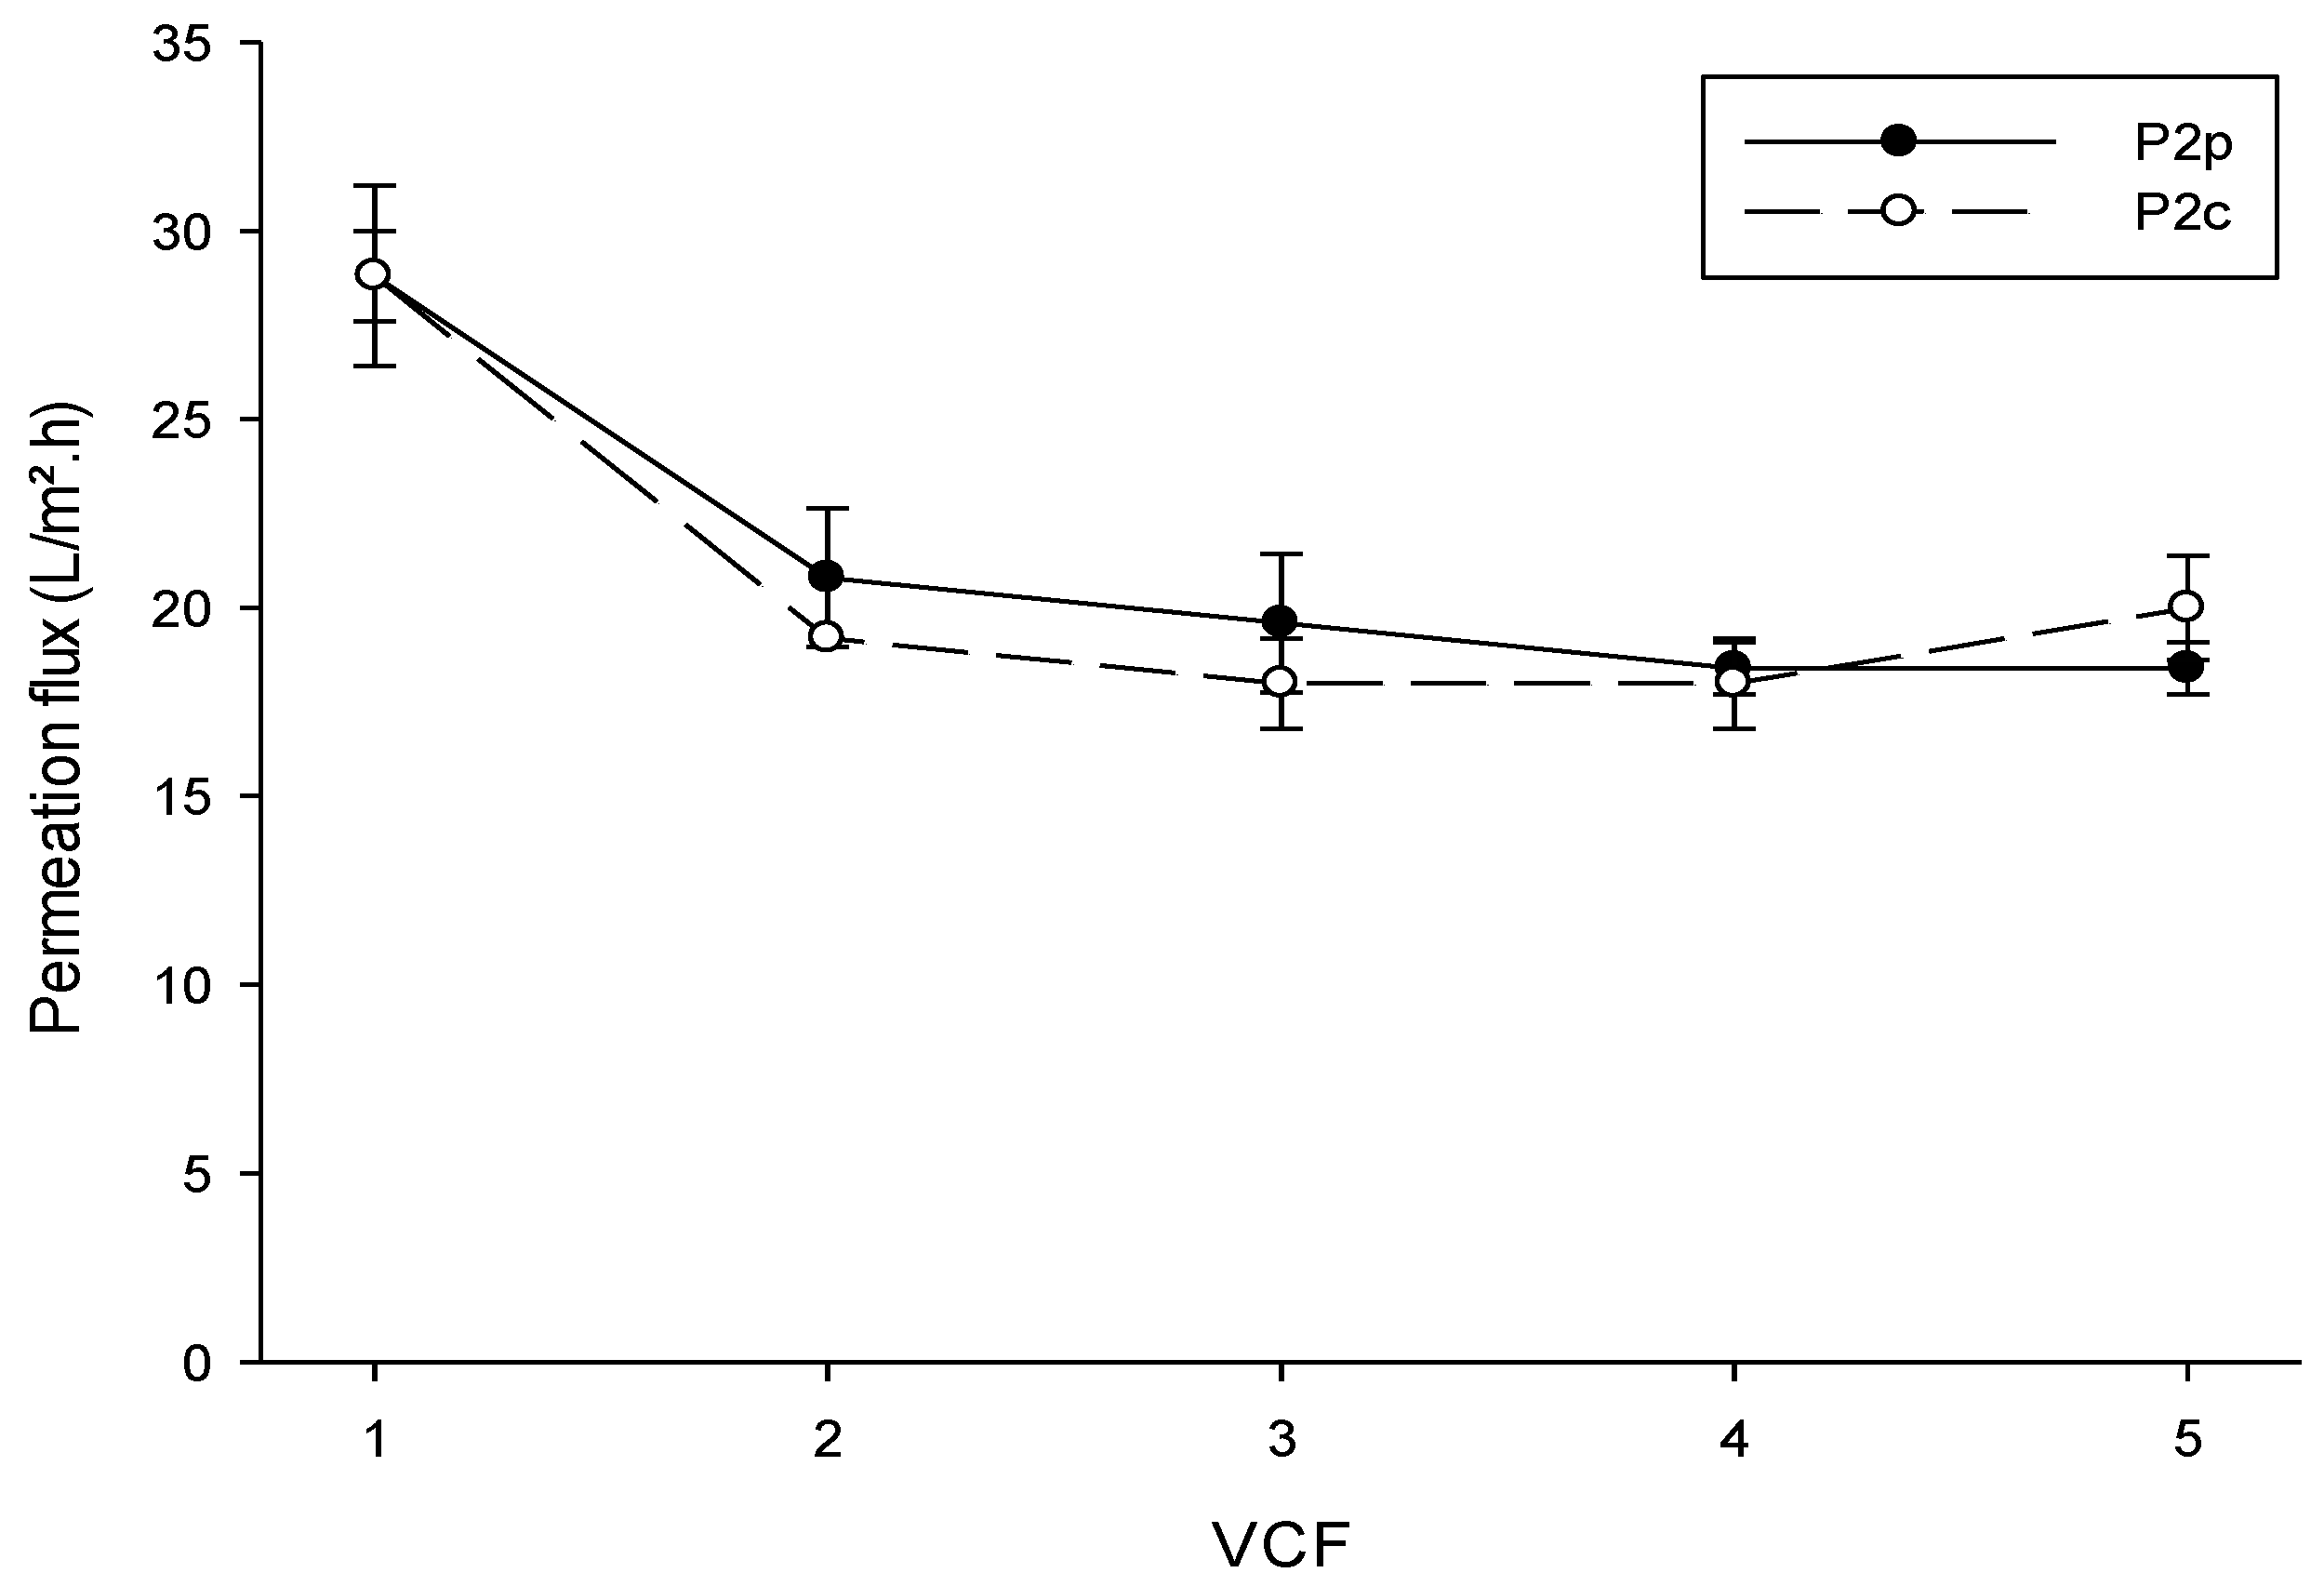
3.1. Ultrafiltration Performance
3.2. Impact of HHP and UF on Fraction Compositions
3.2.1. Protein and Lipid Composition
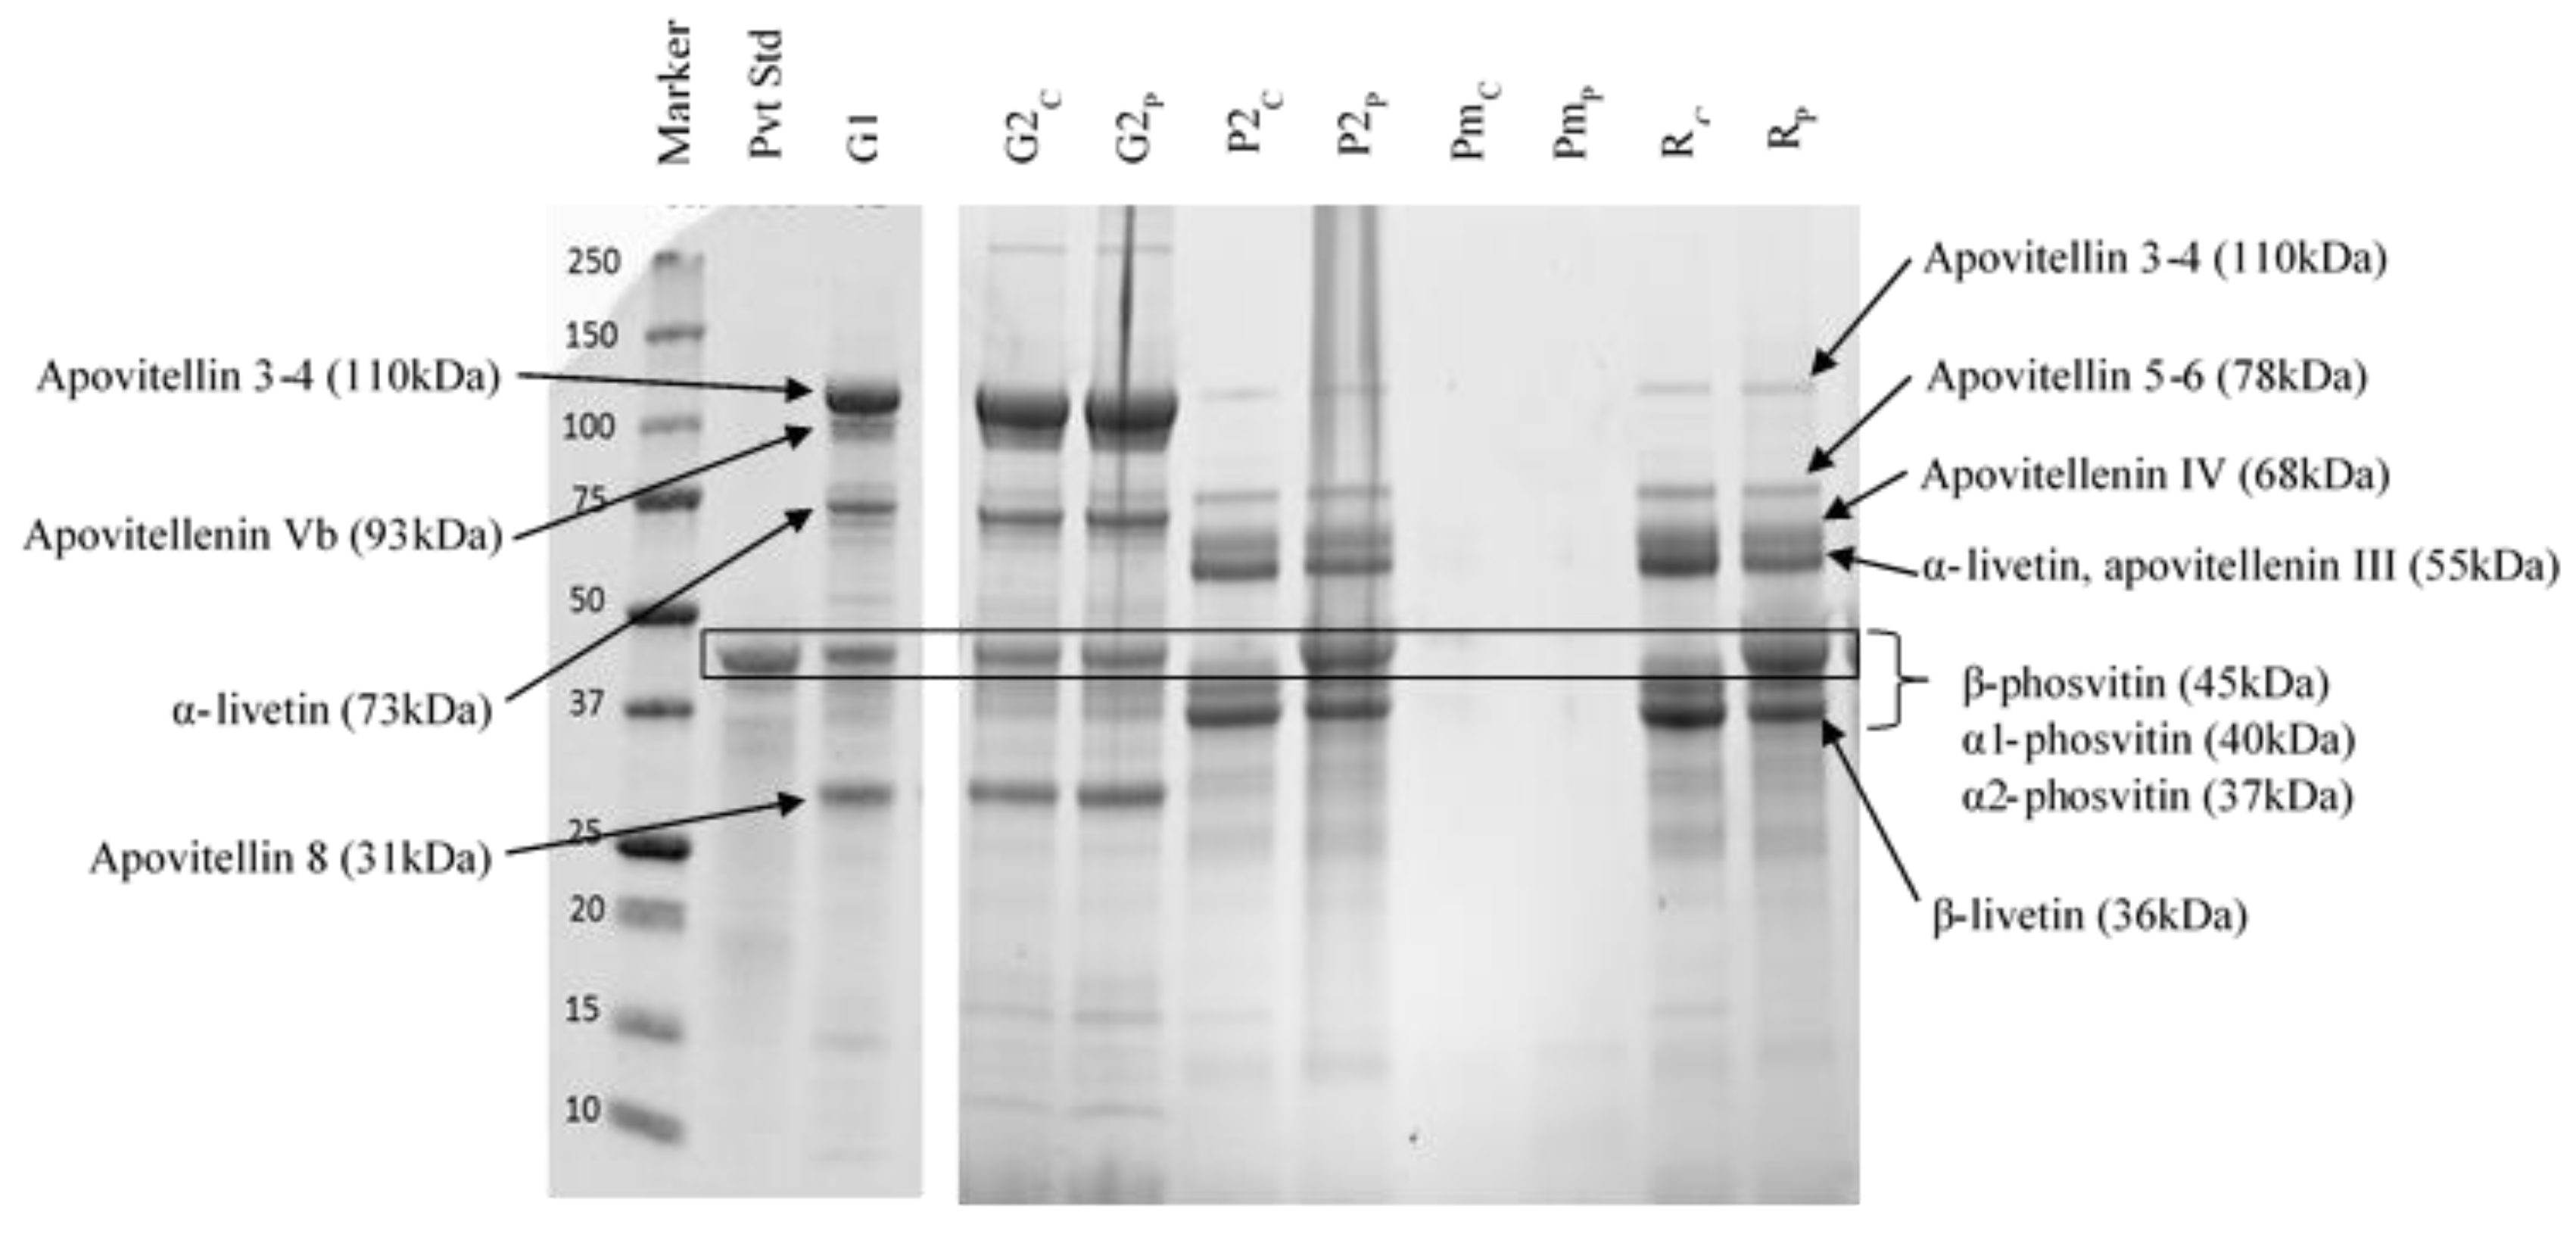
3.2.2. Protein Profiles
3.2.3. Mineral Composition
3.2.4. Phosvitin Analysis
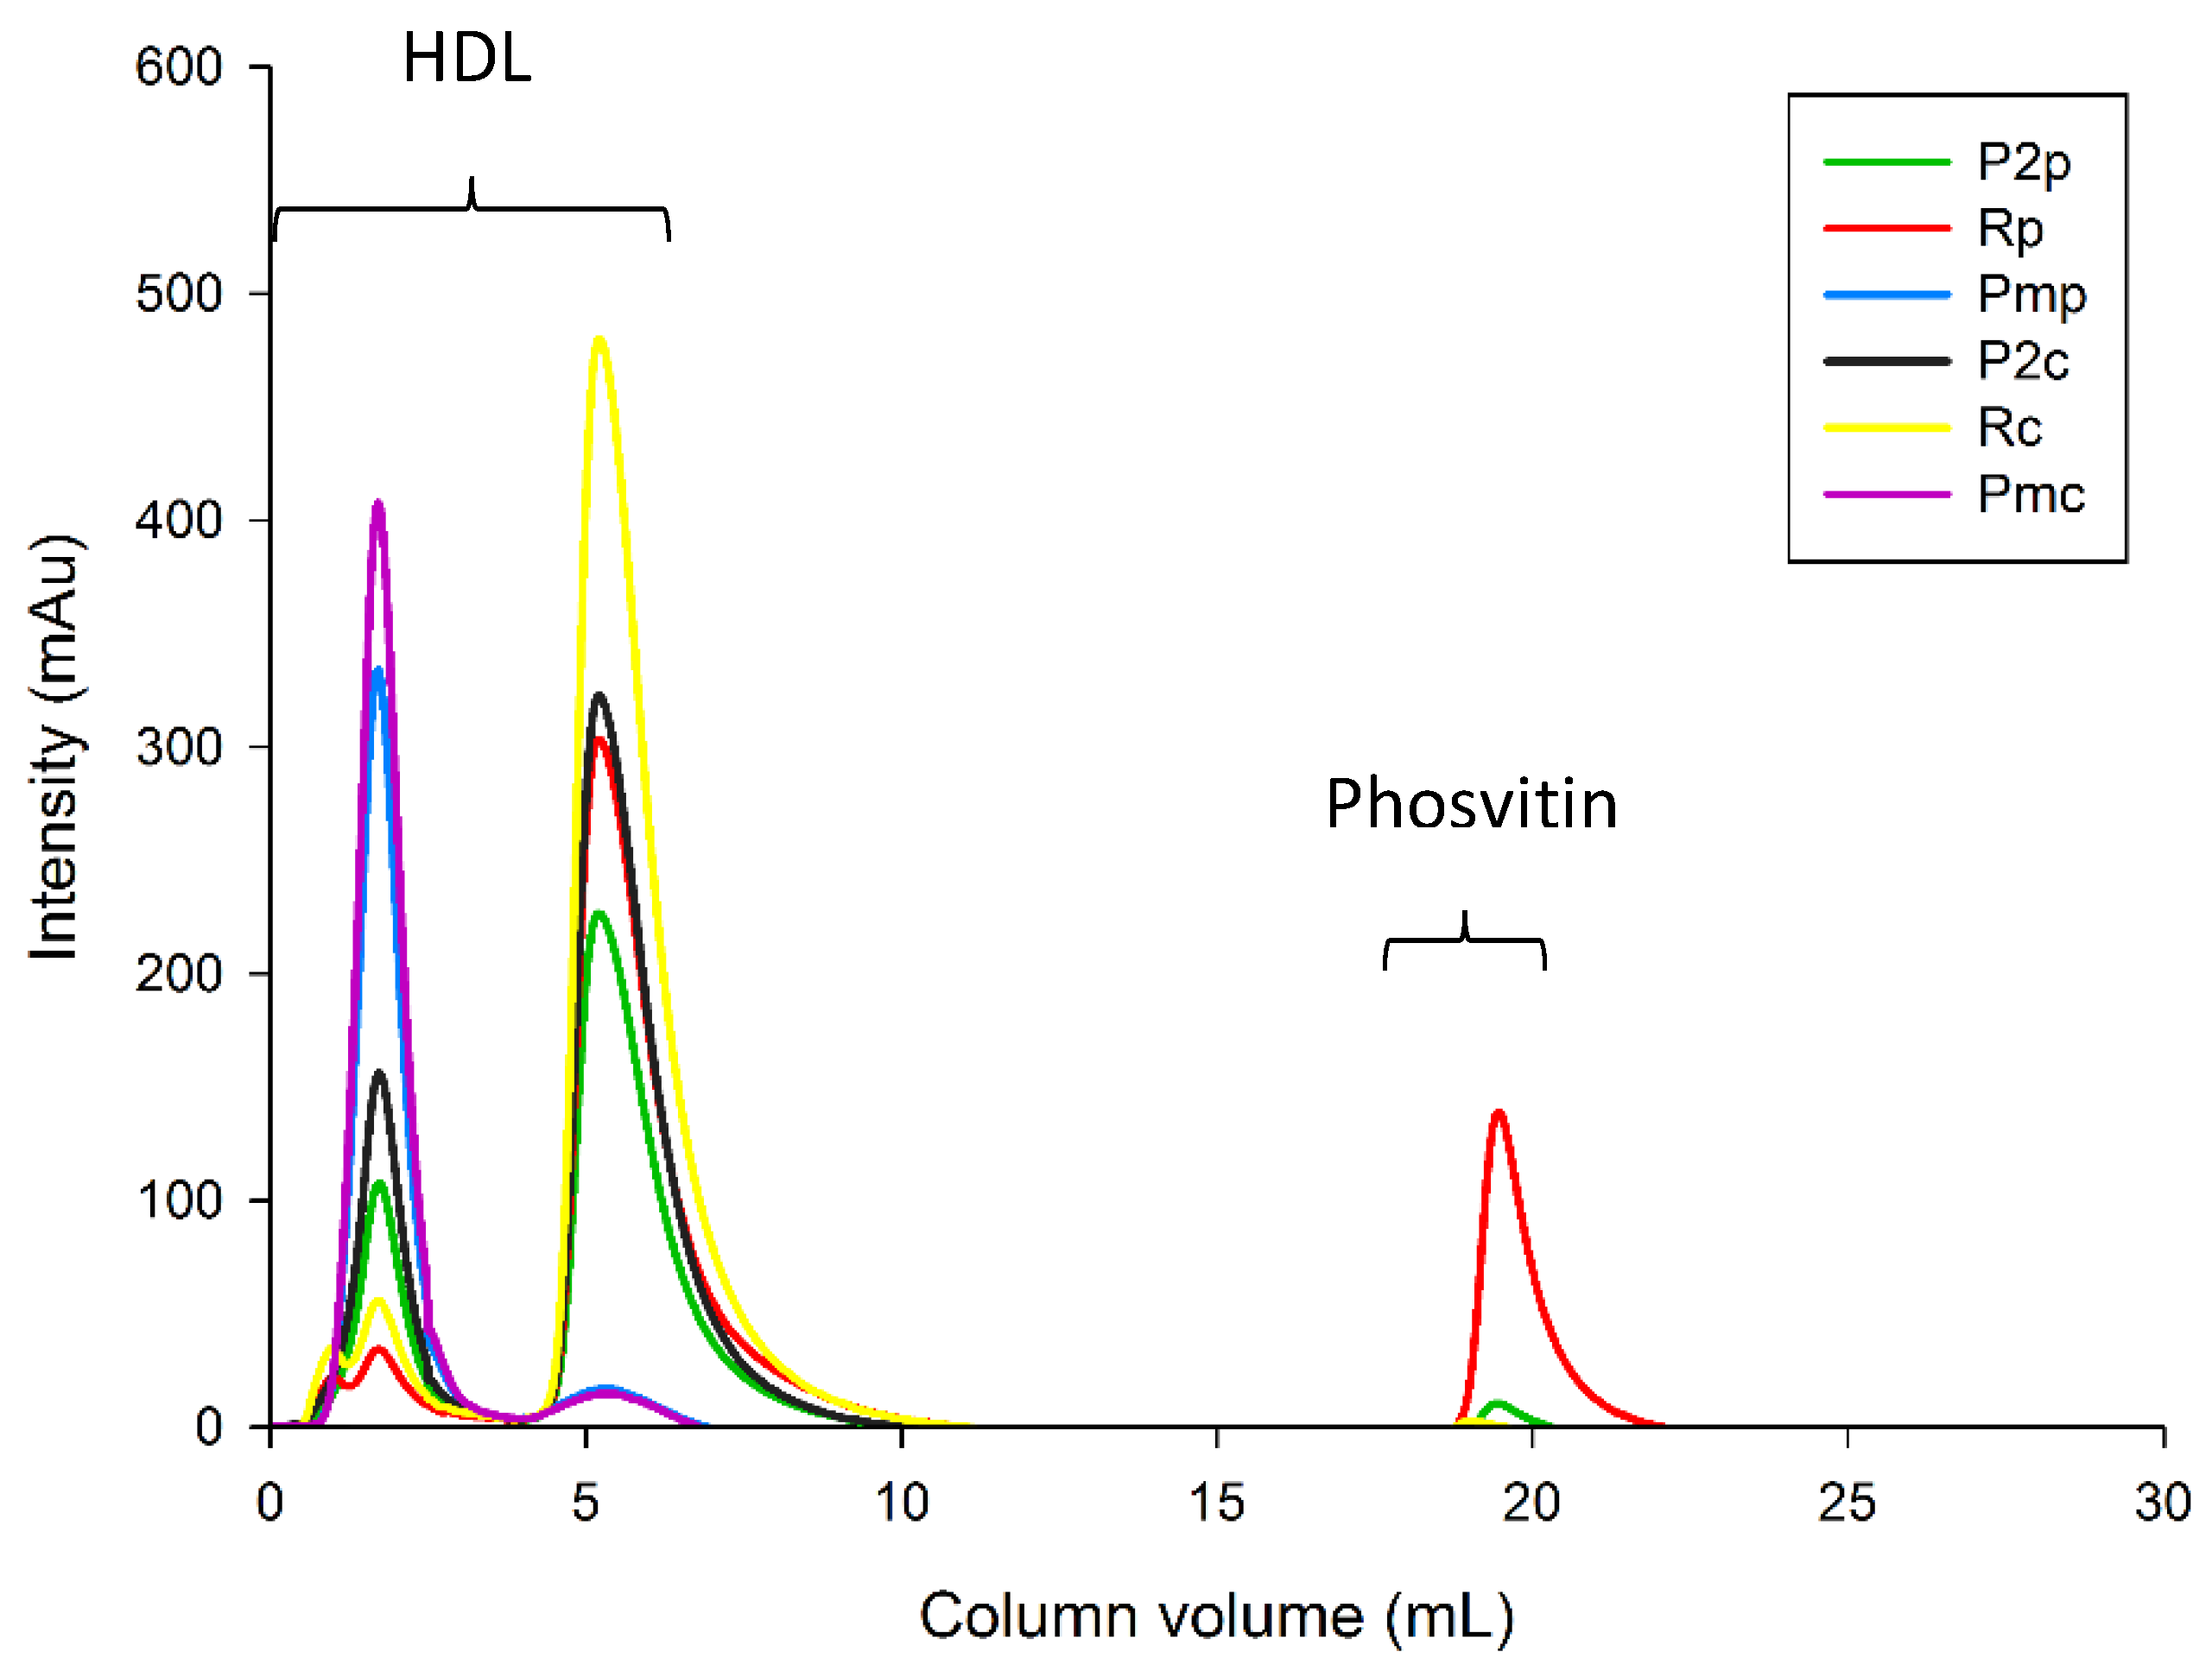
Fast Protein Liquid Chromatography
LC-MS/MS Analysis
3.3. Emulsifying Properties
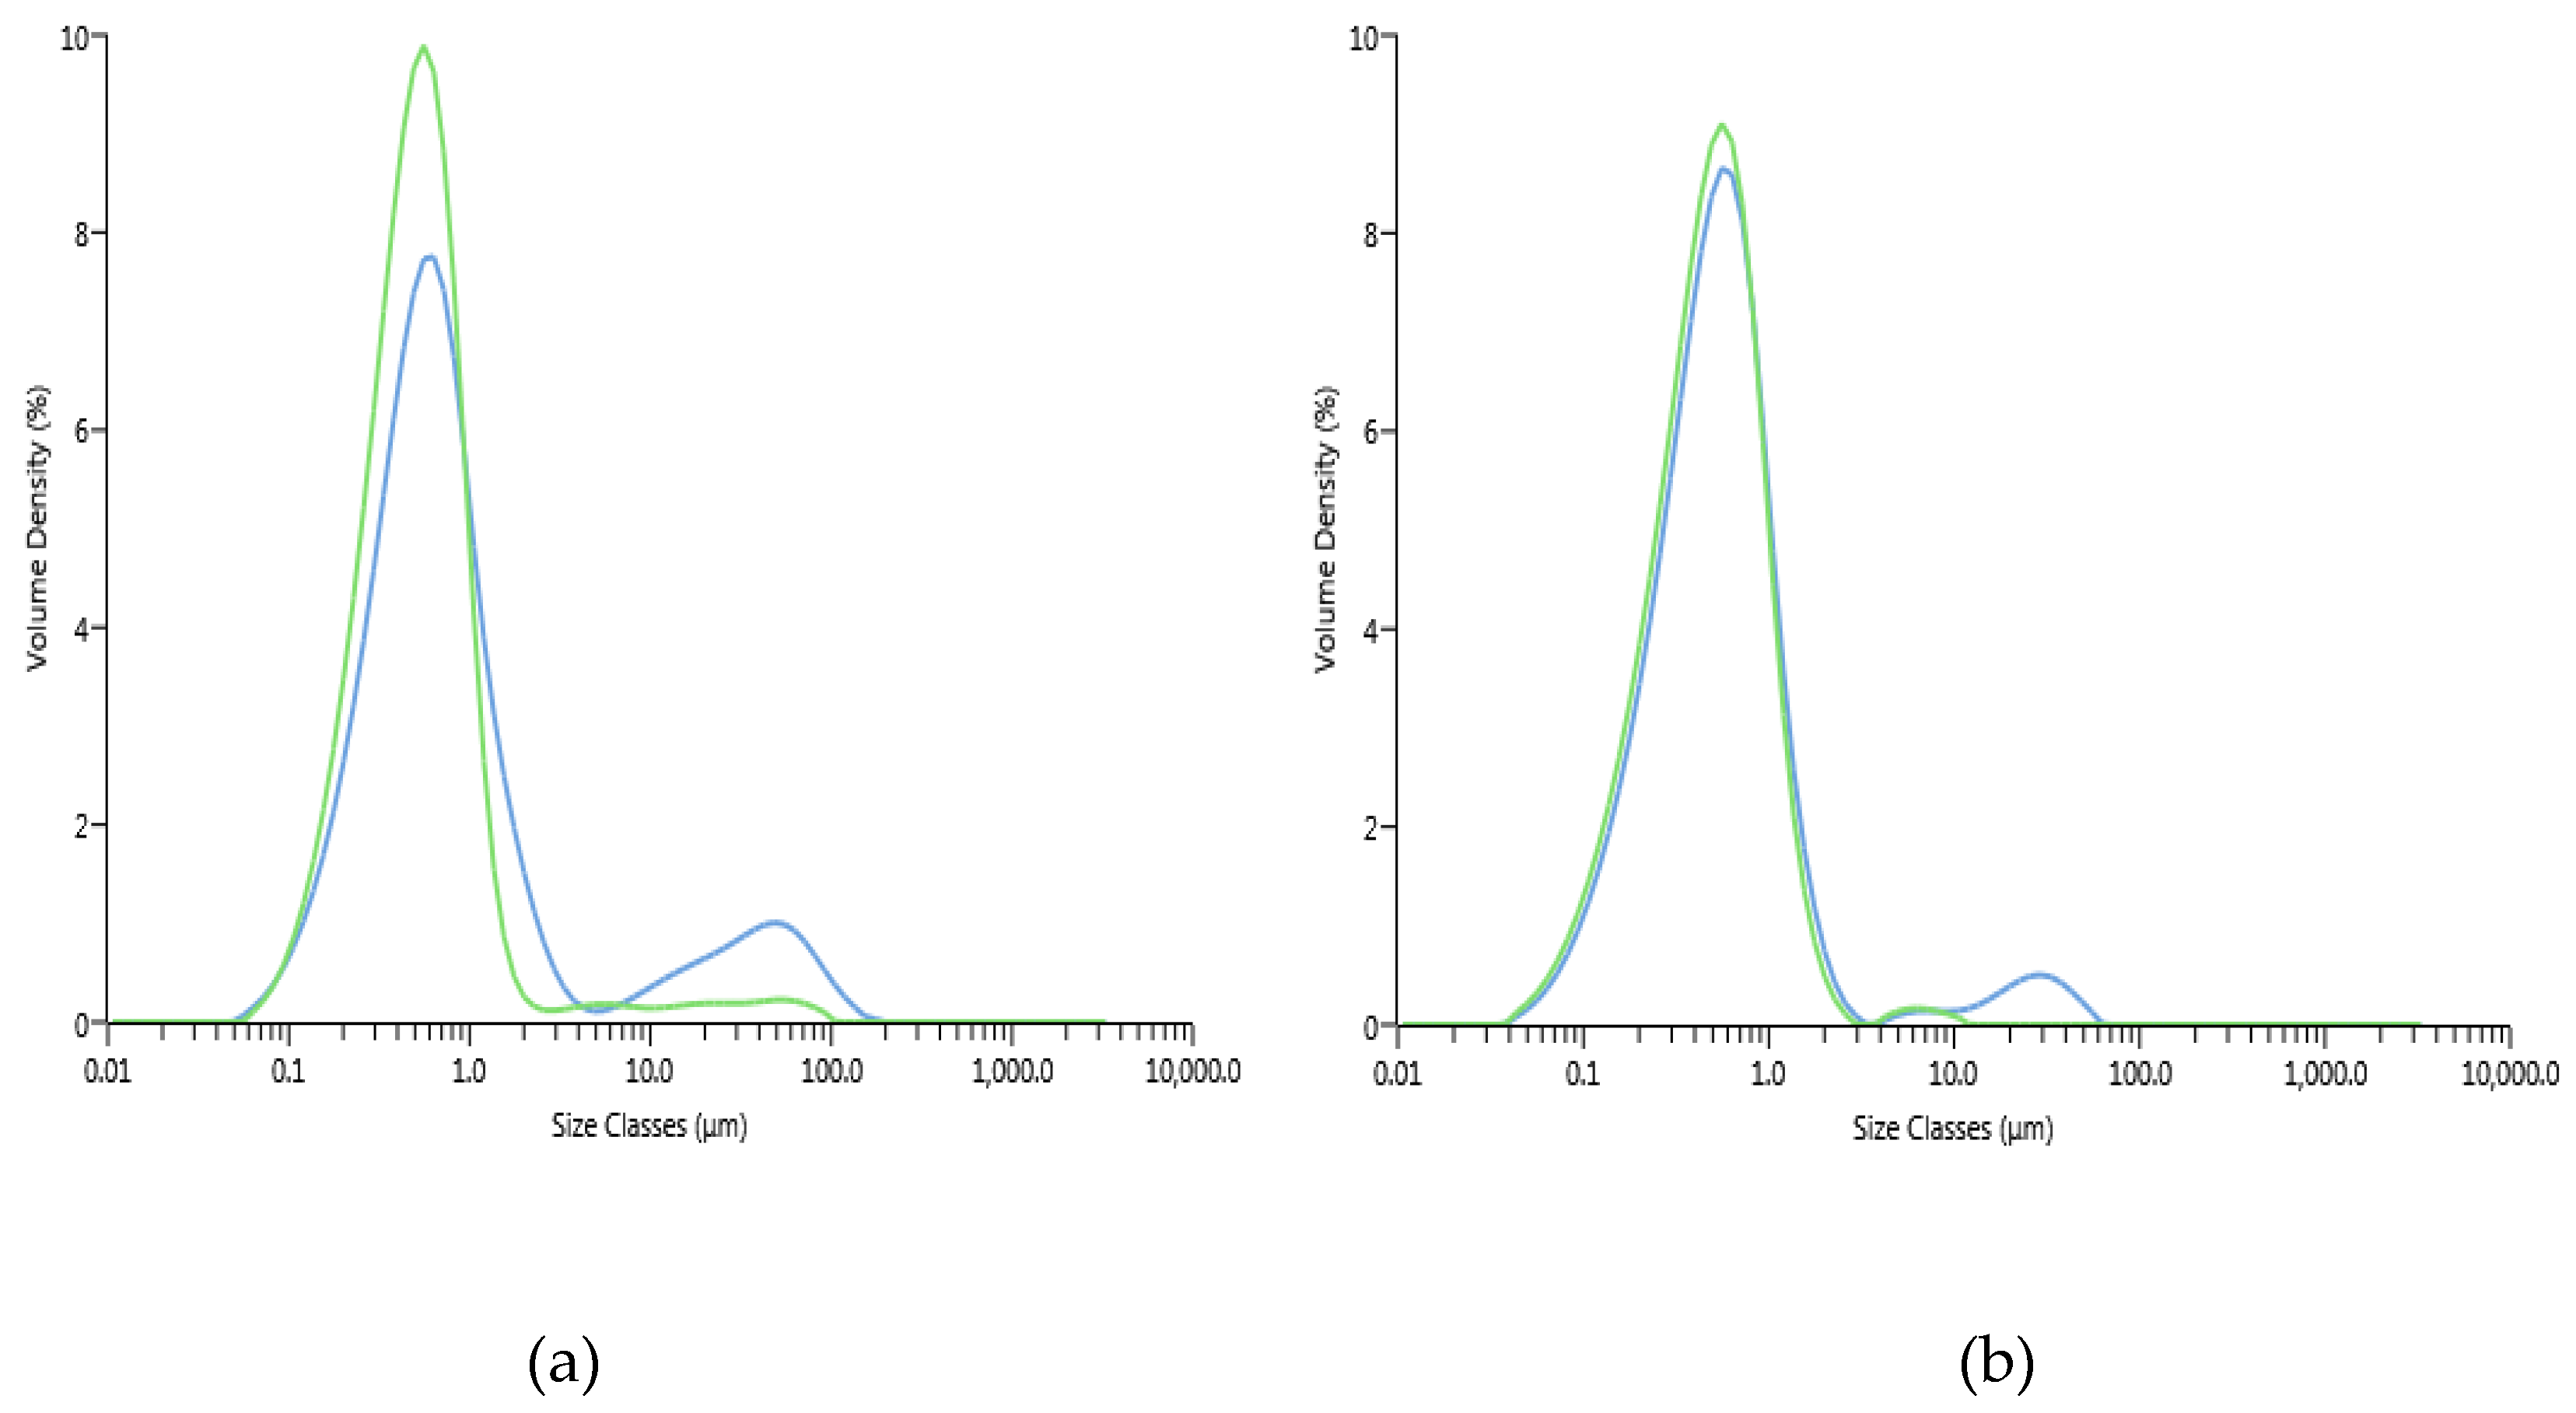
3.3.1. Particle Size Distribution
3.3.2. Creaming Index
3.3.3. Protein Profiles of Emulsion Fractions
3.3.4. Confocal Microscopy
4. Conclusions
Author Contributions
Funding
Acknowledgments
Conflicts of Interest
References
- Joubert, F.J.; Cook, W.H. Preparation and characterization of phosvitin from hen egg yolk. Can. J. Biochem. Physiol. 1958, 36, 399–408. [Google Scholar] [CrossRef] [PubMed]
- Abe, Y.; Itoh, T.; Adachi, S. Fractionation and characterization of hen’s egg yolk phosvitin. J. Food Sci. 1982, 47, 1903–1907. [Google Scholar] [CrossRef]
- Anton, M. Composition and structure of hen egg yolk. In Bioactive Egg Compounds; Springer: Berlin/Heidelberg, Germany, 2007; pp. 1–6. [Google Scholar]
- Jung, S.; Nam, K.C.; Ahn, D.U.; Kim, H.J.; Jo, C. Effect of phosvitin on lipid and protein oxidation in ground beef treated with high hydrostatic pressure. Meat Sci. 2013, 95, 8–13. [Google Scholar] [CrossRef] [PubMed]
- Clark, R.C. The primary structure of avian phosvitins: Contributions through the edman degradation of methylmercaptovitins prepared from the constituent phosphoproteins. Int. J. Biochem. 1985, 17, 983–988. [Google Scholar] [CrossRef]
- Dickinson, E.; Pinfield, V.J.; Horne, D.S. On the “anomalous” adsorption behavior of phosvitin. J. Colloid Interface Sci. 1997, 187, 539–541. [Google Scholar] [CrossRef] [PubMed]
- Damodaran, S.; Xu, S. The role of electrostatic forces in anomalous adsorption behavior of phosvitin at the air/water interface. J. Colloid Interface Sci. 1996, 178, 426–435. [Google Scholar] [CrossRef]
- Albright, K.J.; Gordon, D.T.; Cotterill, O.J. Release of iron from phosvitin by heat and food additives. J. Food Sci. 1984, 49, 78–81. [Google Scholar] [CrossRef]
- Hegenauer, J.; Saltman, P.; Nace, G. Iron (III)-phosphoprotein chelates: Stoichiometric equilibrium constant for interaction of iron (III) and phosphorylserine residues of phosvitin and casein. Biochemistry 1979, 18, 3865–3879. [Google Scholar] [CrossRef]
- Castellani; Martinet, V.; David-Briand, E.; Guérin-Dubiard, C.; Anton, M. Egg yolk phosvitin: Preparation of metal-free purified protein by fast protein liquid chromatography using aqueous solvents. J. Chromatogr. B 2003, 791, 273–284. [Google Scholar] [CrossRef]
- Duan, X.; Li, M.; Ma, H.; Xu, X.; Jin, Z.; Liu, X. Physicochemical properties and antioxidant potential of phosvitin–resveratrol complexes in emulsion system. Food Chem. 2016, 206, 102–109. [Google Scholar] [CrossRef]
- Xu, X.; Katayama, S.; Mine, Y. Antioxidant activity of tryptic digests of hen egg yolk phosvitin. J. Sci. Food Agric. 2007, 87, 2604–2608. [Google Scholar] [CrossRef] [PubMed]
- Sattar Khan, M.A.; Nakamura, S.; Ogawa, M.; Akita, E.; Azakami, H.; Kato, A. Bactericidal action of egg yolk phosvitin against Escherichia coli under thermal stress. J. Agric. Food Chem. 2000, 48, 1503–1506. [Google Scholar] [CrossRef] [PubMed]
- Jung, S.; Kim, D.H.; Son, J.H.; Nam, K.; Ahn, D.U.; Jo, C. The functional property of egg yolk phosvitin as a melanogenesis inhibitor. Food Chem. 2012, 135, 993–998. [Google Scholar] [CrossRef] [PubMed]
- Liu, Y.-Y.; Su, X.-R.; Liu, S.-S.; Yang, S.-S.; Jiang, C.-Y.; Zhang, Y.; Zhang, S. Zebrafish phosvitin-derived peptide Pt5 inhibits melanogenesis via cAMP pathway. Fish Physiol. Biochem. 2017, 43, 517–525. [Google Scholar] [CrossRef]
- Pillaiyar, T.; Manickam, M.; Jung, S.-H. Recent development of signaling pathways inhibitors of melanogenesis. Cell. Signal. 2017, 40, 99–115. [Google Scholar] [CrossRef]
- Jiang, B.; Mine, Y. Preparation of novel functional oligophosphopeptides from hen egg yolk phosvitin. J. Agric. Food Chem. 2000, 48, 990–994. [Google Scholar] [CrossRef]
- Ren, J.; Li, Q.; Offengenden, M.; Wu, J. Preparation and characterization of phosphopeptides from egg yolk phosvitin. J. Funct. Foods 2015, 18, 190–197. [Google Scholar] [CrossRef]
- Zhang, X.; Geng, F.; Huang, X.; Ma, M. Acceleration of the initial phase transformation of mineralization by phosvitin. J. Cryst. Growth 2015, 409, 44–50. [Google Scholar] [CrossRef]
- Choi, I.; Jung, C.; Choi, H.; Kim, C.; Ha, H. Effectiveness of phosvitin peptides on enhancing bioavailability of calcium and its accumulation in bones. Food Chem. 2005, 93, 577–583. [Google Scholar] [CrossRef]
- Chung, S.L.; Ferrier, L.K. Conditions affecting emulsifying properties of egg yolk phosvitin. J. Food Sci. 1991, 56, 1259–1262. [Google Scholar] [CrossRef]
- Chung, S.L.; Ferrier, L.K. pH and Sodium chloride effects on emulsifying properties of egg yolk phosvitin. J. Food Sci. 1992, 57, 40–42. [Google Scholar] [CrossRef]
- Dickinson, E.; Hunt, J.A.; Horne, D.S. Calcium induced flocculation of emulsions containing adsorbed β-casein or phosvitin. Food Hydrocoll. 1992, 6, 359–370. [Google Scholar] [CrossRef]
- Le Denmat, M.; Anton, M.; Beaumal, V. Characterisation of emulsion properties and of interface composition in O/W emulsions prepared with hen egg yolk, plasma and granules. Food Hydrocoll. 2000, 14, 539–549. [Google Scholar] [CrossRef]
- Castellani; Belhomme, C.; David-Briand, E.; Guérin-Dubiard, C.; Anton, M. Oil-in-water emulsion properties and interfacial characteristics of hen egg yolk phosvitin. Food Hydrocoll. 2006, 20, 35–43. [Google Scholar] [CrossRef]
- Castellani; David-Briand, E.; Guérin-Dubiard, C.; Anton, M. Effect of aggregation and sodium salt on emulsifying properties of egg yolk phosvitin. Food Hydrocoll. 2005, 19, 769–776. [Google Scholar] [CrossRef]
- Li, M.; Li, X.; Li, J.; Lu, M.; Liu, X.; Duan, X. Effects of multiple freeze–thaw treatments on physicochemical and biological activities of egg phosvitin and its phosphopeptides. Food Funct. 2018, 9, 4602–4610. [Google Scholar] [CrossRef]
- Aluko, R.E.; Mine, Y. Competitive adsorption of hen’s egg yolk granule lipoproteins and phosvitin in oil-in-water emulsions. J. Agric. Food Chem. 1997, 45, 4564–4570. [Google Scholar] [CrossRef]
- Ko, K.Y.; Nam, K.C.; Jo, C.; Lee, E.J.; Ahn, D.U. A simple and efficient method for preparing partially purified phosvitin from egg yolk using ethanol and salts. Poult. Sci. 2011, 90, 1096–1104. [Google Scholar] [CrossRef]
- Ren, J.; Wu, J. Thermal-aided phosvitin extraction from egg yolk. J. Sci. Food Agric. 2015, 95, 2595–2600. [Google Scholar] [CrossRef]
- Lei, B.; Wu, J. Purification of egg yolk phosvitin by anion exchange chromatography. J. Chromatogr. A 2012, 1223, 41–46. [Google Scholar] [CrossRef]
- Ren, J.; Wu, J. Preparation of high purity egg phosvitin using anion exchange chromatography. Food Chem. 2014, 186–192. [Google Scholar] [CrossRef] [PubMed]
- Pereira, R.; Vicente, A. Environmental impact of novel thermal and non-thermal technologies in food processing. Food Res. Int. 2010, 43, 1936–1943. [Google Scholar] [CrossRef] [Green Version]
- Oey, I.; Lille, M.; Van Loey, A.; Hendrickx, M. Effect of high-pressure processing on colour, texture and flavour of fruit- and vegetable-based food products: A review. Trends Food Sci. Technol. 2008, 19, 320–328. [Google Scholar] [CrossRef]
- Rivalain, N.; Roquain, J.; Demazeau, G. Development of high hydrostatic pressure in biosciences: Pressure effect on biological structures and potential applications in biotechnologies. Biotechnol. Adv. 2010, 28, 659–672. [Google Scholar] [CrossRef]
- Chawla, R.; Patil, G.R.; Singh, A.K. High hydrostatic pressure technology in dairy processing: A review. J. Food Sci. Technol. 2011, 48, 260–268. [Google Scholar] [CrossRef] [Green Version]
- Naderi, N.; Pouliot, Y.; House, J.D.; Doyen, A. Effect of freezing, thermal pasteurization, and hydrostatic pressure on fractionation and folate recovery in egg yolk. J. Agric. Food Chem. 2017, 65, 7774–7780. [Google Scholar] [CrossRef]
- Naderi, N.; Pouliot, Y.; House, J.D.; Doyen, A. High hydrostatic pressure effect in extraction of 5-methyltetrahydrofolate (5-MTHF) from egg yolk and granule fractions. Innov. Food Sci. Emerg. Technol. 2017, 43, 191–200. [Google Scholar] [CrossRef]
- Chang, C.M.; Powrie, W.D.; Fennema, O. Microstructure of egg yolk. J. Food Sci. 1977, 42, 1193–1200. [Google Scholar] [CrossRef]
- Causeret, D.; Matringe, E.; Lorient, D. Ionic strength and pH effects on composition and microstructure of yolk granules. J. Food Sci. 1991, 56, 1532–1536. [Google Scholar] [CrossRef]
- Causeret, D.; Matringe, E.; Lorient, D. Mineral cations affect microstructure of egg yolk granules. J. Food Sci. 1992, 57, 1323–1326. [Google Scholar] [CrossRef]
- Anton, M.; Gandemer, G. Composition, solubility and emulsifying properties of granules and plasma of egg yolk. J. Food Sci. 1997, 62, 484–487. [Google Scholar] [CrossRef]
- Duffuler, P. Extraction de la Phosvitine de la Granule du Jaune D’œuf par le Procédé à Hautes Pressions Hydrostatiques. Master’s Thesis, Laval University, Quebec, QC, Canada, August 2019. [Google Scholar]
- Castellani; Guérin-Dubiard, C.; David-Briand, E.; Anton, M. Influence of physicochemical conditions and technological treatments on the iron binding capacity of egg yolk phosvitin. Food Chem. 2004, 85, 569–577. [Google Scholar] [CrossRef]
- Chay Pak Ting, B.P.; Pouliot, Y.; Juneja, L.R.; Okubo, T.; Gauthier, S.F.; Mine, Y. On the use of ultrafiltration for the concentration and desalting of phosvitin from egg yolk protein concentrate. Int. J. Food Sci. Technol. 2010, 45, 1633–1640. [Google Scholar] [CrossRef]
- Naderi, N.; House, J.D.; Pouliot, Y. Scaling-up a process for the preparation of folate-enriched protein extracts from hen egg yolks. J. Food Eng. 2014, 141, 85–92. [Google Scholar] [CrossRef]
- Gallier, S.; Gragson, D.; Jiménez-Flores, R.; Everett, D. Using confocal laser scanning microscopy to probe the milk fat globule membrane and associated proteins. J. Agric. Food Chem. 2010, 58, 4250–4257. [Google Scholar] [CrossRef] [PubMed] [Green Version]
- Wallace, R.A.; Morgan, J.P. Isolation of phosvitin: Retention of small molecular weight species and staining characteristics on electrophoretic gels. Anal. Biochem. 1986, 157, 256–261. [Google Scholar] [CrossRef]
- Cornelius, R.; Macri, J.; Cornelius, K.; Brash, J. Interactions of apolipoproteins AI, AII, B and HDL, LDL, VLDL with polyurethane and polyurethane-PEO surfaces. Langmuir 2015, 31, 12087–12095. [Google Scholar] [CrossRef] [PubMed]
- Yamashita, H.; Ishibashi, J.; Hong, Y.-H.; Hirose, M. Involvement of ovotransferrin in the thermally induced gelation of egg white at around 65 C. Biosci. Biotechnol. Biochem. 1998, 62, 593–595. [Google Scholar] [CrossRef] [Green Version]
- Anton; Chapleau, N.; Beaumal, V.; Delepine, S.; de Lamballerie-Anton, M. Effect of high-pressure treatment on rheology of oil-in-water emulsions prepared with hen egg yolk. Innov. Food Sci. Emerg. Technol. 2001, 2, 9–21. [Google Scholar] [CrossRef]
- Floury, J.; Desrumaux, A.; Legrand, J. Effect of ultra-high-pressure homogenization on structure and on rheological properties of soy protein-stabilized emulsions. J. Food Sci. 2002, 67, 3388–3395. [Google Scholar] [CrossRef]
- Khan, N.M.; Mu, T.-H.; Zhang, M.; Arogundade, L.A. The effects of pH and high hydrostatic pressure on the physicochemical properties of a sweet potato protein emulsion. Food Hydrocoll. 2014, 35, 209–216. [Google Scholar] [CrossRef]
- Dickinson, E. Emulsion gels: The structuring of soft solids with protein-stabilized oil droplets. Food Hydrocoll. 2012, 28, 224–241. [Google Scholar] [CrossRef]
Sample Availability: Samples of the compounds are not available from the authors. |


| Samples | Protein | Lipid | |
|---|---|---|---|
| (% w/w, Dry Basis) | |||
| Initial granule | G1 | 63.4 ± 0.3 a, b | 27.9 ± 0.8 c |
| Control | G2C | 64 ± 1.1 a | 26.8 ± 0.4 c |
| P2C | 54.1 ± 0.5 c | 22.7 ± 1.4 d | |
| PmC | 40.7 ± 0.8 d | 0.23 ± 0.11 f | |
| RC | 62.9 ± 0.5 a, b | 36.8 ± 1.07 b | |
| Pressure-treated | G2P | 64.5 ± 0.4 a | 28.2 ± 0.2 c |
| P2P | 55.6 ± 1.2 b, c | 16.1 ± 0.4 e | |
| PmP | 37.1 ± 0.7 d | 0.05 ± 0.05 f | |
| RP | 52.9 ± 0.9 b, c | 41.5 ± 3.4 a | |
| Samples | Phosphorus (P) | Iron (Fe) | |
|---|---|---|---|
| % w/w | ×10−2% w/w | ||
| Initial granule | G1 | 0.65 ± 0.24 d, e | 0.50 ± 0.12 c |
| Control | G2C | 0.33 ± 0.09 e | 1.20 ± 0.33 c |
| P2C | 0.98 ± 0.10 c, d | 0.49 ± 0.18 c | |
| PmC | 1.52 ± 0.09 b, c | 1.31 ± 1.19 c | |
| RC | 0.50 ± 0.10 d, e | 0.42 ± 0.19 c | |
| Pressure-treated | G2P | 0.30 ± 0.04 e | 1.20 ± 0.16 c |
| P2P | 2.74 ± 0.11 a | 6.31 ± 0.70 a | |
| PmP | 2.97 ± 0.27 a | 0.50 ± 0.10 c | |
| RP | 2.07 ± 0.53 b | 3.20 ± 0.98 b | |
| Samples | Phosvitin | |
|---|---|---|
| % w/w, Dry Basis | ||
| Initial granule | G1 | 12.40 ± 0.34 b |
| Control | G2C | 9.25 ± 0.82 b, c |
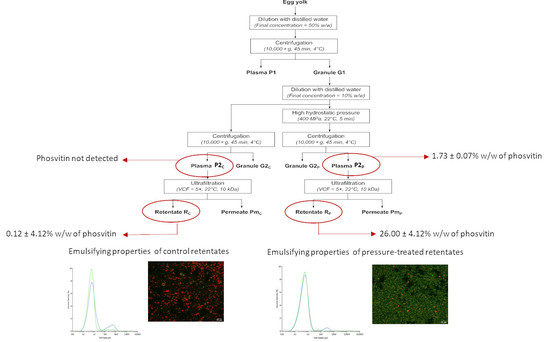
| P2C | ND | |
| PmC | ND | |
| RC | 0.12 ± 0.31 d | |
| Pressure-treated | G2P | 6.58 ± 0.21 c |
| P2P | 1.73 ± 0.07 d | |
| PmP | ND | |
| RP | 26.00 ± 4.12 a | |
| Accession Number | Identified Proteins | Molecular Weight (kDa) | Sequence Coverage (%) | Total Spectrum Count | ||
|---|---|---|---|---|---|---|
| P2P | RP | PmP | ||||
| VIT2_CHICK | Vitellogenin-2, OS: Gallus gallus, OX = 9031, GN = VTG2, PE = 1, SV = 1 | 205 | 58 | 1017 | 1048 | 0 |
| A0A1D5NW68_CHICK | Serum albumin, OS = Gallus gallus, OX = 9031, GN = ALB, PE = 3, SV = 1 | 70 | 84 | 759 | 786 | 132 |
| A0A1D5NUW2_CHICK | Vitellogenin-1, OS = Gallus gallus, OX = 9031, GN= VTG1, PE = 4, SV = 1 | 211 | 53 | 627 | 584 | 286 |
| A0A1D5P4L7_CHICK | Ovotransferrin, OS = Gallus gallus, OX =9 031, GN = TF, PE = 3, SV = 1 | 78 | 84 | 329 | 336 | 36 |
| F1NV02_CHICK | Apolipoprotein B, OS = Gallus gallus, OX = 9031, GN = APOB, P E= 4, SV = 2 | 523 | 38 | 212 | 166 | 91 |
| A0A1L1RJF5_CHICK | Apolipoprotein A-I, OS = Gallus gallus, OX = 9031, GN = APOA1, PE = 3, SV = 1 | 32 | 55 | 37 | 27 | 157 |
© 2020 by the authors. Licensee MDPI, Basel, Switzerland. This article is an open access article distributed under the terms and conditions of the Creative Commons Attribution (CC BY) license (http://creativecommons.org/licenses/by/4.0/).
Share and Cite
Giarratano, M.; Duffuler, P.; Chamberland, J.; Brisson, G.; House, J.D.; Pouliot, Y.; Doyen, A. Combination of High Hydrostatic Pressure and Ultrafiltration to Generate a New Emulsifying Ingredient from Egg Yolk. Molecules 2020, 25, 1184. https://0-doi-org.brum.beds.ac.uk/10.3390/molecules25051184
Giarratano M, Duffuler P, Chamberland J, Brisson G, House JD, Pouliot Y, Doyen A. Combination of High Hydrostatic Pressure and Ultrafiltration to Generate a New Emulsifying Ingredient from Egg Yolk. Molecules. 2020; 25(5):1184. https://0-doi-org.brum.beds.ac.uk/10.3390/molecules25051184
Chicago/Turabian StyleGiarratano, Mélanie, Pauline Duffuler, Julien Chamberland, Guillaume Brisson, James D. House, Yves Pouliot, and Alain Doyen. 2020. "Combination of High Hydrostatic Pressure and Ultrafiltration to Generate a New Emulsifying Ingredient from Egg Yolk" Molecules 25, no. 5: 1184. https://0-doi-org.brum.beds.ac.uk/10.3390/molecules25051184