
Chicken Combs and Wattles as Sources of Bioactive Peptides: Optimization of Hydrolysis, Identification by LC-ESI-MS2 and Bioactivity Assessment

 , , ,
, , , 
Abstract
: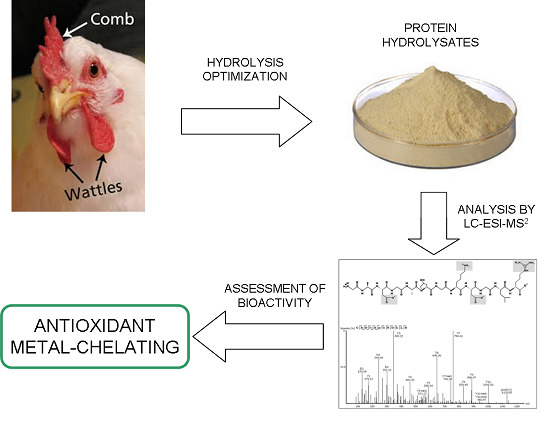
1. Introduction
2. Results and Discussion
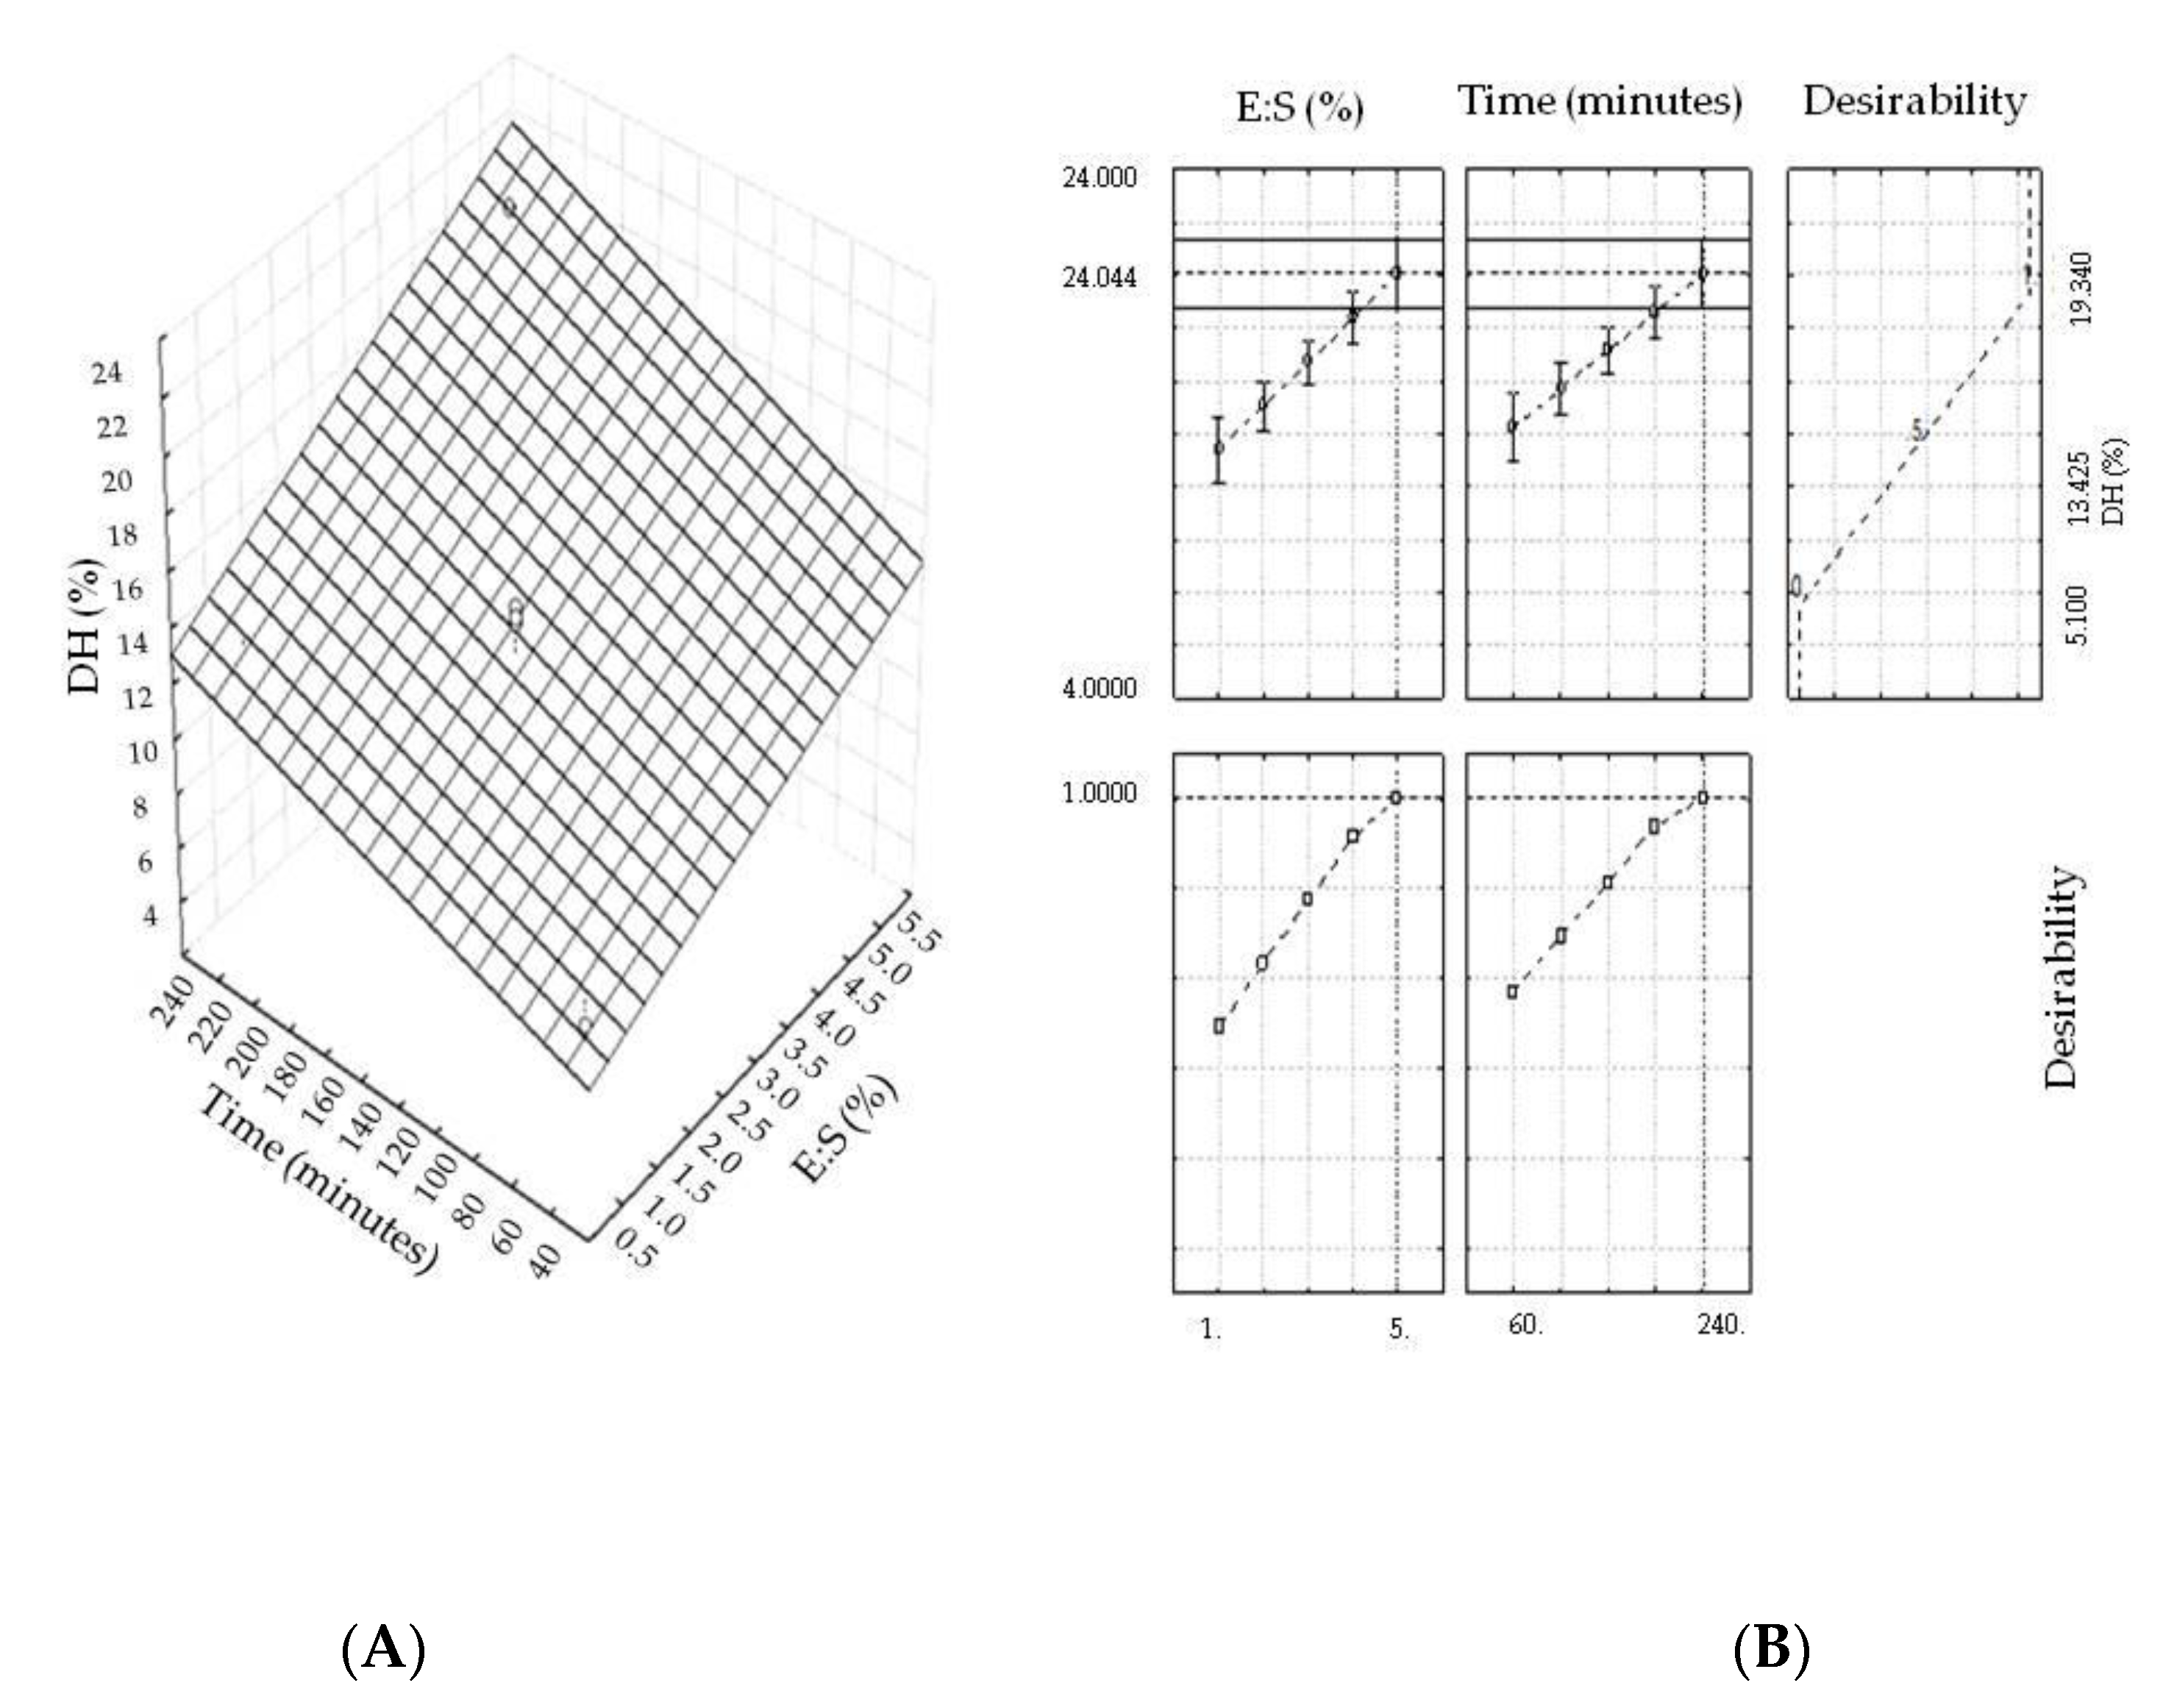
2.1. Optimization of the Hydrolysis Process
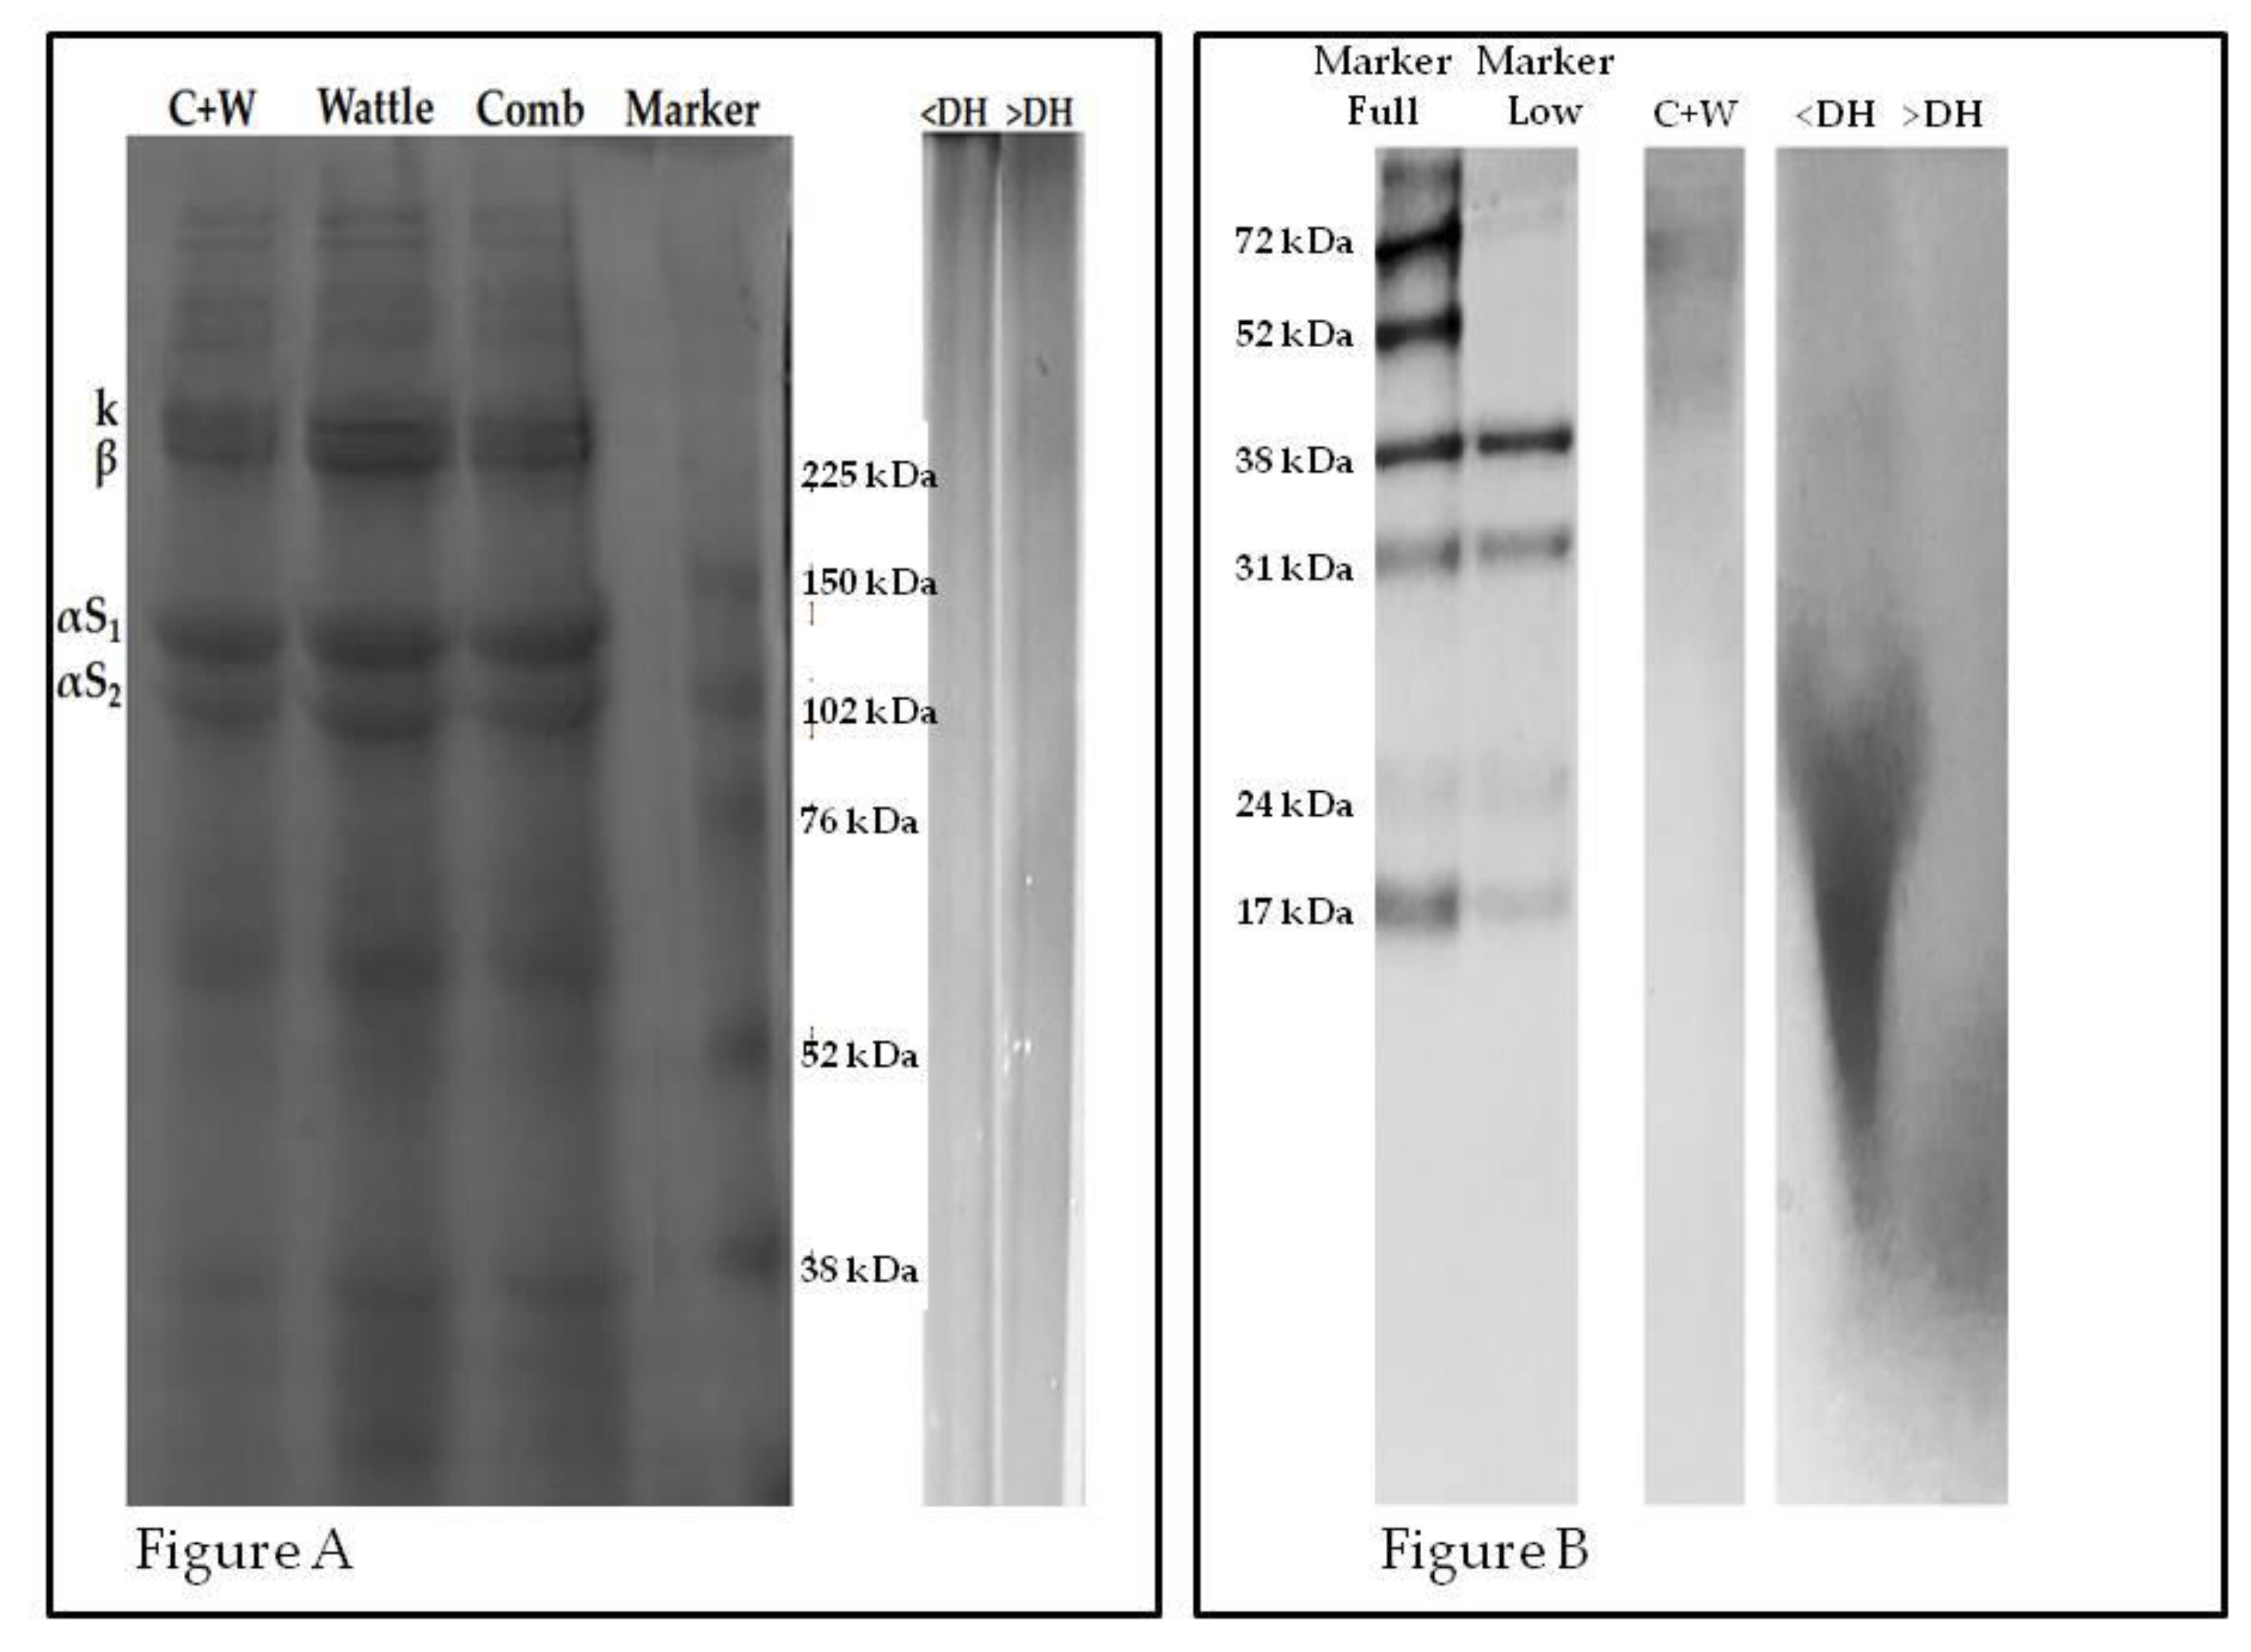
2.2. Electrophoresis Profile
2.3. Profile of Total and Free Amino Acids
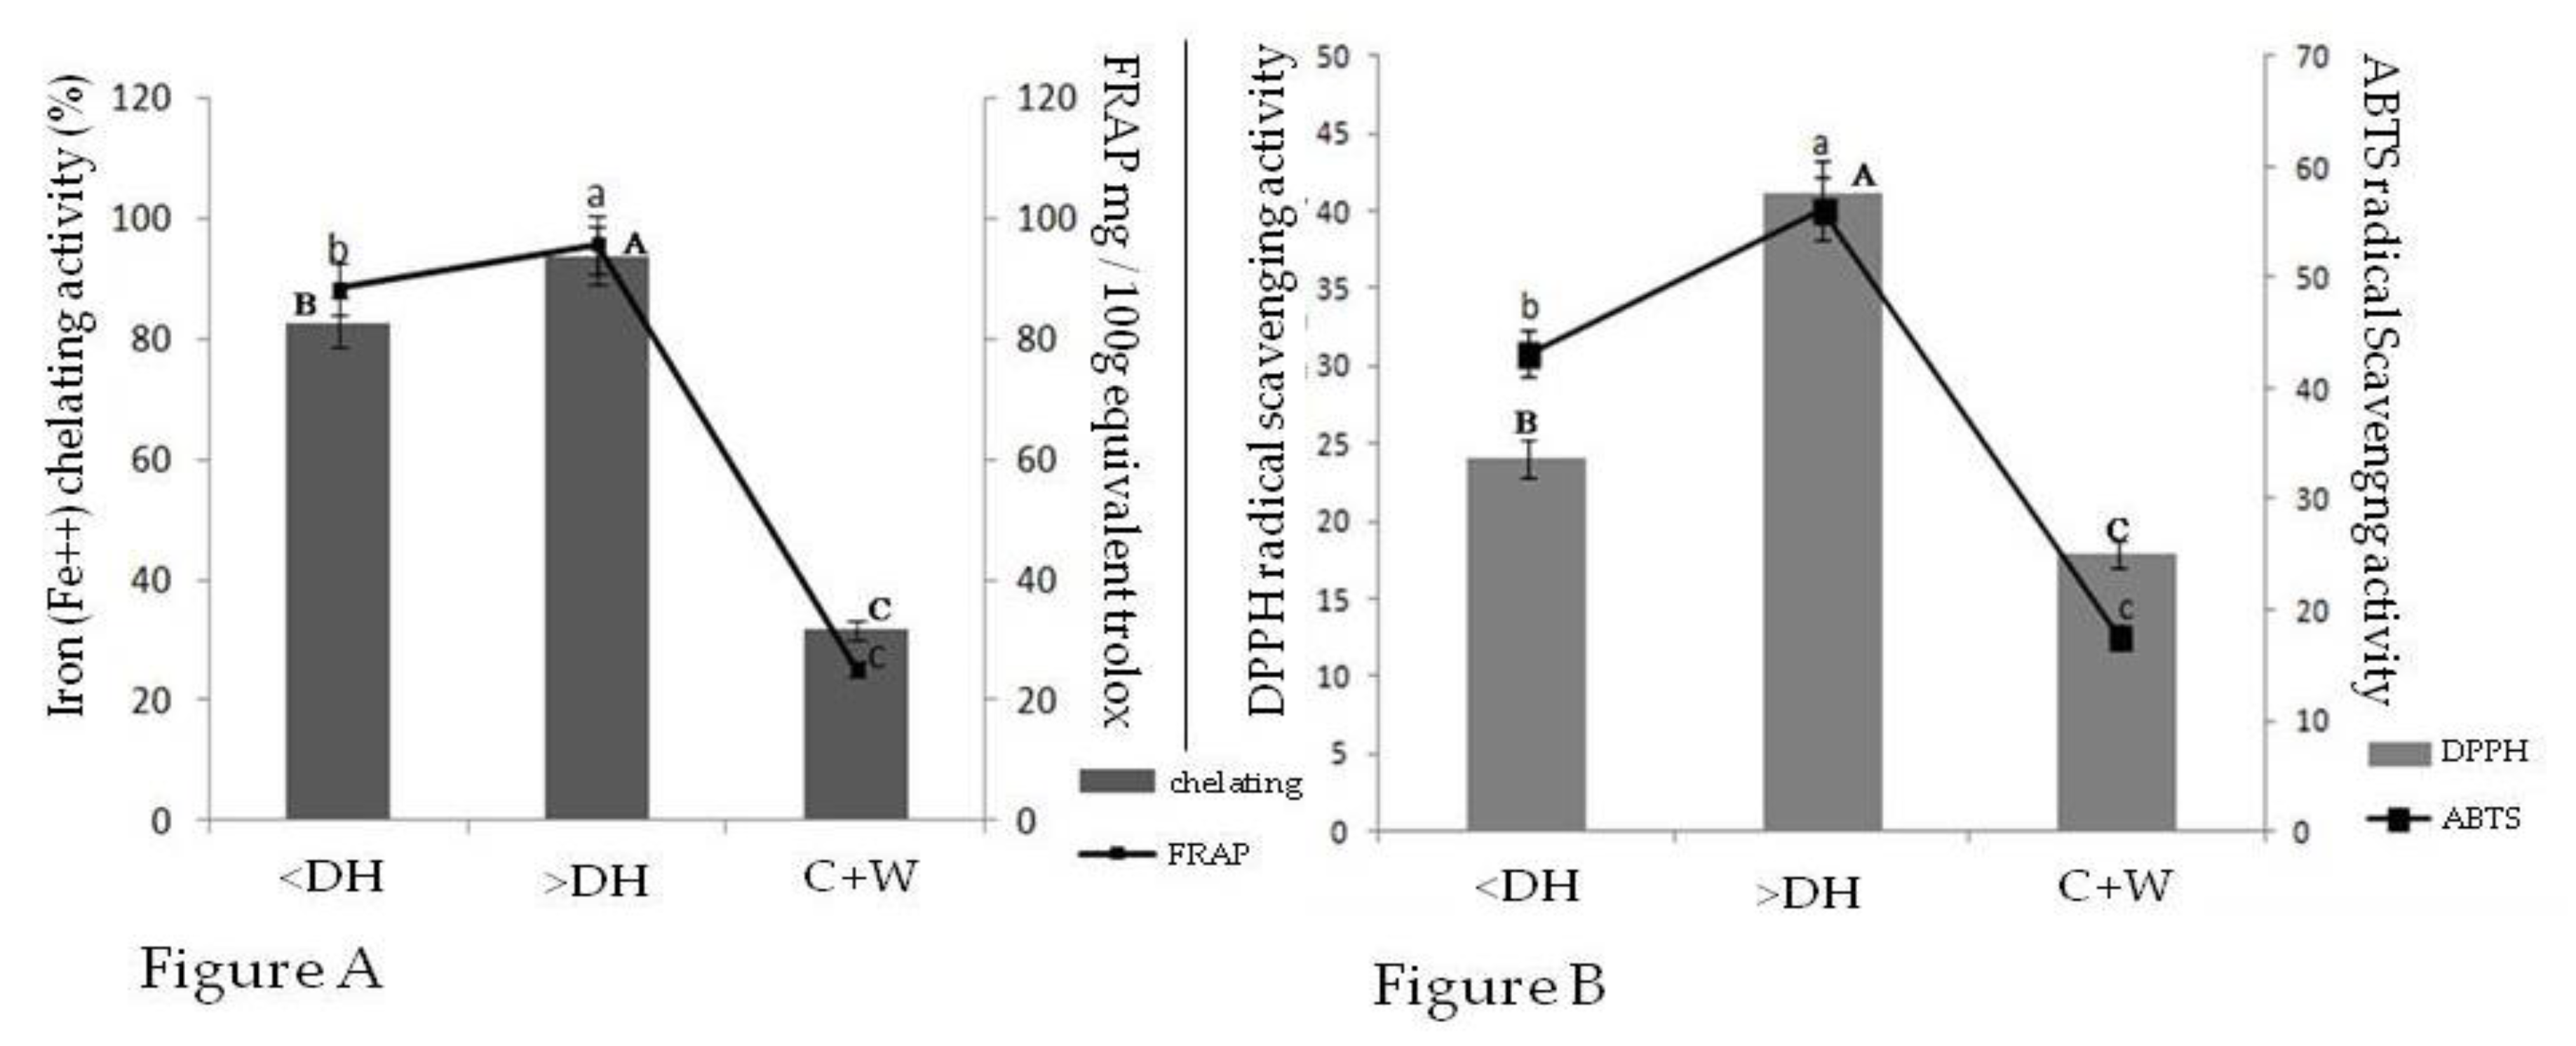
2.4. Fe2+ Chelating Capacity and Fe3+ Reductive Activity
2.5. Sequestering Activity for 2,2-Diphenyl-1-Picrylhydrazyl Radical (DPPH●) and 2,2-Azino-bis (3-Ethylbeothiazoline)-6-Sulphonic Acid (ABTS●)
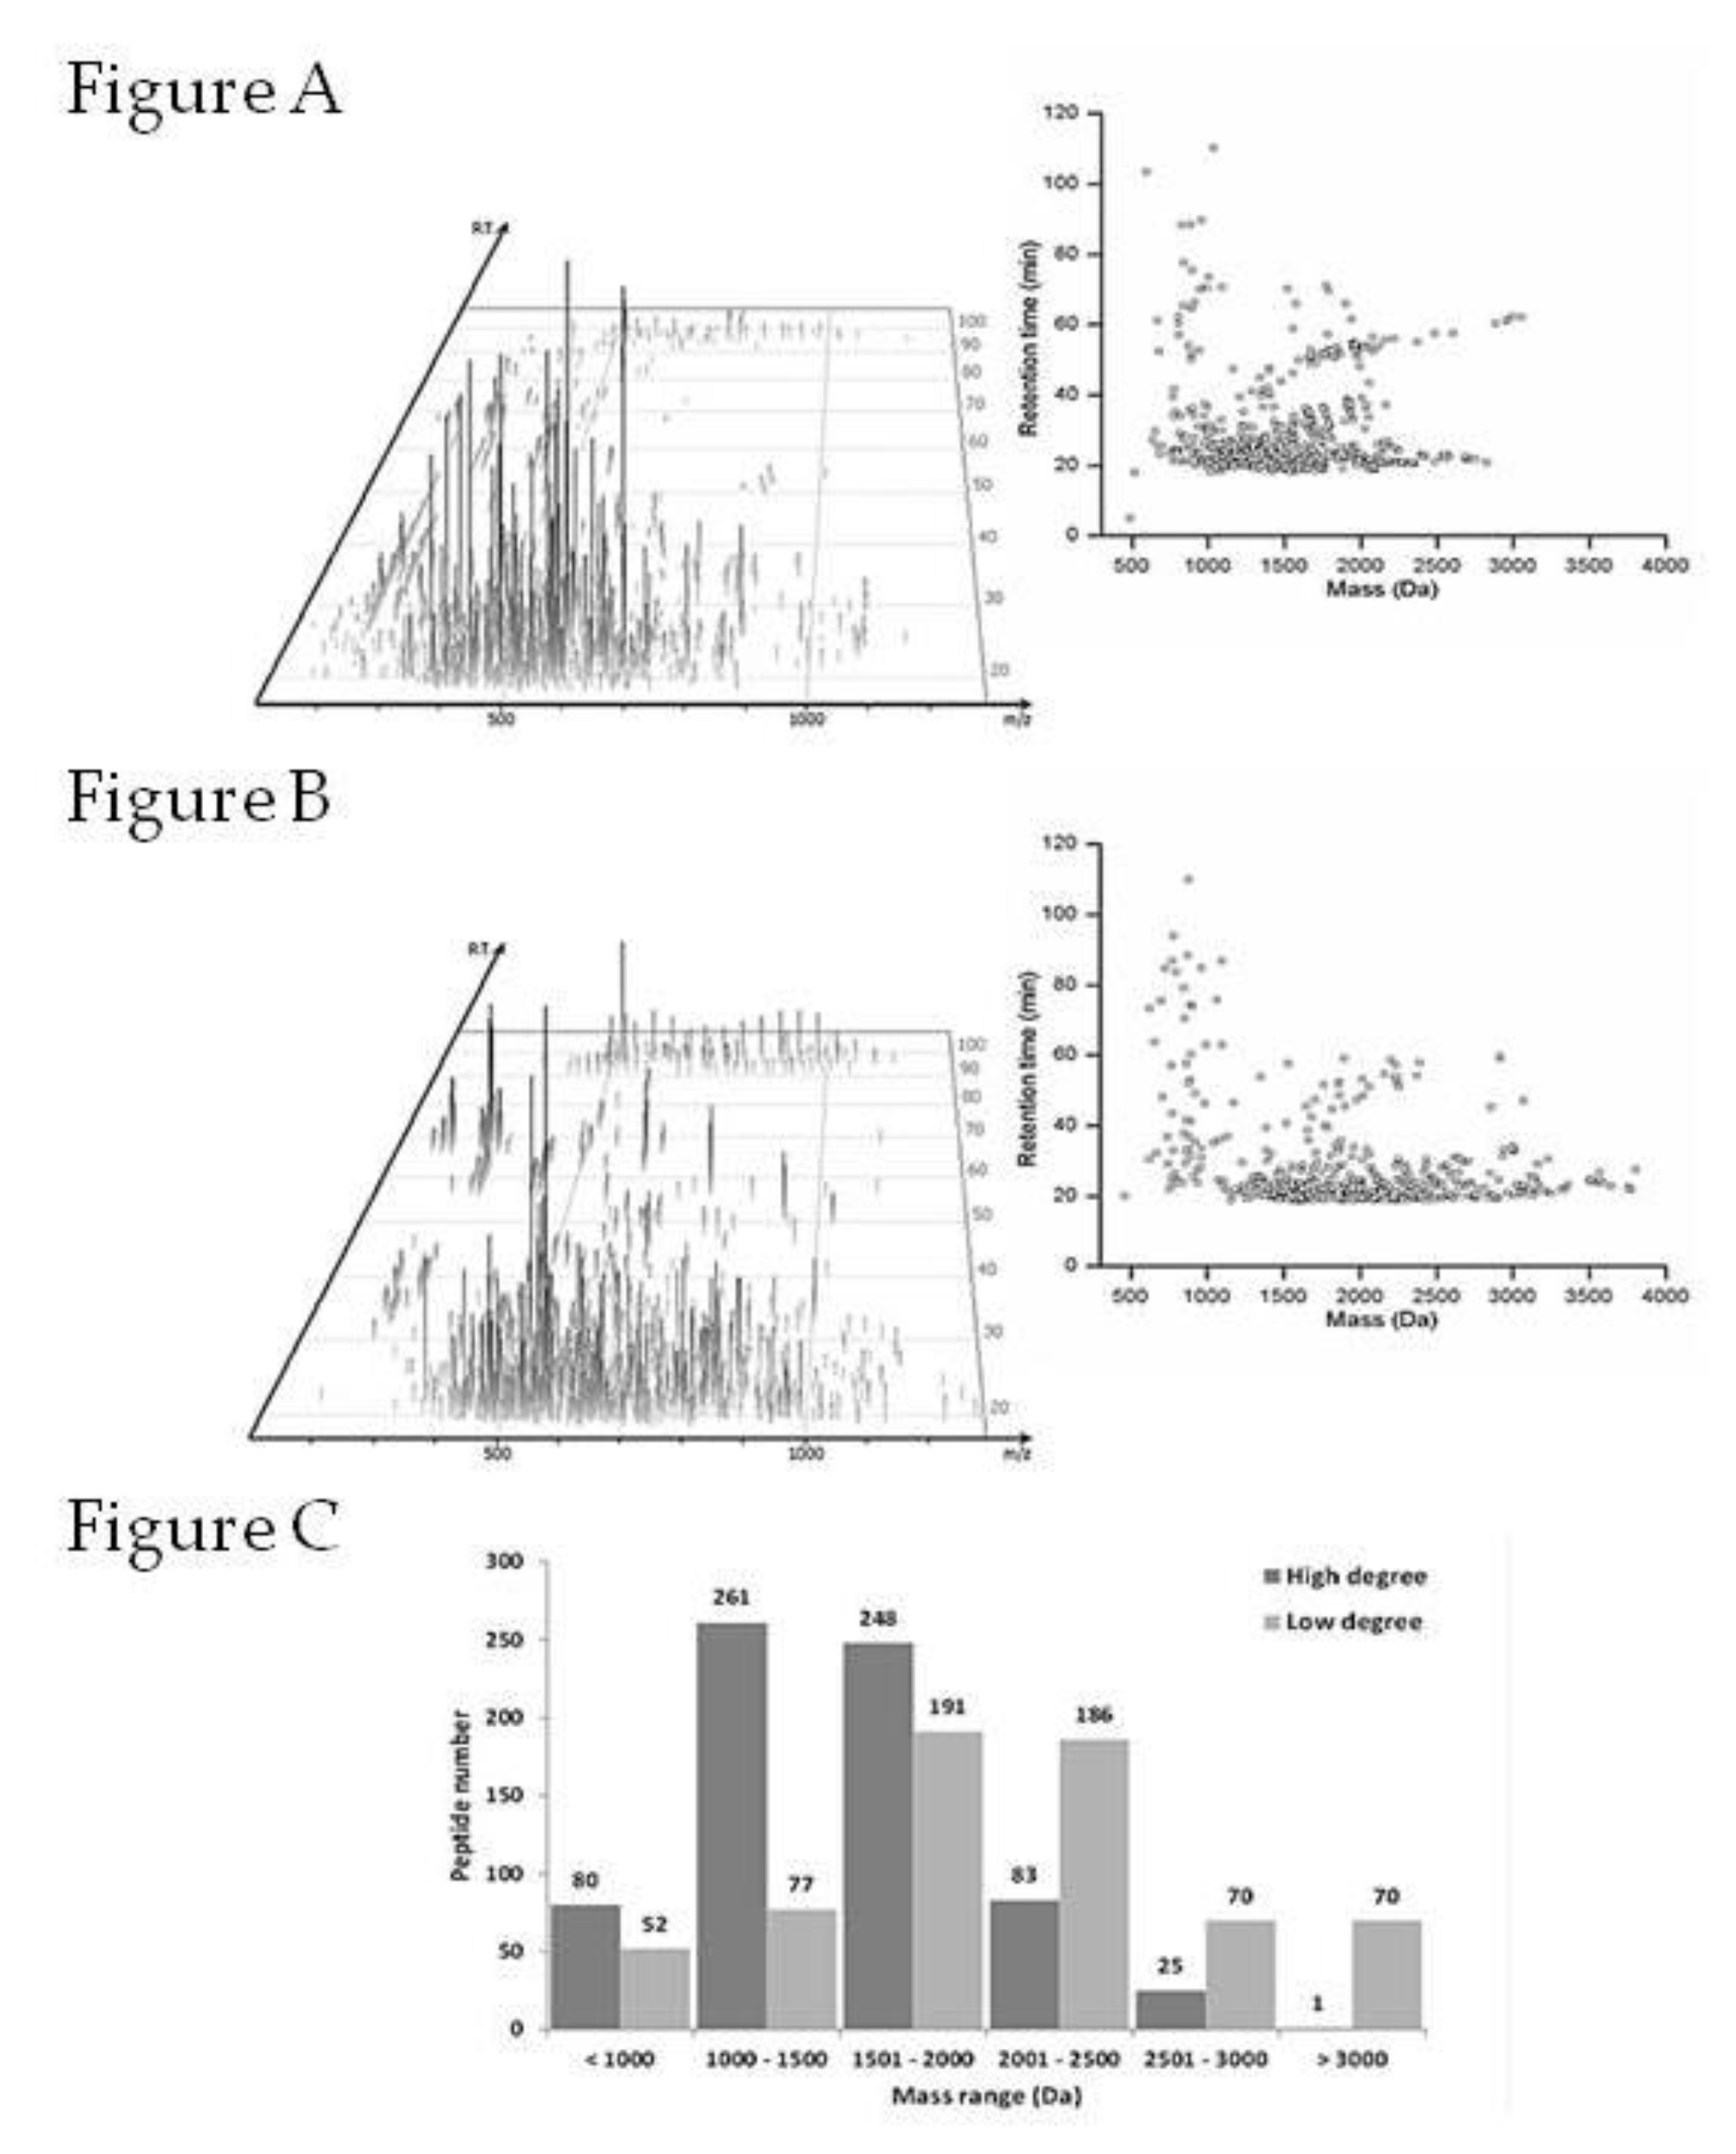
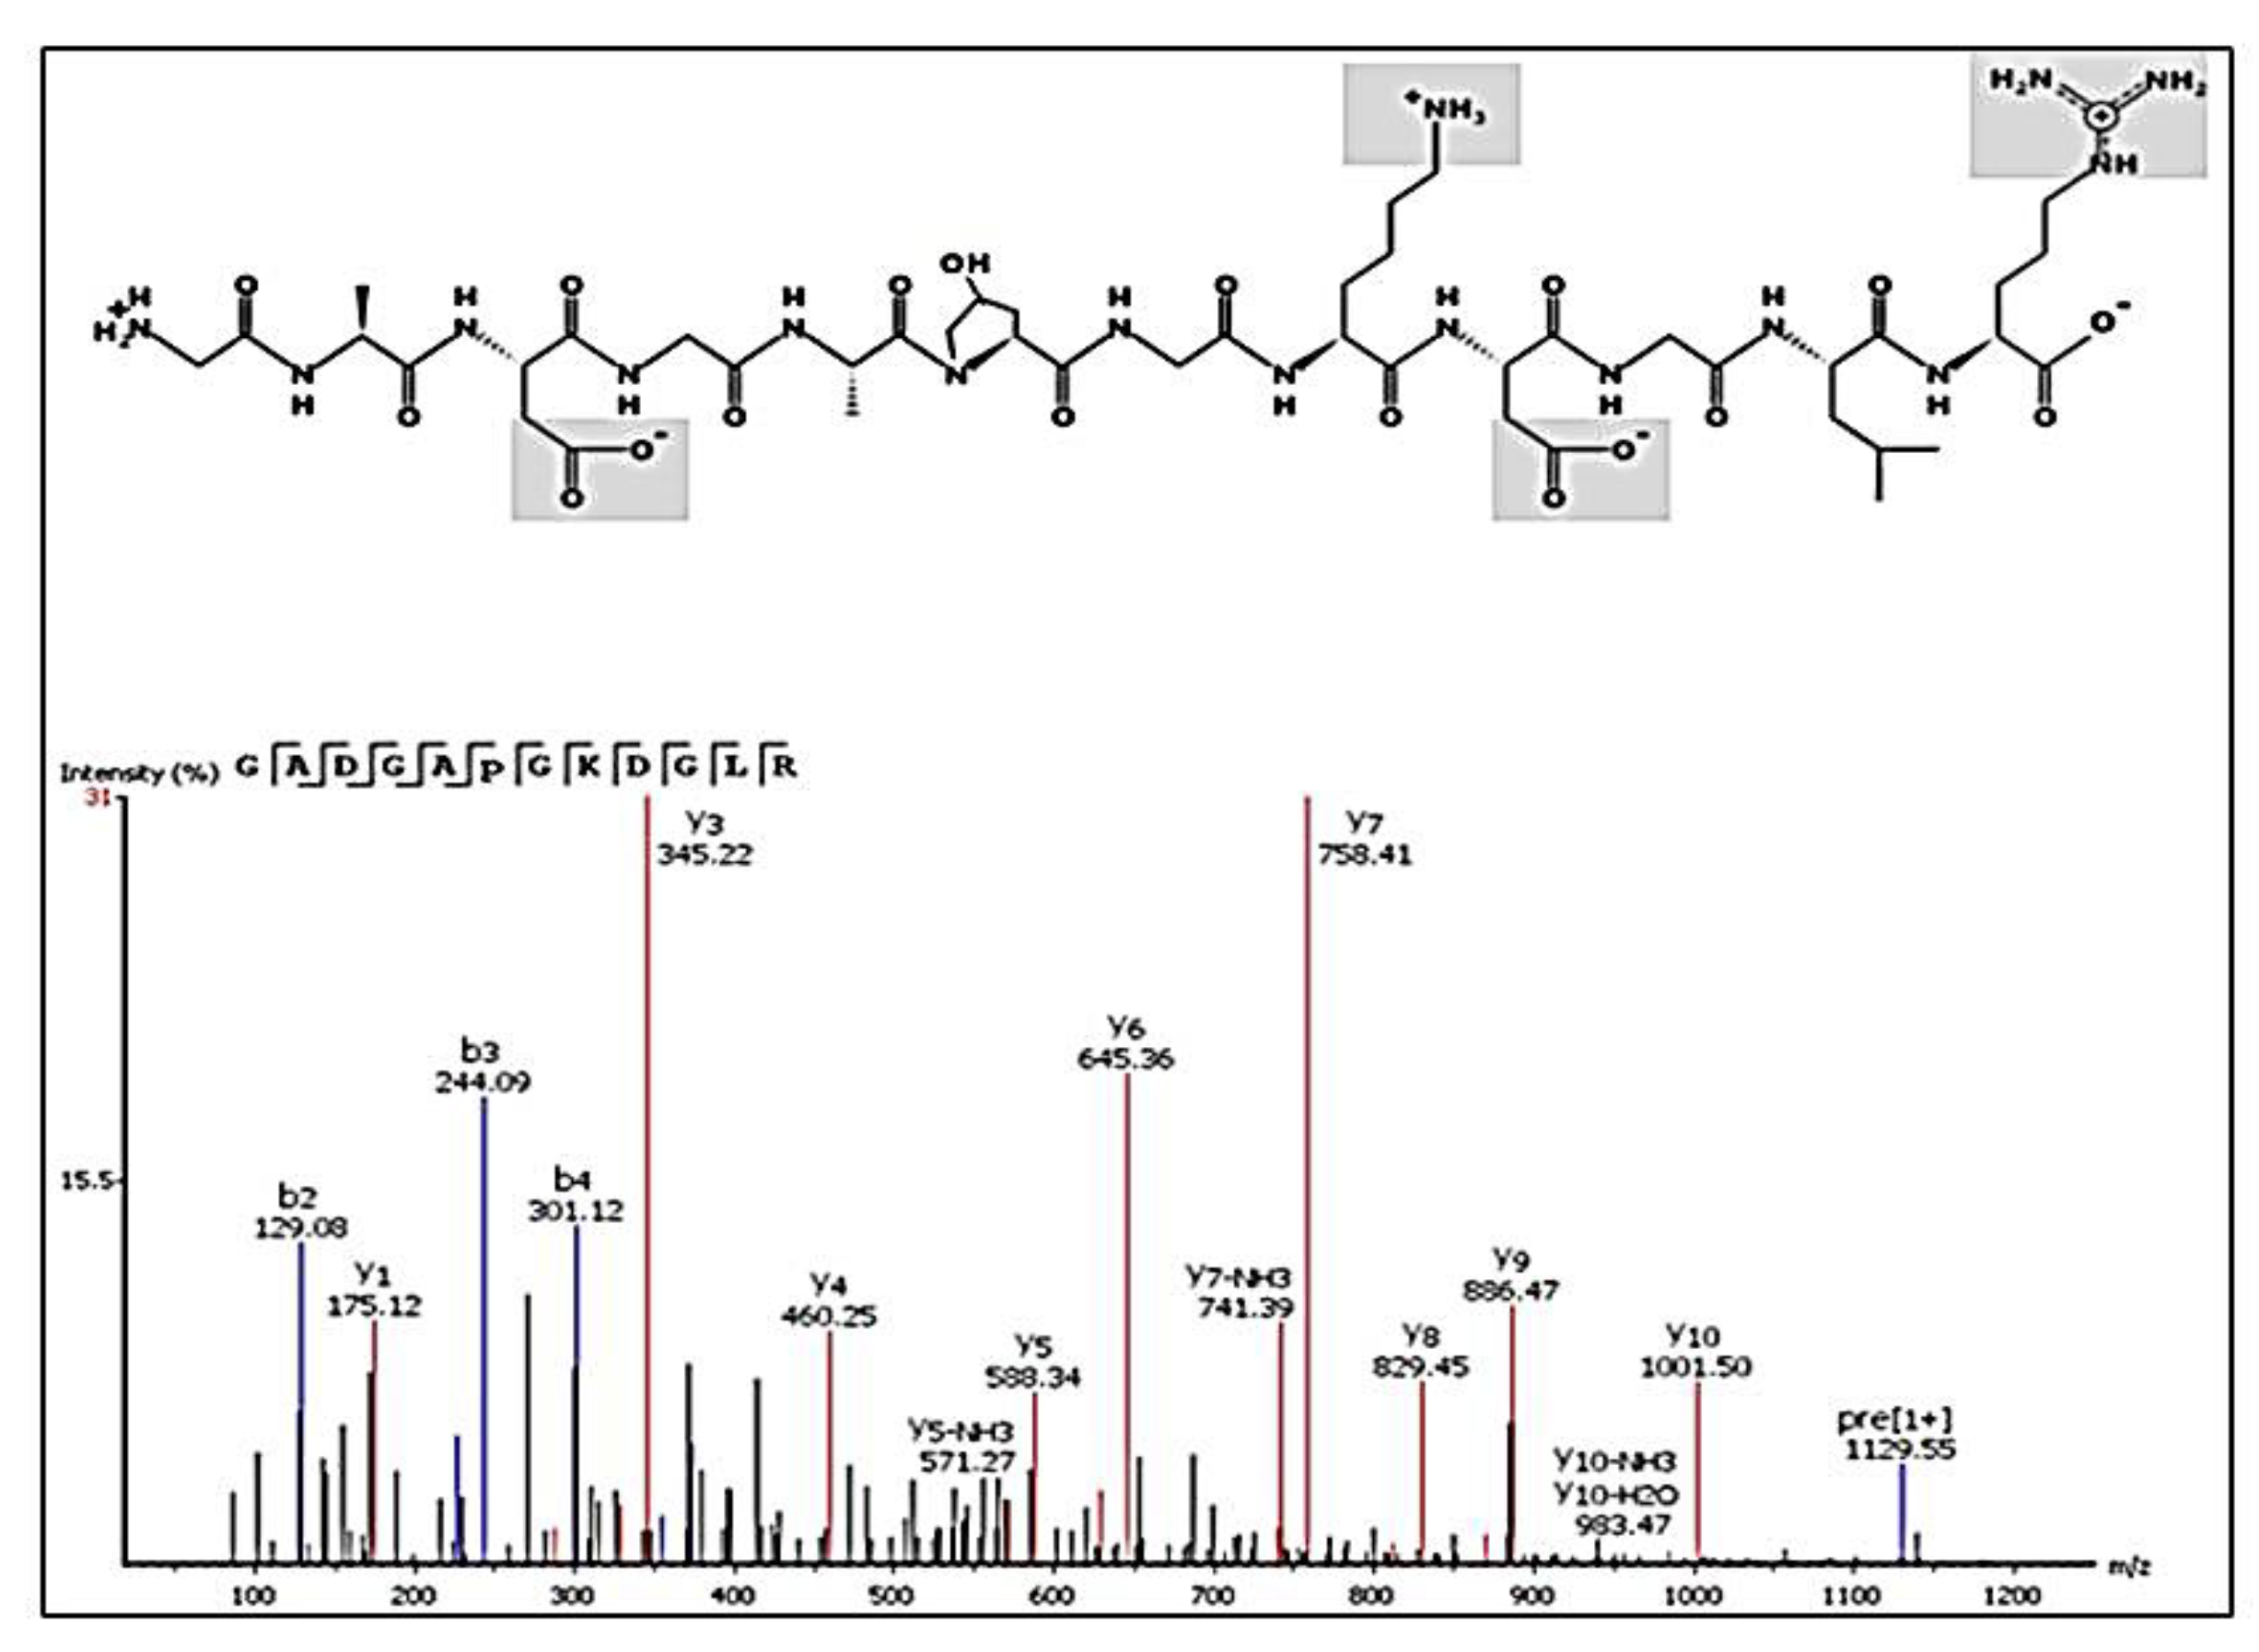
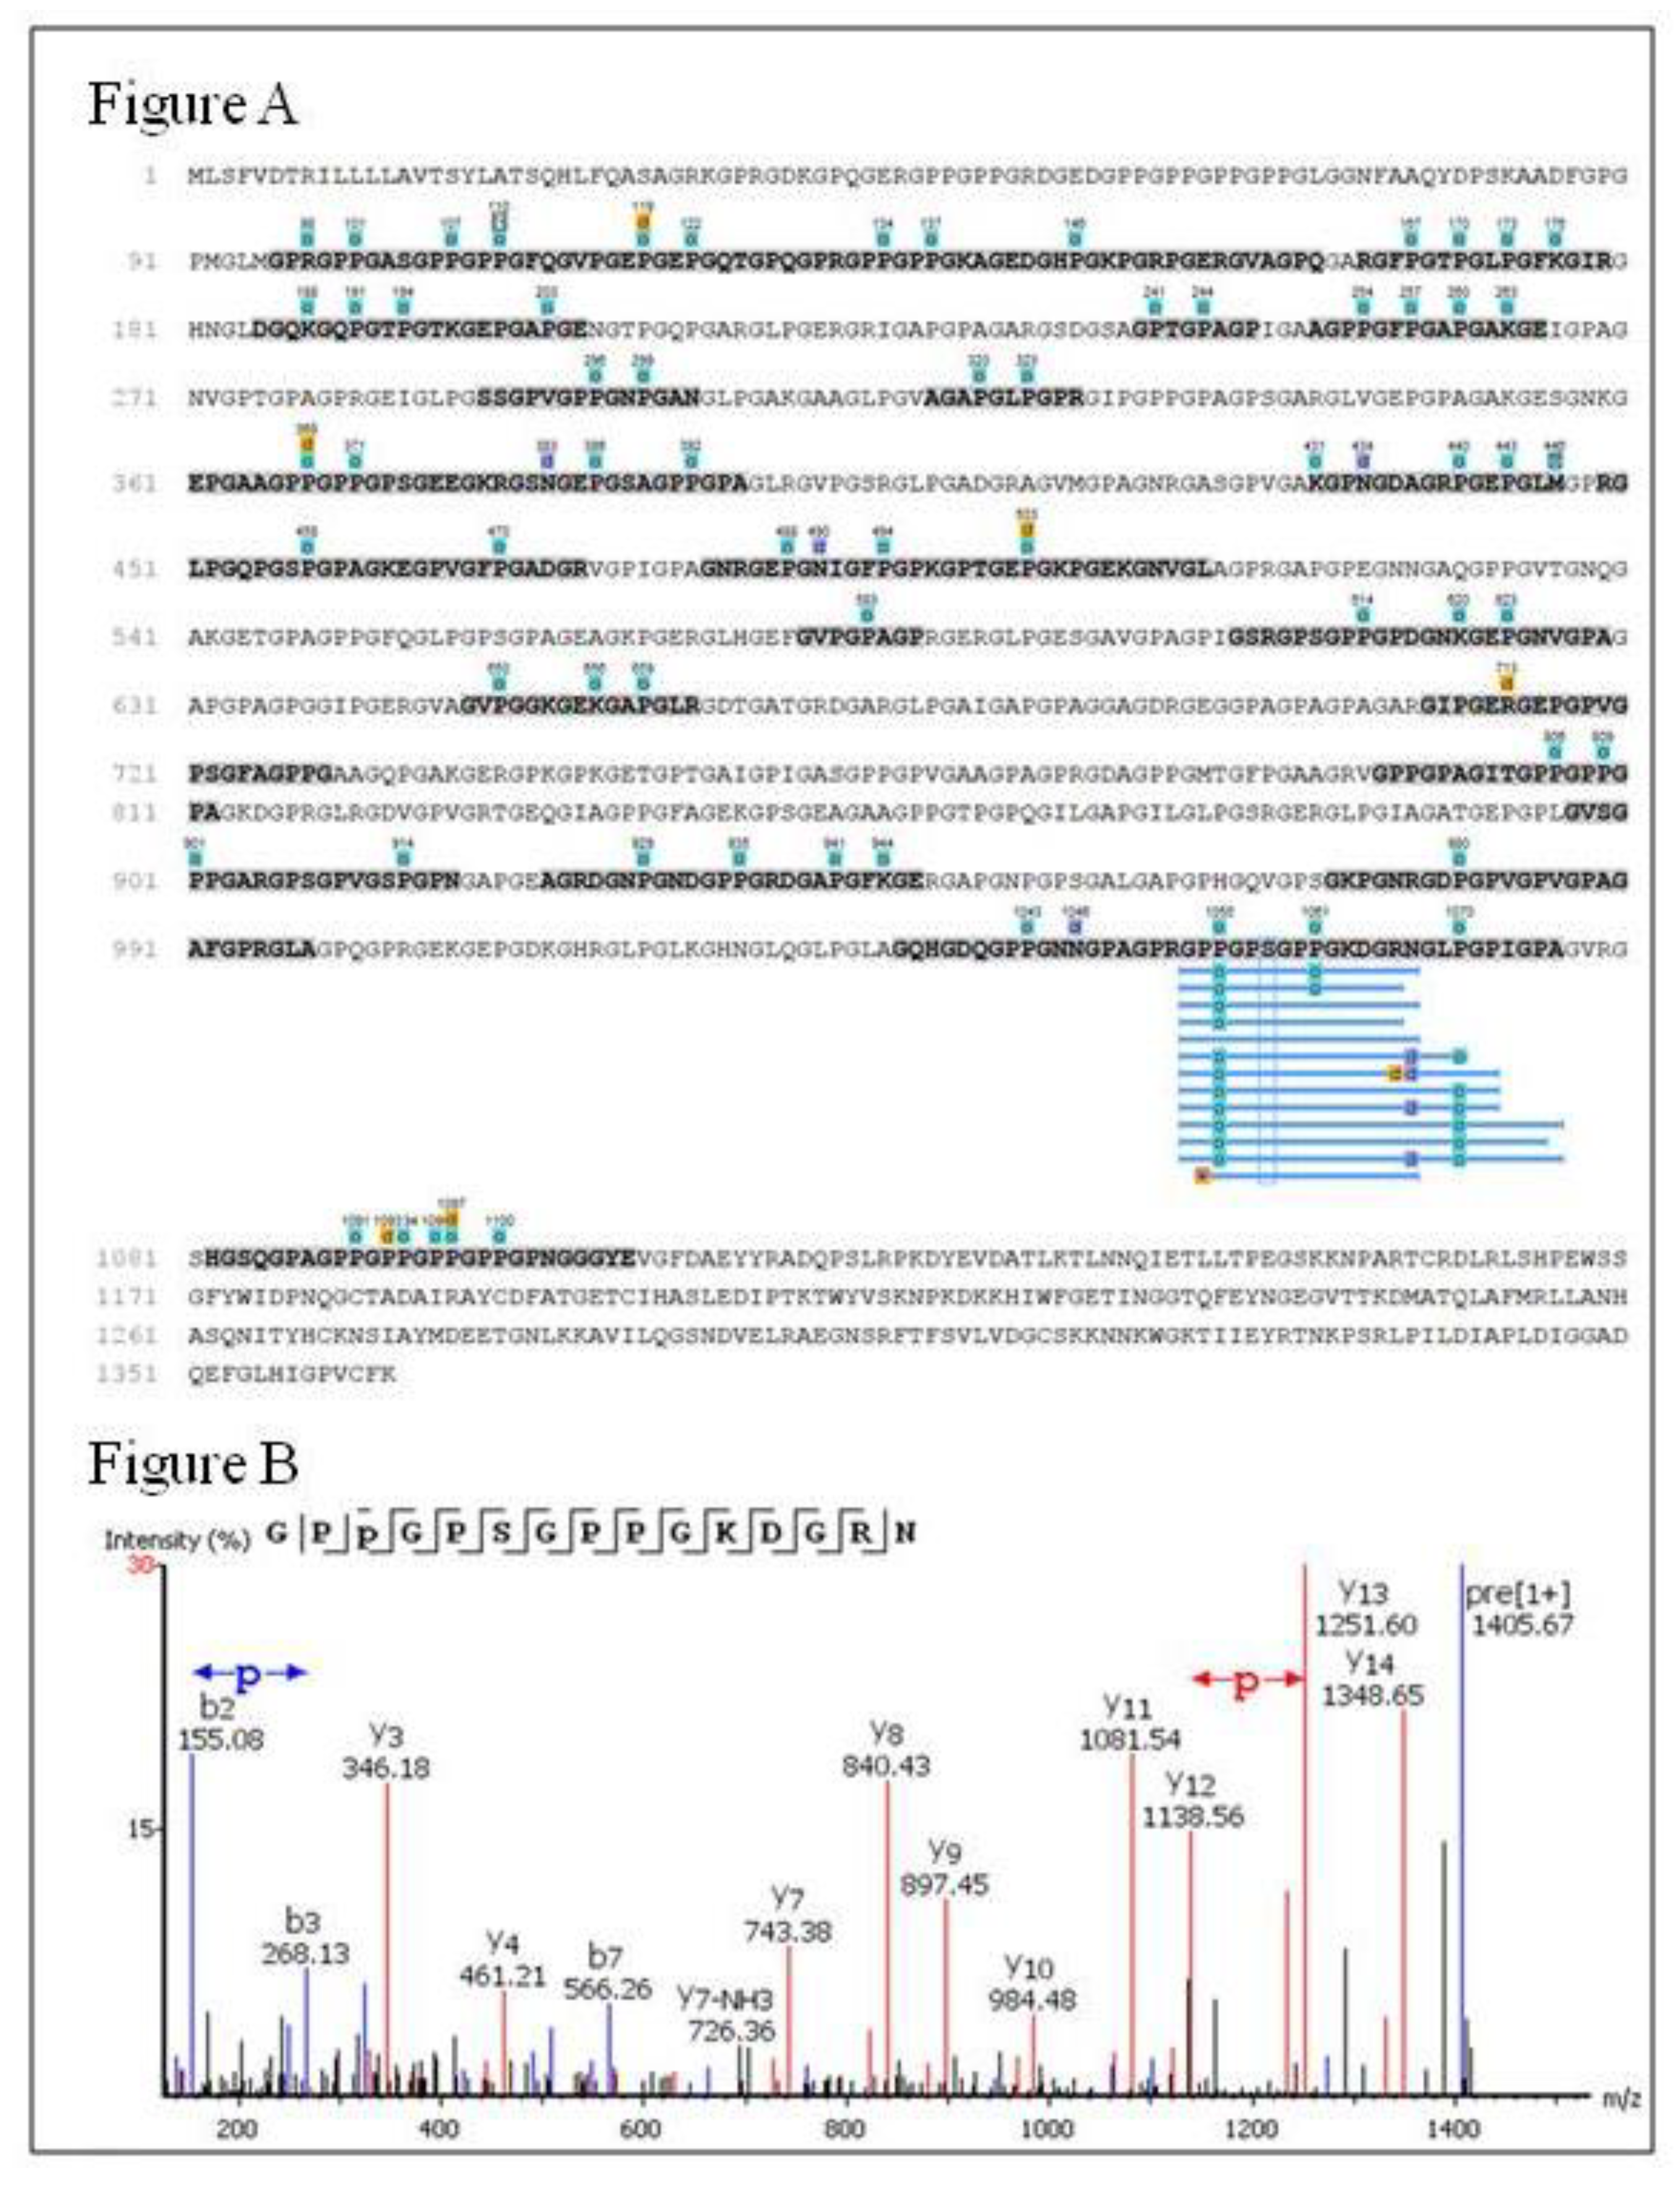
2.6. Peptides Profile Identification from Chicken Comb/Wattle Protein Hydrolysate
3. Materials and Methods
3.1. Materials
3.2. Optimization of Hydrolysis of Extracts from the Chicken Comb + Wattle Mixture
3.3. Production of Enzymatic Hydrolysates
3.4. Electrophoresis
3.5. Profile of Total and Free Amino Acids
3.6. Fe2+ Chelating Capacity
3.7. Ferric Reducing Antioxidant Power (FRAP)
3.8. Sequestering Activity for the 2,2-Diphenyl-1-Picrylhydrazyl Radical (DPPH●)
3.9. Sequestering Activity for the 2,2-Azino-bis (3-Ethylbeothiazoline)-6-Sulphonic Acid Radical (ABTS●+)
3.10. Identification of Peptide Sequences by Nanoflow Liquid Chromatography-Electrospray Ionization-Tandem Mass Spectrometry (nanoLC-ESI-MS/MS) Analysis
3.11. Statistical Analysis
4. Conclusions
Author Contributions
Funding
Acknowledgments
Conflicts of Interest
References
- Borrajo, P.; Pateiro, M.; Barba, F.J.; Mora, L.; Franco, D.; Toldrá, F.; Lorenzo, J.M. Antioxidant and Antimicrobial Activity of Peptides Extracted from Meat By-products: A Review. Food Anal. Meth. 2019, 12, 2401–2415. [Google Scholar] [CrossRef]
- Toldrá, F.; Aristoy, M.C.; Mora, L.; Reig, M. Innovations in value-addition of edible meat by-products. Meat Sci. 2012, 92, 290–296. [Google Scholar] [CrossRef] [PubMed]
- Rosa, C.S.; Hoelzel, S.C.; Viera, V.B.; Barreto, M.; Beirão, L.H. Atividade antioxidante do ácido hialurônico extraído da crista de frango. Ciênc Rural. 2008, 38, 2593–2598. [Google Scholar] [CrossRef]
- Mora, L.; Toldrá, F. Proteomic identification of small (<2000 Da) myoglobin peptides generated in dry-cured ham. Food Technol. Biotechnol. 2012, 50, 343–349. [Google Scholar]
- Mora, L.; Reig, M.; Toldrá, F. Bioactive peptides generated from meat industry by-products. Food Res. Int. 2014, 65, 344–349. [Google Scholar] [CrossRef] [Green Version]
- Bouacem, K.; Bouanane-Darenfed, A.; Laribi-Habchi, H.; Elhoul, M.B.; Hmida-Sayari, A.; Hacene, H.; Ollivier, B.; Fardeau, M.; Jaouadi, B.; Bejar, S. Biochemical characterization of a detergent-stable serine alkalineprotease from Caldicoprobacter guelmensis. Int. J. Biol. Macromol. 2015, 81, 299–307. [Google Scholar] [CrossRef]
- Choi, J.; Sabikhi, L.; Hassan, A.; Anand, S. Bioactive peptides in dairy products International. Int. J. Dairy Technol. 2012, 65, 1–12. [Google Scholar] [CrossRef]
- Lorenzo, J.M.; Munekata, P.E.S.; Gómez, B.; Barba, F.J.; Mora, L.; Pérez-Santaescolástica, C.; Toldrá, F. Bioactive peptides as natural antioxidants in food products—A review. Trends Food Sci. Technol. 2018, 79, 136–147. [Google Scholar] [CrossRef]
- Sarmadi, B.H.; Ismail, A. Antioxidative peptides from food proteins: A review. Peptides 2010, 31, 1949–1956. [Google Scholar] [CrossRef]
- Acquah, C.; Di Stefano, E.; Udenigwe, C.C. Role of hydrophobicity in food peptide functionality and bioactivity. J. Food Bioact. 2018, 4, 88–98. [Google Scholar] [CrossRef] [Green Version]
- Ryan, J.T.; Ross, R.P.; Bolton, D.; Fitzgerald, G.F.; Stanton, C. Bioactive peptides from muscle sources: Meat and fish. Nutrients 2011, 3, 765–791. [Google Scholar] [CrossRef] [PubMed] [Green Version]
- Zhou, C.; Li, Y.; Yu, X.; Yang, H.; Ma, H.; Yagoub, A.E.A.; Cheng, Y.; Hu, J.; Otu, P.N.Y. Extraction and characterization of chicken feet soluble collagen. LWT Food Sci. Technol. 2016, 74, 145–153. [Google Scholar] [CrossRef]
- Sae-Leaw, T.; Karnjanapratum, S.; O’Callaghan, Y.C.; O’Keeffe, M.B.; Fitzgerald, R.J.; O’Brien, N.M.; Bem, S. Purification and identification of antioxidant peptides from gelatin hydrolysate of seabass skin. J. Food Biochem. 2017, 41, e12350. [Google Scholar] [CrossRef]
- Abdelhedi, O.; Jridi, M.; Jemil, I.; Mora, L.; Toldrá, F.; Aristoy, M.; Boualga, A.; Nasri, M.; Nasri, R. Combined biocatalytic conversion of smooth hound viscera: Protein hydrolysates elaboration and assessment of their antioxidant, anti-ACE and antibacterial activities. Food Res. Int. 2016, 86, 9–23. [Google Scholar] [CrossRef]
- Zhan, P.; Tian, H.; Zhang, X.; Wang, L. Contribution to aroma characteristics of mutton process flavor from the enzymatic hydrolysate of sheep bone protein assessed by descriptive sensory analysis and gas chromatography olfactometry. J. Chromatogr. B 2013, 921–922, 1–8. [Google Scholar] [CrossRef]
- Chen, N.; Yang, H.; Sunc, Y.; Niu, J.; Liu, S. Purification and identification of antioxidant peptides from walnut (Juglans regia L.) protein hydrolysates. Peptides 2012, 38, 344–349. [Google Scholar] [CrossRef]
- Zhang, J.H.; Zhang, H.; Wang, L.; Guo, X.N.; Wang, X.G.; Yao, H.Y. Isolation and identification of antioxidative peptides from rice endosperm protein enzymatic hydrolysate by consecutive chromatography and MALDI-TOF/TOF MS/MS. Food Chem. 2010, 119, 226–234. [Google Scholar] [CrossRef]
- Elango, J.; Jingyi, Z.; Wang, N.; He, L.; Bao, B.; Wu, W. Physico-chemical, antioxidant and intestinal absorption properties ofwhale shark type-II collagen based on its solubility with acid and pepsin. Process Biochem. 2015, 50, 463–472. [Google Scholar]
- Alemán, A.; Giménez, B.; Pérez-Santin, E.; Gómez-Guillén, M.; Montero, P. Contribution of Leu and Hyp residues to antioxidant and ACE-inhibitory activities of peptide sequences isolated from squid gelatin hydrolysate. Food Chem. 2011, 125, 334–341. [Google Scholar] [CrossRef] [Green Version]
- Farvin, K.H.S.; Andersen, L.A.; Otte, J.; Nielsen, H.H.; Jessen, F.; Jacobsen, C. Antioxidant activity of cod (Gadus morhua) protein hydrolysates: Fractionation and characterisation of peptide fractions. Food Chem. 2016, 204, 409–419. [Google Scholar] [CrossRef] [Green Version]
- Ngoh, Y.; Gan, C. Enzyme-assisted extraction and identification of antioxidative and α-amylase inhibitory peptides from Pinto beans (Phaseolus vulgaris cv. Pinto). Food Chem. 2016, 190, 331–337. [Google Scholar] [CrossRef] [PubMed]
- Zou, T.; He, T.; Li, H.; Tang, H.; Xia, E. The Structure-Activity Relationship of the Antioxidant Peptides from Natural Proteins. Molecules 2016, 21, 72. [Google Scholar] [CrossRef] [PubMed]
- Samaranayaka, A.G.P.; Li-Chan, E.C.Y. Food-derived peptidic antioxidants: A review of their production, assessment, and potential applications. J. Funct. Foods 2011, 3, 229–254. [Google Scholar] [CrossRef]
- Shazly, A.B.; He, Z.; El-Aziz, M.A.; Zeng, M.; Zhang, S.; Qin, F.; Chen, J. Fractionation and identification of novel antioxidant peptides from buffalo and bovine casein hydrolysates. Food Chem. 2017, 232, 753–762. [Google Scholar] [CrossRef] [PubMed]
- Sun, N.; Cui, P.; Jin, J.; Wu, H.; Wang, Y.; Lin, S. Contributions of molecular size, charge distribution, and specific amino acids to the iron-binding capacity of sea cucumber (Stichopus japonicus) ovum hydrolysates. Food Chem. 2017, 230, 627–636. [Google Scholar] [CrossRef] [PubMed]
- Song, H.; Zhang, L.; Luo, Y.; Zhang, S.; Li, B. Effects of collagen peptides intake on skin ageing and platelet release in chronologically aged mice revealed by cytokine array analysis. J. Cell. Mol. Med. 2018, 22, 277–288. [Google Scholar] [CrossRef] [Green Version]
- Yazaki, M.; Ito, Y.; Yamada, M.; Goulas, S.; Teramoto, S.; Nakaya, M.; Ohno, S.; Yamaguchi, K. Oral Ingestion of Collagen Hydrolysate Leads to the Transportation of Highly Concentrated Gly-Pro-Hyp and Its Hydrolyzed Form of Pro-Hyp into the Bloodstream and Skin. J. Agric. Food Chem. 2017, 65, 2315–2322. [Google Scholar] [CrossRef] [Green Version]
- De Luca, C.; Mikhal’chik, E.V.; Suprun, M.V.; Papacharalambous, M.; Truhanov, A.I.; Korkina, L.G. Skin Antiageing and Systemic Redox Effects of Supplementation with Marine Collagen Peptides and Plant-Derived Antioxidants: A Single-Blind Case-Control Clinical Study. Oxid. Med. Cell. Longev. 2016, 2016, 4389410. [Google Scholar] [CrossRef] [Green Version]
- Adler-Nissen, J. Enzymic Hydrolysis of Food Proteins; Elsevier Applied Science Publishers: New York, NY, USA, 1986. [Google Scholar]
- Laemmli, U.K. Cleavage of structural proteins during the assembly of the head of bacteriophage T4. Nature 1970, 227, 680. [Google Scholar] [CrossRef]
- Schagger, H.; Joagow, V. Tricine-sodium dodecyl sufate-polyacrylamide gel electrophoresis for the separation of proteins in the range from 1 to 100 kDa. Anal. Biochem. 1987, 166, 368–379. [Google Scholar] [CrossRef]
- White, J.A.; Hart, R.J.; Fry, J.C. An evaluation of the Waters Pico-Tag system for the amino-acid analysis of food materials. J. Anal. Methods Chem. 1986, 8, 170–177. [Google Scholar] [CrossRef] [PubMed] [Green Version]
- Hagen, S.R.; Frost, B.; Augustin, J. Pre column phenylisothiocyanate derivatization and liquid chromatography of amino acids in food. J. Assoc. Off. Anal. Chem. 1989, 72, 912–916. [Google Scholar] [PubMed]
- Stookey, L.L. Ferrozine-a new spectrophotometric reagent for iron. Anal. Chem. 1970, 42, 779–781. [Google Scholar] [CrossRef] [Green Version]
- Benzie, I.F.F.; Strain, J.J. Ferric reducing/antioxidant power assay: Direct measure of total antioxidant activity of biological fluids and modified version for simultaneous measurement of total antioxidant power and ascorbic acid concentration. Methods Enzymol. 1999, 299, 15–27. [Google Scholar] [PubMed]
- Brand-Wiliams, W.; Cuvelier, M.E.; Berset, C. Use of a free radical method to evaluate antioxidant activity. Food Sci. Technol. 1995, 28, 25–30. [Google Scholar] [CrossRef]
- Re, R.; Pellegrini, N.; Proteggente, A.; Pannala, A.; Yang, M.; Rice-Evans, C. Antioxidant activity applying an improved ABTS radical cation decolorization assay. Free Radic. Biol. Med. 1999, 26, 1231–1237. [Google Scholar] [CrossRef]
- Zhang, J.; Xin, L.; Shan, B.; Chen, W.; Xie, M.; Yuen, D.; Zhang, W.; Zhang, Z.; Lajoie, G.A.; Ma, B. PEAKS DB: De Novo sequencing assisted database search for sensitive and accurate peptide identification. Mol. Cell. Proteomics 2012, 11, M111.010587. [Google Scholar] [CrossRef] [Green Version]
- UNIPROT. Available online: http://www.uniprot.org/ (accessed on 10 November 2017).
- Statsoft Inc. Statistica (Data Analysis Software System); Version 5.0; Statsoft Inc.: Tusa, OK, EUA, 2004. [Google Scholar]
- SAS Institute. SAS User's Guide: Statistics; Version 11.0; SAS Institute: Cary, NC, USA, 2014. [Google Scholar]
Sample Availability: Samples of the protein hydrolysates are available from the authors. |


| Amino Acids | Total Amino Acids | Free Amino Acids | |||
|---|---|---|---|---|---|
| C + W | <DH | >DH | <DH | >DH | |
| Hydrophobic | |||||
| Glycine | 9.05 b ± 0.02 | 11.76 a ± 0.09 | 8.82 c ± 0.00 | 0.76 b ± 0.01 | 1.37 a ± 0.01 |
| Alanine | 4.82 b ± 0.00 | 5.38 a ± 0.02 | 4.09 c ± 0.00 | 1.03 b ± 0.00 | 1.90 a ± 0.01 |
| Leucine | 2.88 c ± 0.00 | 3.60 a ± 0.02 | 2.95 b ± 0.00 | 1.25 b ± 0.01 | 2.02 a ± 0.01 |
| Methionine | 0.84 c ± 0.00 | 1.22 a ± 0.02 | 0.99 b ± 0.00 | 0.39 b ± 0.01 | 0.74 a ± 0.02 |
| Isoleucine | 0.32 c ± 0.00 | 2.09 a ± 0.00 | 1.74 b ± 0.00 | 0.56 b ± 0.01 | 0.95 a ± 0.01 |
| Phenylalanine | 0.90 c ± 0.03 | 1.80 a ± 0.01 | 1.49 b ± 0.00 | 0.65 b ± 0.00 | 1.02 a ± 0.01 |
| Hydroxyproline | 4.18 c ± 0.01 | 6.45 a ± 0.04 | 4.70 b ± 0.00 | ND | ND |
| Proline | 5.70 b ± 0.01 | 6.82 a ± 0.03 | 5.07 c ± 0.00 | 0.54 b ± 0.00 | 0.62 a ± 0.01 |
| Serine | 3.96 a ± 0.00 | 2.60 b ± 0.02 | 2.12 c ± 0.00 | 0.39 b ± 0.00 | 0.79 a ± 0.01 |
| Tyrosine | 0.69 c ± 0.00 | 1.17 a ± 0.00 | 0.99 b ± 0.00 | 0.33 b ± 0.00 | 0.74 a ± 0.00 |
| Threonine | 1.93 c ± 0.03 | 2.57 a ± 0.02 | 2.06 b ± 0.00 | 0.54 b ± 0.01 | 1.08 a ± 0.00 |
| Valine | 0.94 c ± 0.00 | 2.67 a ± 0.00 | 2.23 b ± 0.00 | 0.78 b ± 0.00 | 1.30 a ± 0.01 |
| Tryptophan | ND | ND | ND | 0.59a ± 0.01 | 0.53a ± 0.05 |
| Total | 36.20 c ± 0.00 | 48.12 a ± 0.02 | 37.2 4b ± 0.00 | 7.78 b ± 0.00 | 13.03 a ± 0.02 |
| Hydrophilic | |||||
| Aspartic acid | 7.38 a ± 0.00 | 6.03 b ± 0.02 | 4.85 c ± 0.00 | 0.64 b ± 0.00 | 1.02 a ± 0.01 |
| Glutamic acid | 10.01 a ± 0.00 | 9.12 b ± 0.05 | 7.05 c ± 0.00 | 1.22 b ± 0.00 | 1.92 a ± 0.01 |
| Arginine | 4.37 c ± 0.00 | 5.53 a ± 0.02 | 4.55 b ± 0.00 | 0.63 b ± 0.01 | 1.93 a ± 0.01 |
| Histidine | 0.66 a ± 0.04 | 0.32 b ± 0.09 | 0.23 b ± 0.00 | 0.08 a ± 0.01 | 0.09 a ± 0.05 |
| Lysine | 1.95 c ± 0.01 | 3.56 a ± 0.03 | 2.80 b ± 0.00 | 0.88 b ± 0.01 | 1.34 a ± 0.01 |
| Total | 24.37 a ± 0.00 | 24.56 a ± 0.03 | 19.48 b ± 0.00 | 3.45 b ± 0.00 | 6.30 a ± 0.02 |
| Peptide Sequences | Mass (Da) | Length | ppm | AUC |
|---|---|---|---|---|
| High Degree Hydrolysis | ||||
| GLP(+15.99)GPIGP(+15.99)P(+15.99)GPR | 1161.61 | 12 | −5.9 | 5.26 × 10⁷ |
| GAP(+15.99)GDRGEP(+15.99)GPP(+15.99)GPA | 1378.61 | 15 | −7.7 | 2.94 × 10⁷ |
| RGFP(+15.99)GLP(+15.99)GPS | 1015.50 | 10 | −7.2 | 2.14 × 10⁷ |
| GDIGGP(+15.99)GFP(+15.99)GPK | 1129.54 | 12 | −9.1 | 2.05 × 10⁷ |
| GAP(+15.99)GLP(+15.99)GPR | 852.445 | 9 | −9.6 | 1.59 × 10⁷ |
| GKDGLNGLP(+15.99)GPIGP(+15.99)P(+15.99)GPR | 1745.90 | 18 | −6 | 1.31 × 10⁷ |
| GPP(+31.99)GPPGPP(+15.99)GPP(+15.99)GPPSGGF | 1685.76 | 19 | −4.6 | 1.22 × 10⁷ |
| RGPGGPP(+15.99)GTP(+15.99)GPA | 1148.55 | 13 | −7.9 | 1.18 × 10⁷ |
| N(+.98)GDAGRP(+31.99)GEPGLM | 1302.55 | 13 | −7.1 | 1.16 × 10⁷ |
| GEP(+15.99)GRSGPP(+15.99)GPAGPR | 1419.68 | 15 | −8.8 | 1.14 × 10⁷ |
| Low Degree Hydrolysis | ||||
| TIGIGDIFDQPEQSETL | 1861.89 | 17 | −7 | 2.72 × 10⁷ |
| GVDTKYVPPPFNPDMFSF | 2056.96 | 18 | −7.8 | 2.46 × 10⁷ |
| GARGPAGPQGPRGDK(+15.99)GETGEQGDRGMK(+15.99)GH | 2891.34 | 29 | −9.5 | 1.24 × 10⁷ |
| GDRGDP(+15.99)GPKGADGAPGKDGLRGL | 2178.07 | 23 | −8.9 | 7.89 × 10⁶ |
| GLP(+15.99)GQPGSP(+31.99)GPAGKEGPVGFP(+15.99)GADGRVGPIGPA | 3013.48 | 33 | −7.4 | 7.23 × 10⁶ |
| GPAGPQGPRGDK(+15.99)GETGEQGDRGMK(+15.99)GH | 2607.18 | 26 | −9.8 | 7.03 × 10⁶ |
| GPAGNRGASGPVGAKGPNGDAGRP(+15.99)GEP(+15.99)GLMGPR | 3042.48 | 33 | −9.1 | 6.65 × 10⁶ |
| GFP(+15.99)GADGIAGPKGPP(+15.99)GE | 1554.73 | 17 | −9.8 | 6.33 × 10⁶ |
| P(+15.99)GADGIAGPKGPP(+31.99)GER(+31.99) | 1554.72 | 16 | −8.5 | 6.33 × 10⁶ |
| GNRGEP(+15.99)GNIGFP(+15.99)GPKGPTGEPGKP(+31.99)GEKGNVGLAGPR | 3515.75 | 36 | −9.7 | 6.20 × 10⁶ |
| Assay | Independent Variables and Variation Levels | Response Function (Y) | |
|---|---|---|---|
| Enzyme to Substrate Ratio (%) | Hydrolysis Time (minutes) | Degree of Hydrolysis (%) | |
| 1 | −(1) | −(60) | 7.51 |
| 2 | +(5) | −(60) | 13.55 |
| 3 | −(1) | +(240) | 12.19 |
| 4 | +(5) | +(240) | 19.34 |
| 5 | 0(3) | 0(150) | 14.90 |
| 6 | 0(3) | 0(150) | 14.29 |
| 7 | 0(3) | 0(150) | 14.53 |
© 2020 by the authors. Licensee MDPI, Basel, Switzerland. This article is an open access article distributed under the terms and conditions of the Creative Commons Attribution (CC BY) license (http://creativecommons.org/licenses/by/4.0/).
Share and Cite
Bezerra, T.; Estévez, M.; Lacerda, J.T.; Dias, M.; Juliano, M.; Mendes, M.A.; Morgano, M.; Pacheco, M.T.; Madruga, M. Chicken Combs and Wattles as Sources of Bioactive Peptides: Optimization of Hydrolysis, Identification by LC-ESI-MS2 and Bioactivity Assessment. Molecules 2020, 25, 1698. https://0-doi-org.brum.beds.ac.uk/10.3390/molecules25071698
Bezerra T, Estévez M, Lacerda JT, Dias M, Juliano M, Mendes MA, Morgano M, Pacheco MT, Madruga M. Chicken Combs and Wattles as Sources of Bioactive Peptides: Optimization of Hydrolysis, Identification by LC-ESI-MS2 and Bioactivity Assessment. Molecules. 2020; 25(7):1698. https://0-doi-org.brum.beds.ac.uk/10.3390/molecules25071698
Chicago/Turabian StyleBezerra, Taliana, Mario Estévez, José Thalles Lacerda, Meriellen Dias, Maria Juliano, Maria Anita Mendes, Marcelo Morgano, Maria Teresa Pacheco, and Marta Madruga. 2020. "Chicken Combs and Wattles as Sources of Bioactive Peptides: Optimization of Hydrolysis, Identification by LC-ESI-MS2 and Bioactivity Assessment" Molecules 25, no. 7: 1698. https://0-doi-org.brum.beds.ac.uk/10.3390/molecules25071698