1. Introduction
Dental caries is a public health problem worldwide affecting humans without distinction of age and is the main factor related to the loss of dentition [
1]. Several factors interact for disease occurrence [
2], and its development is associated with the transition from a healthy biofilm to a pathogenic one driven by a high-sugar diet [
3,
4]. Thus, strategies are needed to control cariogenic biofilm development.
Among several species that comprise the oral microbiota,
Streptococcus mutans is considered an important etiological factor for dental caries in association with a sugar-rich diet [
4,
5]. The uniqueness of this species is its ability to orchestrate the cariogenic biofilm build-up by producing a three-dimensional (3D) extracellular matrix rich in exopolysaccharides (EPS) that hampers diffusion and creates microenvironments where metabolites such acids accumulate within the biofilm and at the interface biofilm/teeth surface [
6], leading to the demineralization of teeth enamel [
7]. This matrix also contains extracellular DNA (eDNA) and lipoteichoic acid (LTA) [
8,
9]. This bacterium also produces acids and withstands acidic niches [
10].
Dietary sucrose is a substrate and starch hydrolysates can serve as acceptors for EPS synthesis by
S. mutans exoenzymes. The glycosyltransferases (GtfB, GtfC, and GtfD) present on the pellicle and microbial surfaces produce glucans and enabling the local accumulation of microbes on the teeth [
11]. These exoenzymes produce distinct glucans while GtfB produces water-insoluble glucans (mainly α 1,3 linkages), GtfD produces water-soluble glucans (mainly α 1,6 linkages), and GtfC produces both water-soluble and -insoluble glucans. The insoluble glucans are the main components of the cariogenic biofilm extracellular matrix. Furthermore, fructans produced by a fructosyltransferase are a minor part of EPS in the matrix [
11]. Over time, these EPS build a matrix that embeds the microbial cells forming a cohesive and diffusion-limiting milieu, creating acidic niches where cariogenic species thrive and cause acid-dissolution of teeth [
6,
7]. Moreover, EPS-rich extracellular matrix protects the microorganisms from antimicrobial therapies and provides viscoelasticity to biofilms, hindering its mechanical removal [
11].
eDNA cooperates with EPS in the early phases of biofilm development while LTA participates in the maturation of matrix and biofilm [
9]. The deletion of the
gtfB gene affects the expression dynamics of eDNA-linked genes (
lytST,
lrgAB,
ccpA) [
12]. It markedly decreases the expression of
dltB (from operon
dltABCD part of the LTA metabolism pathway) and EPS-associated genes (
gtfBCD, gbpB, dexA) [
12]. Most of those genes have gene products involved with cell wall/membrane composition/structure, indicating that these cell components turnover may be affected, thereby influencing matrix and biofilm development [
12]. The inactivation of
lytST,
dltAD, and
gtfB impaired
S. mutans cariogenicity in a rodent model, and its virulence in a systemic infection model (
Galleria mellonella larvae) [
13]. Hence, strategies to modulate these genes and their products could affect
S. mutans pathogenicity.
Classical caries prevention strategies include exposure to fluoride (aid in the remineralization process), restriction of dietary sugars (reduce substrate for microbial EPS and acid production), and mechanical removal of dental plaque (brushing and flossing). In addition, chlorhexidine, a broad-spectrum bactericidal agent, suppresses mutans streptococci levels in saliva but is less effective against biofilms and has undesirable side effects [
14]. Nevertheless, fluoride is the mainstay for caries prevention as it has led to a significant reduction in decay; however, it offers incomplete protection against caries and has minimal effect on microbial aciduricity and acidogenicity, even though it can affect the glycolytic activity of streptococci [
15]. Extensive efforts for fluoridated drinking water have been in place, but it does not reach the entire population, especially in Brazil [
16]. Moreover, promoting fluoride toothpaste would retard caries in populations but would not eliminate it, as caries occur in populations with good fluoride exposure [
17]. Additionally, an increase in daily dosage may lead to fluorosis of teeth and bones [
18,
19].
The use of fluoride combined with bioactive agents can improve the action of fluoride and become an interesting strategy for cariogenic anti-biofilm therapies. In this context, myricetin is a flavonoid that inhibits
gtfBC expression and EPS synthesis [
20,
21,
22]. This flavonoid also affects
S. mutans acidogenicity by hindering the F-ATPase activity and glycolytic pH-drop [
20]. Furthermore, the compound 1771 is a small molecule that inhibits the synthesis of LTA in Gram-positive bacteria
Staphylococcus aureus [
23] and
Enterococcus faecium [
24]. Thus, here it was investigated whether the combination of myricetin, compound 1771, and fluoride influences
S. mutans biofilm development by interfering with the bacterium gene expression and metabolism that would hamper the extracellular matrix build-up and consequent bulky cariogenic biofilm.
2. Material and Methods
2.1. Experimental Design
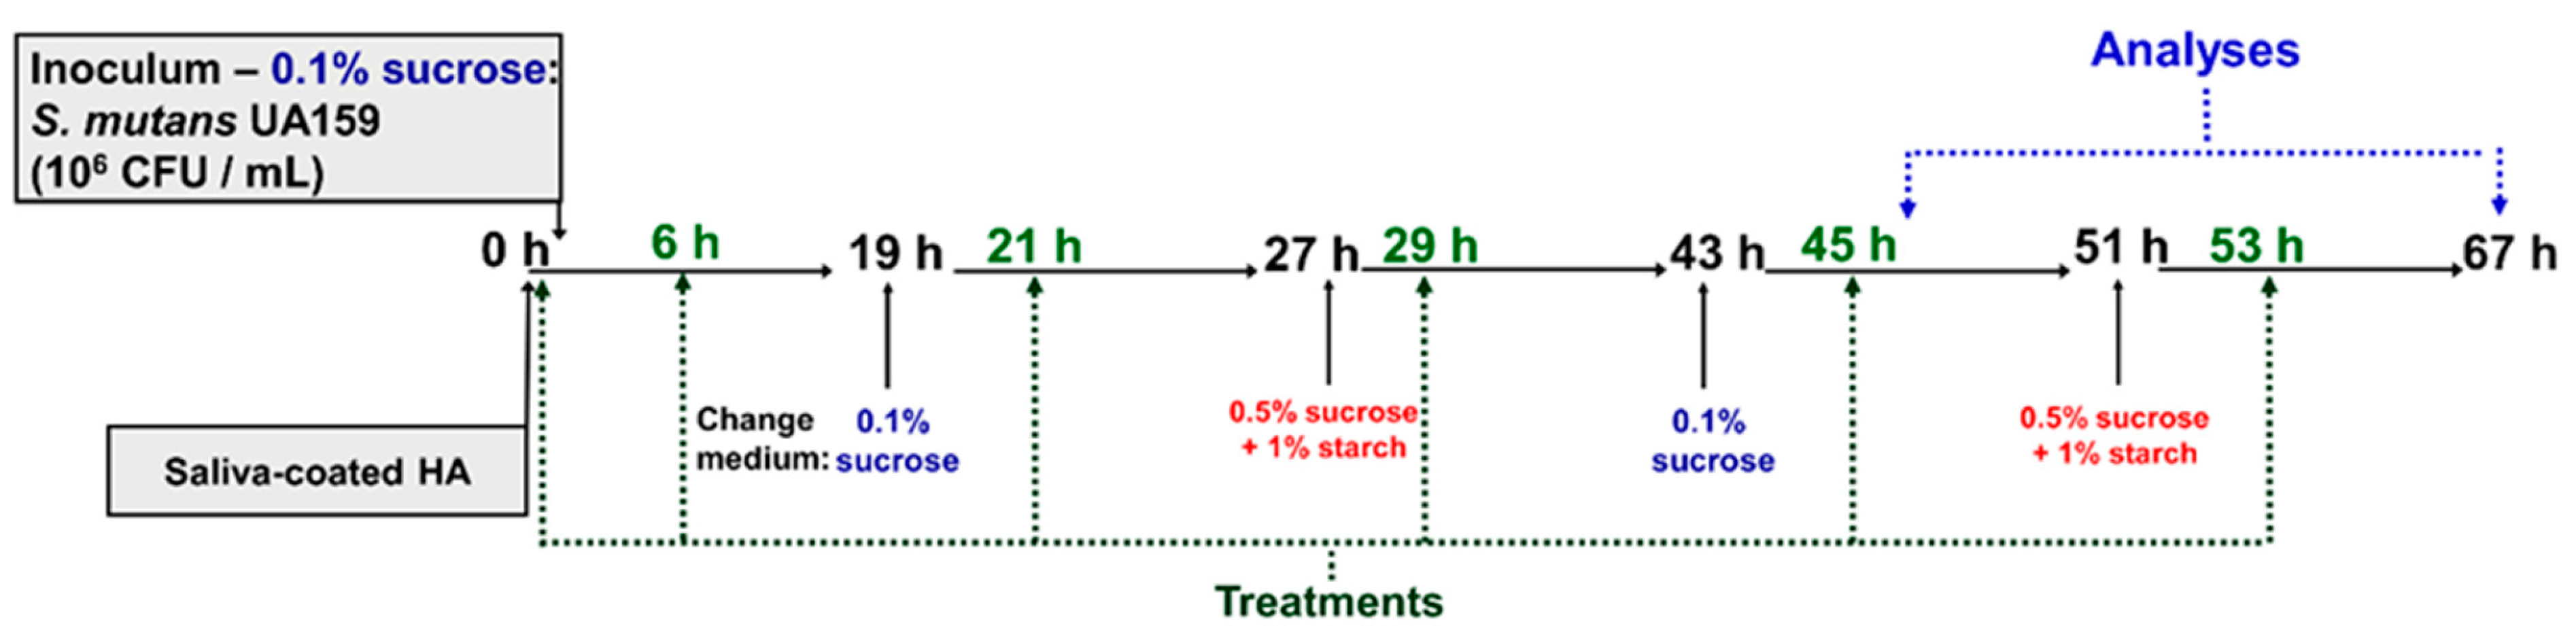
An in vitro study with Streptococcus mutans was conducted to investigate the antimicrobial and antibiofilm activity of compound 1771 and myricetin. The antimicrobial activity was evaluated using planktonic cultures in microdilution assay to determine the minimum inhibitory concentration (MIC) and minimum bactericidal concentration (MBC). Next, S. mutans single-species biofilm based on two batch culture approaches were used to investigate the anti-biofilm activity. First, the MIC and 2xMIC concentrations were used to evaluate the anti-biofilm effect of each agent using a polystyrene microplate biofilm model by determining S. mutans viable population (colony forming units or CFU/biofilm) and biomass (crystal violet method). After, 2xMIC of both agents alone and combined with and without fluoride were used for twice-daily topical treatments of biofilms formed on saliva-coated hydroxyapatite discs as substrate. The study was approved by the Institutional Ethical Committee (CAAE: 31717914.3.0000.5416).
In the second biofilm model, the eight experimental groups that corresponded to the distinct topical treatments were: compound 1771 (2.6 µg/mL), myricetin (500 µg/mL), compound 1771 + myricetin, fluoride (250 ppm), compound 1771 + fluoride, myricetin + fluoride, compound 1771 + myricetin + fluoride, and vehicle (3.2% ethanol plus 0.02% dimethyl sulfoxide—DMSO). After 67 h, biofilms were evaluated to determine biofilm biomass, S. mutans viable counts, and extracellular matrix components (water-soluble and -insoluble EPS, eDNA, and LTA). Furthermore, confocal laser scanning microscopy was used to visualize and quantify the structural components (EPS and bacteria) of the biofilms. Furthermore, after 46 h of biofilm development, gene expression of the selected genes was performed. Moreover, during biofilm growth, the culture medium was changed twice daily, and the pH values of the spent medium were measured.
Three independent experiments were carried out in triplicate for the antimicrobial and anti-biofilm on polystyrene surface (n = 9), while in duplicate for the anti-biofilm on saliva-coated hydroxyapatite surface (n = 6). The data were statistically analyzed according to the factorial design of this study, considering each microplate well or hydroxyapatite disc as a statistical block. The discs were randomly assigned for each experimental group. Biochemical analyses of the extracellular matrix were performed to verify whether specific agents or combinations of agents influenced biofilm development and consequent pathogenic potential. Our hypothesis was that interfering with EPS synthesis and cooperation with eDNA and LTA by using selected bioactive agents would hinder the development of S. mutans cariogenic biofilm. In addition, the cytotoxicity of each treatment and vehicle was investigated.
2.2. Test Agents
Compound 1771 ([(5-phenyl-1,3,4-oxadiazol-2-yl)carbamoyl]methyl 2-{naphtha [2,1-b] furan-1-yl}acetate) and myricetin were acquired via MolPort ordering service; compound 1771 was supplied by UkrOrg Synthesis Ltd. (Cat. # PB25353228) while myricetin was supplied by AK Scientific Inc (Cat. # J10595). Sodium fluoride was purchased from Sigma-Aldrich Co. (St Louis, MO, USA; Cat. # 71519). Stock solutions of each agent were prepared. Compound 1771 was dissolved in the combination of 84.5% ethanol and 15% DMSO at a final concentration of 2 mg/mL (4.68 mM). Myricetin was dissolved in 84.5% ethanol, with 1xPBS (Phosphate Buffered Saline, pH 7.2) at a final concentration of 15.912 mg/mL (50 mM).
For the antimicrobial activity assays, the concentrations used were 166.7−0.3255 μg/mL for compound 1771 and 500−3.9 μg/mL for myricetin. For the antibiofilm assays on the polystyrene surface, the concentrations used were MIC and 2xMIC. The concentrations selected for twice-daily topical treatments of biofilms formed on saliva-coated hydroxyapatite discs as substrate were 2xMIC of both agents, alone combined with and without fluoride: myricetin or Myr (500 µg/mL), compound 1771 or 1771 (2.6 µg/mL), compound 1771 + myricetin or Myr + 1771, myricetin + fluoride (250 ppm) or Myr + F, compound 1771 + fluoride or 1771 + F, compound 1771 + myricetin + fluoride or Myr + 1771 + F, fluoride or F (250 ppm), and vehicle or V (3.2% ethanol plus 0.02% DMSO). Thus, for the topical treatments, the test agents, including fluoride, were dissolved in 3.2% ethanol containing 0.02% DMSO just before carrying out the assays. The concentration of fluoride was selected based on the commercially available fluoride-based mouthrinse [
22,
25].
2.3. Bacterial Strain and Growth Conditions
S. mutans UA159, serotype c (ATCC 700610) strain stocks were stored at −80 °C in tryptic soy broth containing 20% glycerol and were plated on blood agar plates (37 °C, 5% CO2/95% air atmosphere, 48 h). Starter cultures were prepared by inoculating 5 to 10 colonies in tryptone-yeast extract broth (TY; 2.5% tryptone, 1.5% yeast extract, pH 7.0) containing 1% glucose tryptone broth and 1% glucose yeast extract, followed by incubation for 16 h (37 °C, 5% CO2/95% air atmosphere). The starter cultures were diluted 1:20 in fresh TY + 1% glucose and incubated until mid-exponential growth phase for the antimicrobial and antibiofilm assays.
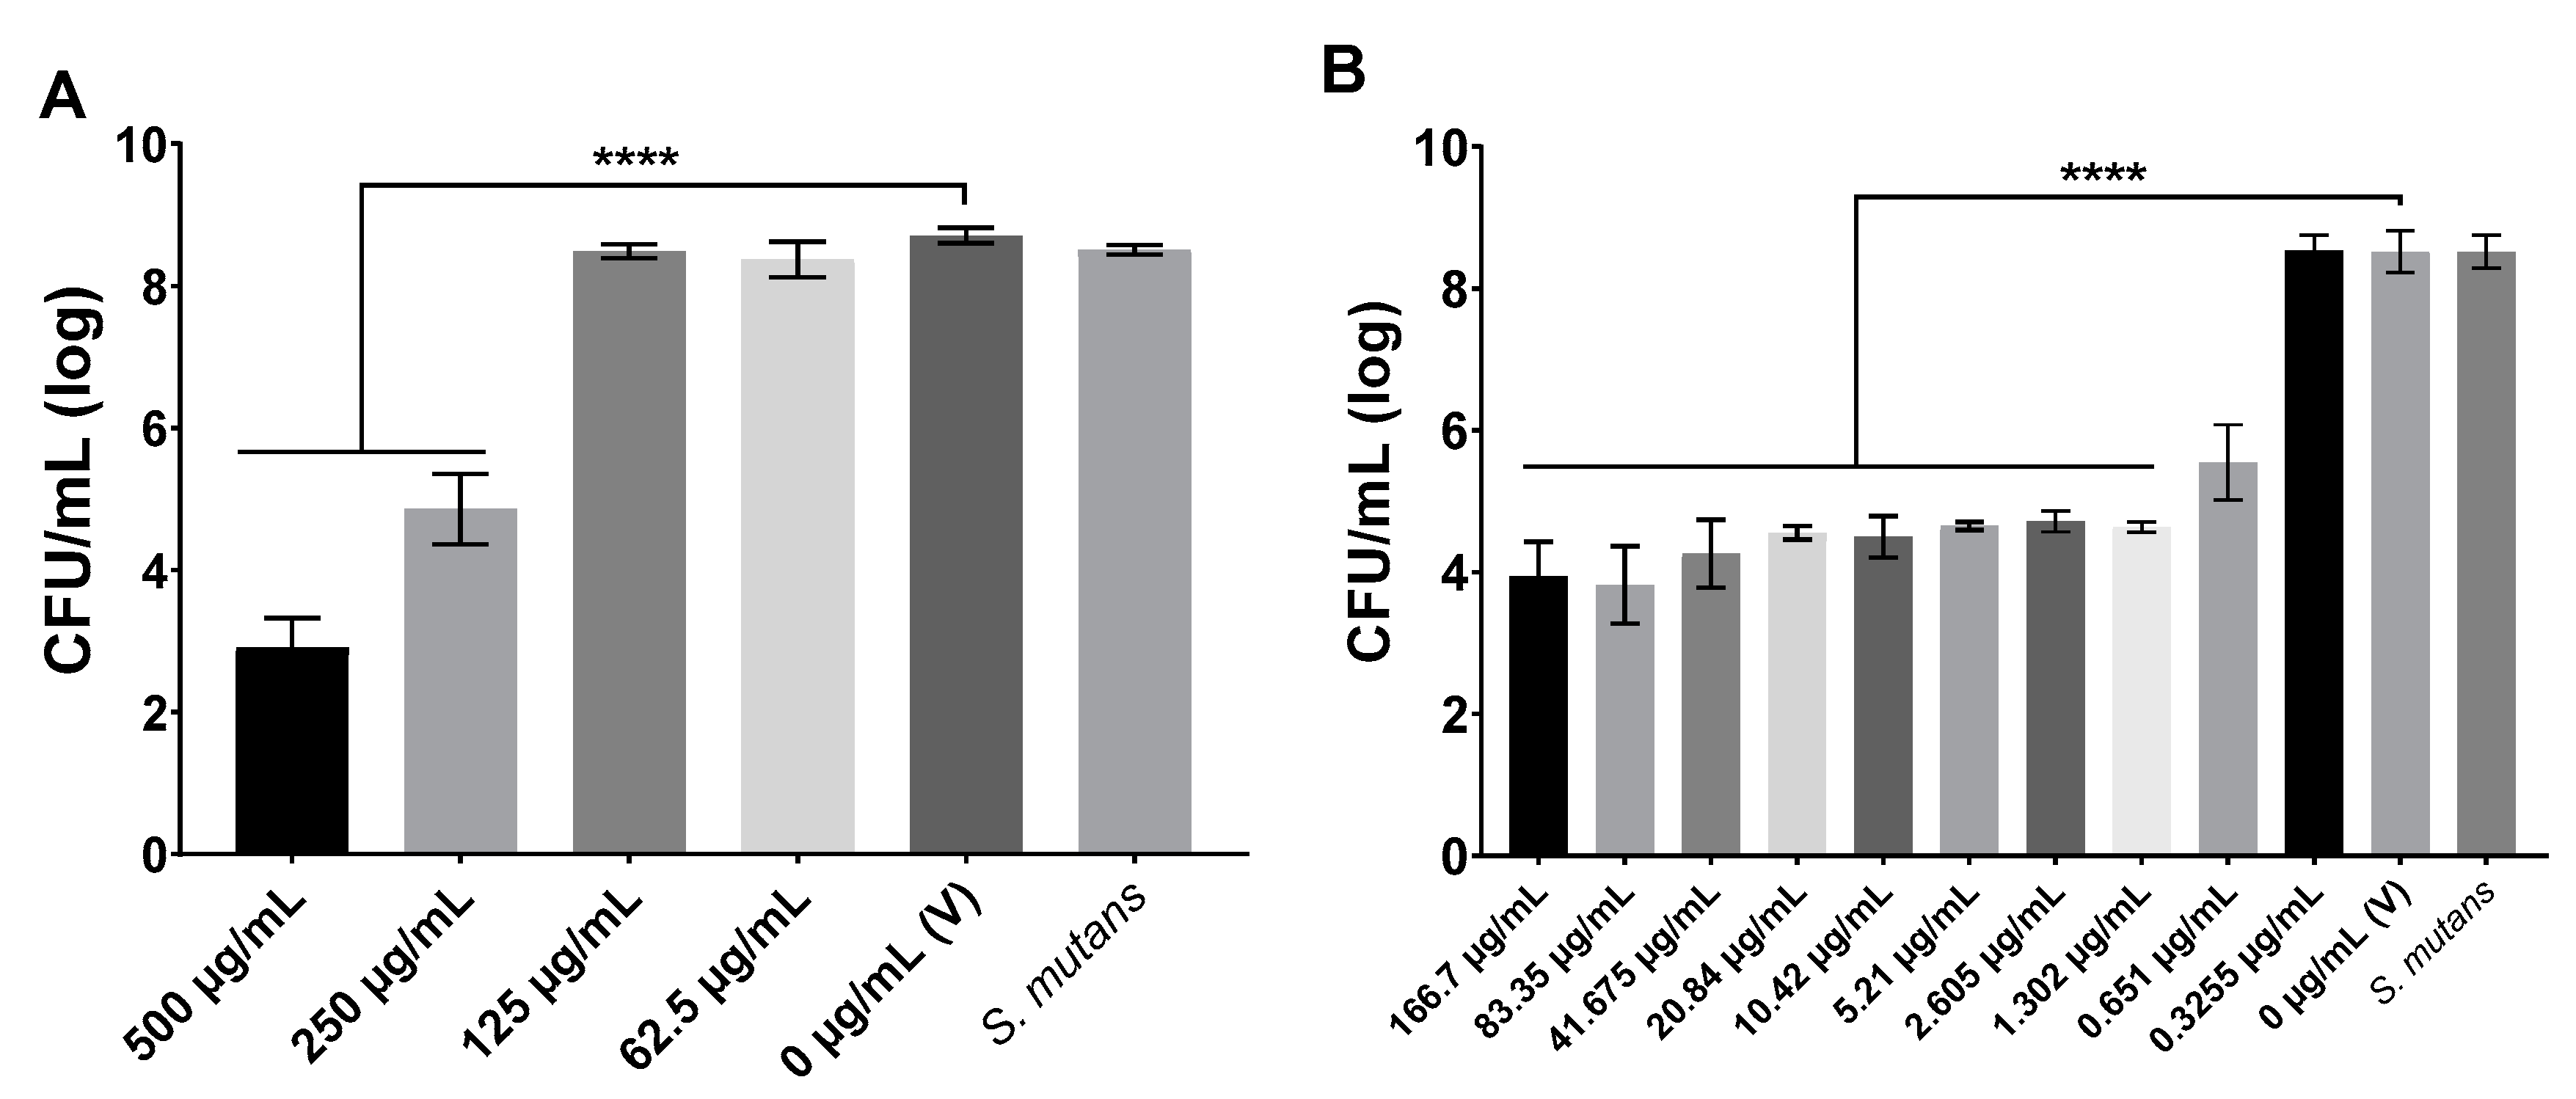
2.4. Antimicrobial Activity
The antimicrobial activity was evaluated by determining the minimum inhibitory concentration (MIC) and minimum bactericidal concentration (MBC) using broth microdilution following the Clinical and Laboratory Standards Institute [
26], with some modifications. The
S. mutans cultures at the mid-exponential growth phase were diluted in TY + 1% glucose until reaching 2 × 10
6 CFU/mL. Aliquots of 100 µL of these cultures were transferred to 96-well microplates. Next, treatments or vehicle were added, so the final bacterial load was 1 × 10
6 CFU/mL, and the microplates were incubated (37 °C, 5% CO
2/95% air atmosphere, 24 h). In addition to treatments and the vehicle, a microbial growth control without treatment was included; controls per treatment without microbial inoculation were also performed. Each treatment was performed in triplicates at three distinct experiments. After 24 h of incubation, visual inspection of the wells (turbidity: microbial growth, clear: no growth) and OD
562 nm readings (ELISA plate reader, Biochrom Ez, Cambourne, UK) were performed to determine MIC. The MIC should be the agent concentration in which all wells were clear. Furthermore, an aliquot of each well was used for a 10-fold serial dilution (10
0 to 10
−5) in saline solution (0.89% NaCl; Synth) to determine the viability of the microbial cells by plating blood agar plates (37 °C, 5% CO
2/95% air atmosphere, 48 h). After incubation, the colonies were counted to obtain CFU/mL and determine the MBC. The MBC should be the agent concentration in which no bacterial growth was observed on agar plates.
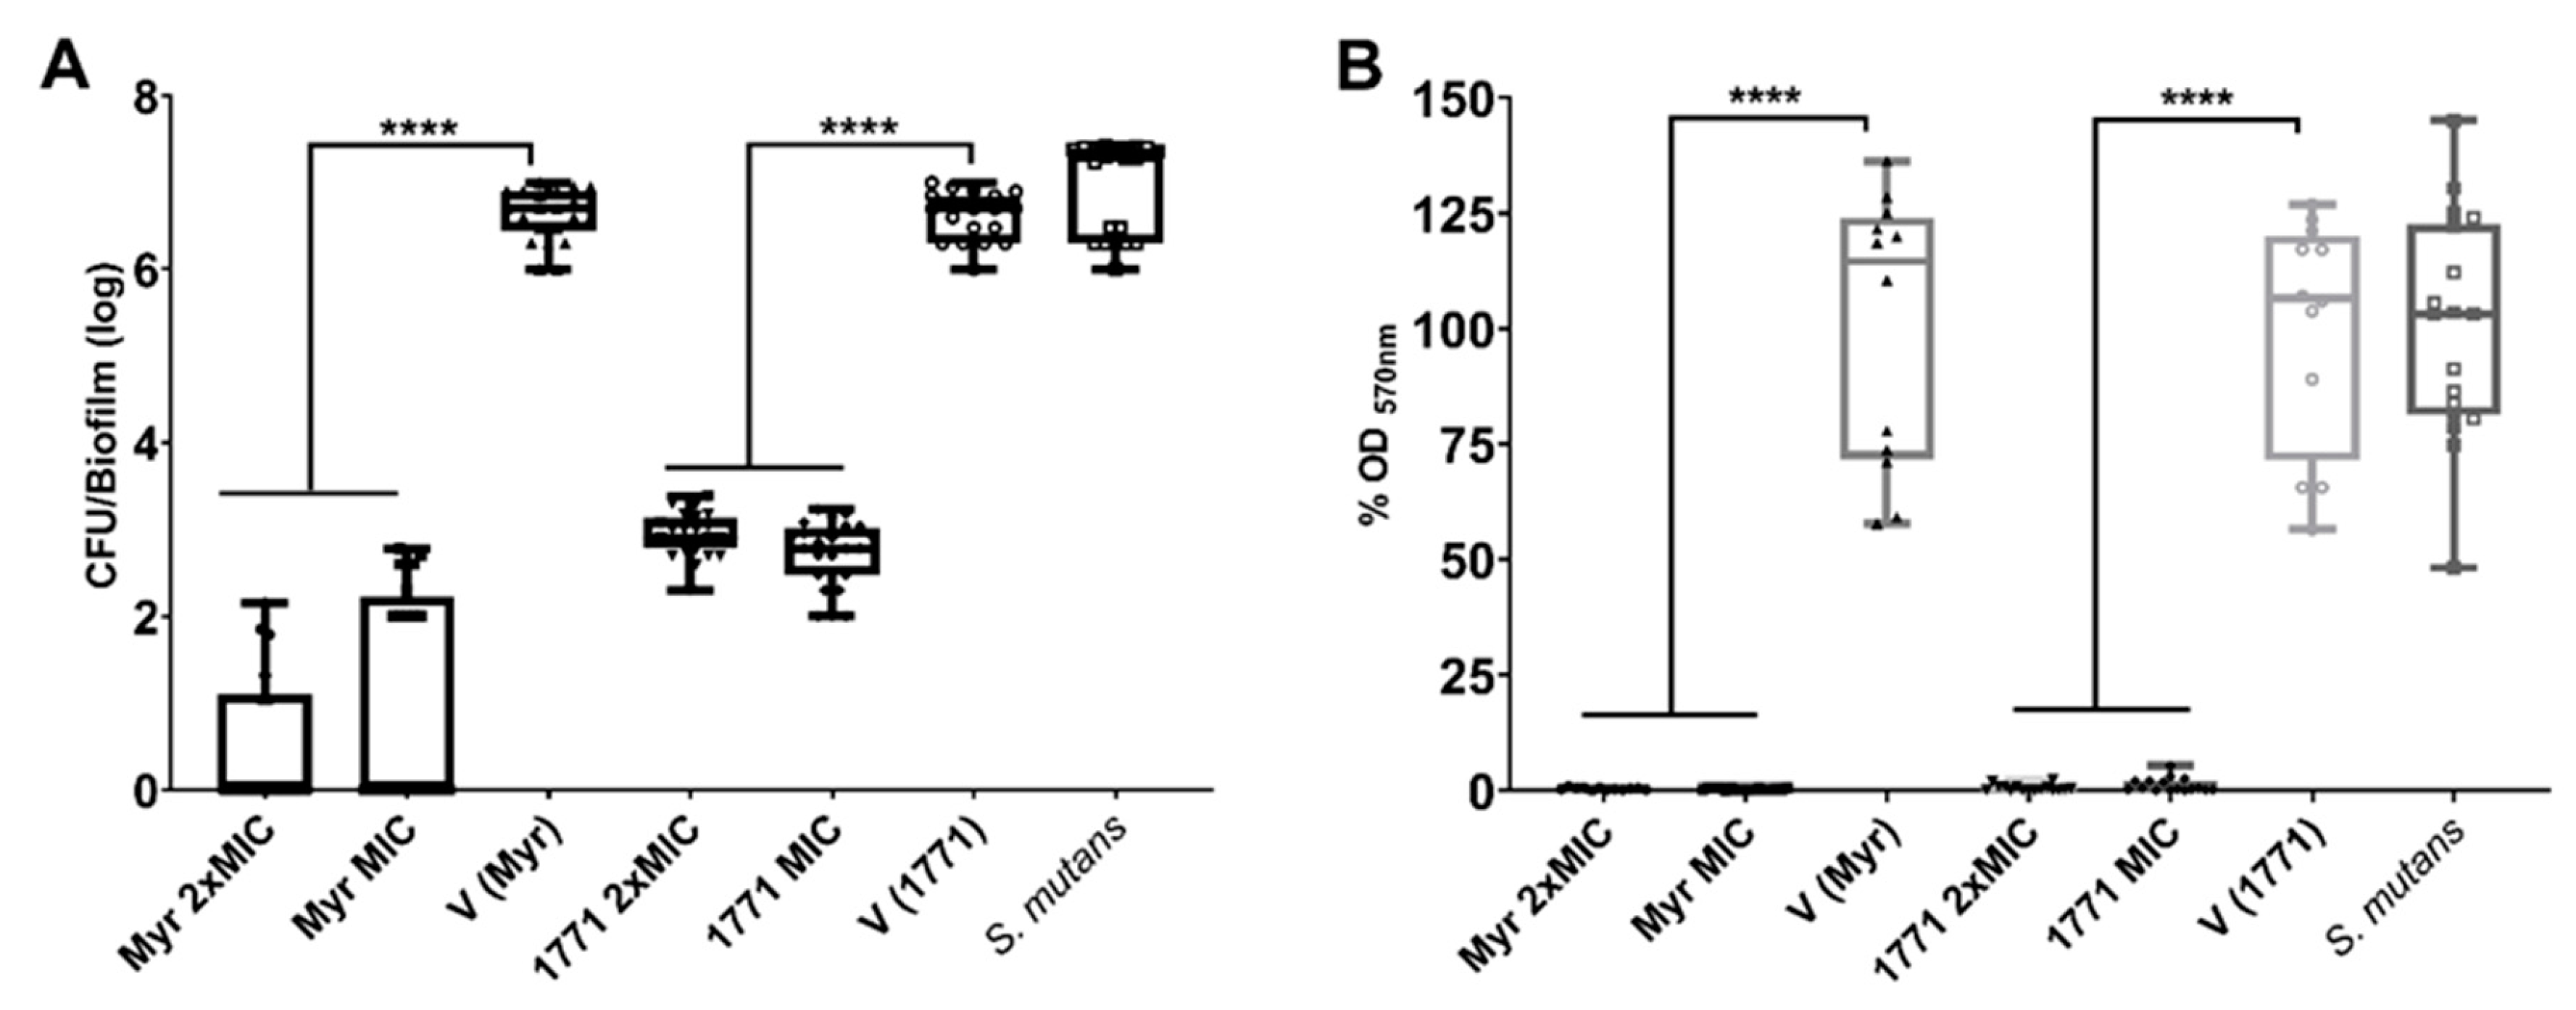
2.5. Antibiofilm Assay Using the Polystyrene Microplate Model
The initial anti-biofilm assay was performed using the polystyrene microplate model to investigate whether compound 1771 presented antibiofilm activity. Even though it is known that myricetin has this activity [
20,
21,
22], it was tested here to ensure that the one from the acquired here also had this property. Therefore,
S. mutans cultures at the mid-exponential growth phase were diluted in TY + 1% sucrose until reaching 2 × 10
6 CFU/mL. Aliquots of 100 µL of these cultures were transferred to 96-well microplates. Next, treatments (MIC and 2xMIC) or vehicle were added, so the final bacterial load was 1 × 10
6 CFU/mL, and the microplates were incubated (37 °C, 5% CO
2/95% air atmosphere, 24 h). In addition to treatments and the vehicle, a microbial growth control without treatment was included; controls per treatment and medium without microbial inoculation were also performed. After 24 h of incubation, the microplates were placed on an orbital shaker at 75 rpm for 5 min (Quimis, São Paulo, Brazil). Next, the culture medium with unbound microbial cells was removed, and remaining biofilms were washed three times, with 0.89% NaCl solution to remove non-adhered cells.
The biomass of treated biofilms was assessed via the crystal violet method. Briefly, the washed biofilms were stained with an aqueous solution of 0.1% crystal violet and incubated (25 °C, 35 min). Next, the wells were washed using Milli-Q water and air-dried for 60–90 min. Then, the crystal violet was eluted with 99% ethanol and incubation for 5 min on the orbital shaker (37 °C, 200 rpm). The eluted volumes were transferred to another microplate, and the OD570 nm was measured on an ELISA plate reader (Biochrom Ez, Cambourne, UK). The readings per treatment and controls were converted into the percentage of biofilm biomass inhibition by each treatment and compared to vehicle control.
In addition, to verify the viable counts of the microbial population of treated biofilms, the washed biofilms were removed from each well using pipet tips and 0.89% NaCl solution and transferred to microtubes. Then, an aliquot of each biofilm suspension was used for a 10-fold serial dilution (100 to 10−5) followed by plating on blood agar plates (37 °C, 5% CO2/95% air atmosphere, 48 h). After incubation, the colonies were counted to obtain CFU/mL and calculate the log of microbial growth inhibition by each agent, compared to vehicle control.
2.6. Biofilm Formation on Saliva-Coated Hydroxyapatite Discs and Topical Treatments
Biofilms of
S. mutans UA159 were formed on saliva-coated hydroxyapatite (sHA) discs (surface area of 2.93 ± 0.2 cm
2, Clarkson Chromatography Products Inc., South Williamsport, PA, USA) in batch cultures for 67 h, as detailed elsewhere [
9]. Saliva and pellicle preparation were performed as described before [
27]. Saliva was donated by two volunteers who had not used antimicrobial treatments in the last three months. Each volunteer rinsed their mouth with 5 mL of Milli-Q water, then masticate a piece of parafilm, collecting 5 mL saliva into a collection tube, which was then discarded. Next, the volunteers continued masticating the parafilm and collected saliva into an ice-chilled tube. The saliva samples from all volunteers were pooled and diluted 1:1 with adsorption buffer (AB buffer: 50 mM KCl, 1 mM KPO
4, 1 mM CaCl
2, 1 mM MgCl
2, 0.1 mM PMSF, in dd-H
2O, pH 6.5). Saliva was centrifuged (3220×
g, 20 min, 4 °C; Centrifuge 5810R, Eppendorf), and the clarified portion was filtered sterilized (0.22 µm low protein binding polyethersulfone membrane filter). Saliva was used fresh for pellicle formation and medium preparation at the start of the experiment, and any remaining saliva was aliquotted and stored at −80 °C until use for culture media preparation.
Saliva-coated HA discs were placed in a vertical position in a 24 well microtiter dish using a custom-made disc holder [
9]. Next, these discs with salivary pellicle were dip-washed into wells containing AB buffer and topically treated during 1.5 min with the seven tested treatments or vehicle control (eight experimental groups): (1) Myr; (2) 1771; (3) Myr + 1771; (4) Myr + F; (5) 1771 + F; (6) Myr + 1771 + F; (7) F; (8) V. The procedure for topical treatment consisted of dripping 250 µL of each treatment on the corresponding discs (two discs per treatment and experiment). The treated discs were dip-washed into wells containing AB buffer and transferred to wells containing
S. mutans culture for biofilm formation (time 0 h). Here, the
S. mutans cultures at the late-exponential growth phase were diluted in TY + 0.1% sucrose and 25% saliva until reaching 2 × 10
6 CFU/mL. The biofilms were incubated for 6 h (37 °C, 5% CO
2/95% air atmosphere), when the discs with initial biofilm were rinsed with 0.89% NaCl, treated with each corresponding treatment or control (as above), rinsed with 0.89% NaCl (to remove excess treatment), and transferred back to the corresponding culture media until biofilms were 19 h-old, when culture medium was changed.
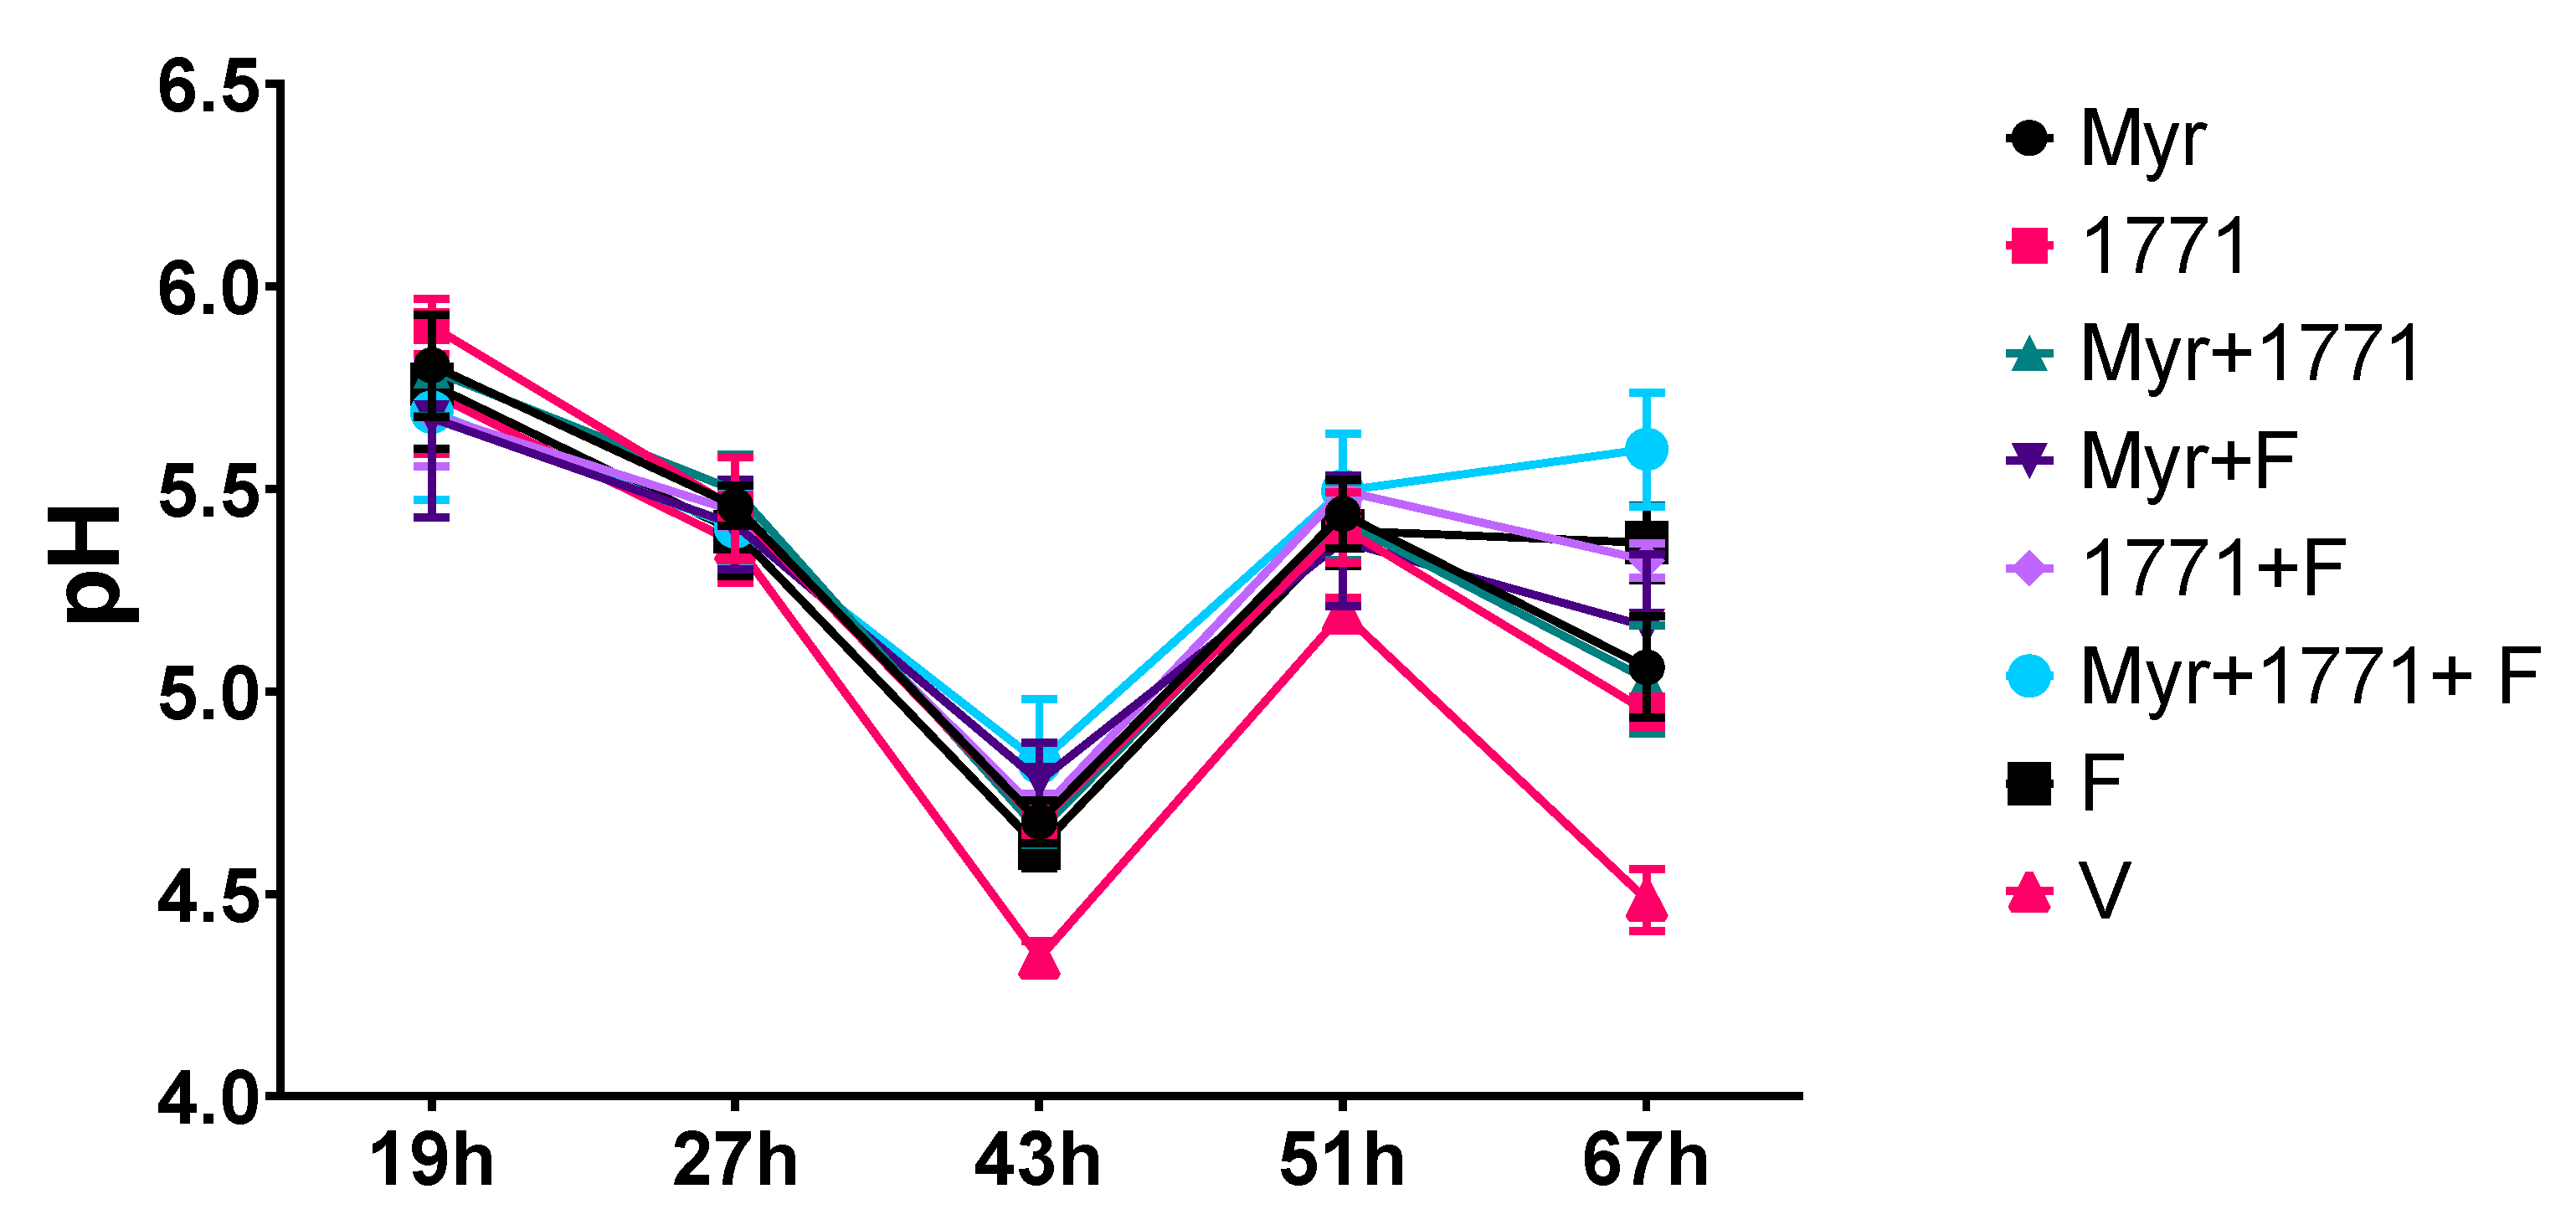
The culture medium was changed daily at 8 a.m. (TY + 0.1% sucrose and 25% saliva) and 4 p.m. (0.5% sucrose + 1% starch and 25% saliva). After each media change, the pH of the spent media was measured. The biofilms were topically treated two hours after each culture change (
Figure 1). The biofilms were grown until reaching two developmental phases: 46 h for gene expression assessment and 67 h for microbial population, biomass, biochemical characteristics of biofilm extracellular matrix, and confocal analyses.
2.7. Biofilm Analyses
2.7.1. Determination of Microbial Population, Biomass and Biochemical Characteristics of Biofilm Extracellular Matrix
At 67 h of development, biofilms were processed for analyses following previously described protocols [
27]. Briefly, biofilms were dip-washed into wells containing sterile 0.89% NaCl solution (saline solution). Each biofilm (disc) was transferred to a glass tube containing 1 mL of saline solution. Next, 1 mL of saline solution was used to wash the walls of each tube. The glass tubes with biofilms/discs were placed in a beaker and subjected to water-bath sonication for 10 min. A sterile metal spatula was used to scrape off any remaining biofilm from each disc surface, and the 2 mL of each biofilm suspension was transferred to a new 15 mL tube. Next, each glass tube was washed with 3 mL of saline solution, which was transferred to the tube containing the initial 2 mL, yielding 5 mL total biofilm suspension per biofilm/disc. Each biofilm suspension (5 mL) was sonicated using a probe at 7 w for 30 s (Sonicator model Q125, QSonica, Newtown, CT, USA).
An aliquot of each suspension (0.1 mL) was used for a 10-fold serial dilution to determine the number of CFU by plating on blood agar plates (37 °C, 5% CO
2/95% air atmosphere, 48 h). The remaining volume (4.8 mL) was centrifuged (3220×
g, 20 min, 4 °C). The supernatant (with soluble extracellular matrix components) was transferred to a new tube, and the pellet (precipitate with the microbial cells and insoluble matrix components) was washed twice with 2.6 mL sterile Milli-Q water (3220×
g, 20 min, 4 °C). The supernatants generated during the two washes were combined with the first supernatant obtained, totaling 10 mL, which was used to isolate and quantify water-soluble EPS [
28], eDNA [
29], and LTA [
9]. The pellet was suspended in 2.55 mL of Milli-Q water, of which 0.5 mL was used for quantification of insoluble dry-weight (biomass) and 1 mL for the isolation and quantitation of water-insoluble EPS (or alkali-soluble polysaccharides) [
28].
2.7.2. Laser Scanning Confocal Fluorescence Microscopy Imaging and Computational Analyses of Treated Biofilms
Biofilms were formed and treated as described above. However, 1 μM Alexa Fluor™ 647-labeled dextran conjugate (absorbance/fluorescence emission maxima of 647/668 nm; Molecular Probes, Carlsbad, CA, USA) was added to the culture medium at the beginning of, and during, development of the biofilms [
30]. This strategy enables the incorporation of labeled dextrans into EPS during its synthesis process and matrix build-up. When the biofilms reached 67 h of development, the discs were dip-washed into wells containing with 0.89% NaCl and transferred to wells containing 0.89% NaCl solution and SYTO™ 9 (485/498 nm; Molecular Probes) which is a green fluorescent nucleic acid marker for visualization of bacteria [
30]. The imaging of the three-dimensional structure of these biofilms was performed using a Zeiss LSM 780 microscope (Zeiss, Jena, Germany), fitted with a 20× objective lens. Each biofilm was scanned at three randomly selected positions, and a series of confocal images were generated by optical sectioning at each of these positions. The images were analyzed using Amira 6.0.1 software (Mercury Computer Systems Inc., Chelmsford, MS, USA) for 3D reconstruction of EPS and bacteria [
6]. Furthermore, each image was analyzed using COMSTAT version 2 software [
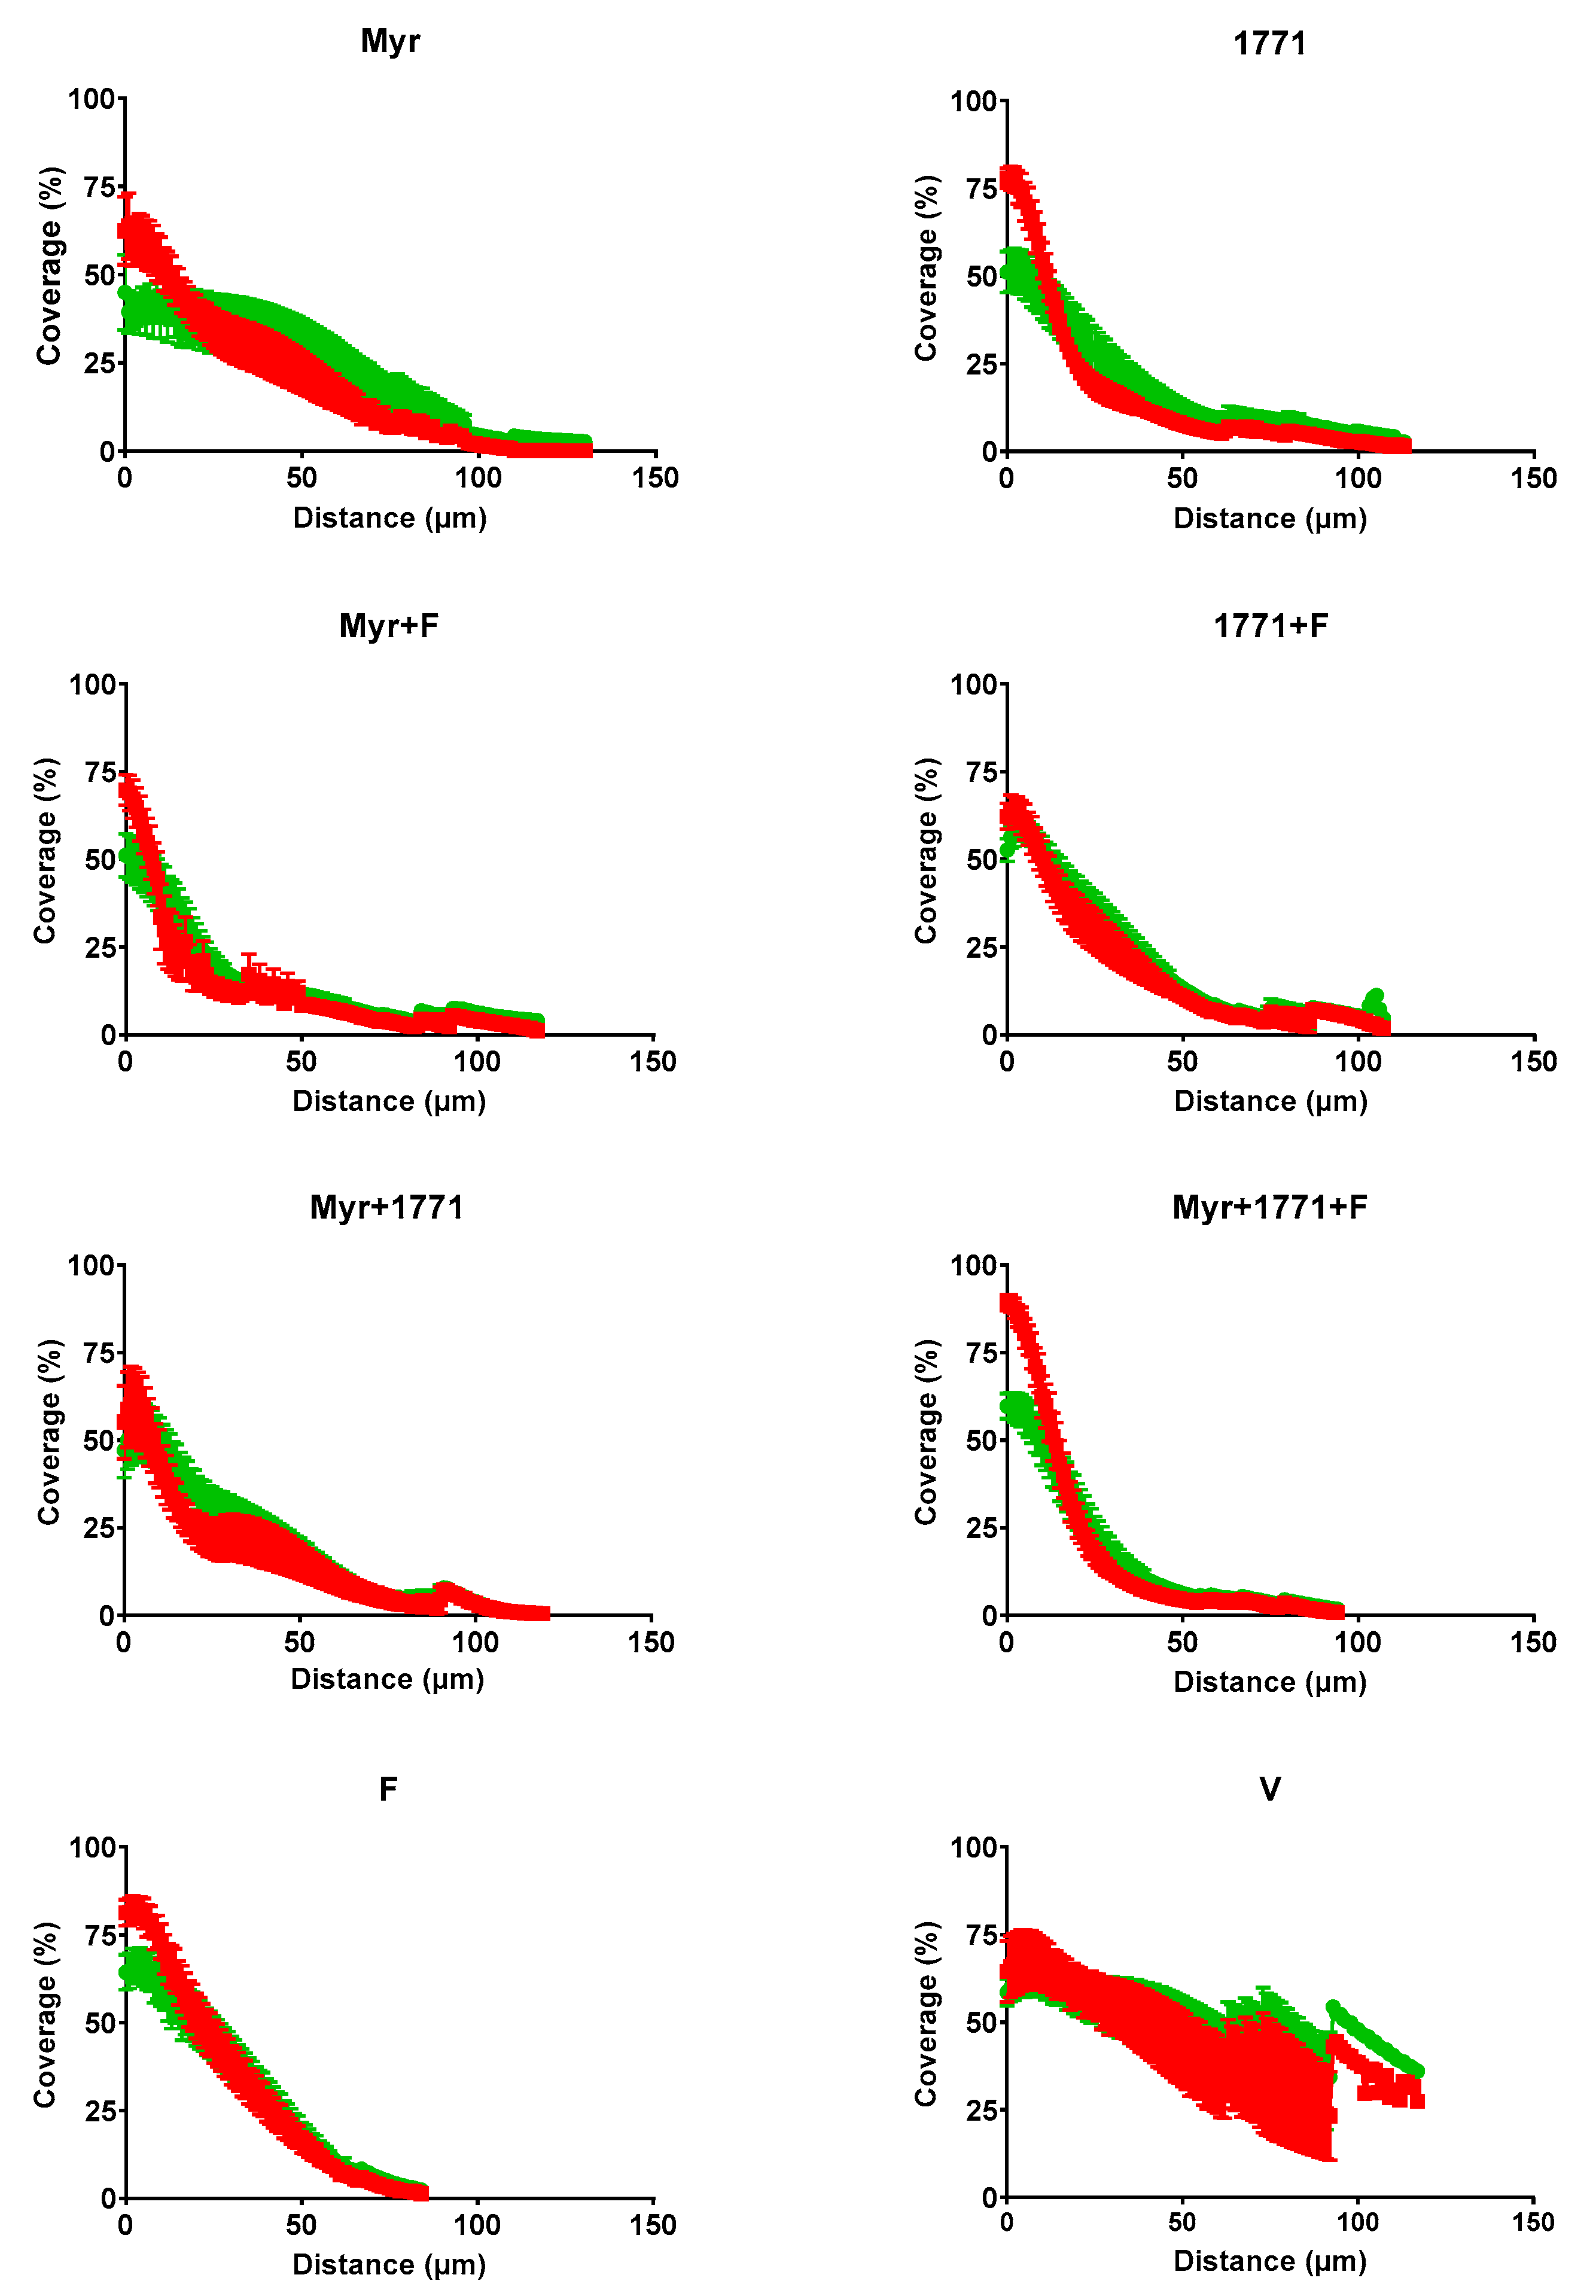
31] for quantification of total bacteria content and EPS matrix (bio-volume), and percent of coverage per area from the interface substrate/biofilm (hydroxyapatite disc) to the top (outer layer) of each biofilm.
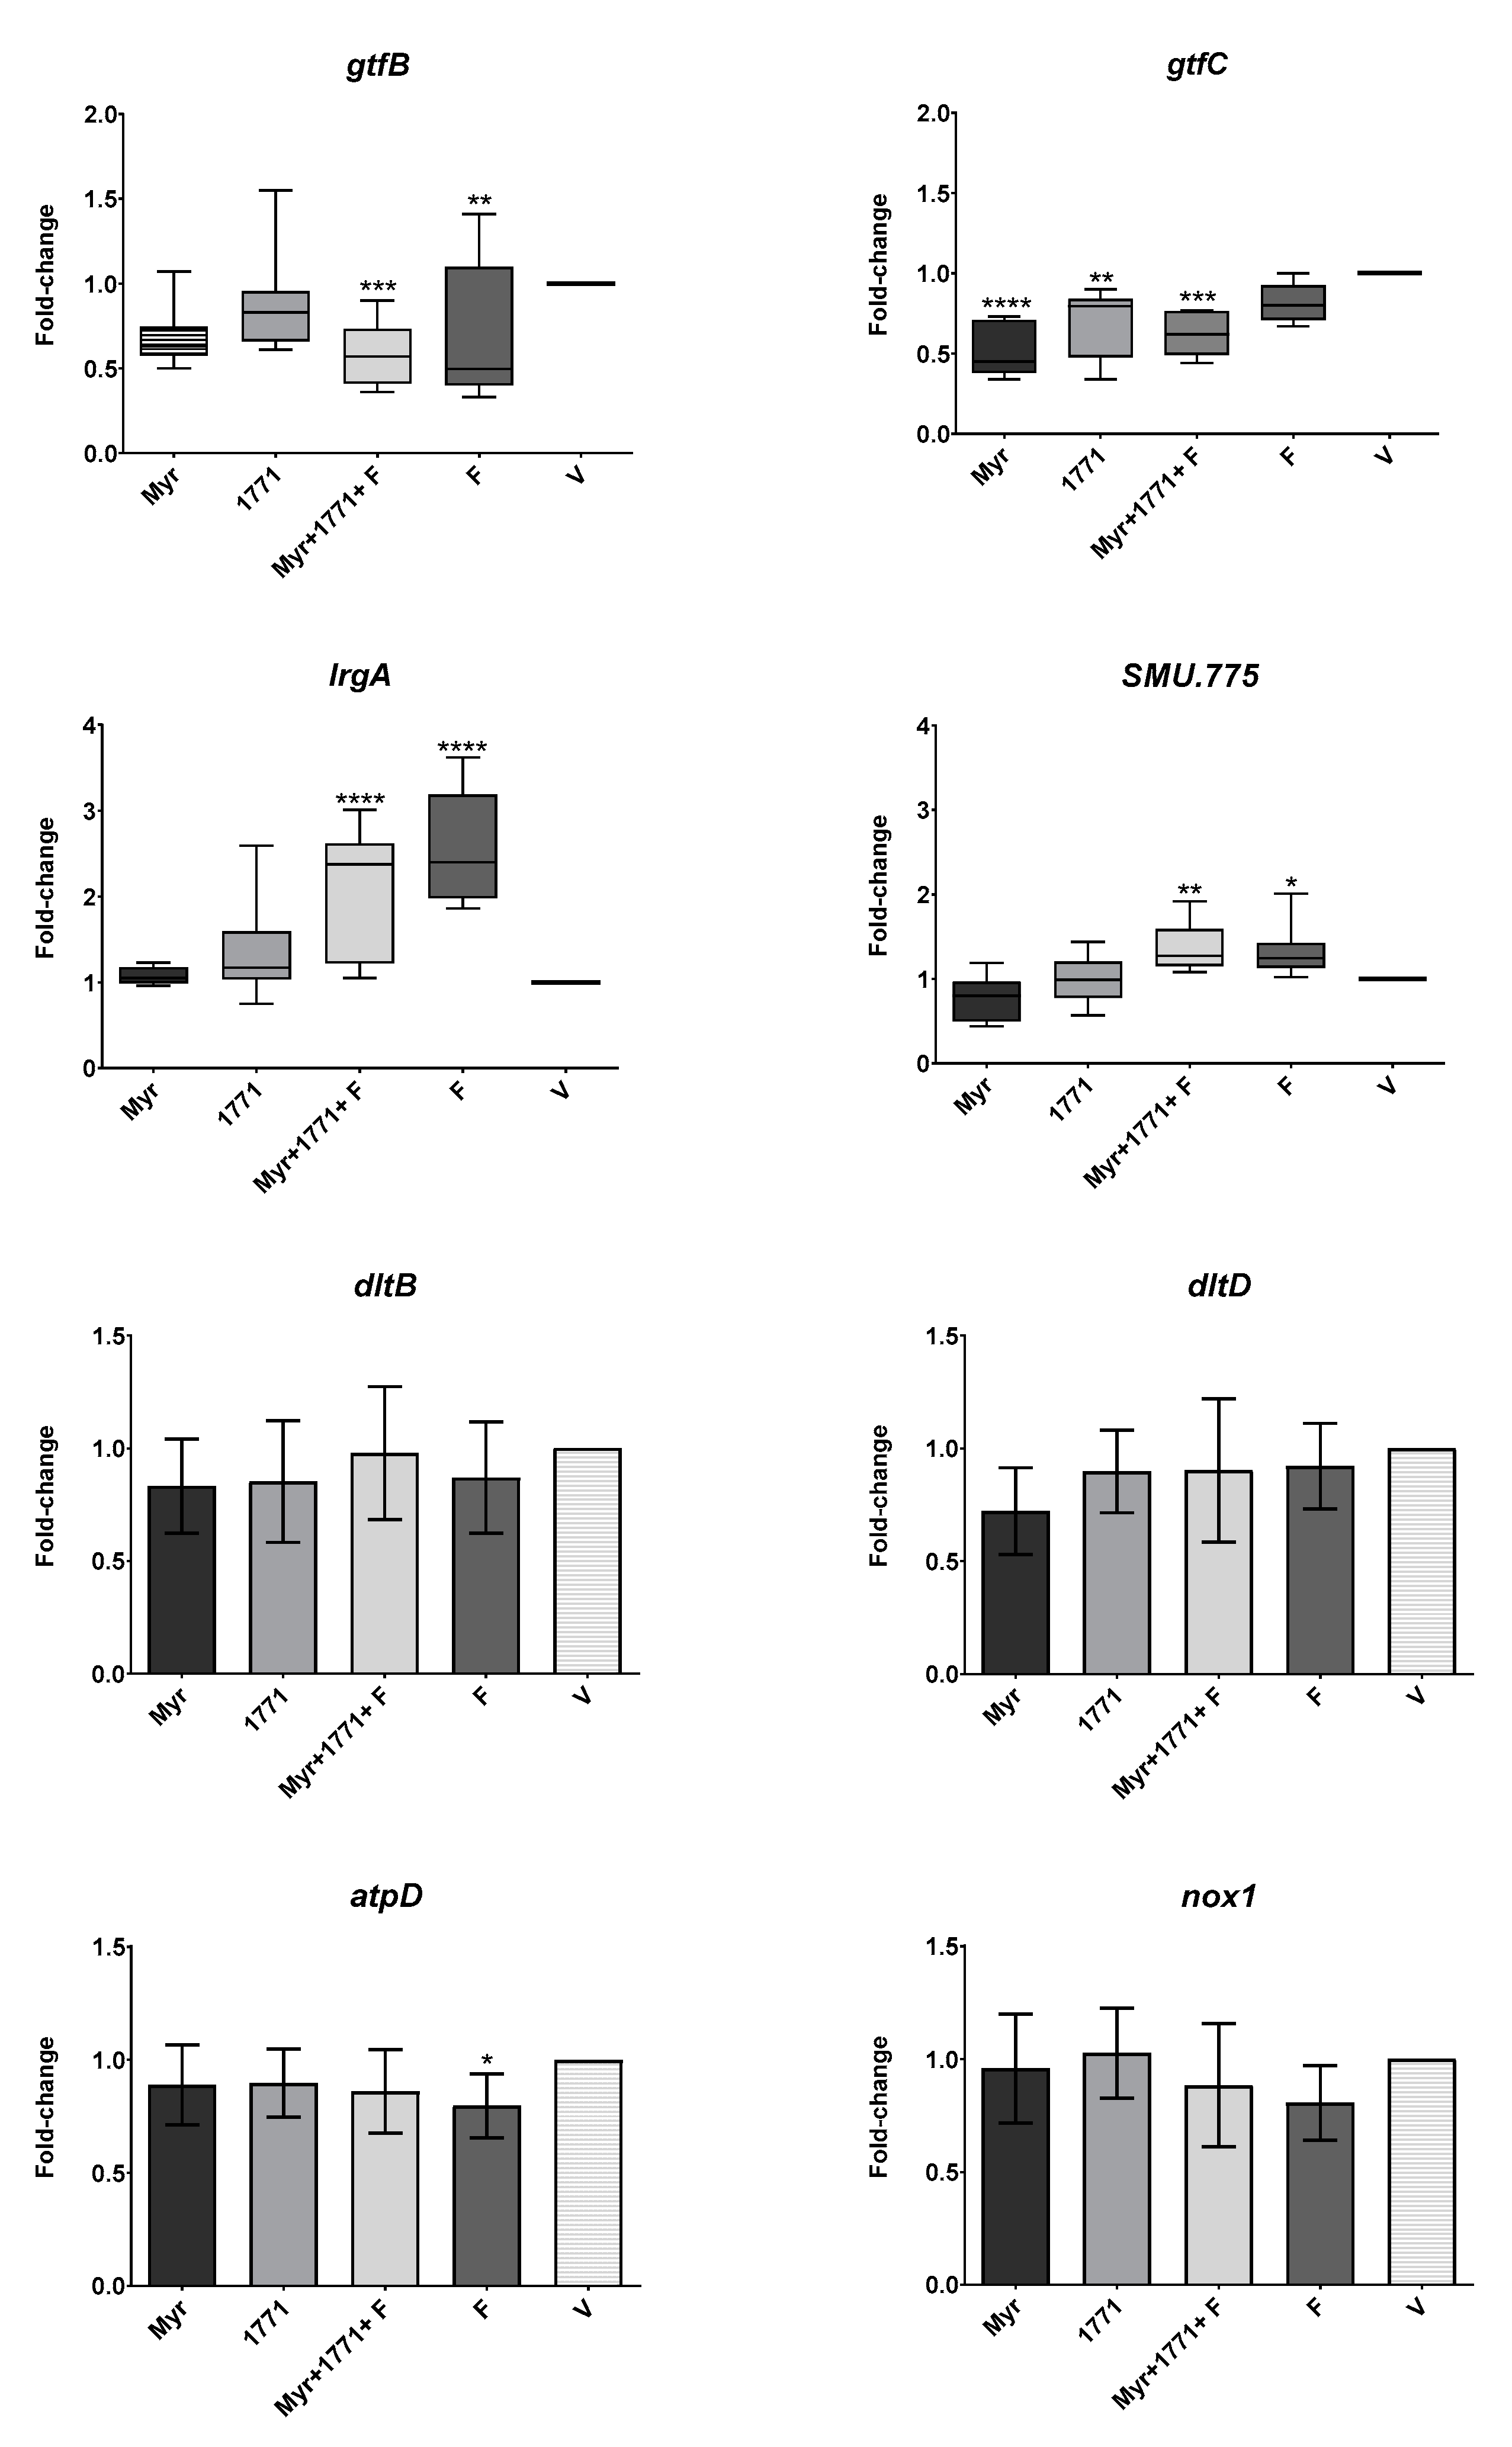
2.7.3. Gene Expression Analysis of Treated S. mutans Biofilms
Five treatments for biofilms were chosen to evaluate
S. mutans gene expression based on the data from biochemical analyses and 3D structure of biofilms: Myr, 1771, Myr + 1771 + F, F, and V (control). The
S. mutans assessed genes were associated with insoluble EPS (
gtfB and
gtfC), eDNA (
IrgA), LTA (
dltB,
dltD, and
SMU.775), and tolerance to acid (
atpD) and oxidative stresses (
nox1) [
6,
12]. Biofilms were grown and topically treated, as described earlier. At 46 h of growth that corresponds to 1 h after treatments, biofilms were removed and processed for total RNA isolation, followed by cDNA synthesis and quantitative PCR (qPCR) following the MIQE guidelines [
32].
The biofilms were dip-washed into wells containing sterile 0.89% NaCl solution (saline solution). Each biofilm (disc) was transferred to a glass tube containing 1 mL of RNAlater™ Stabilization Solution (Ambion, Austin, TX, USA). Next, 1 mL of RNAlater™ was used to wash the walls of each tube. The glass tubes with biofilms/discs were placed in a beaker and subjected to water-bath sonication for 10 min for biofilm detachment from discs. A sterile RNAse-free metal spatula was used to scrape off any remaining biofilm from each disc surface. Each biofilm suspension was transferred to a new centrifuge tube, and two mL of RNAlater™ were used to rinse the glass and the discs; this volume was recovered and stored in the corresponding centrifuge tubes. These biofilm suspensions were stored at −80 °C until RNA isolation.
RNA was extracted as described elsewhere [
33]. Briefly, biofilm suspensions in RNAlater™ were diluted 1:1 with 1xPBS (pH 7.2) and centrifuged (3220×
g, 20 min, 4 °C). The supernatant was discarded, and the resulting pellet was resuspended in 5 mL of 1xPBS, followed by sonication with a probe for 30 s at 7 w (Sonicator model Q125); this procedure was repeated twice. After, the pellet was resuspended in 750 μL NAES (50 mM sodium acetate buffer, 10 mM EDTA and 1% SDS; pH 5.0; Ambion) and 750 μL acid phenol (Ambion). This mixture was transferred to tubes containing glass beads, followed by mechanical disruption using a Bead-beater for 40 s (Biospec Products) and cooling samples by placing them on ice for 1 min. This homogenization procedure was repeated twice, and the samples were centrifuged (15,480×
g, 5 min, 4 °C; Centrifuge 5430R, Eppendorf). Then, RNA was extracted using the phenol-chloroform acid separation method and purified with DNAse in column (RNeasy Micro Kit, Qiagen, Austin, TX, USA) and solution (Turbo DNase; Ambion, Austin, TX, USA). DNAse was removed using the RNeasy MinElute clean-up kit (Qiagen). After purification, the total RNA amount (OD 260 nm) and purity (OD 260/280 ratio) were verified (DS-11 + Nano-spectrophotometer). The integrity of the purified RNA was determined by 1% agarose gel electrophoresis. RNA was diluted to a concentration of 100 μg/μL and stored at −80 °C until cDNA synthesis.
cDNA synthesis was performed in duplicate per sample using 0.5 μg of total RNA and the iScript kit (Bio-Rad Laboratories, Inc., Hercules, CA, USA). Negative controls were made without using reverse transcriptase to determine whether there was DNA contamination. Reactions were incubated using CFX96 Touch ™ Real-Time PCR Detection System (Bio-Rad), with the cycle: 25 °C/5 min, 42 °C/30 min, 85 °C/5 min, 4 °C ∞. The cDNA samples were stored at −20 °C until used for the quantification of gene expression (qPCR).
qPCR analyses were performed using specific primers from the literature [
6,
12]. cDNA was diluted 1:5 for specific genes and 1:1000 for the 16S rRNA gene (used for normalization of specific gene expression); cDNA negative controls were not diluted. cDNA and negative controls were amplified by a CFX96 System (Bio-Rad) using specific primers and iQ SYBR Green supermix (Bio-Rad). A standard curve was plotted for each primer set as detailed elsewhere [
34]. The reactions were run using the following cycle in a CFX96 System (Bio-Rad) equipment: step 1 (1×) 95 °C/3 min; Step 2 (35×) 95 °C/15 s, 58 °C/30 s, 68 °C/15 s (data collection); Step 3 (1×) 95 °C/1 min; Step 4 (1×) 55 °C/1 min; Step 5 (80×) 55 °C/1 min, for analysis of the melting curve. The standard curves were used to transform the Quantification Cycle (Cq) values to relative numbers of cDNA molecules. Relative expression was calculated by normalizing each gene of interest to the 16S rRNA reference gene. Next, these values were compared to those from biofilms treated with vehicle-control to determine the fold-change in gene expression.
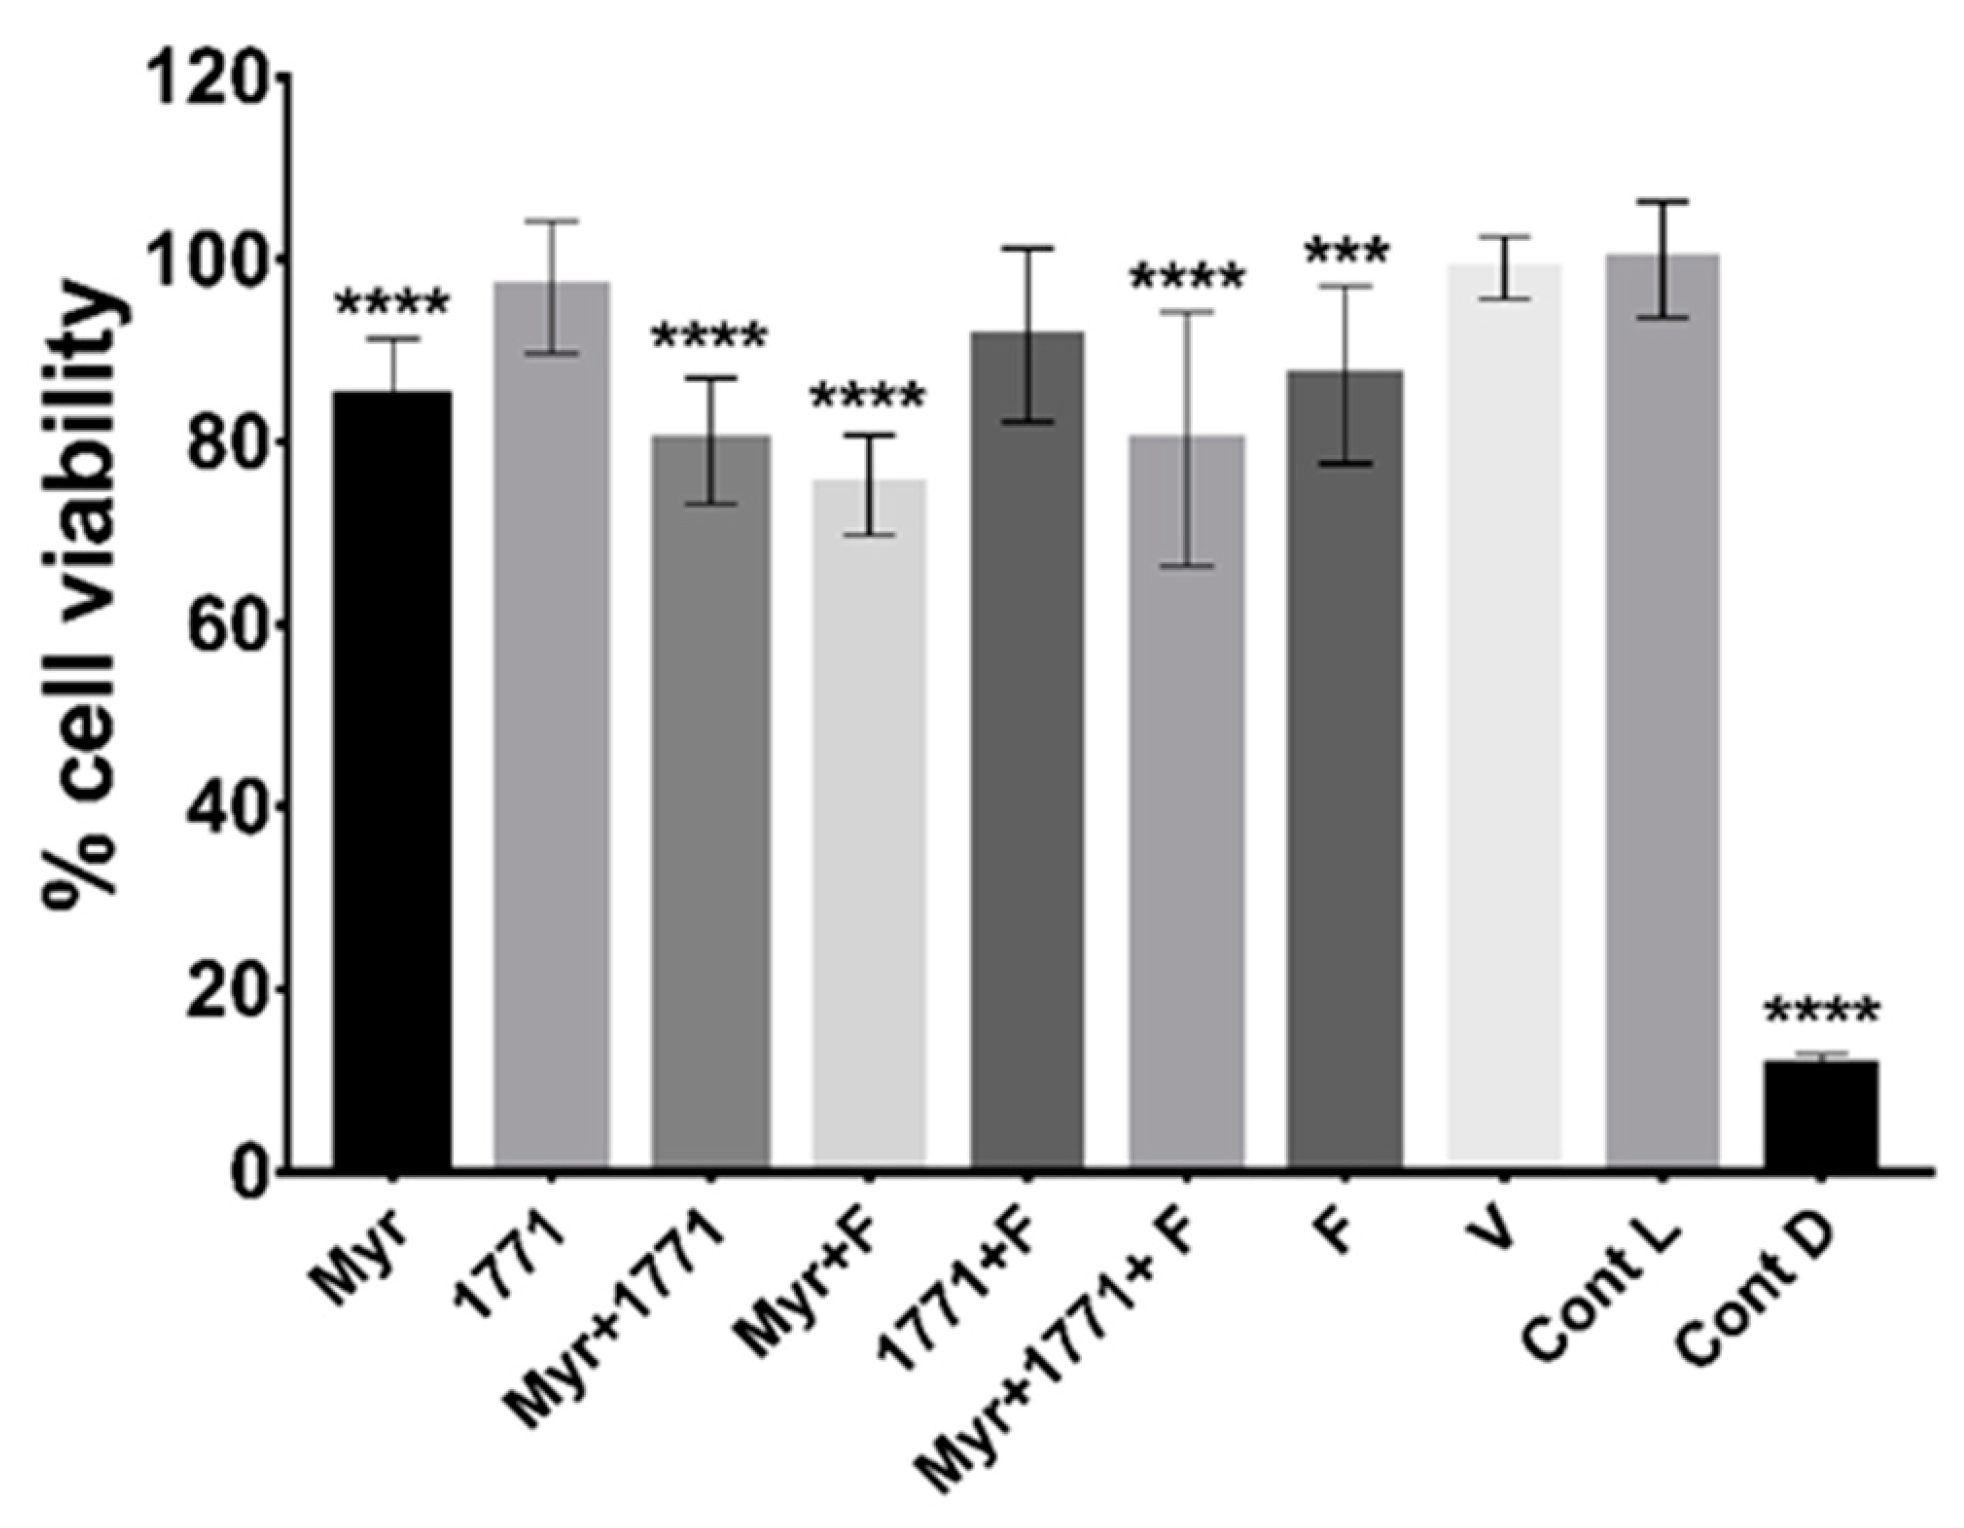
2.8. Cytotoxicity of Treatments
Oral keratinocytes NOK-si lineage [
35] cells were grown in Dulbecco’s Modified Eagle’s Medium (DMEM, GIBCO, Grand Island, NY, USA) with 2 mM glutamine; containing 10% fetal bovine serum (FBS, GIBCO, Grand Island, NY, USA), penicillin G (10.000 μg/mL), streptomycin (10.000 μg/mL) and amphotericin (25 μg/mL) (Invitrogen). The culture was incubated (37 °C, 5% CO
2/95% air atmosphere). The cells were grown to confluency (90%), washed with 1× phosphate buffer (140 mM NaCl, 3.0 mM KCl, 4.30 mM Na
2HPO
4, 1.40 mM KH
2 PO
4, pH 7.0), removed with trypsin (0.05%)/EDTA solution (0.53 mM) (Invitrogen), and then centrifuged (400×
g, 5 min). The cells were resuspended in the same culture medium and replated. The medium was changed every two or three days. For the experiments, cells between the 3rd and 8th passages were used. Cells were counted in Neubauer’s chamber and plated in 96-well microplate wells (2 × 10
4 cells well). The plates were incubated for 24 h (37 °C, 5% CO
2/95% air atmosphere).
Next, the cytotoxicity resulting from the presence of treatments (agents and vehicle control), death control (0.11% Triton X-100), and untreated control (cell viability control) on monolayer cells was determined by the colorimetric assay of viability cell MTT [3-(4,5-dimethylthiazol-2-yl) 2,5-diphenyltetrazolium bromide] (Sigma). This assay was performed using cell culture in monolayer, 1 h after contact with treatments and controls included in the culture medium. After the incubation period, the cells were washed with 500 μL of 1xPBS (pH 7.4) and incubated (37 °C, 5% CO
2/95% air atmosphere, 4 h) with 250 μL of MTT solution (5 mg/mL). Then the forming crystals were solubilized in 250 μL of 2-propanol added to each well. Spectrophotometric measurements were performed at a wavelength of 562 nm. Two experimental occasions were performed with 4 replicates per occasion (n = 8). The data obtained were converted into a percentage of viable cells and compared to the control without treatment (control of cell viability) [
36].
2.9. Statistical Analyses
The data were analyzed to evaluate whether the tested treatments affected
S. mutans biofilm using Prism 7 software (GraphPad Software, Inc., San Diego, CA, USA, 2018). The analyses were performed using descriptive and inferential statistics according to the distribution (Shapiro-Wilk test of normality; α = 0.05). The antimicrobial activity data of myricetin and compound 1771 showed a normal distribution and were evaluated with one-way ANOVA, Dunnett’s post-test (α = 0.05) (
Supplementary Materials). The anti-biofilm activity data of myricetin and compound 1771 did not present normal distribution, so it was evaluated with the Kruskal-Wallis test, with Dunn’s post-test (α = 0.05). The data obtained for topically treated biofilms presented a normal distribution; thus, data for the viable counts, biomass, matrix components (water-soluble and -insoluble EPS, eDNA, and LTA), biovolume quantification of bacteria and EPS were evaluated by one-way ANOVA, followed by test Tukey’s multiple comparisons (α = 0.05). The gene expression data were normalized by the 16S rRNA gene data, followed by an analysis of the fold change relative to the vehicle. Data for gene
gtfB,
gtfC,
IrgA, and
SMU.775 did not present normal distribution and were examined using the Kruskal–Wallis test, followed by Dunn’s post-test (α = 0.05). Meanwhile, data for genes
atpD,
nox1,
dltB, and
dltD presented a parametric distribution and were evaluated via one-way ANOVA, followed by test Tukey’s multiple comparisons (α = 0.05). The data from cytotoxic assays presented normal distribution and were evaluated using one-way ANOVA, followed by test Tukey’s multiple comparisons (α = 0.05).
4. Discussion
Approaches combining bioactive agents with fluoride for preventing cariogenic biofilm development have been proposed, including compounds that affect the production of an EPS-rich matrix [
22,
37]. Because EPS interacts with eDNA and LTA the extracellular matrix [
9] and meddling with genes associated with EPS, eDNA and LTA reduces the cariogenicity of
S. mutans [
13], the current study investigated whether a compound that targets LTA metabolism in Gram-positive bacteria and works as an antimicrobial [
23,
24] would be effective for topical treatment and whether combining this agent with a flavonoid that hinders EPS production and fluoride would have a more pronounced effect in hampering
S. mutans biofilm development.
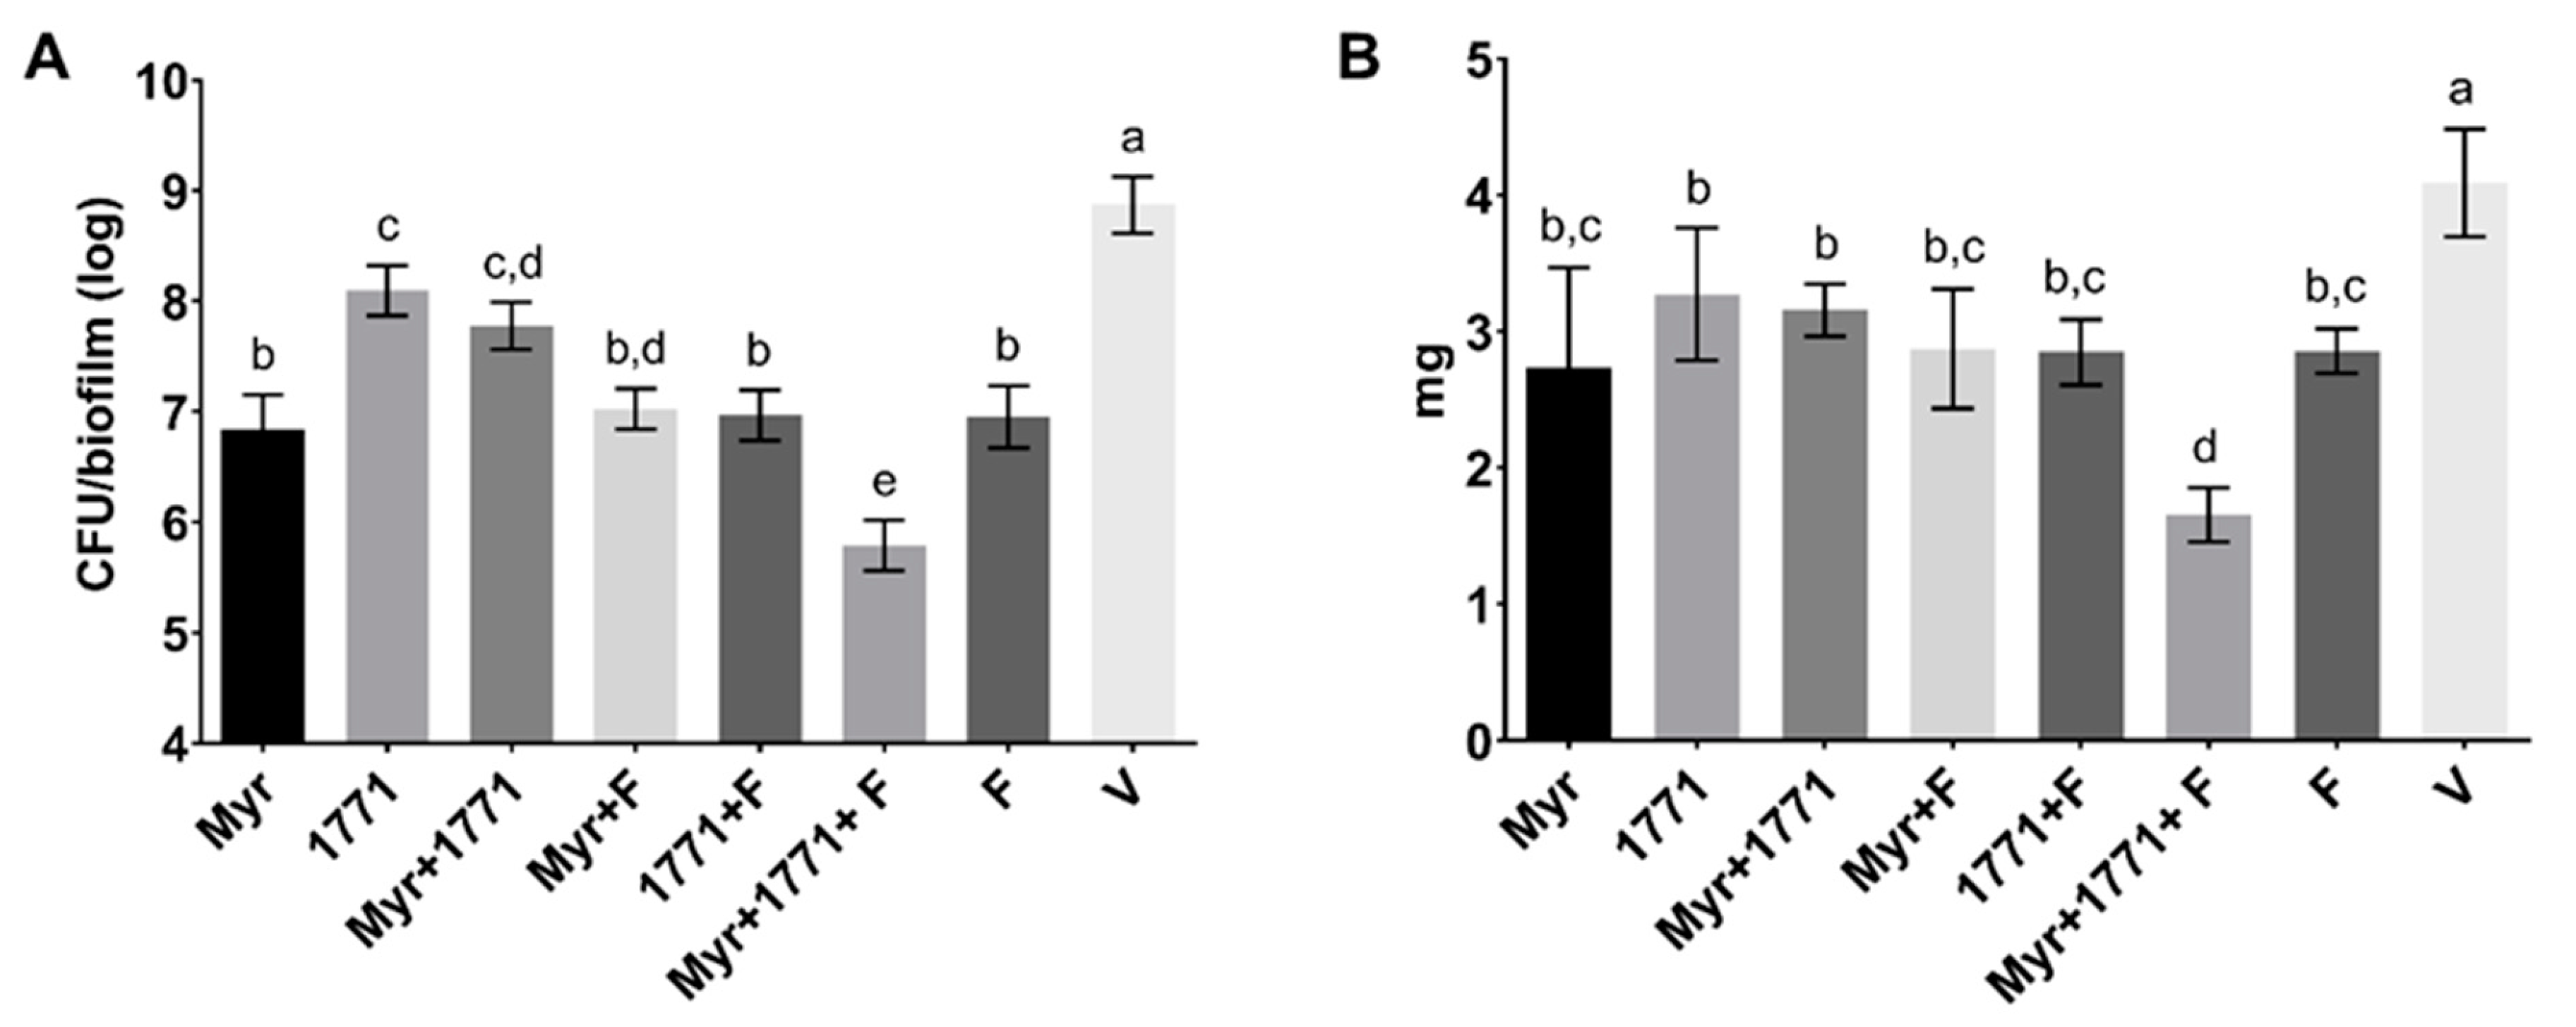
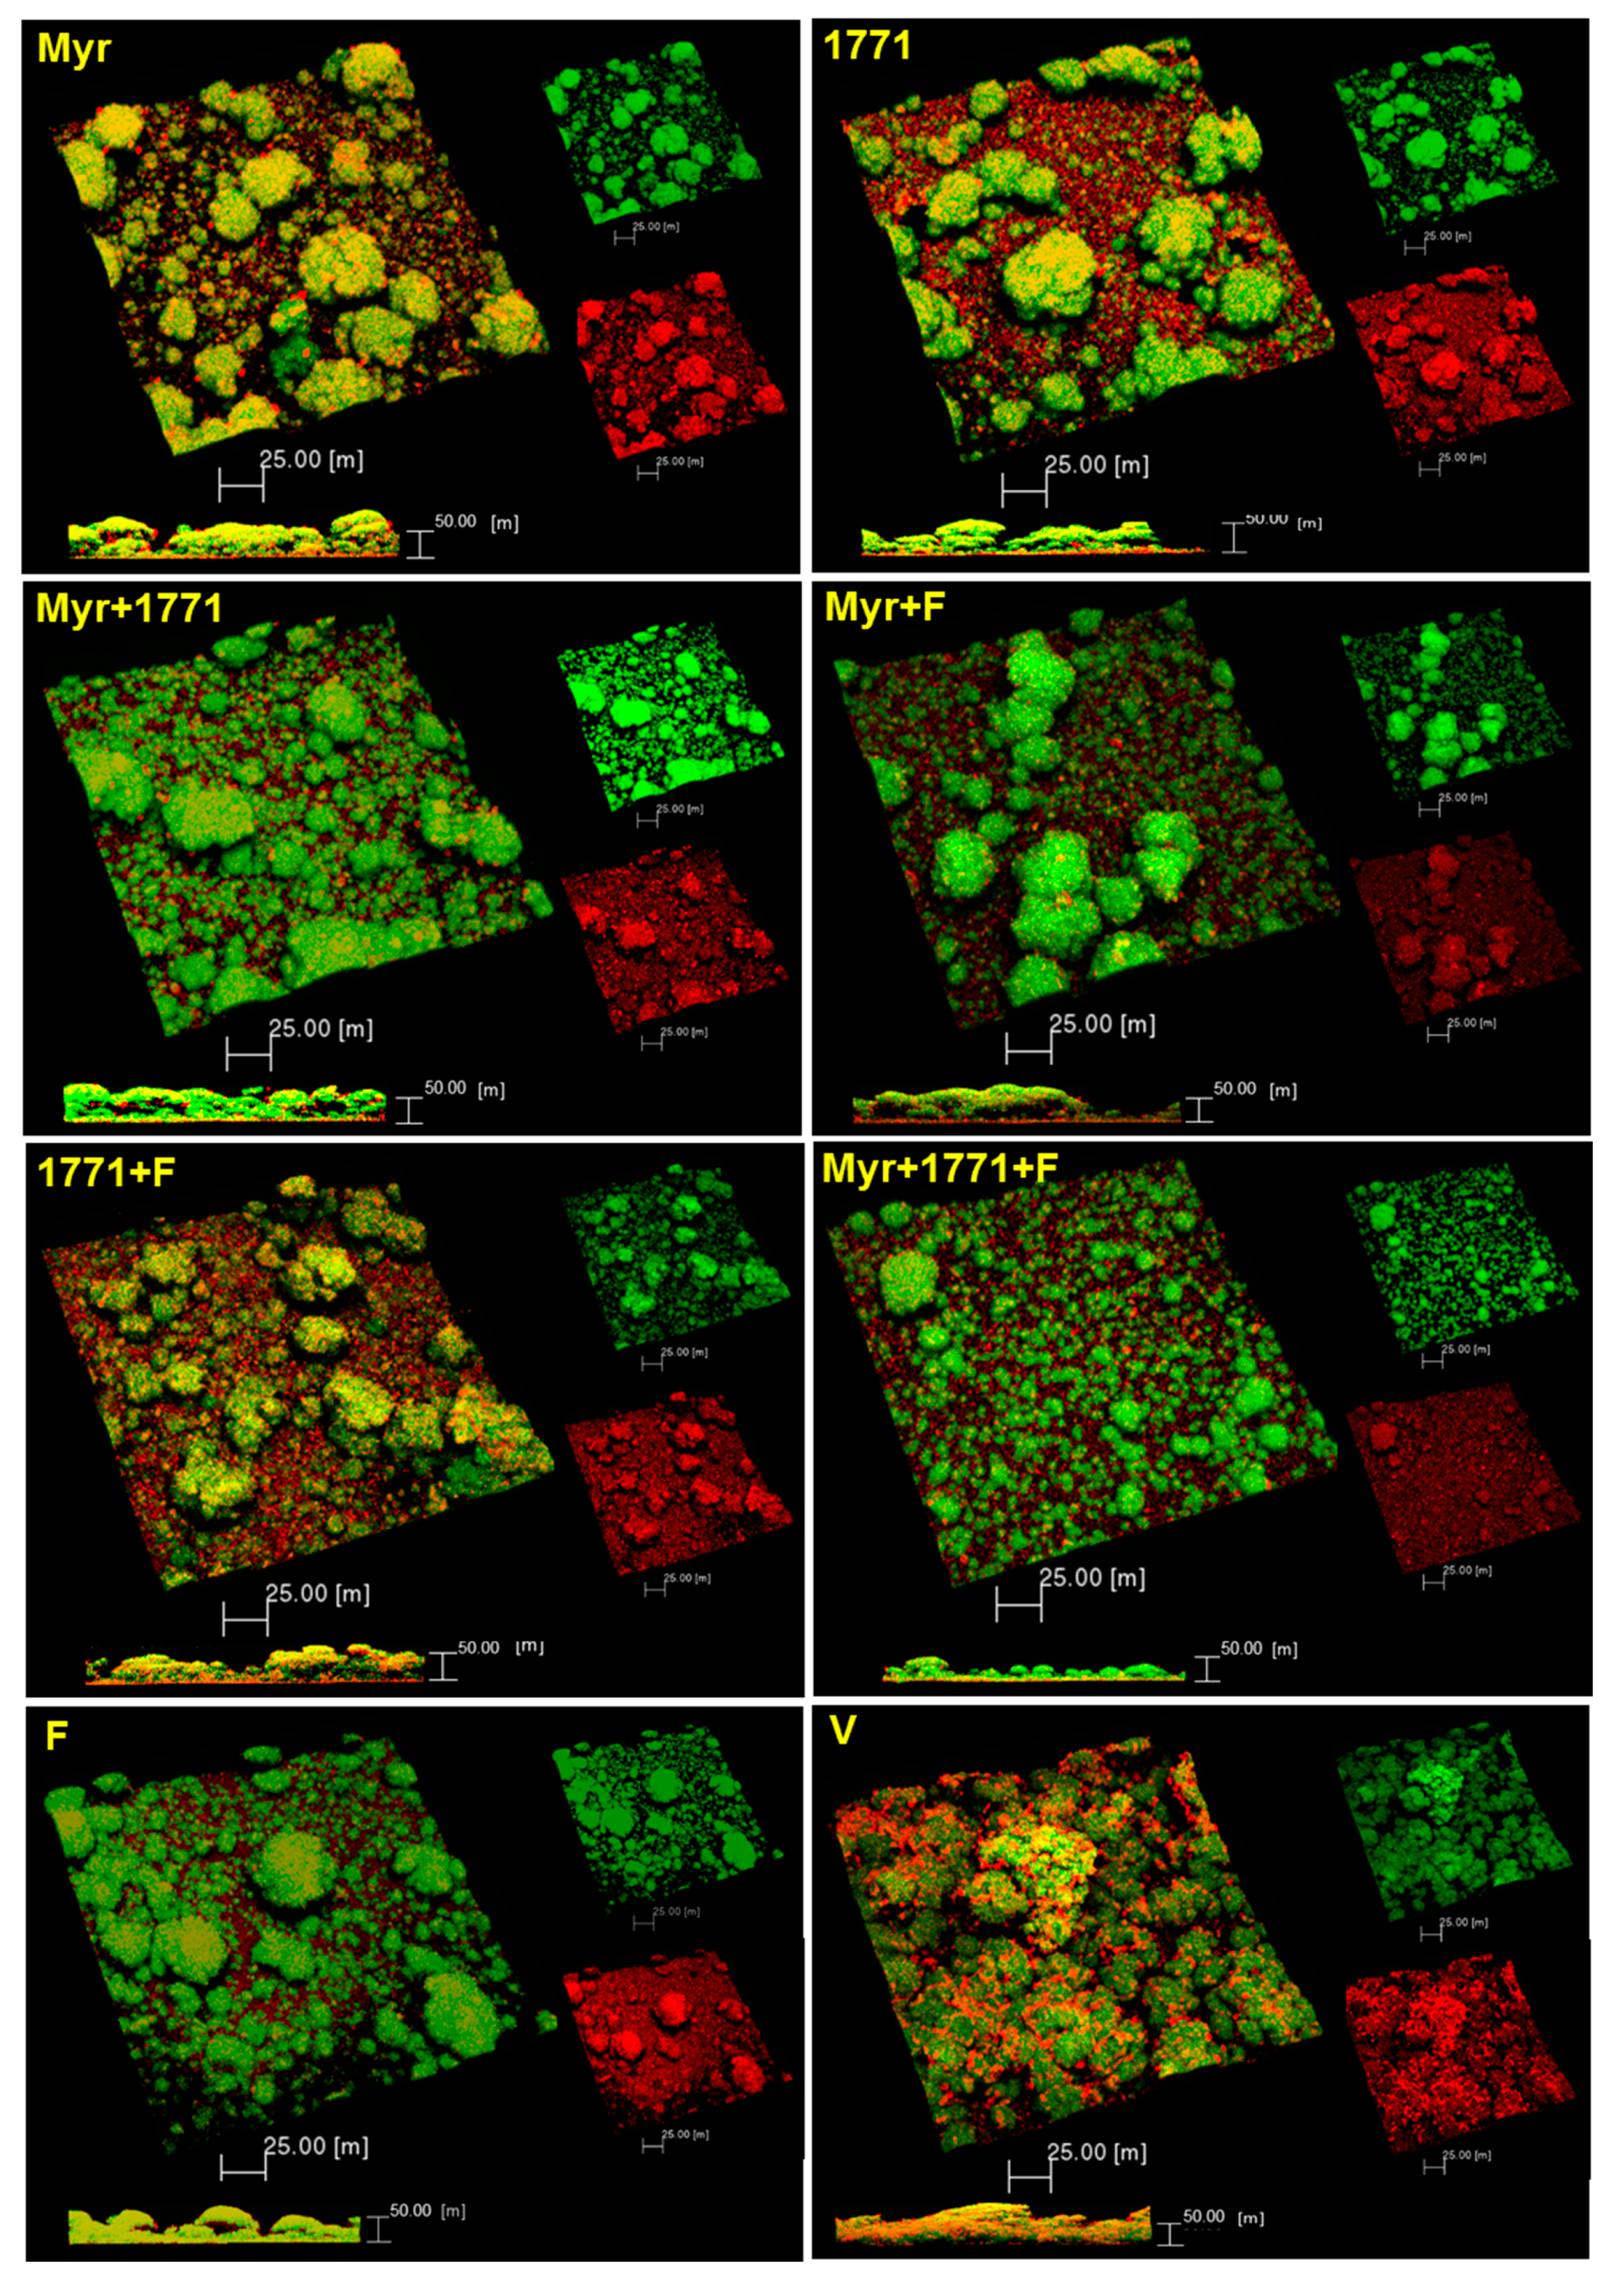
The topical application of compound 1771 and myricetin alone prevented the accumulation of
S. mutans biofilm in vitro. However, the effect was more accentuated in the polystyrene plate model in which the agents were present for 24 h and not 1.5 min. The effect of compound 1771 could be because it had an antimicrobial effect [
23], inhibiting bacterial growth in the biofilm, and by causing an alteration in the bacterial cell surface (change in LTA) that could hinder EPS binding. Nonetheless, the effect was more pronounced when compound 1771 was associated with myricetin and fluoride, affecting the amount of matrix components and the 3D architecture of biofilms. The combination of compound 1771 + myricetin + fluoride reduced three logs of
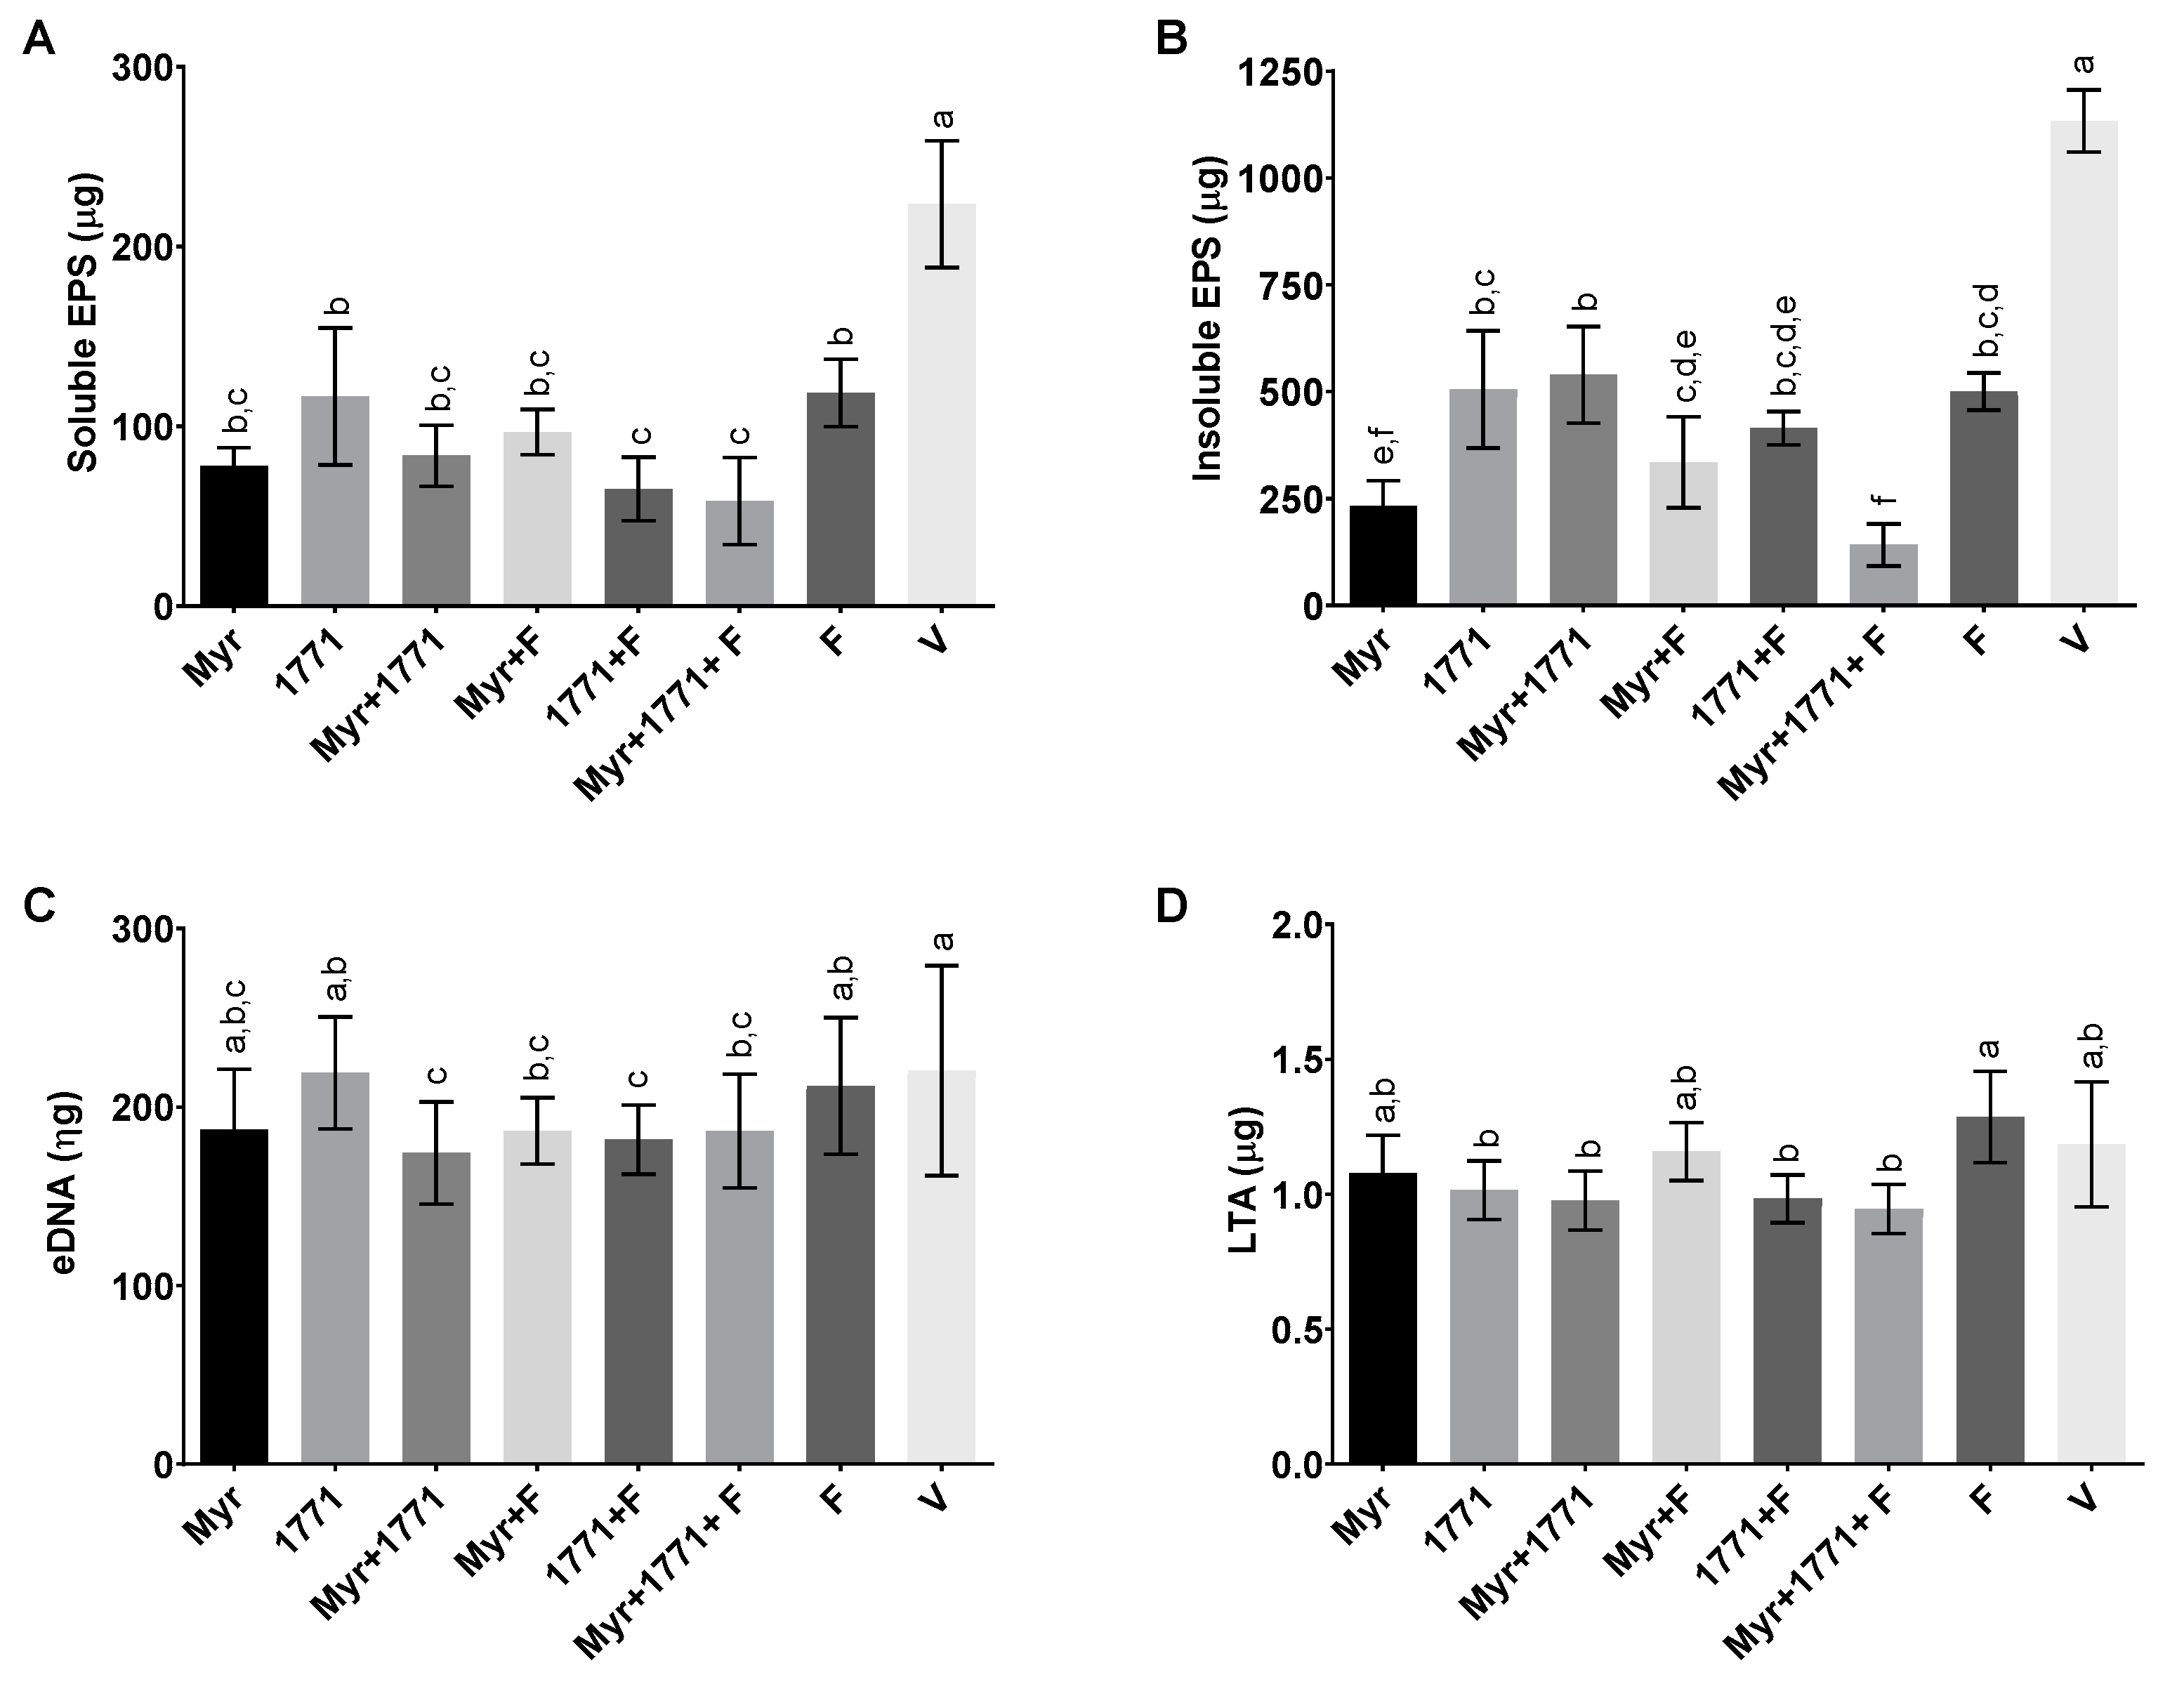
S. mutans counts, ≈60% of the biomass, ≥74% water-soluble and -insoluble EPS, and ≈20% of LTA in the matrix (vs. vehicle;
Figure 5 and
Figure 6). Nevertheless, the slight changes in the quantities of eDNA and LTA could affect the 3D organization of the biofilms, as both biomolecules interact with EPS in the matrix at distinct stages of biofilm development; eDNA at the early phases while LTA during the later phases of biofilm development [
9]. Therefore, these effects may have been caused by the interaction of the flavonoid with exoenzymes GtfB and GtfC and by repression of the genes that encoded them, decreasing EPS biosynthesis, as observed in previous studies [
20,
22], and 3D structure (
Figure 7 and
Figure 9). Moreover, the agents combined with fluoride lead to higher pH values in the spent media (vs. vehicle or agents alone or combined). At 67 h (after incubation in sucrose and starch), all treatments yielded pH values higher than the vehicle, especially the combination strategy Myr + 1771 + F (
Figure 4), indicating that the bacterium acid production ability was compromised, either because these agents interfered with glycolysis or lower quantity of viable cells in these biofilms (
Figure 5). Inhibition of the dynamic processes that occur within a biofilm can minimize or avoid the damage caused by it on teeth surfaces and prevent dental caries.
EPS synthesis and its 3D organization in the matrix is a determinant factor in the etiology of dental caries [
7]. Here, the expression of
gtfB and
gtfC genes was lower in biofilms treated by the combination of Myr + 1771 + F (
Figure 10). Although the magnitude of the differences was lower than 2-fold (
Figure 10), biologically, the accumulative products resulting from the differences in the expression of
gtfB and
gtfC is shown as lower quantities of EPS, distribution of EPS, and size of microcolonies. The expression of
gtfB was also repressed by fluoride, and the expression of
gtfC was down-regulated by Myr and 1771 alone. These differences may be because GtfB produces water-insoluble EPS, while GtfC produces both water-soluble and -insoluble EPS, and the location where these exoenzymes bind preferentially. GtfB has more affinity to the cell wall and GtfC to the pellicle; the differences in the location of these active exoenzymes can explain the distinct pattern of 3D structure found for treated biofilms.
Moreover, repression of
gtfB and
gtfC may explain the reduction of water-soluble and -insoluble EPS in the matrix. As GtfB binds to the surface of the microorganisms and the surface of hydroxyapatite [
38], the EPS formed on the microbial surface improves the interactions between the microorganisms, cellular aggregation, and increases the cohesion of the biofilm [
39]. Of note, the expression of the genes associated with the synthesis, binding, and remodeling of exopolysaccharides is reduced in a deletion strain of the
gtfB gene [
12]. Therefore, the adverse effect on
gtfB gene expression justifies the low content of water-insoluble EPS and biomass in biofilms treated with myricetin, compound 1771 combined or not with fluoride; resulting in a biofilm with disadvantages in the survival and persistence of virulent organisms. Fluoride makes an active contribution to the repression of
gtfB, regardless of concentration (125 or 250 ppm F) [
21].
Although eDNA quantification showed statistically significant differences for the combination of myricetin, 1771 compound with or without fluoride, compared to the effect of treatments on EPS, myricetin and compound 1771 affected the amount of eDNA to a lesser extent (
Figure 6). This matrix component is important in the construction, 3D architecture, and stability of the extracellular matrix [
7,
9], and the virulence of
S. mutans biofilms [
13]. Surprisingly, the expression of
lrgA was higher in biofilms treated with the combination of Myr + 1771 + F and F alone; thus, this behavior may be associated with fluoride.
lrgA gene involved in
S. mutans cell-wall remodeling and autolysis process that can yield eDNA [
40,
41]. Therefore, an increase in expression of
lrgA may indicate that these treatments trigger cell wall remodeling and/or to autolysis. Furthermore, eDNA can be actively secreted from live
S. mutans cells via additional metabolic pathways involved in protein secretion and components for protein insertion into membranes (i.e., Ffh, YidC1, and YidC2) [
8]. However, eDNA may be release but may not be incorporated in the matrix if treatments are impeding EPS synthesis and/or binding. Consequently, eDNA, as a soluble component, could be in the spent medium [
42,
43], or being consumed as a nutrient during the periods with low carbohydrate concentration in the medium and not as part of the structure of biofilms thereby affecting the 3D architecture of treated biofilms (vs. vehicle control).
In addition, the LTA content in the matrix of the biofilms treated was not that different. Nonetheless, LTA quantities were significantly reduced in those subjected to the four treatments containing compound 1771 (1771 alone, 1771, Myr + 1771, 1771 + F, and Myr + 1771 + F) (
Figure 6). A small reduction in LTA may also be contributing to alteration in the biofilm architecture,
S. mutans viable population, biomass, and EPS in the matrix. Interestingly, the expression of gene
SMU.775 was induced by the combination of Myr + 1771 + F and F alone, while 1771 or myricetin alone yield similar expression to the vehicle-control. Thus, the induction of SMU.775 could be because of fluoride per se, as for
lrgA.
SMU.775 is a hypothetical gene with homology to the LTA synthase from
S. aureus and so, could be involved in the metabolism of LTA [
12]. However, there were no significant differences in the expression of genes
dltB and
dltD for the tested treatments and the vehicle (
Figure 10). Hence, the tested agents alone or combined with or fluoride did not affect the expression of
dltABCD operon genes involved in the addition of D-alanine residues during LTA synthesis [
44]. Several studies demonstrated that interfering with the D-alanization process of LTA affects the cell surface charge and susceptibility to antimicrobials [
45,
46,
47]. Nevertheless, it is possible that the compound 1771 interfered with the LTA metabolism and affected the cell surface charge and/or composition, thereby interfering with how EPS would bind to cells and mediate the formation of microcolonies and EPS distribution in the 3D structure of treated biofilms.
During biofilm development, the microbial cells produce components for the extracellular matrix, and these components attach to the cell wall and to the substrate (i.e., the surface where biofilm grows on) [
48]. Thus, alterations in the cell wall turnover and composition (and charge), or quality and quantity of matrix’ components, can interfere with cell-cell binding, cell-matrix, cell-matrix-dental surface, modifying the 3D architecture of biofilms and its cariogenic potential. Furthermore, the microbial cells in biofilms with distinct 3D structures may respond differently to environmental stresses.
S. mutans possess a vast arsenal to cope with these stressors, especially acidic environment, and oxidative stresses.
Here, the expression of nox1 related to the oxidative stress response was similar between the tested treatments and vehicle control (
Figure 10). However, the F slightly decreased the expression of
atpD, involved in
S. mutans acid tolerance (
Figure 10). Fluoride affects the glycolytic activity in cells and inhibits intracellular enzymes when it interferes with membrane proton permeability [
49], which would affect the tolerance of
S. mutans to the acidic microenvironments within a biofilm [
19,
21]. Myricetin also contributes aciduricity via inhibition of glycolytic activity by altering membrane permeability [
21]. Nevertheless, herein, when myricetin and 1771 were used alone or in combination with fluoride to treat biofilms, these agents did not interfere with the expression of
atpD, which could be because of the concentrations used, exposure time and/or their effect would be detected at a different biofilm developmental phase. Nonetheless, it was demonstrated that insoluble glucans are an essential factor linking acidogenicity with aciduricity [
50]; thereby, the combination tested here would not only influence the matrix composition and viable counts but how the cells in the biofilm respond to an acidic environment during biofilm growth.
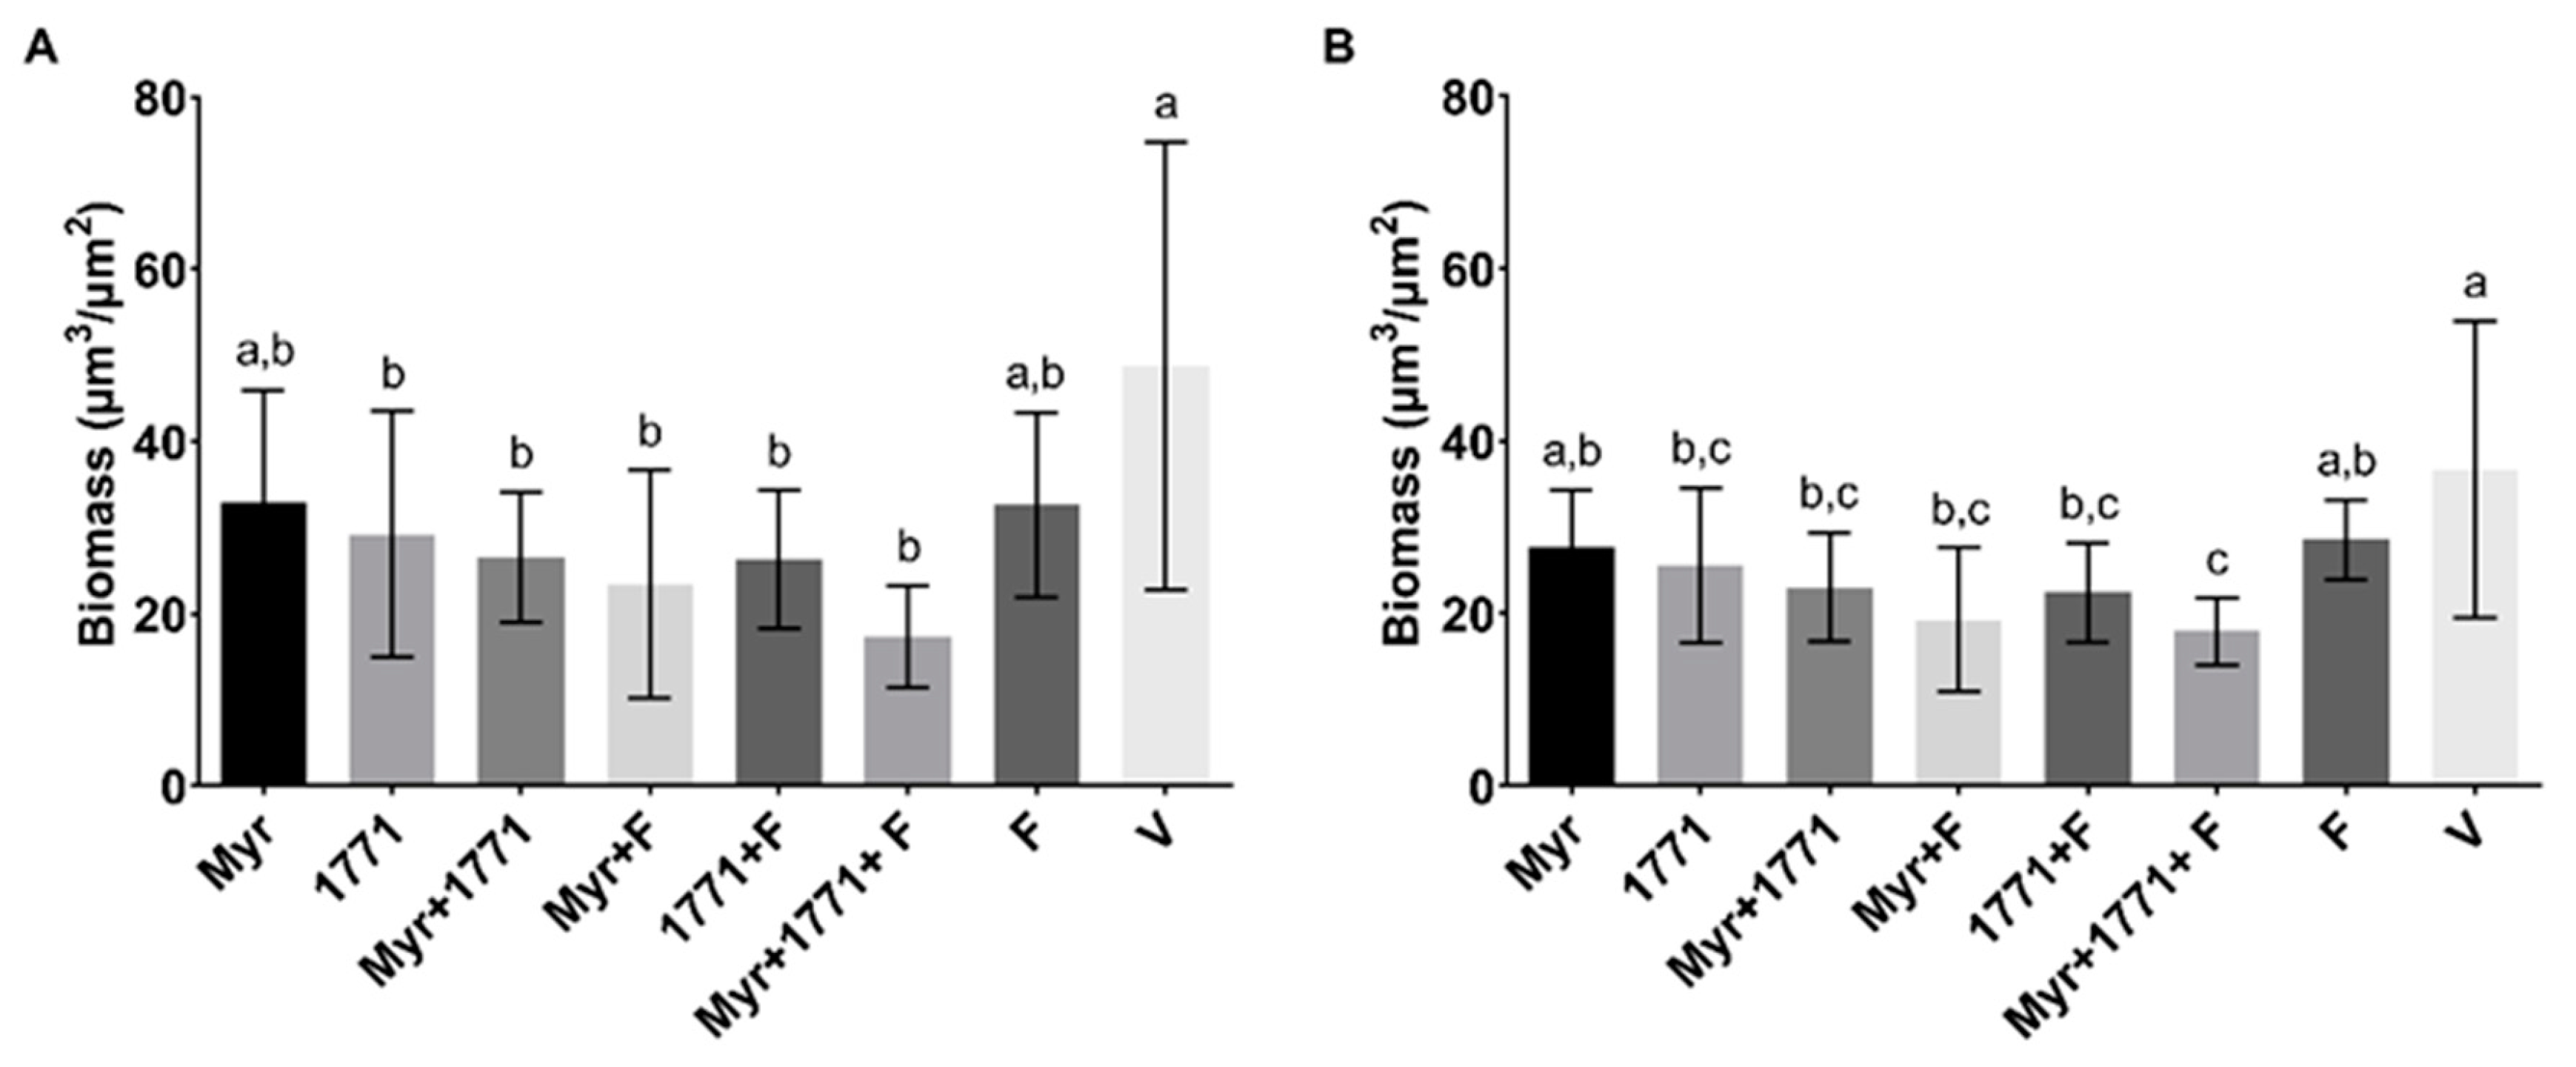
The combination strategy yielded lower EPS matrix production and the number of small microcolonies (
Figure 7,
Figure 8 and
Figure 9). The morphology of the microcolonies and EPS distribution can influence the diffusion of the metabolites and the action of agents in biofilms. Within larger microcolonies, acidic niches are created, with pH values 4.5–5.5, and cell death by cationic chlorhexidine is decreased [
6]. The persistence of these acidic microenvironment leads to dental demineralization. Thus, the use of myricetin and compound 1771 combined with fluoride could be an ally in reducing the pathogenicity of the dental biofilm. Usage of myricetin and compound 1771 is not intended to eliminate fluoride but to improve the cariostatic efficacy of this product due to the advantages. Although the
S. mutans biofilm model employed here for twice-daily topical treatments does not mimic the biological interaction of microorganisms within a cariogenic dental plaque, it shows that the tested agents interfered with critical cariogenic properties. Future studies should dissect how the proposed combination of Myr + 1771 + F affects the complex oral microbiota and prevents carious lesions in vivo, and whether increasing the concentration of agents and/or exposure/retention time (e.g., via drug-delivery systems) could improve the effectiveness of this combination.
In summary, the topical application of a compound that modulates lipoteichoic acid metabolism prevented the accumulation of S. mutans biofilm in vitro. Moreover, the effect was more pronounced when compound 1771 was associated with fluoride and a flavonoid. Nevertheless, the effects of a formulation with the three agents combined should be further tested in preclinical studies, testing distinct concentration to potentiate the effect to uncover its therapeutic potential fully.

 ,
, 


