
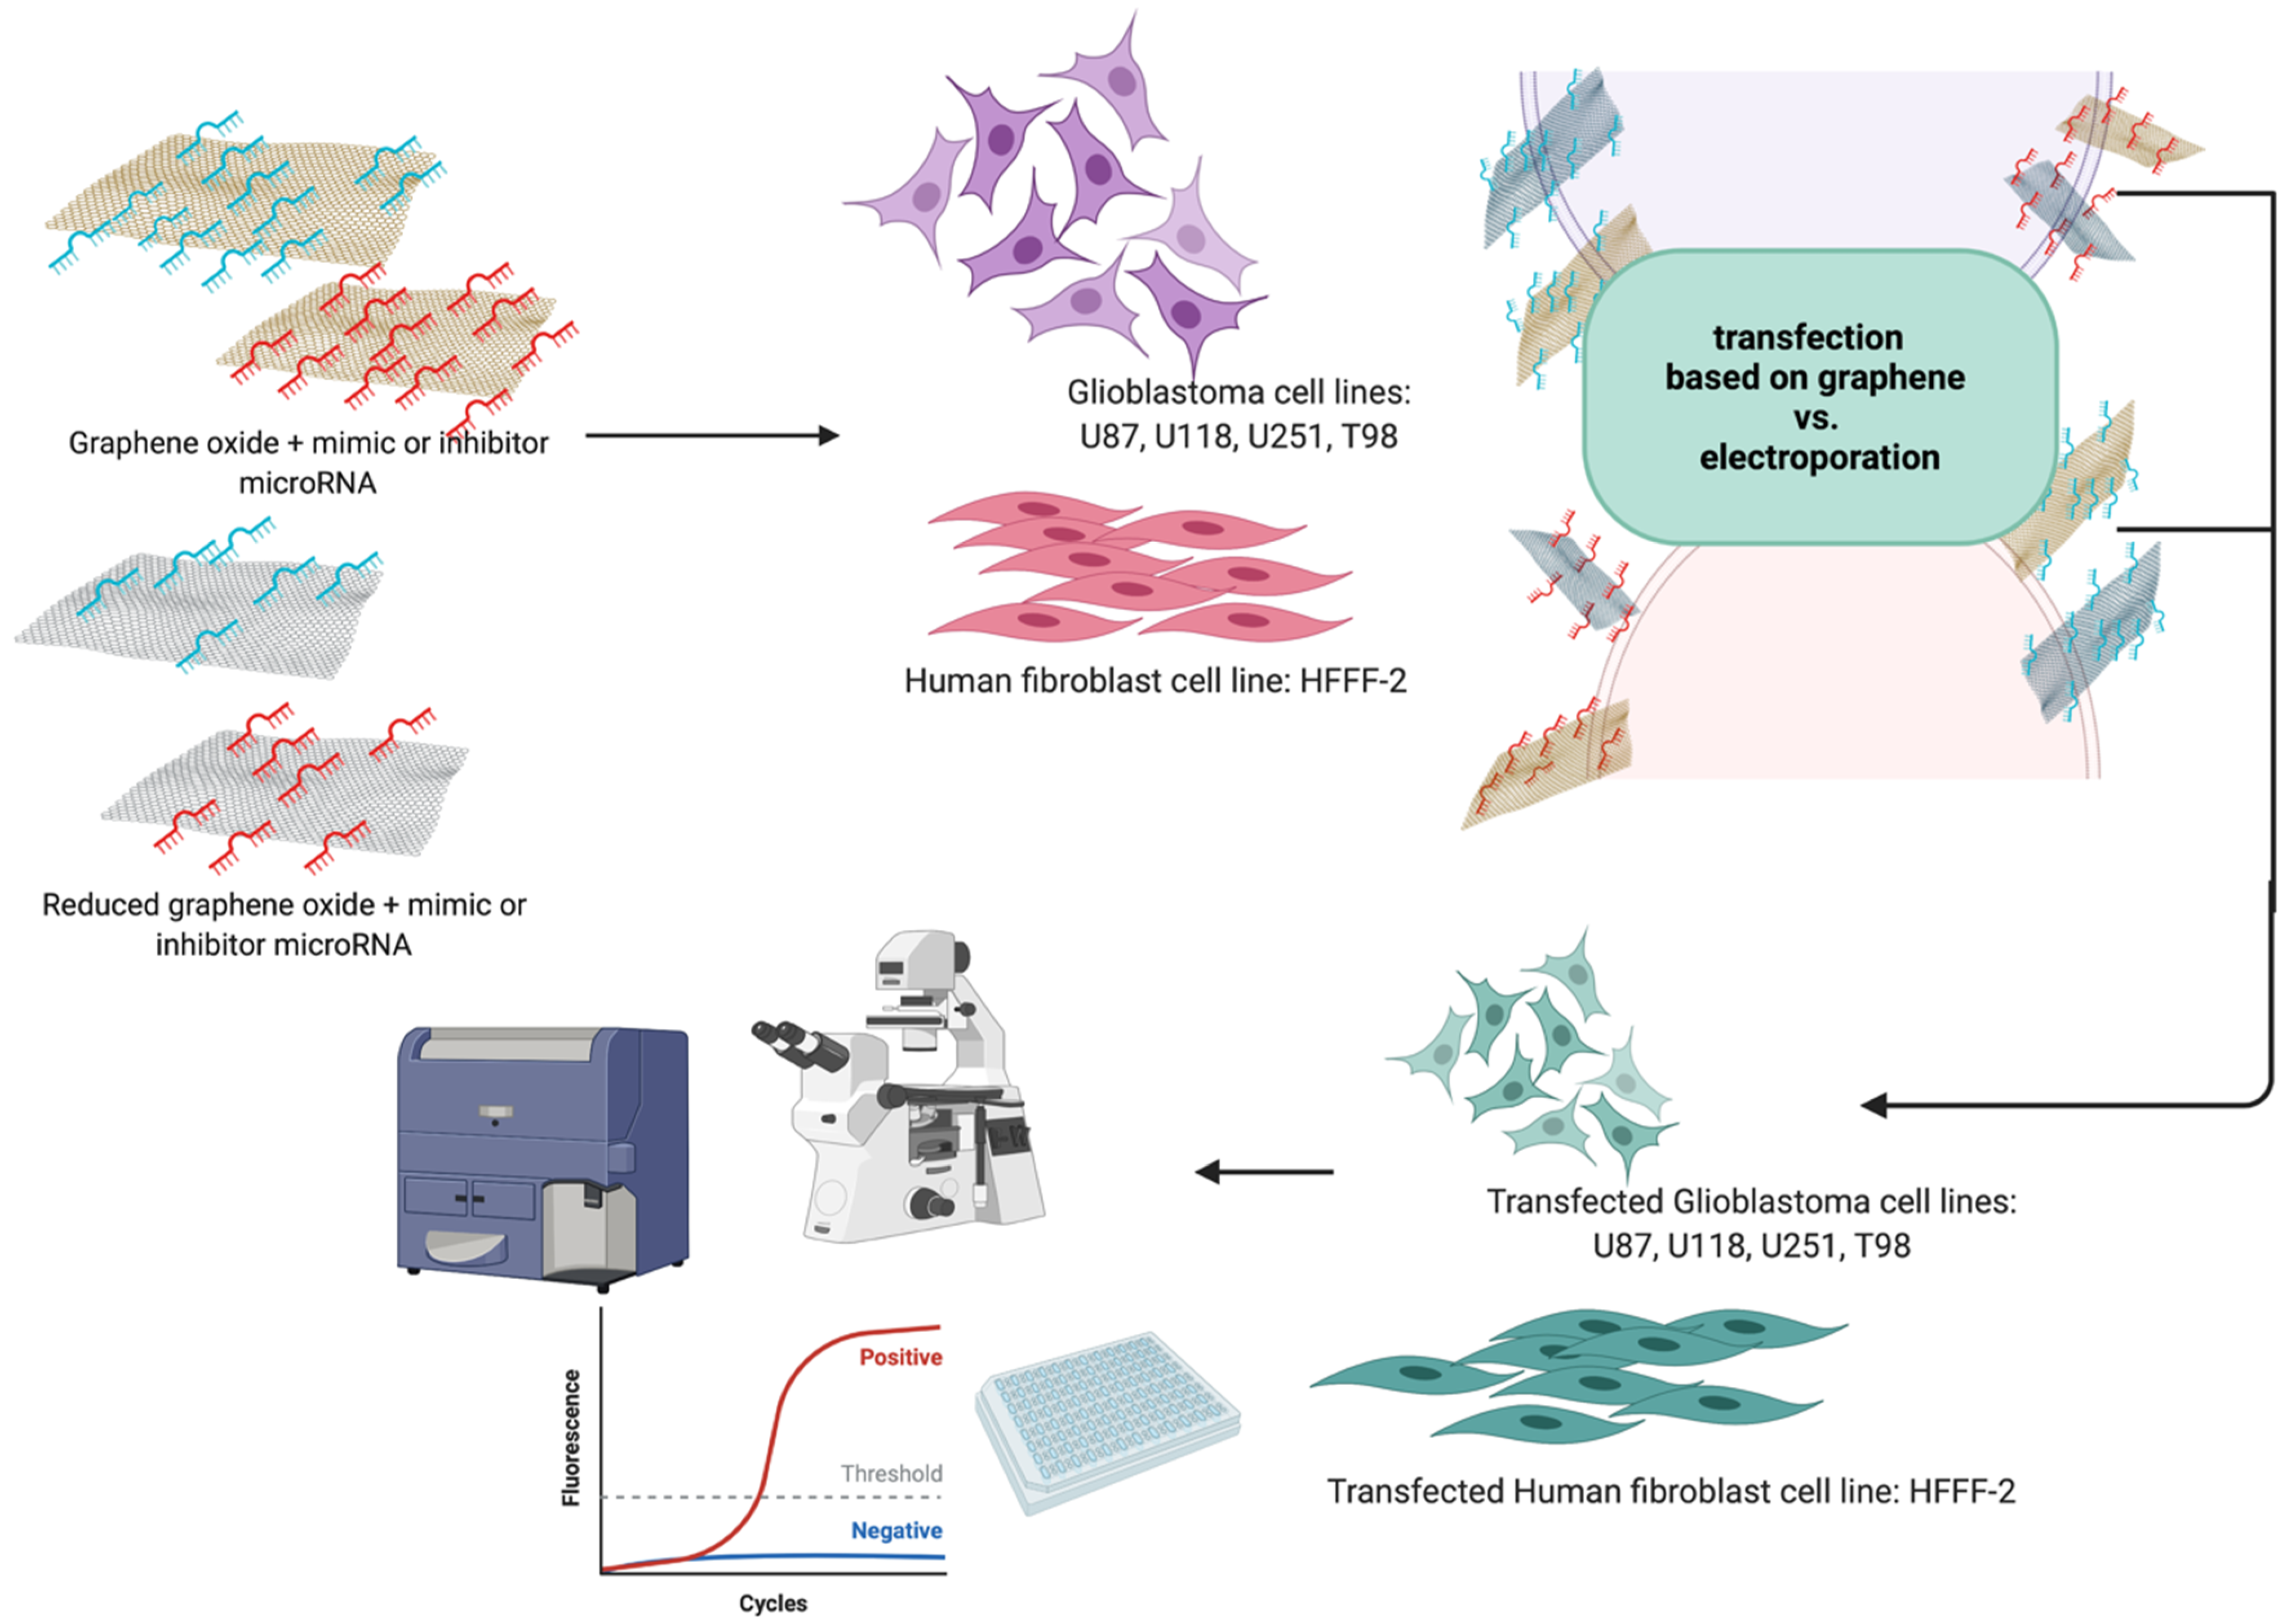
MicroRNA Delivery by Graphene-Based Complexes into Glioblastoma Cells

 , , , , and
Abstract
:1. Background
2. Results and Discussion
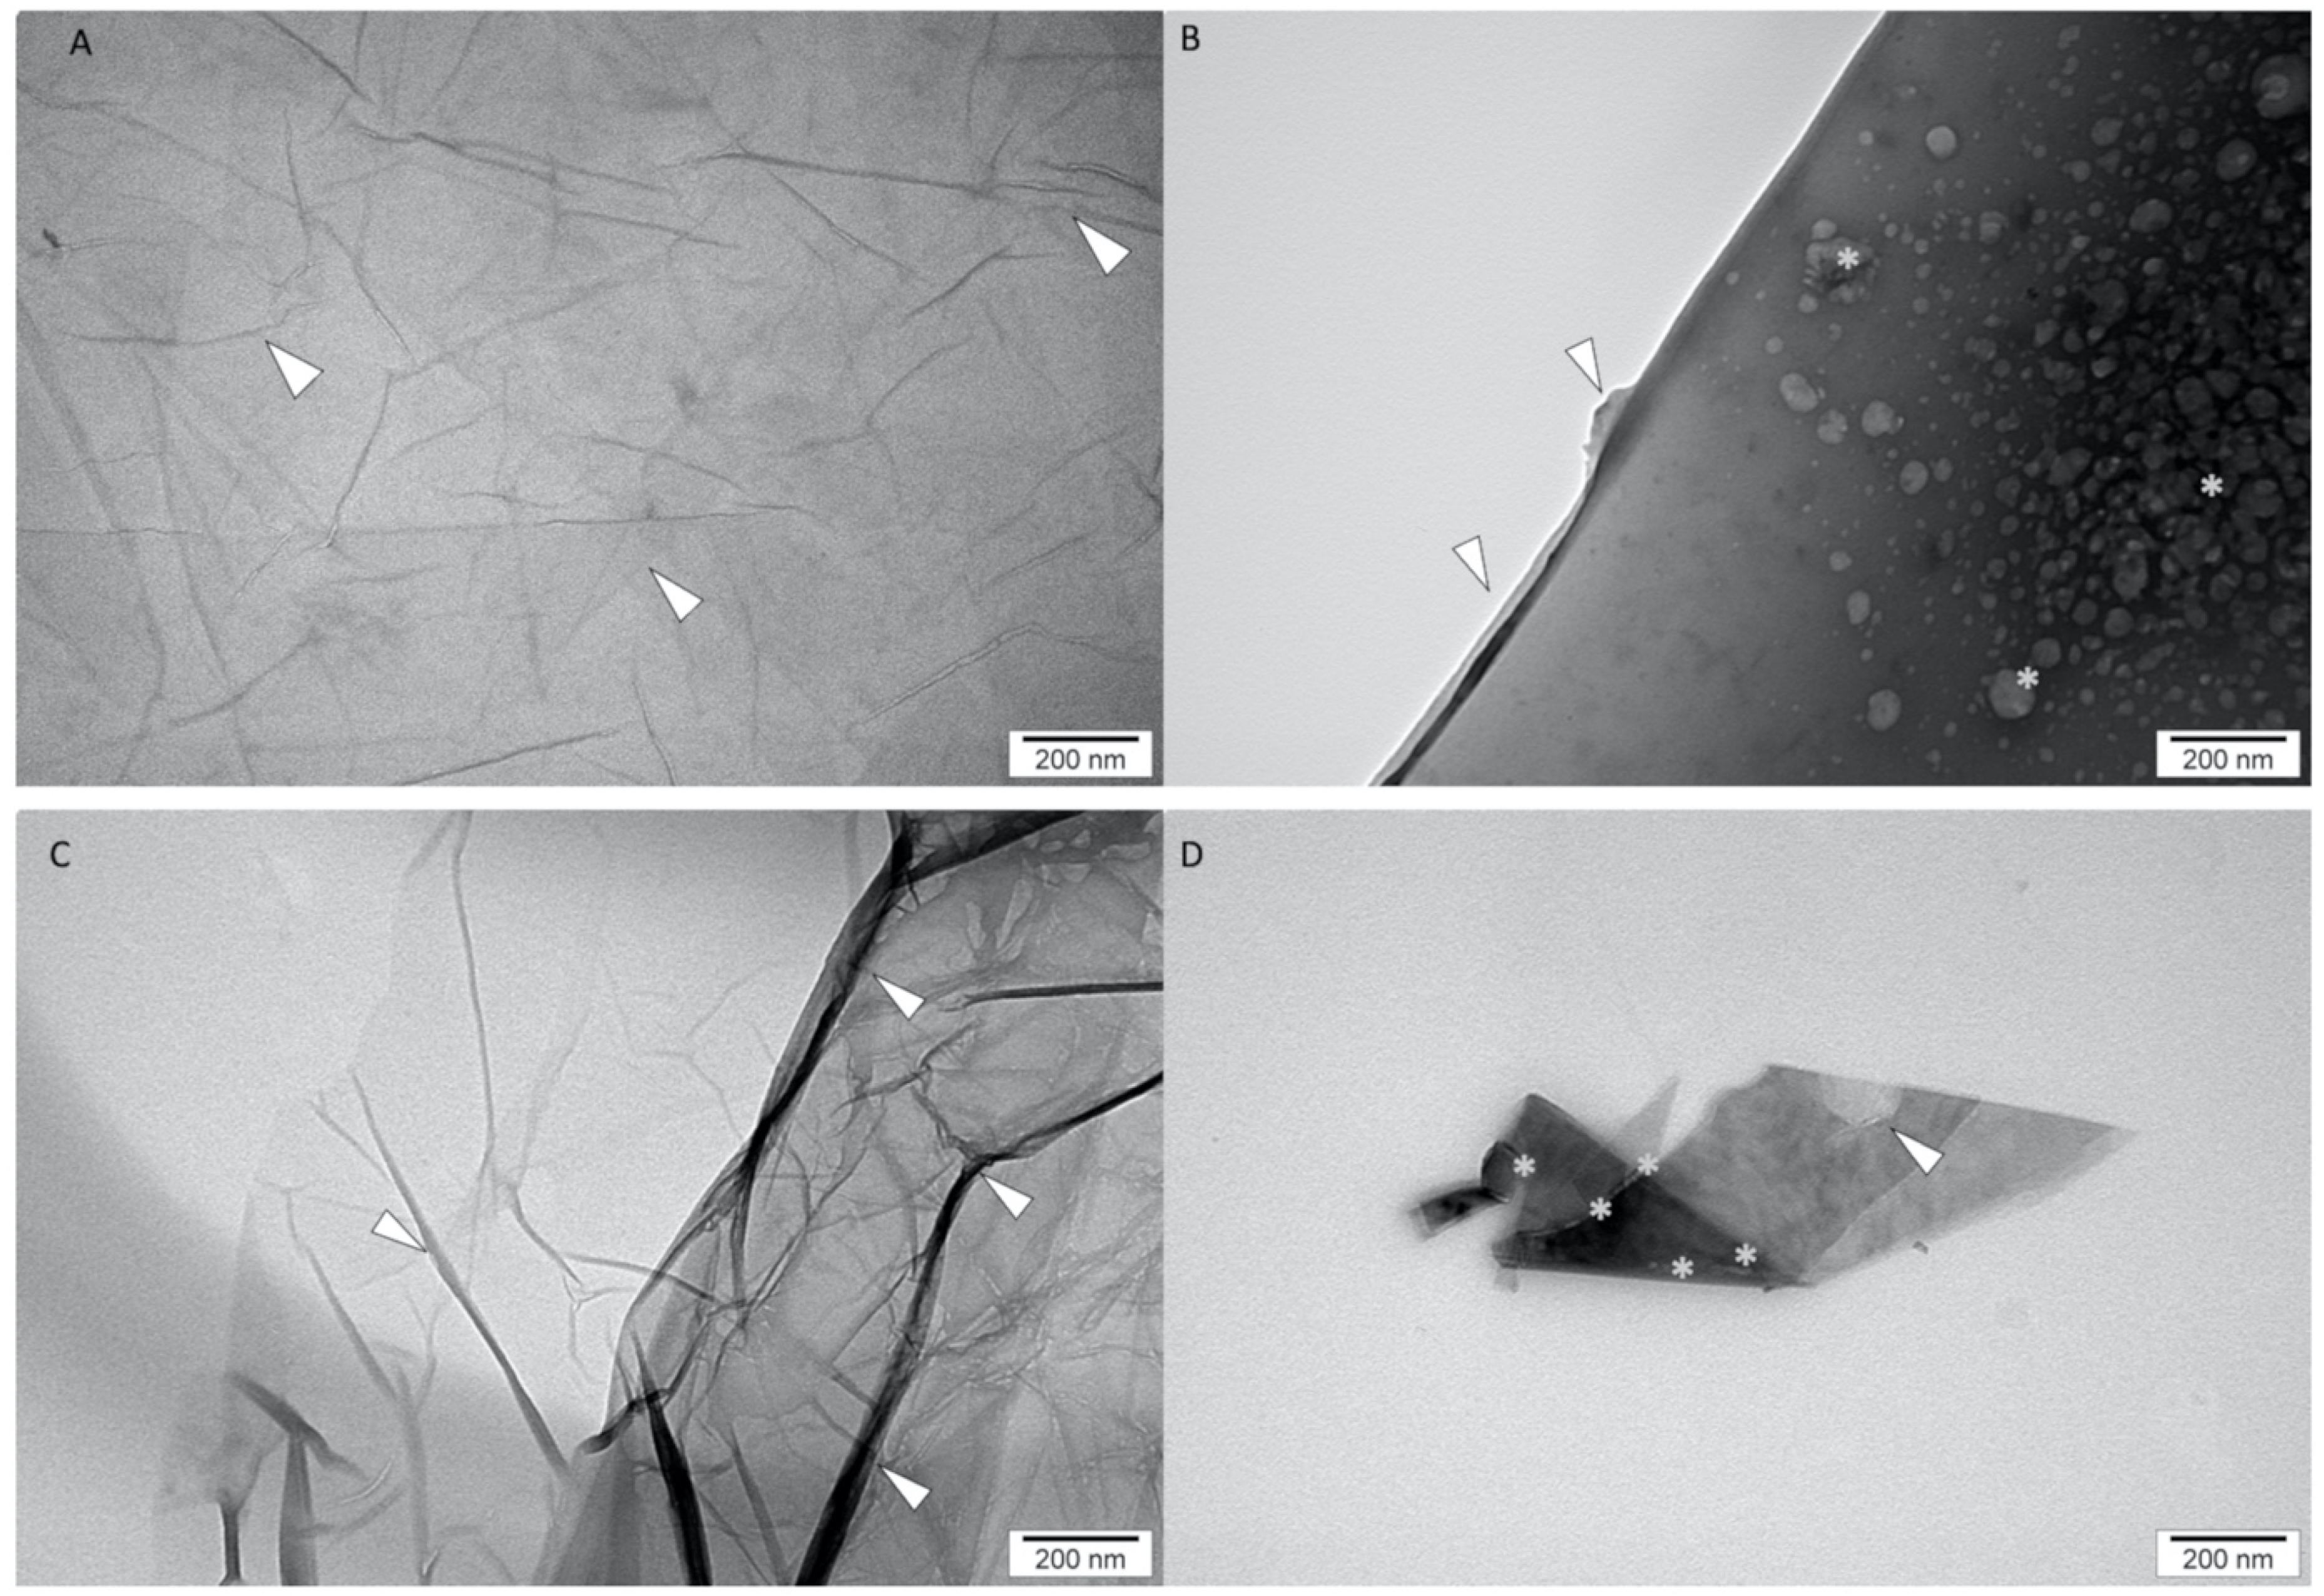
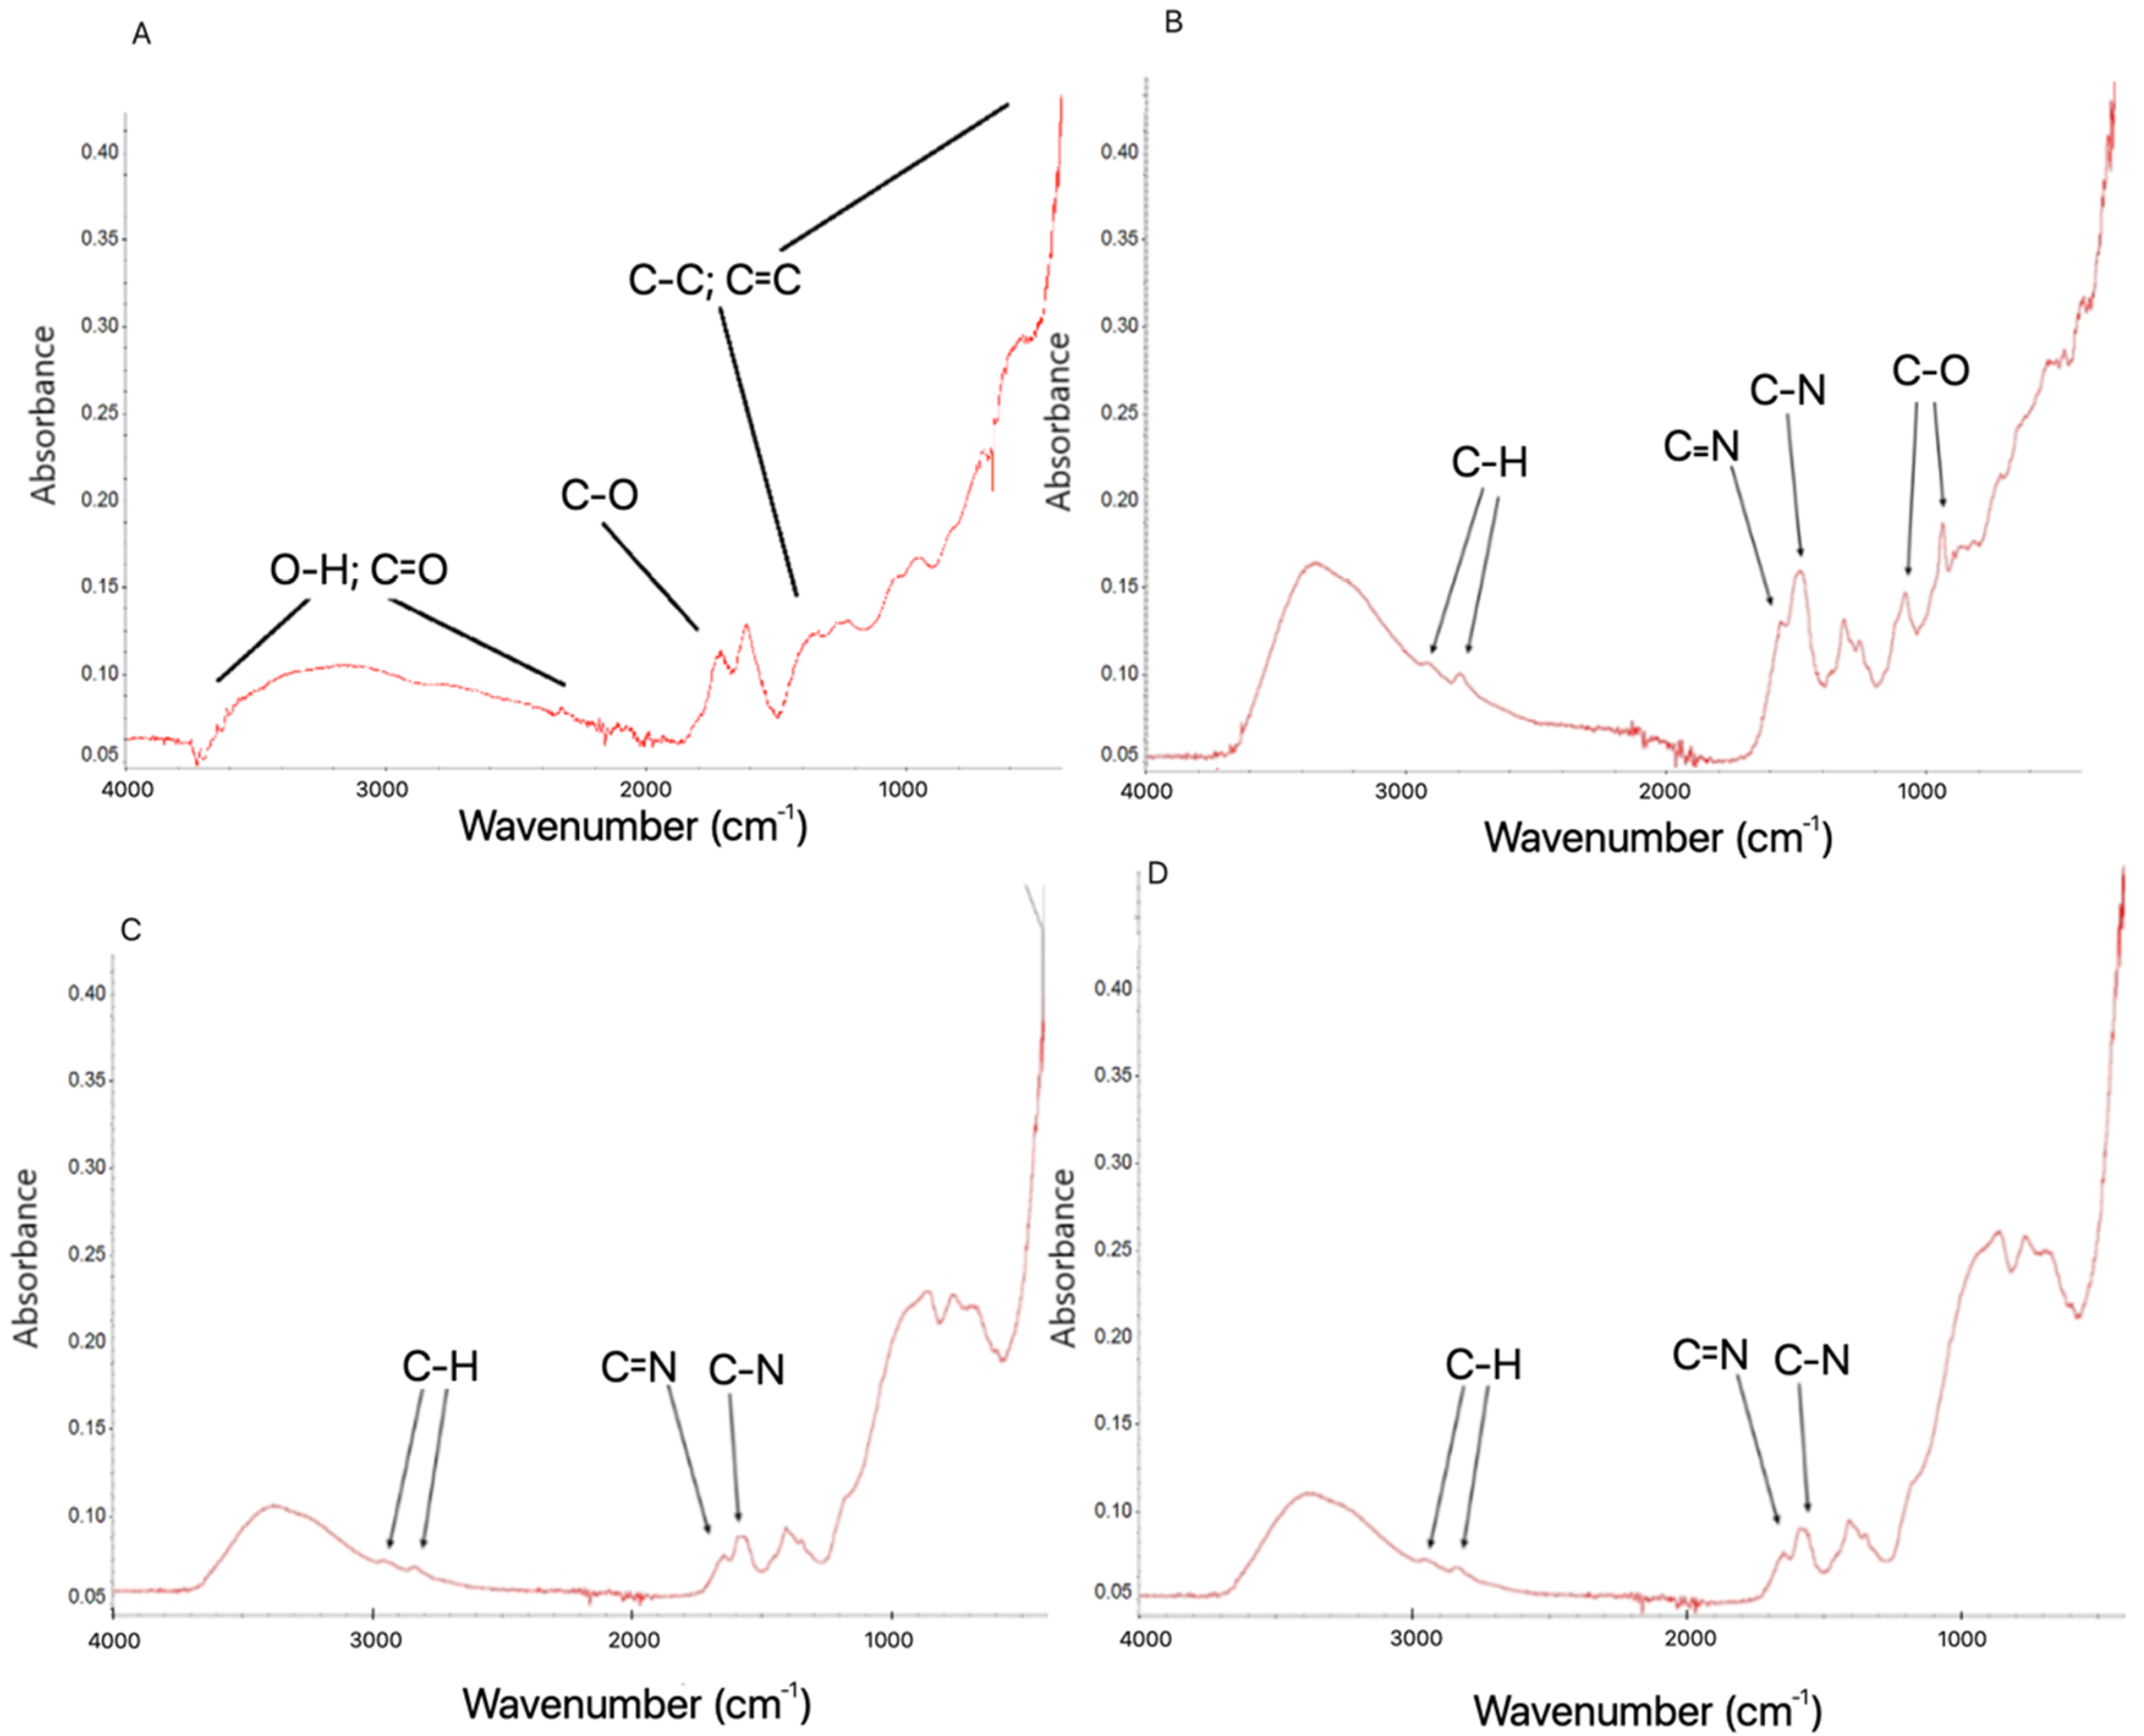
2.1. Preparation and Characterisation of Graphene-Based Colloids
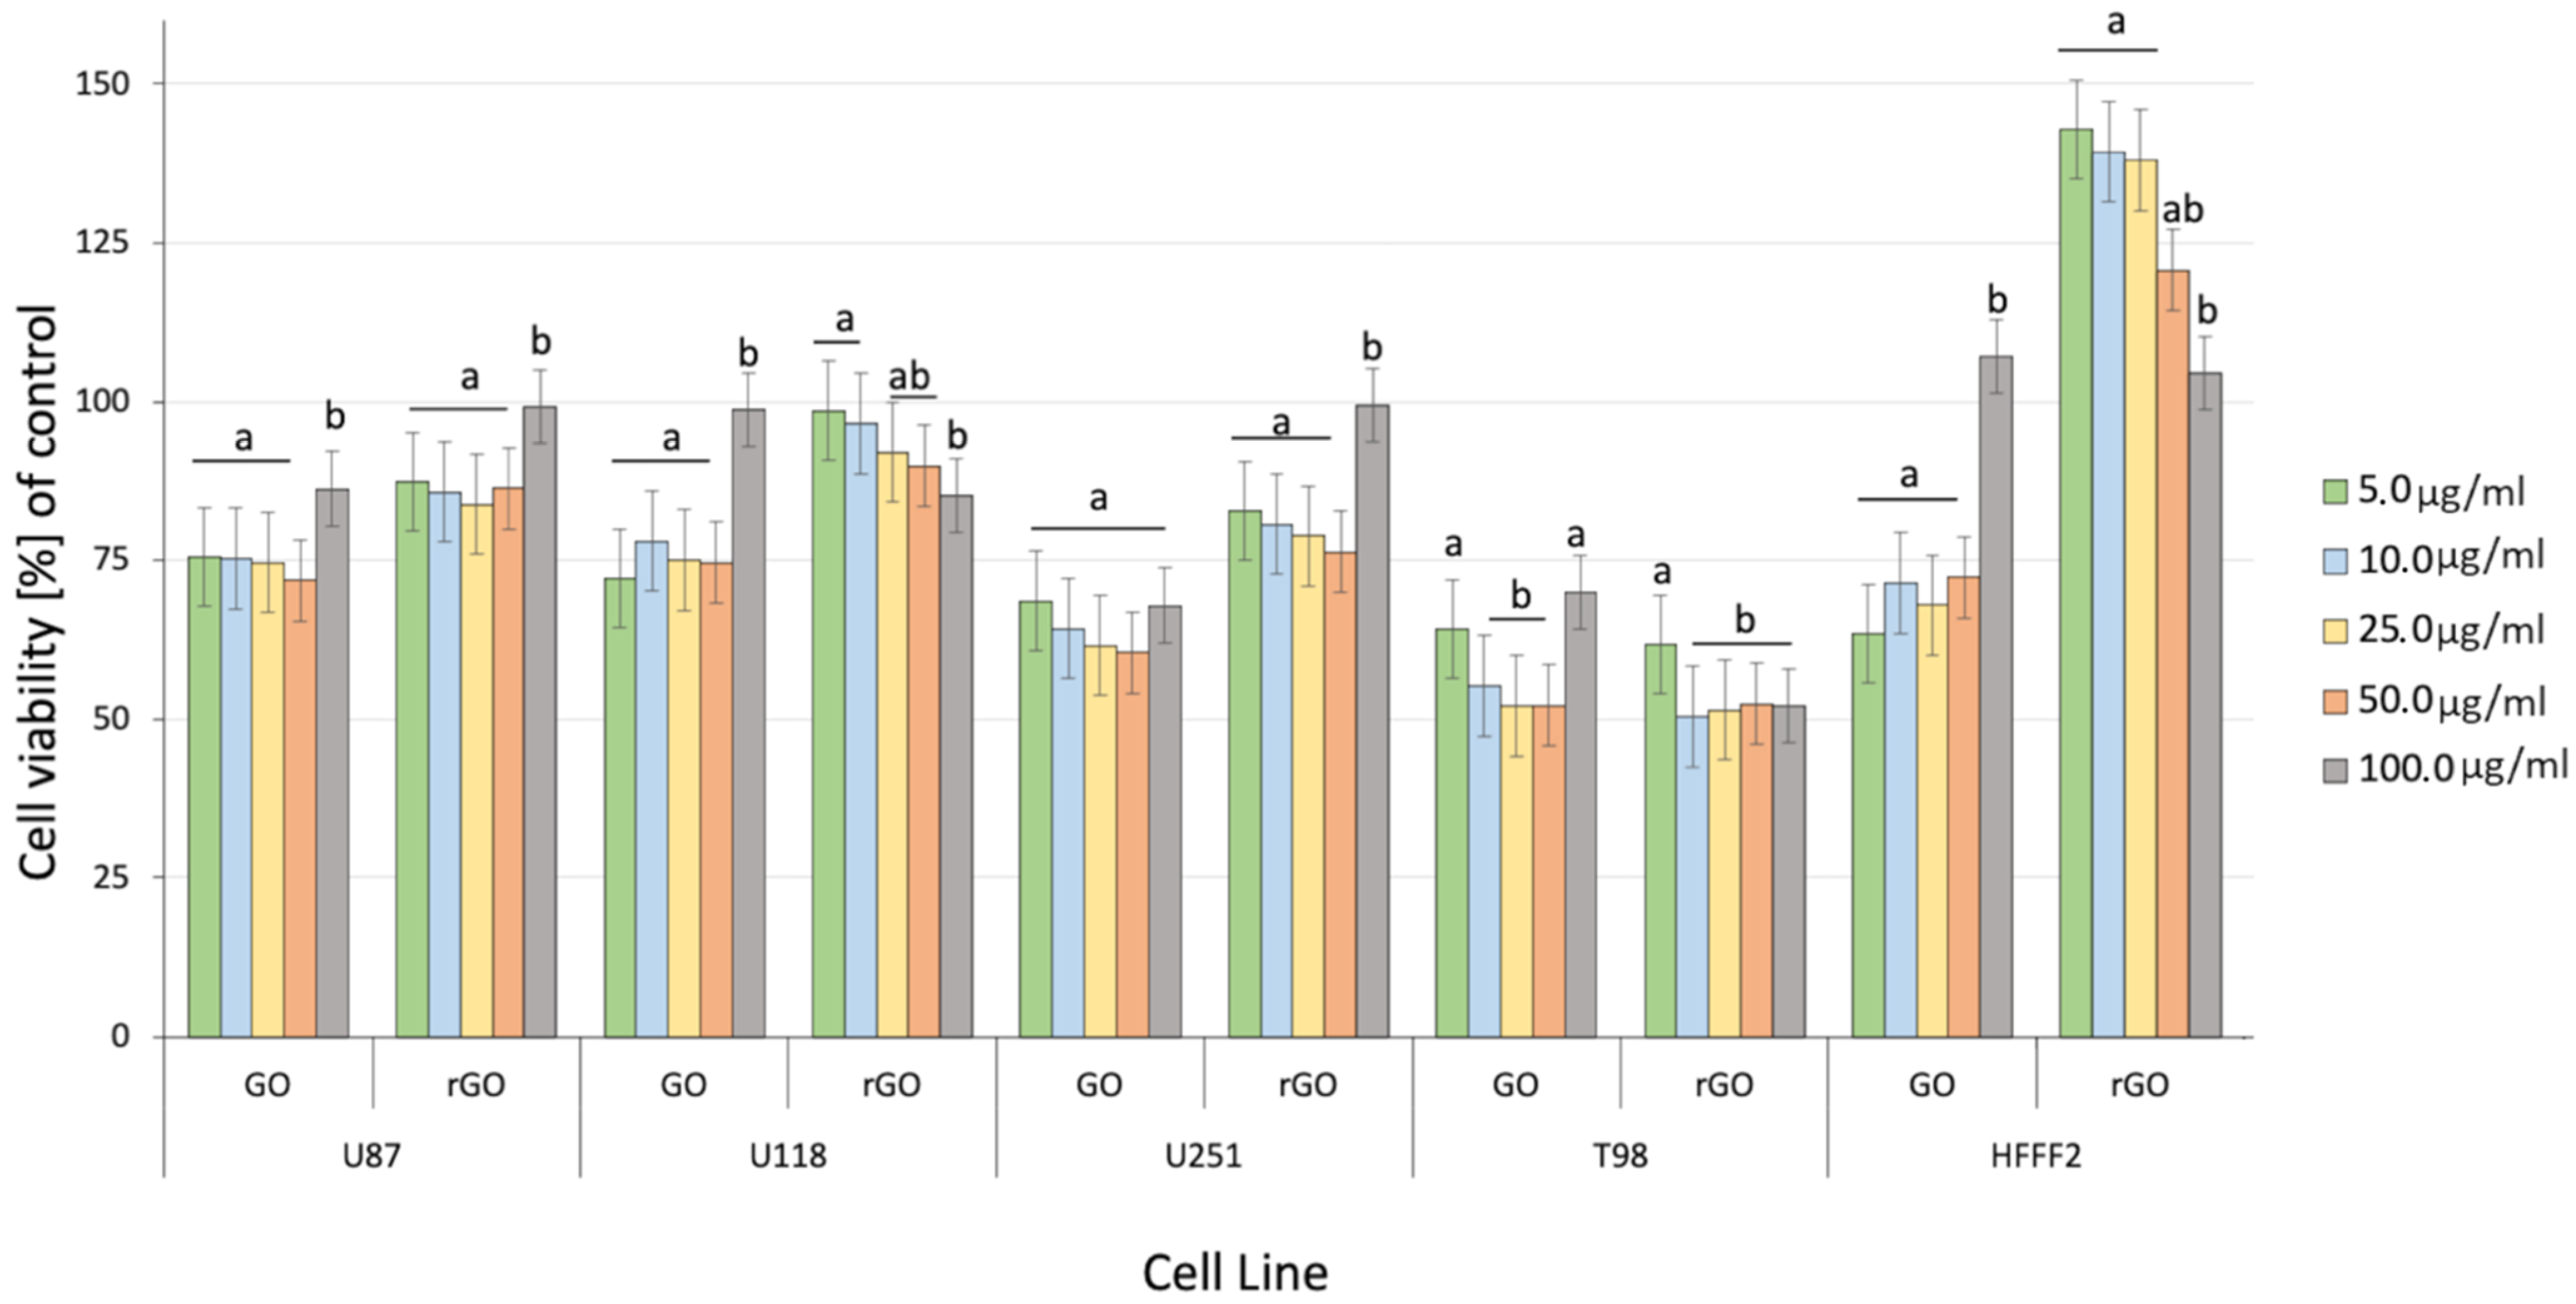
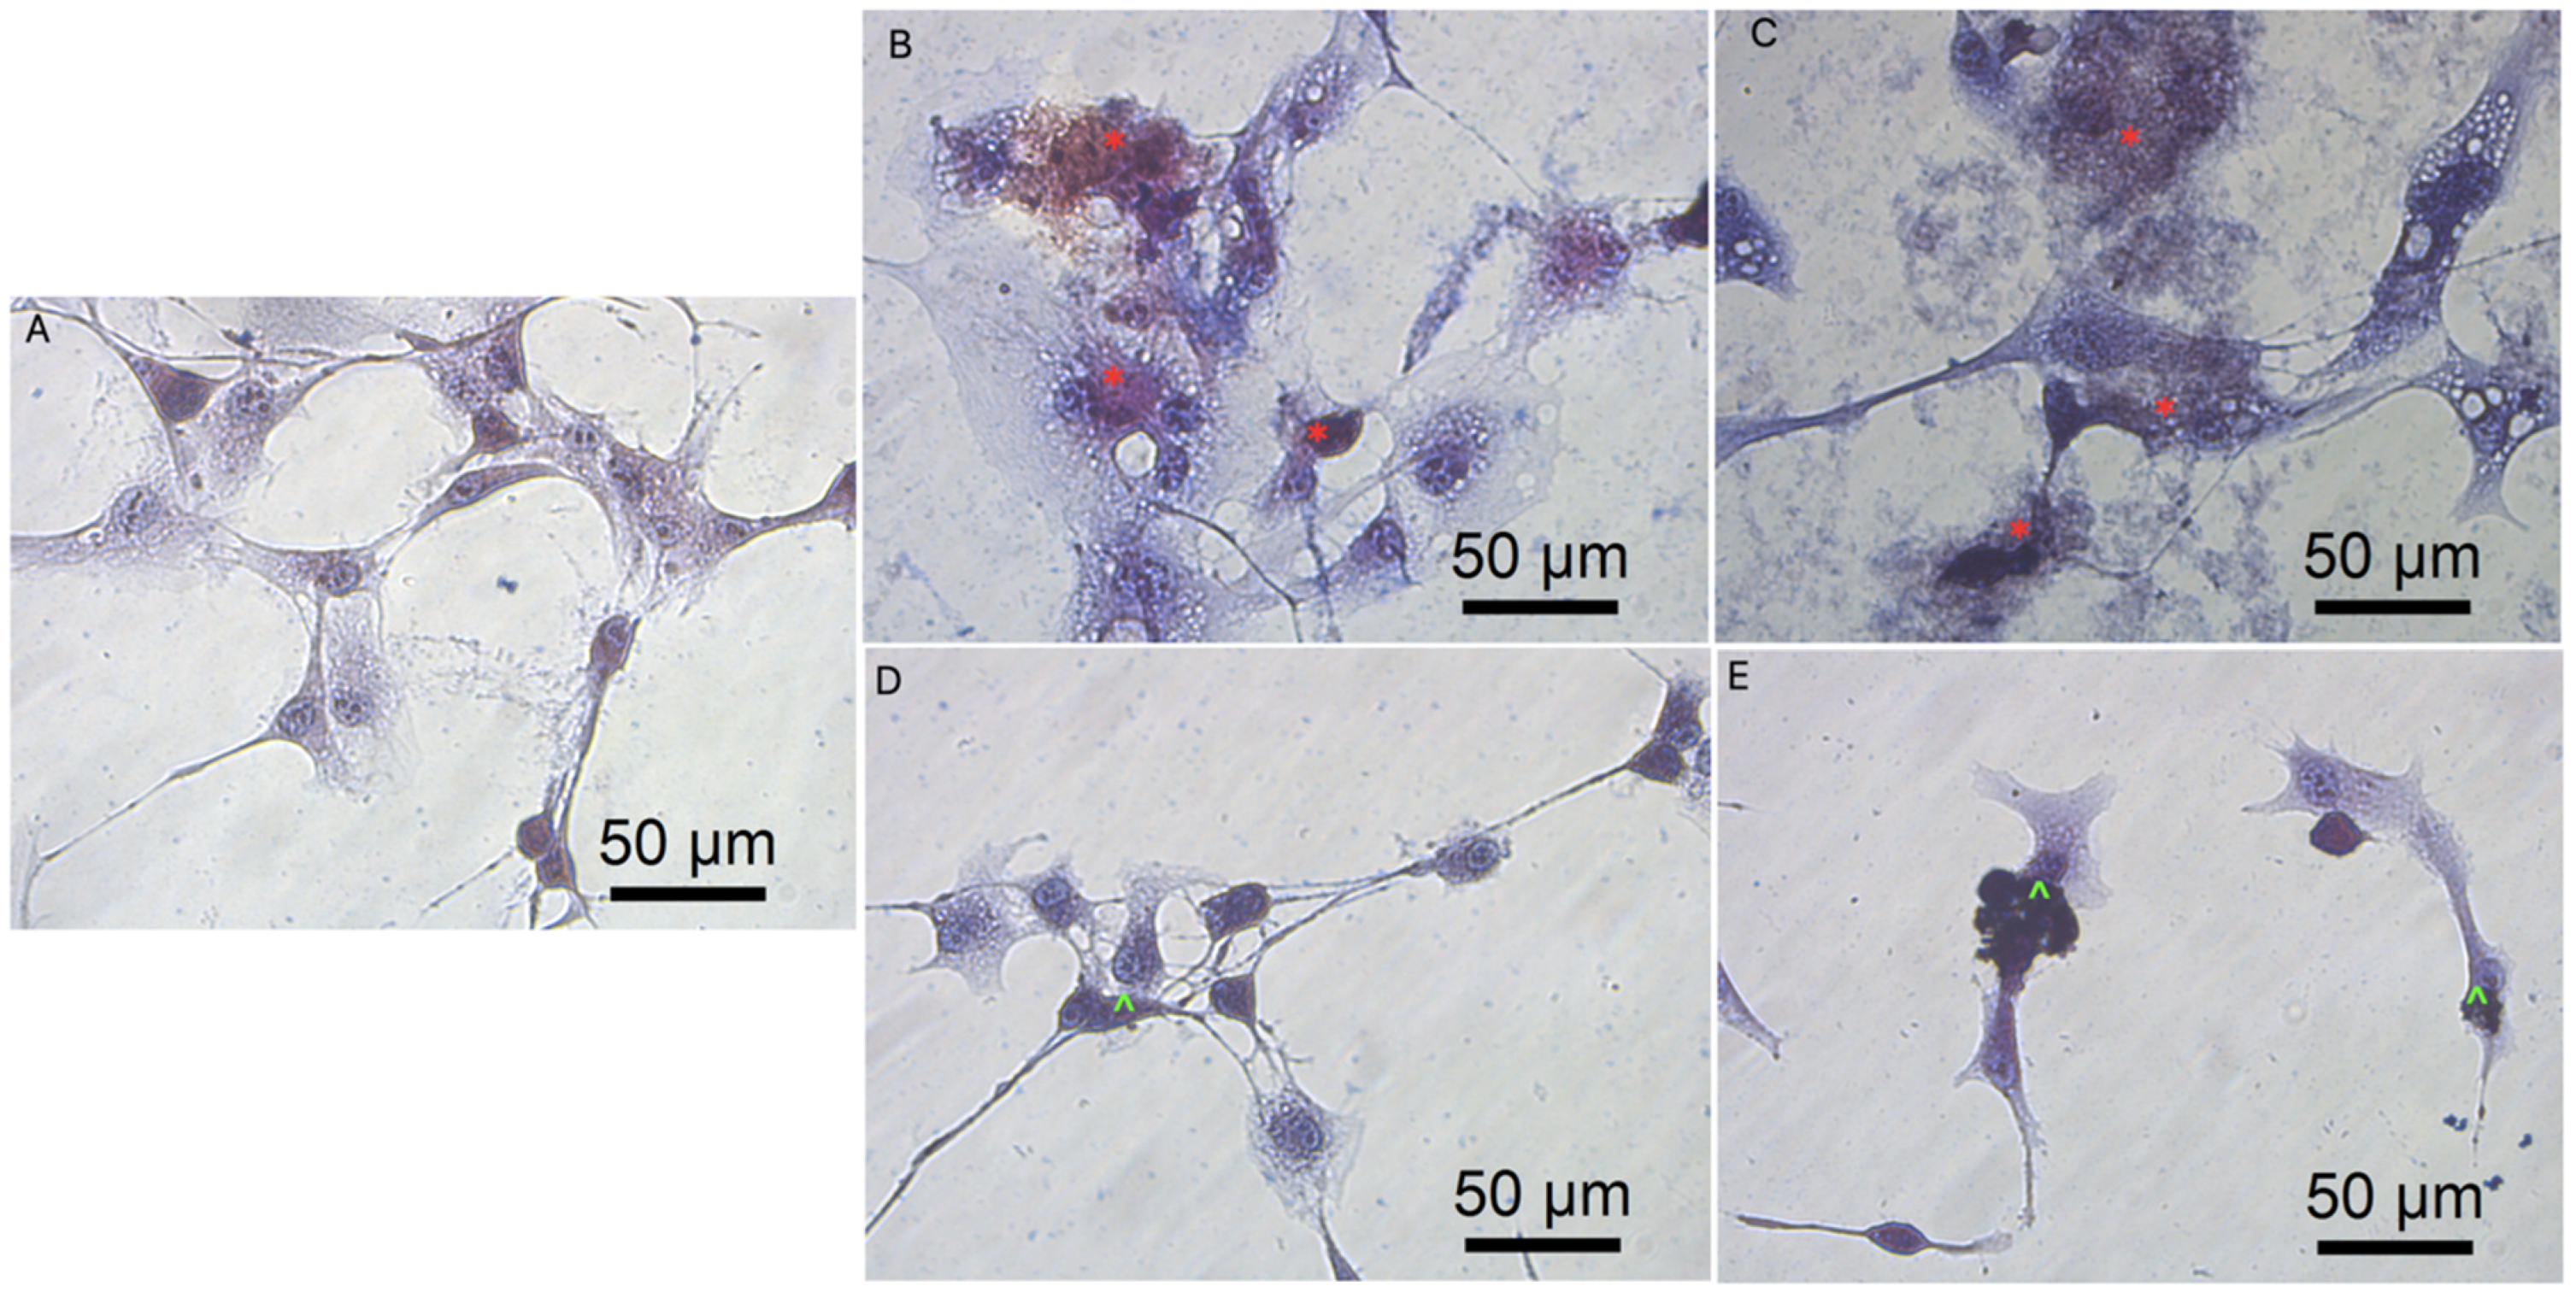
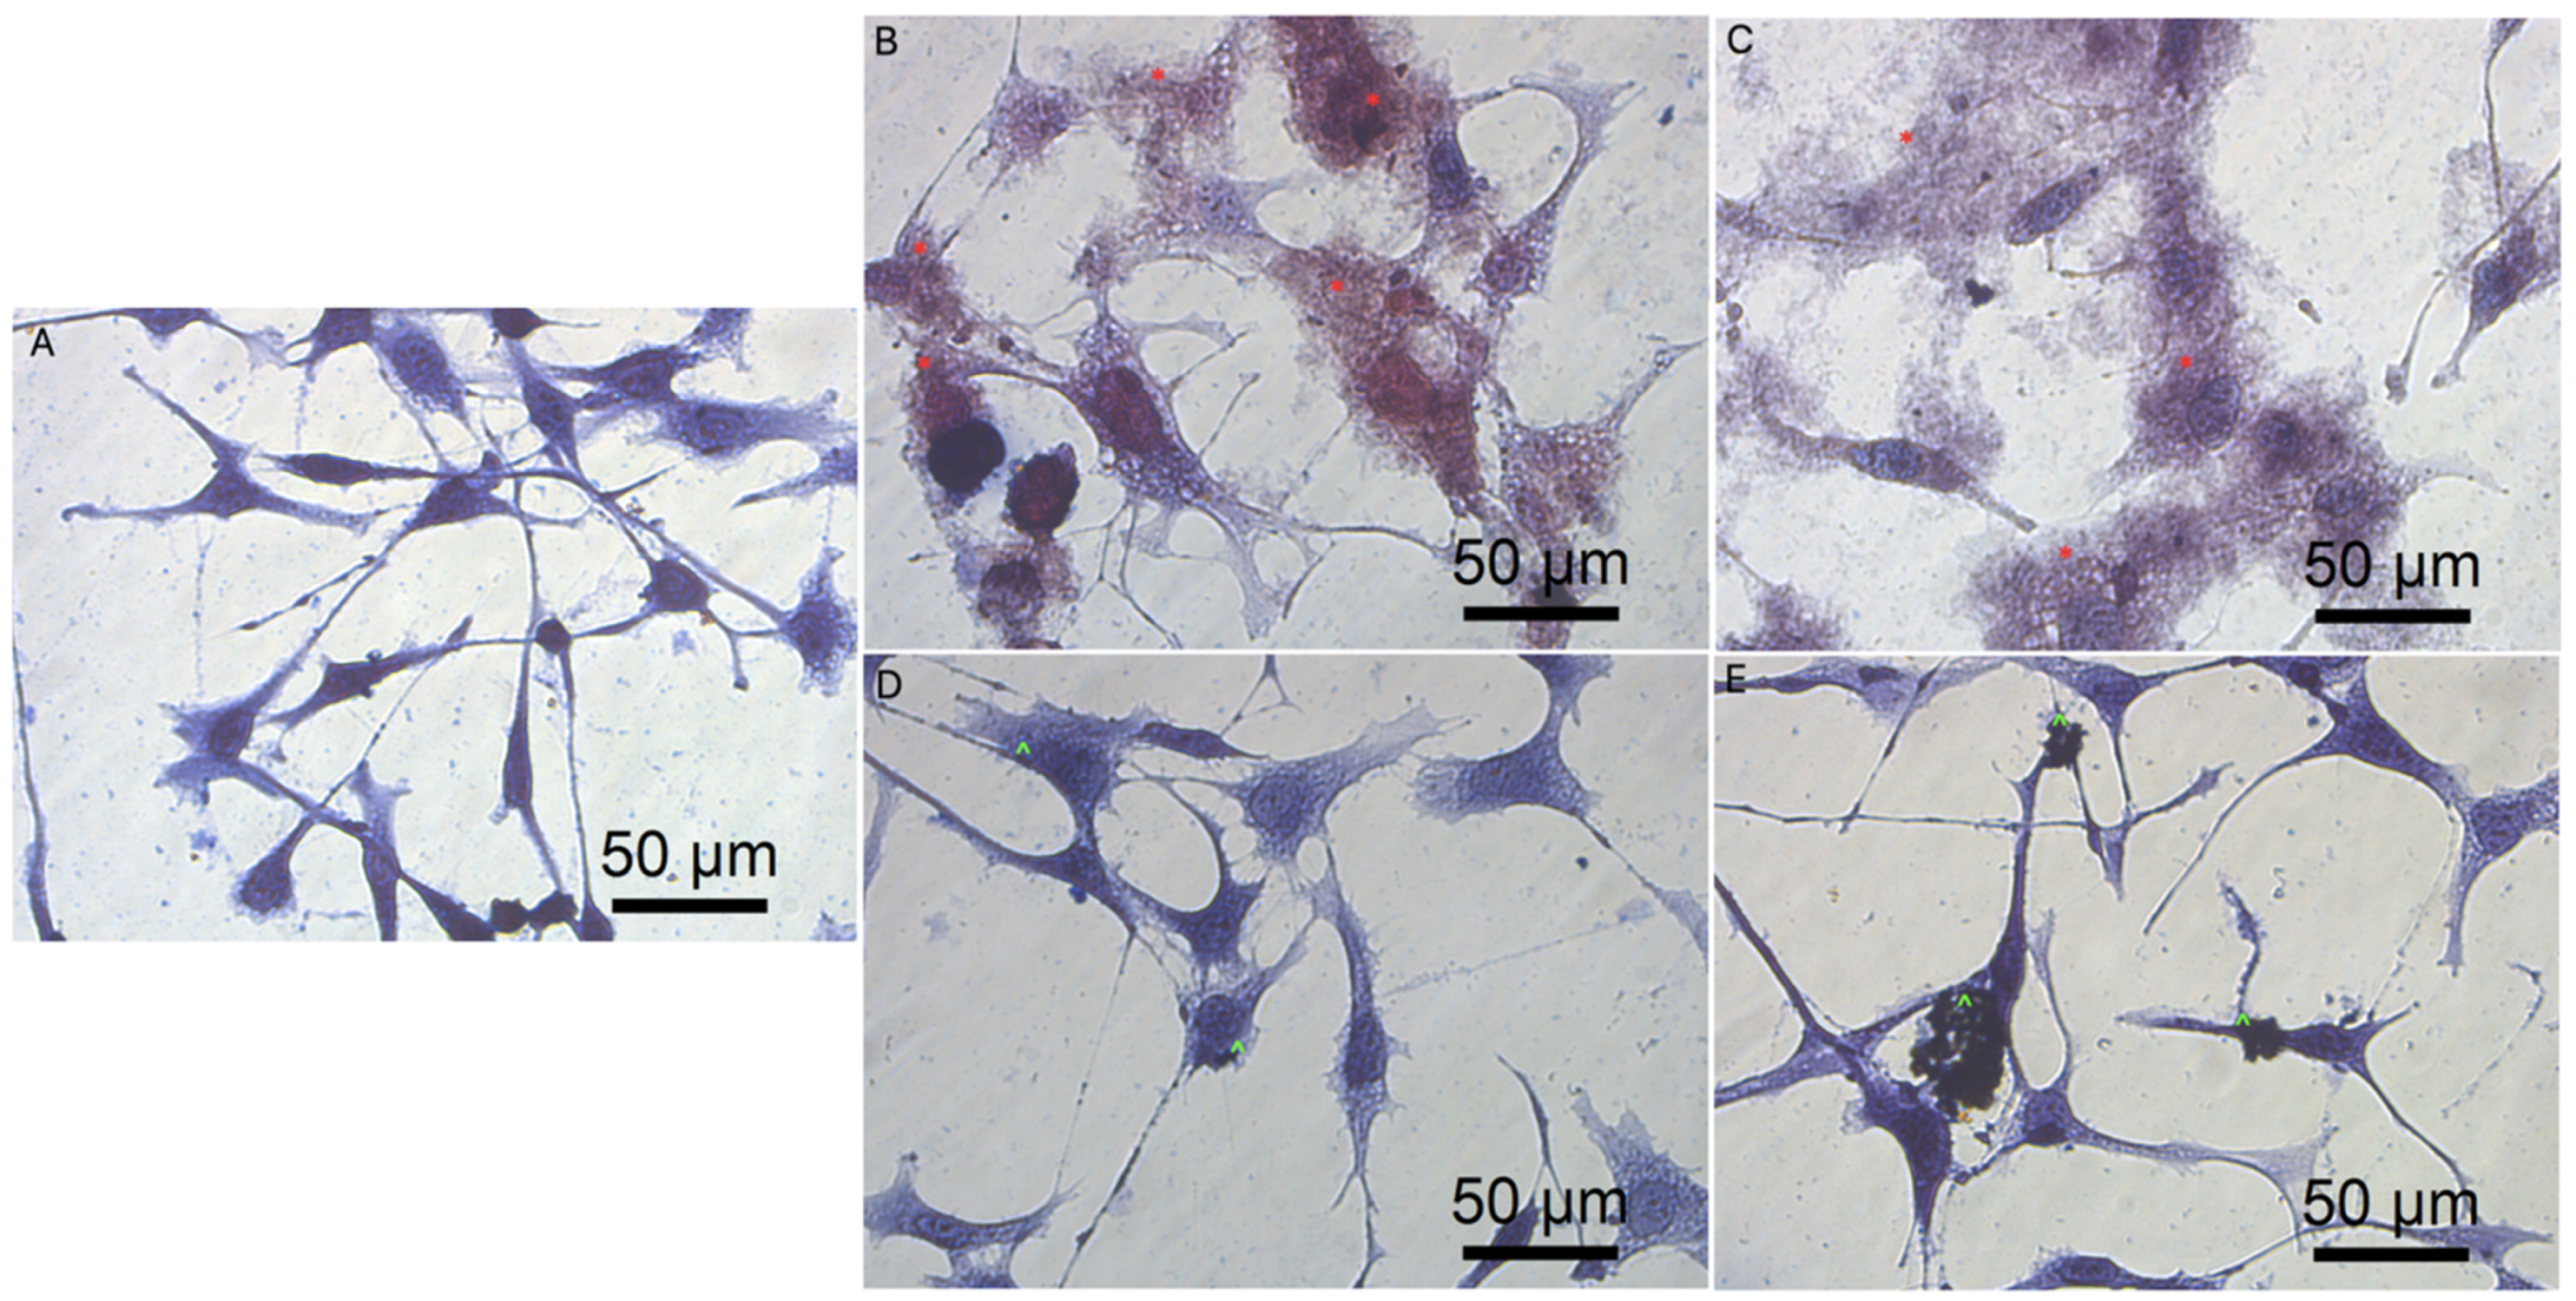
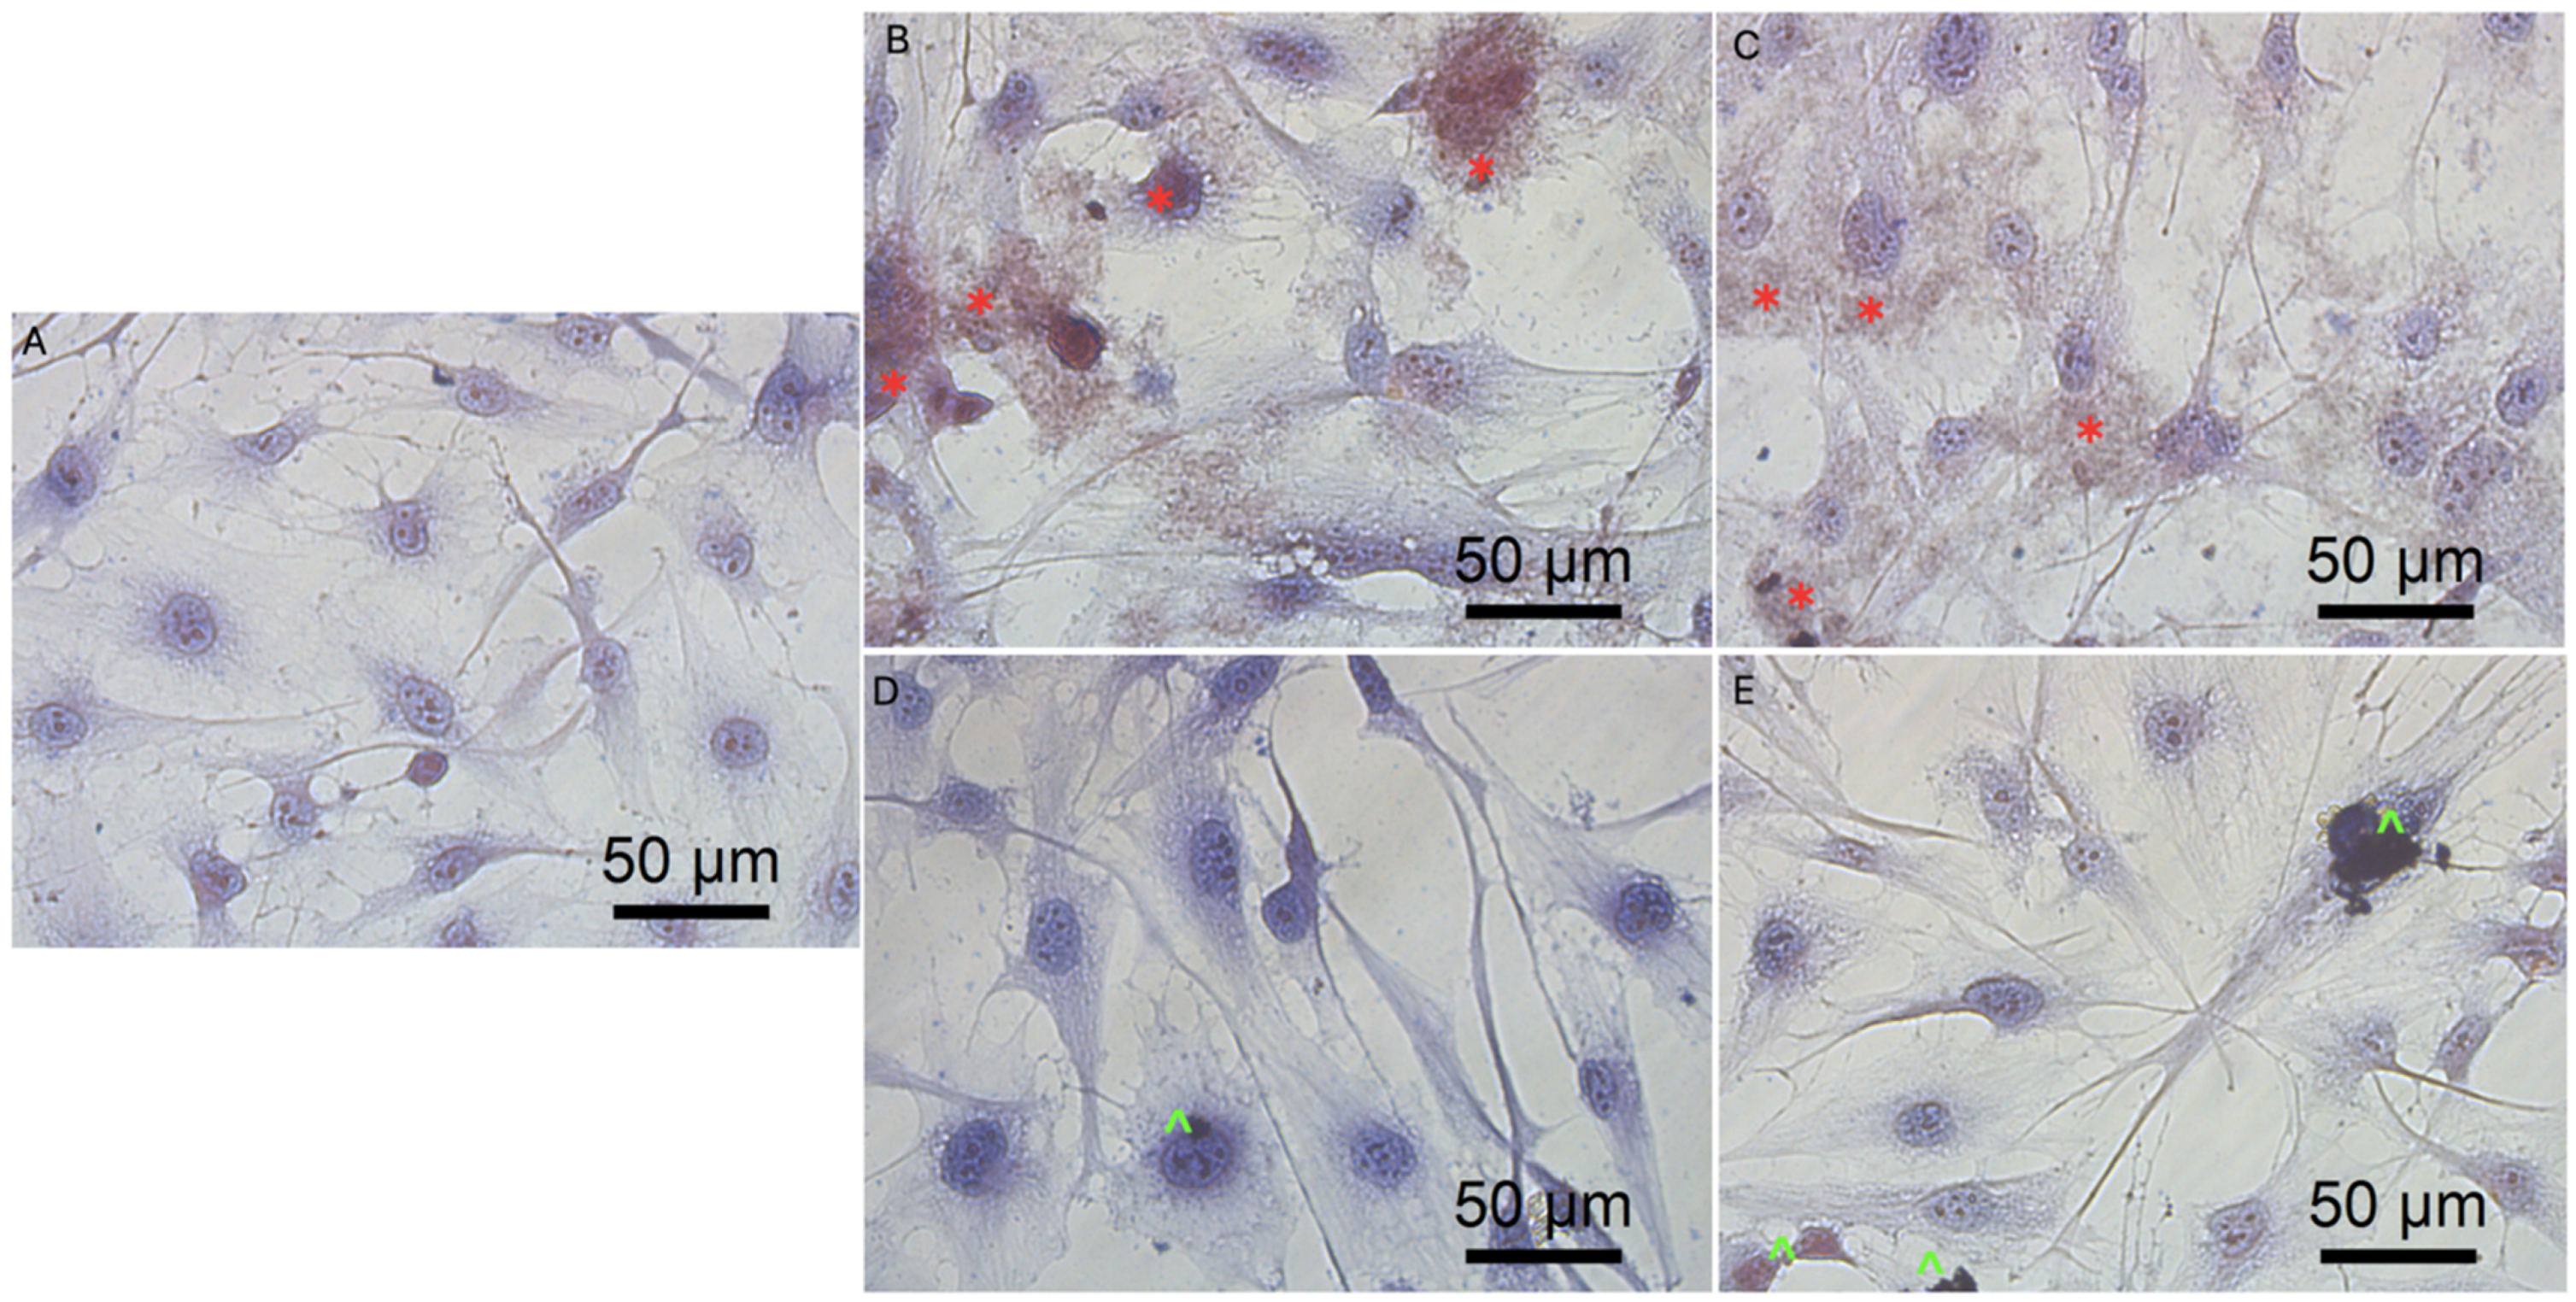
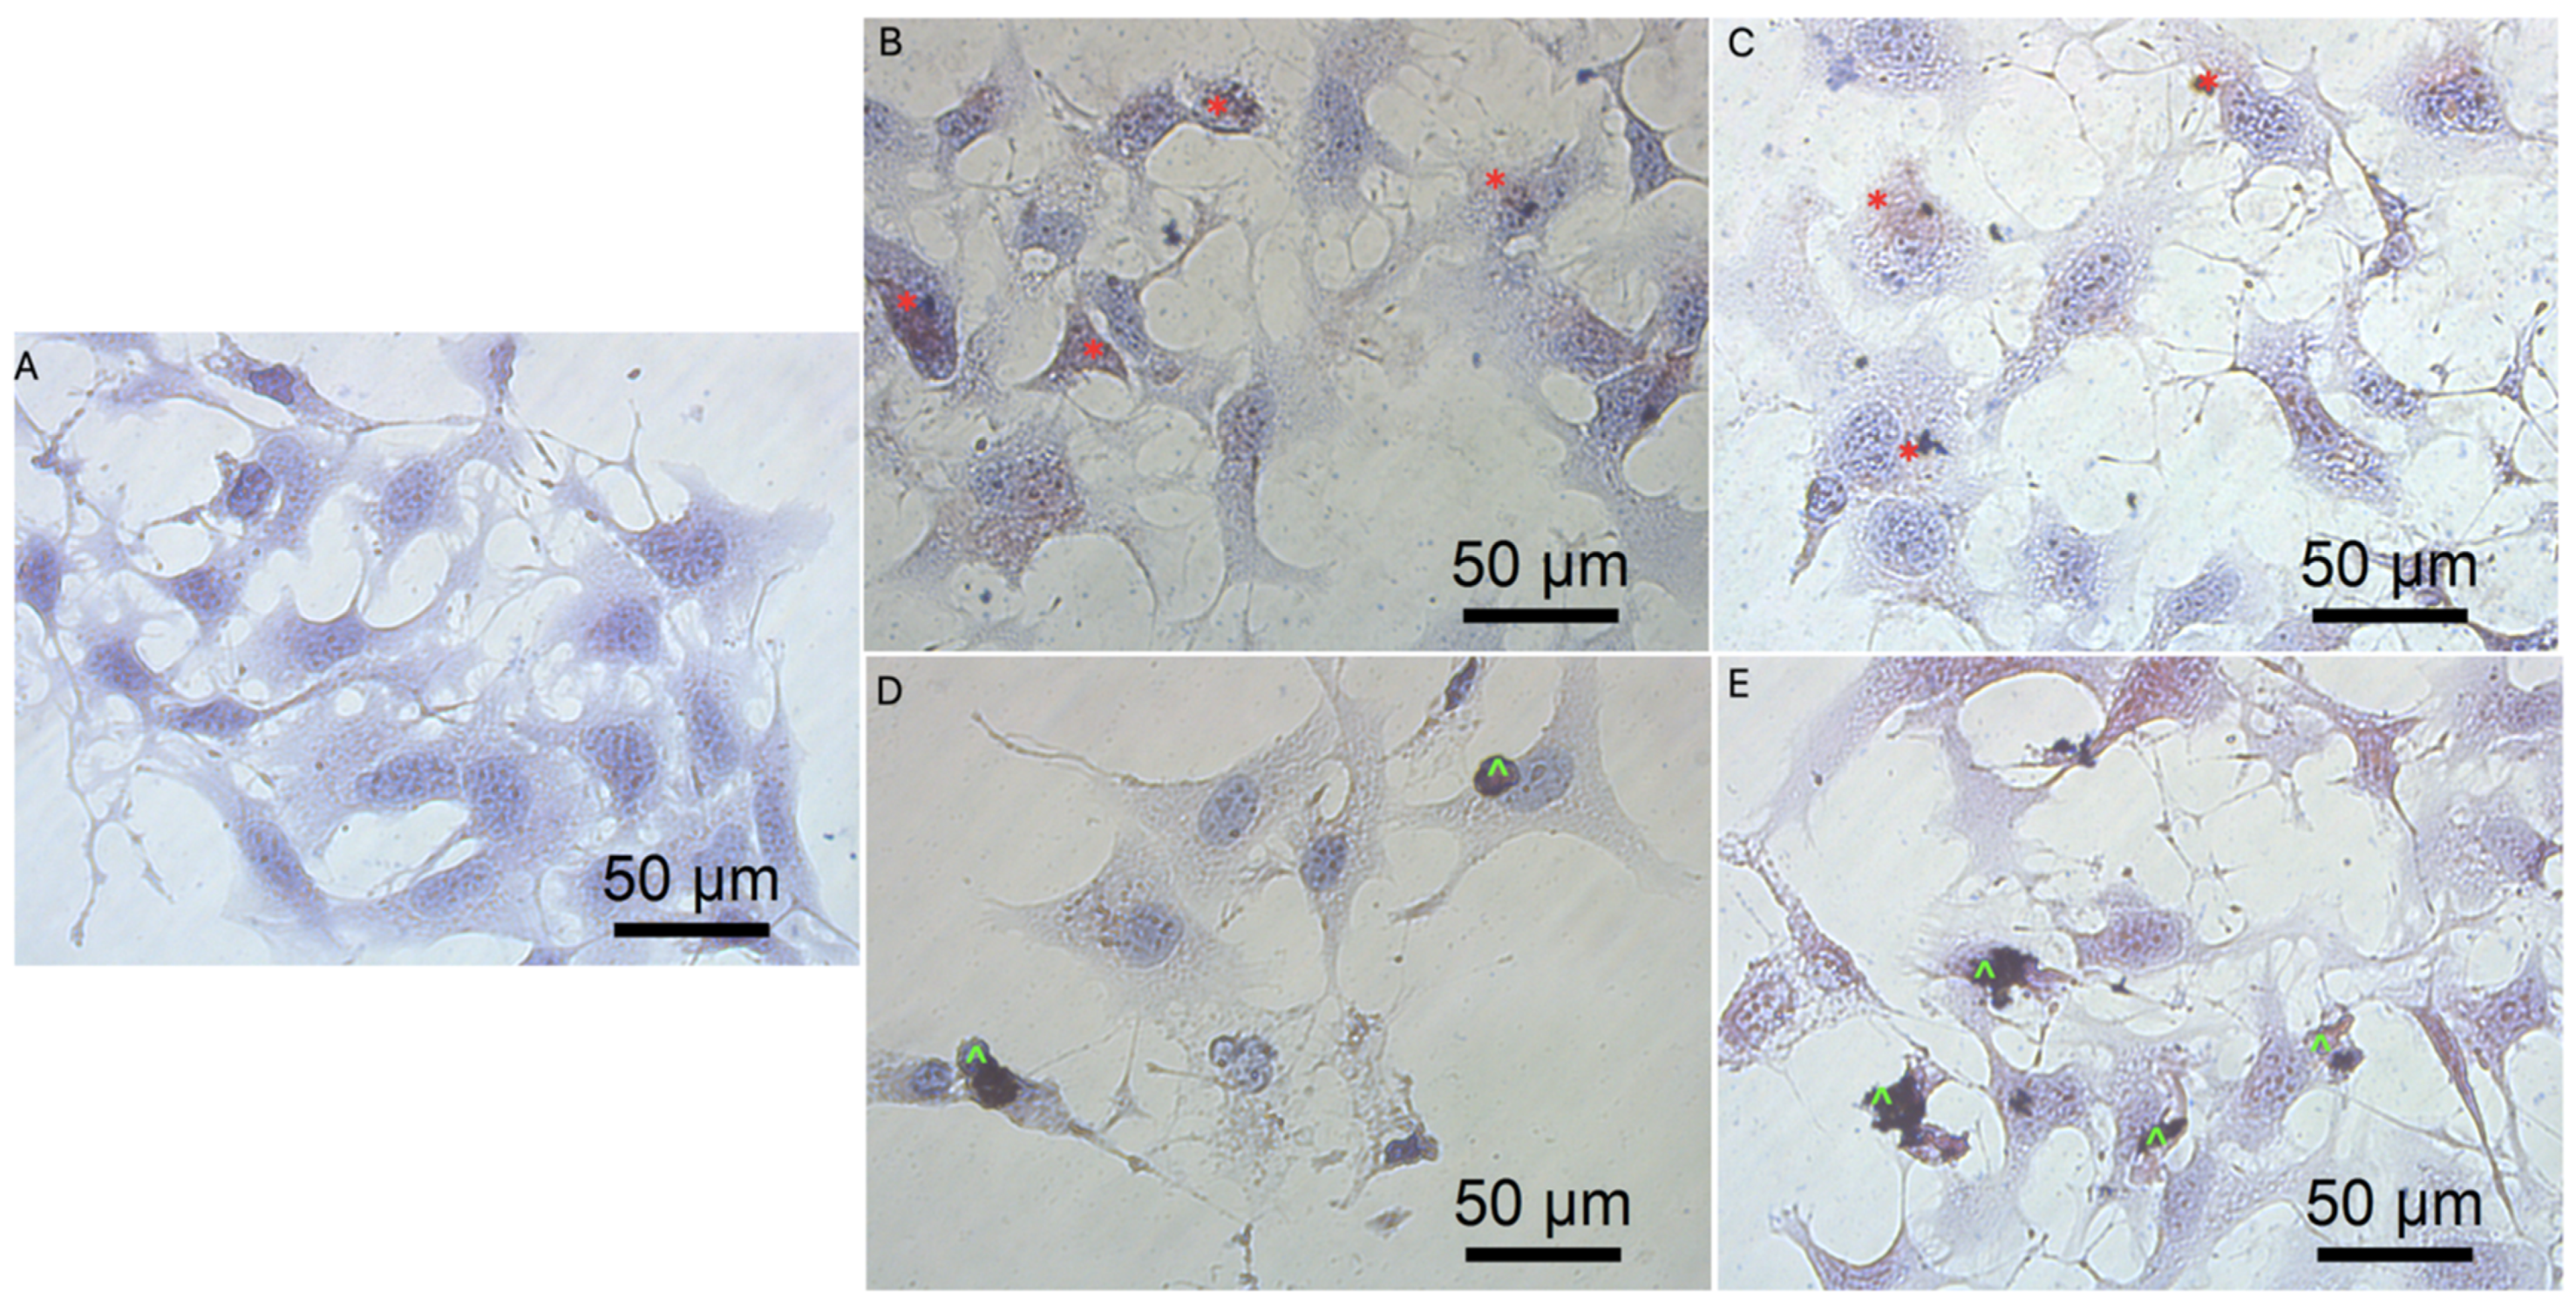
2.2. Cell Cultures and Treatments
3. Materials and Methods
3.1. Preparation and Characterisation of Colloids
3.1.1. Graphene Oxide and Reduced Graphene Oxide
3.1.2. Complex of Graphene Oxide or Reduced Graphene Oxide with Antisense miRNAs
3.1.3. Transmission Electron Microscopy
3.1.4. Dynamic Light Scattering (DLS)
3.1.5. Fourier Transform Infrared (FTIR) Spectroscopy
3.1.6. Determination of miRNA Entrapment Efficiency
3.1.7. ζ-Potential Measurements
3.2. Cell Cultures and Treatments
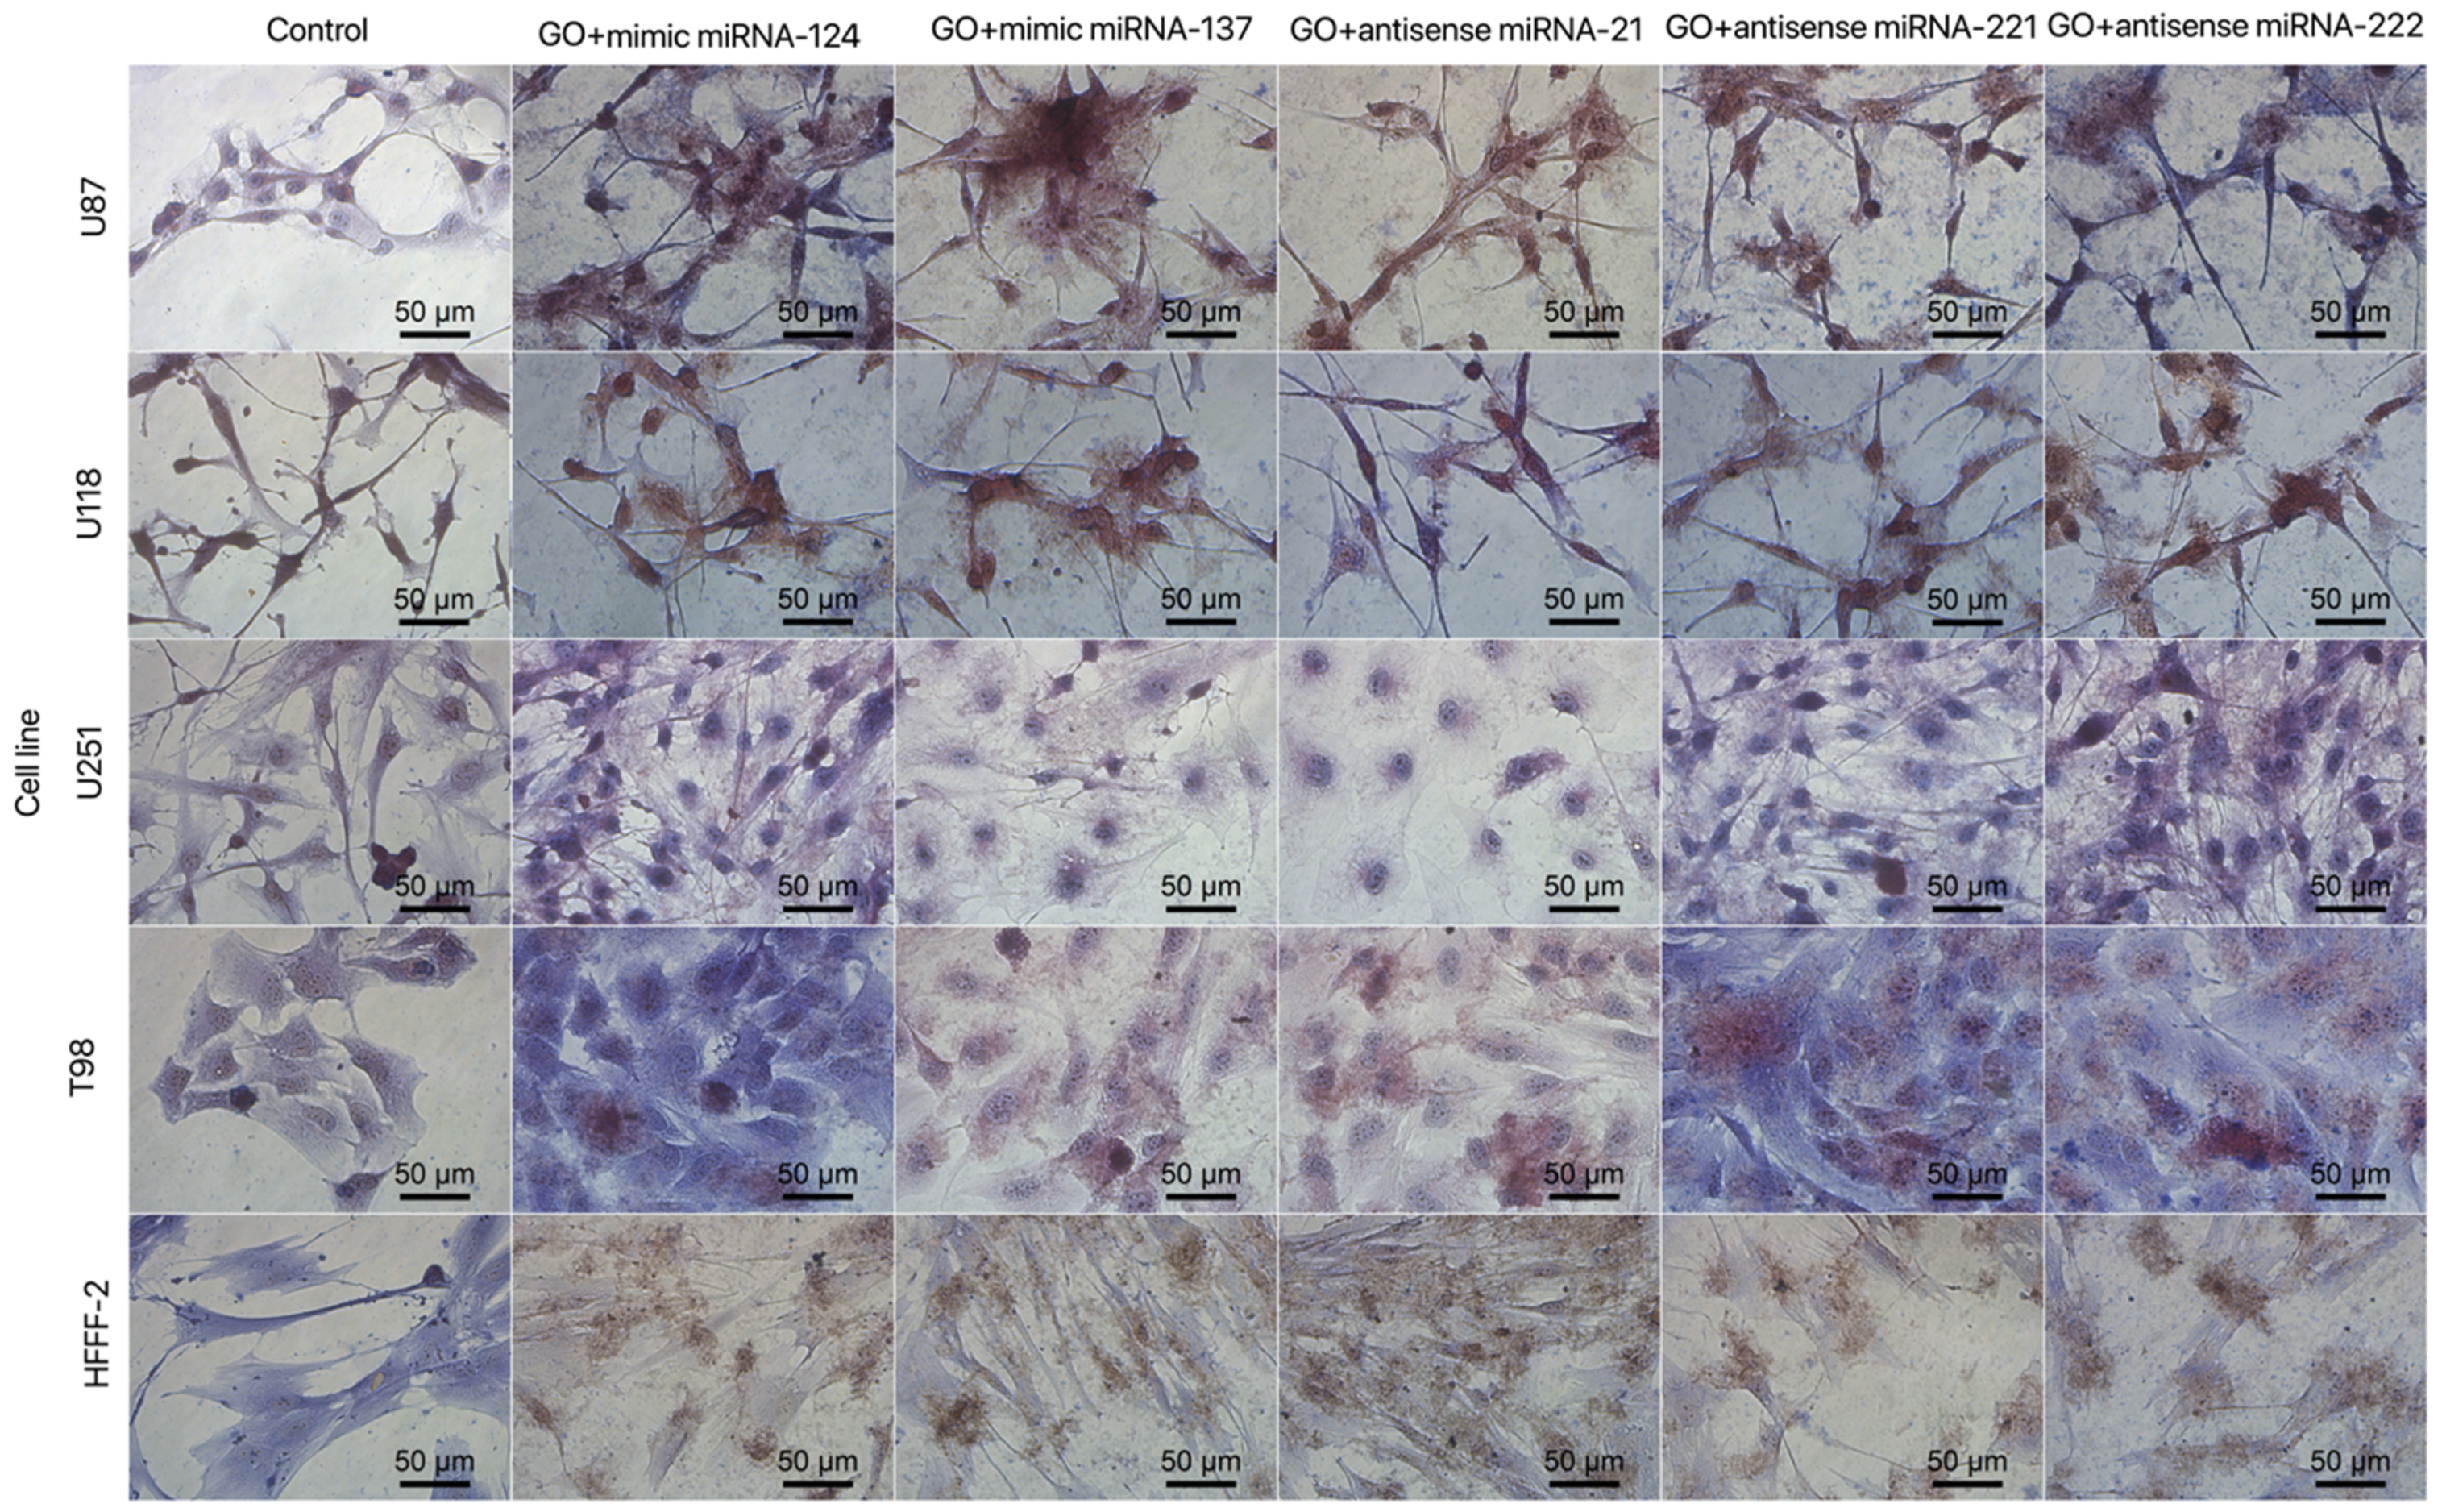
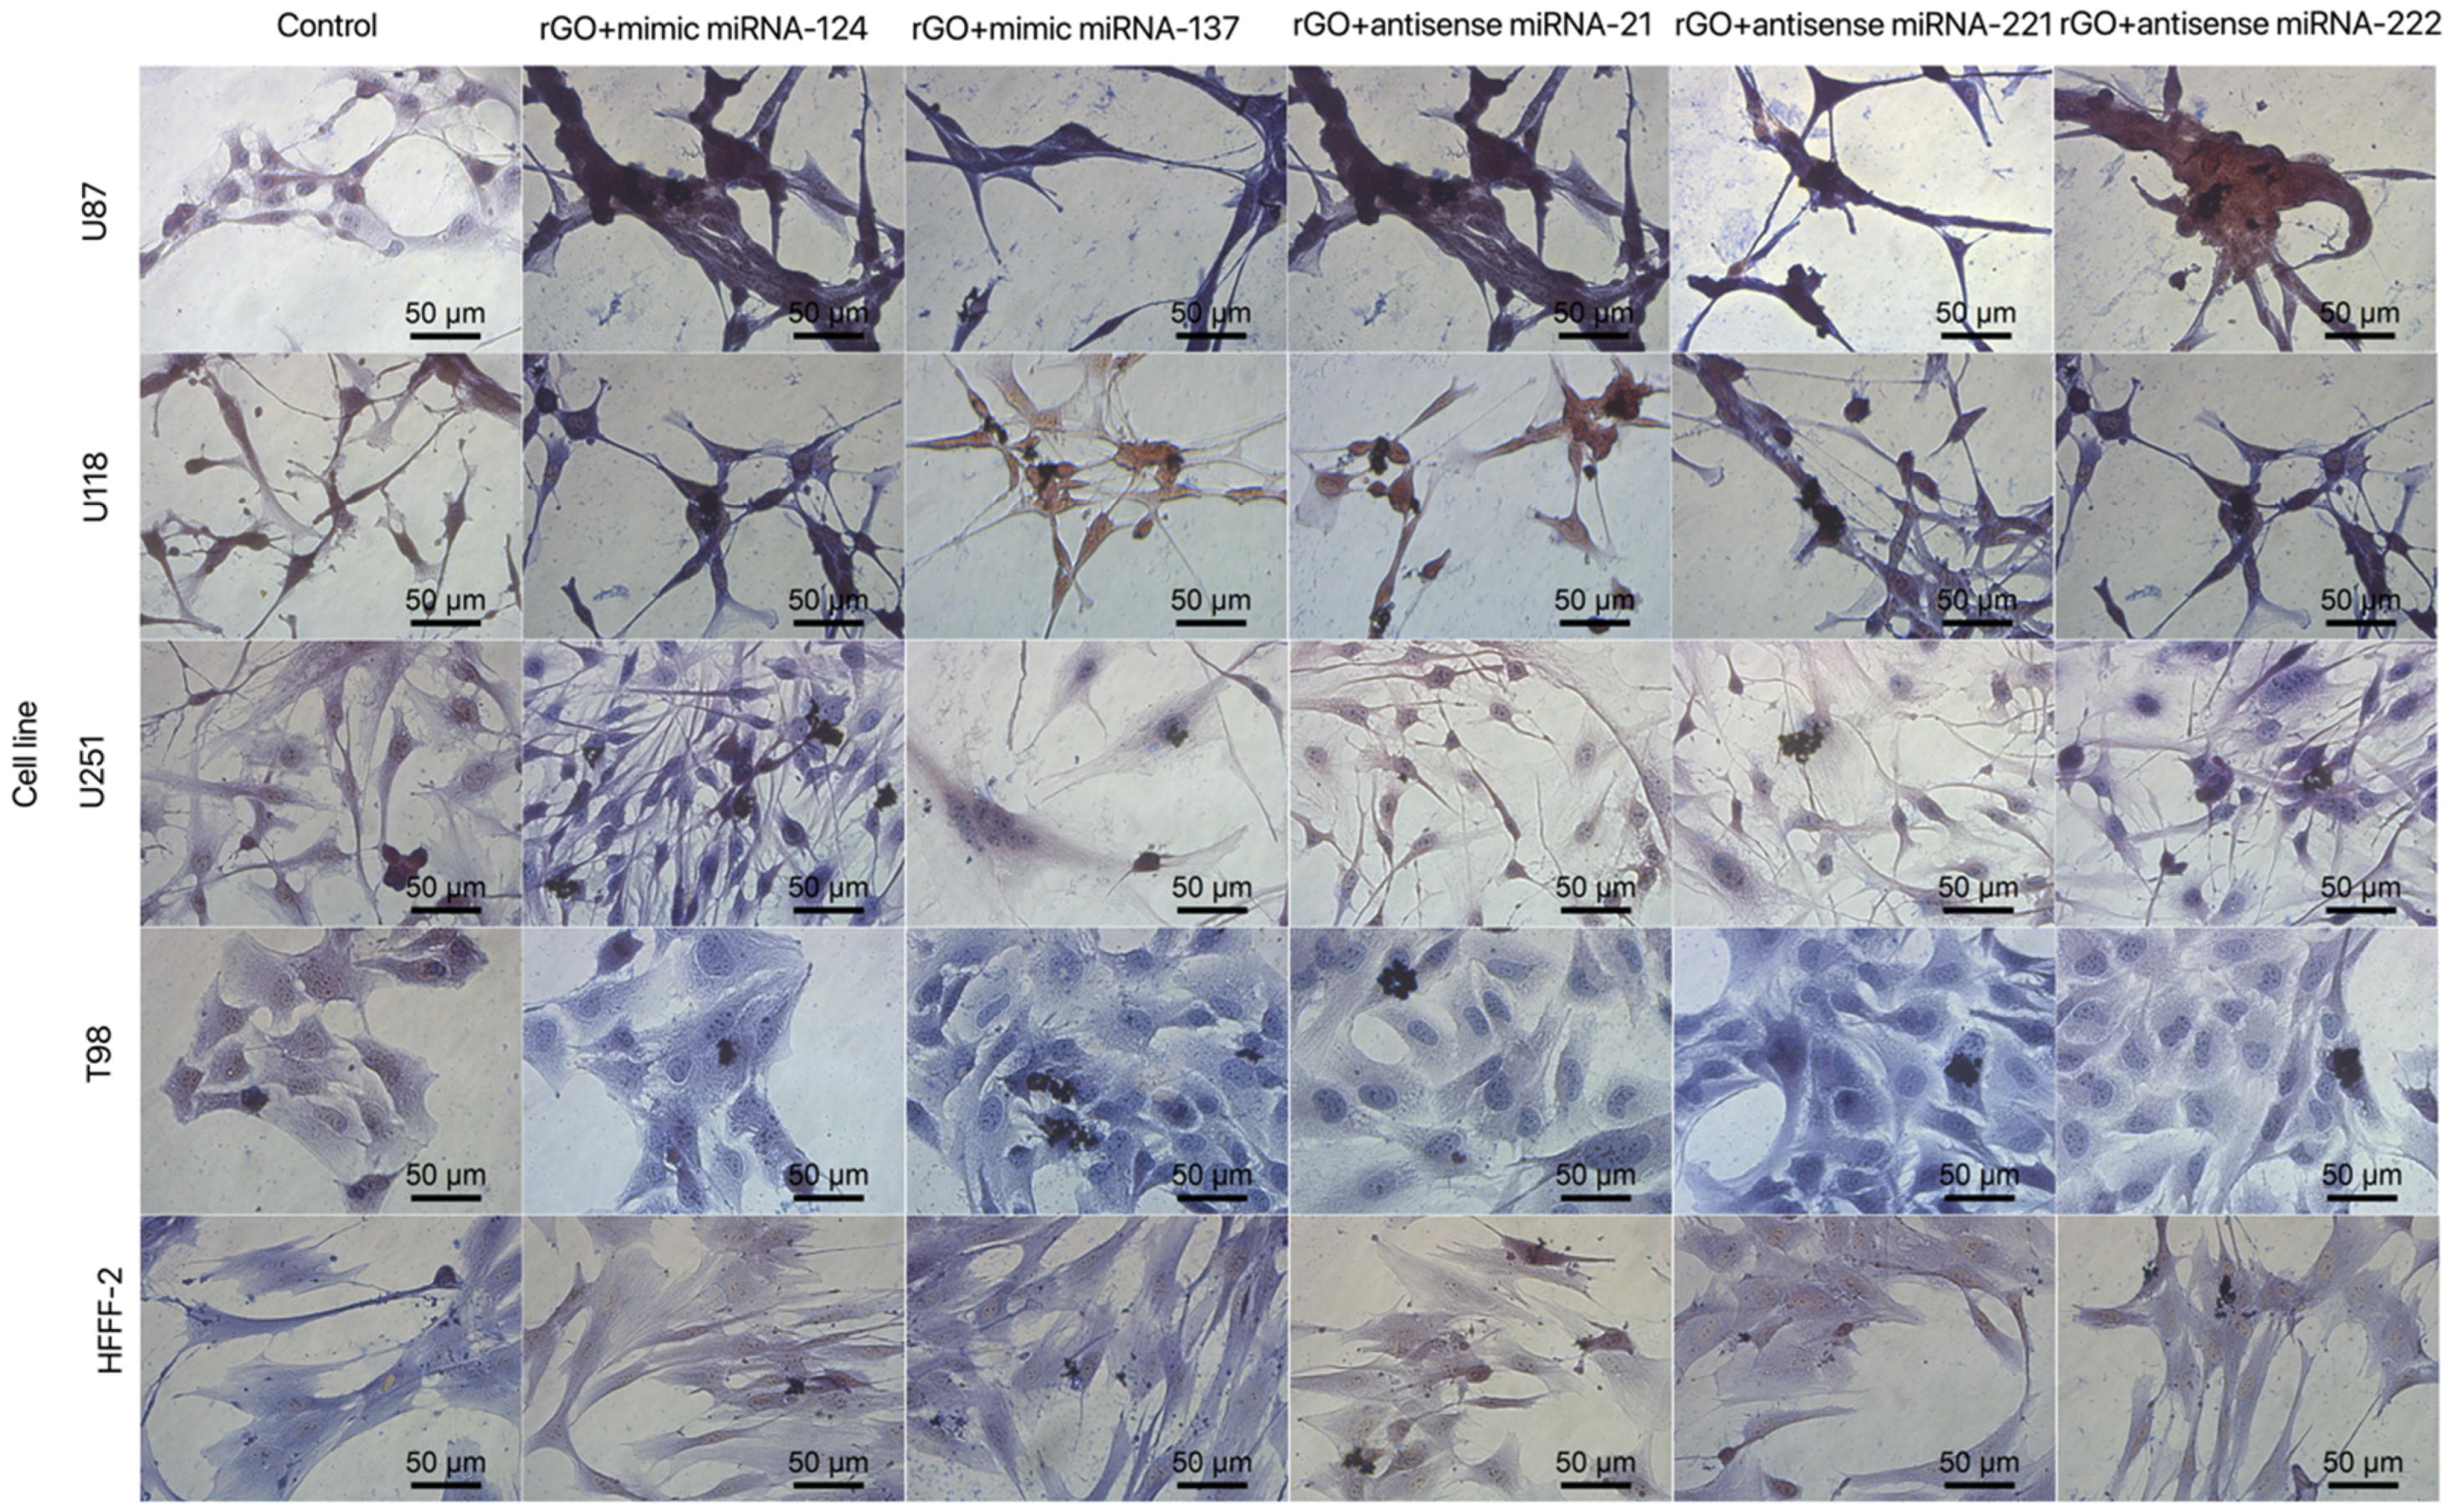
3.3. Cell Morphology
3.4. Cell Viability Assay
3.5. Cell Transfection
3.5.1. Electroporation
3.5.2. Transfection by Graphene Oxide and Reduced Graphene Oxide Complexes
3.5.3. Cell Morphology after Transfection by Graphene Oxide and Reduced Graphene Oxide
3.5.4. Cell Viability Assay after Transfection by Graphene Oxide and Reduced Graphene Oxide
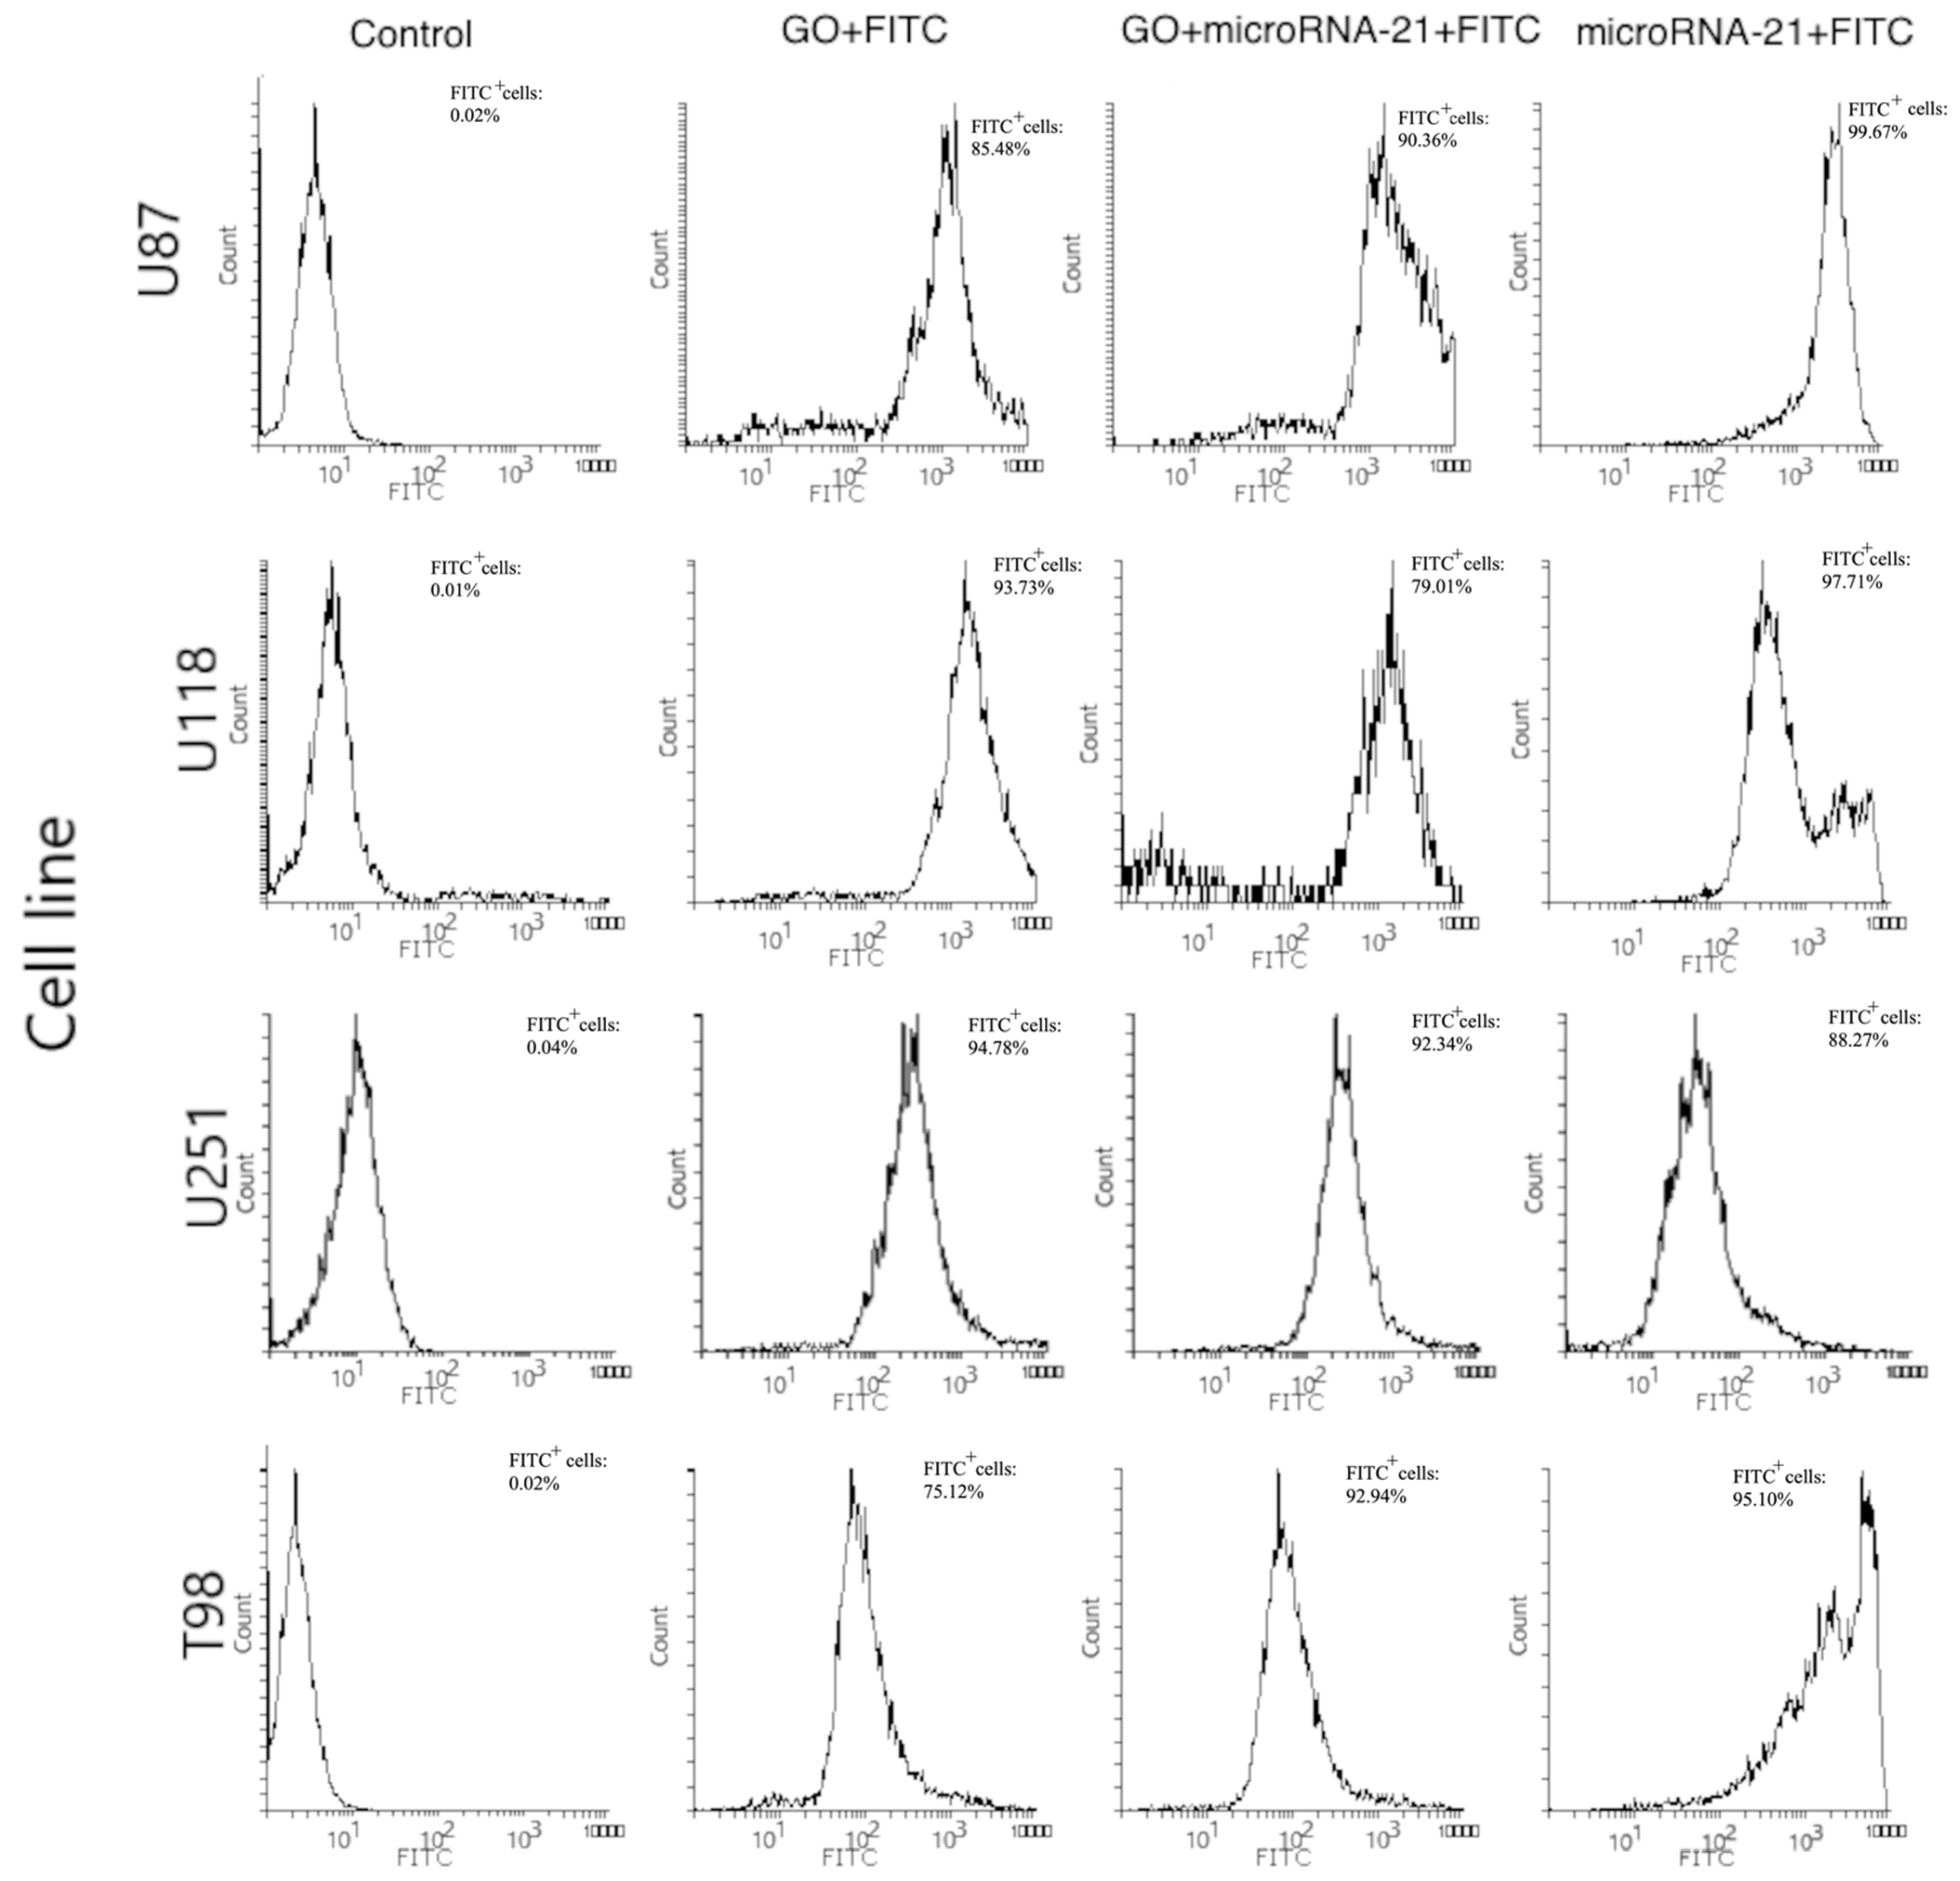
3.5.5. Transfection Efficiency Evaluation
3.6. Gene Expression
3.6.1. Isolation of Total RNA
3.6.2. Real-Time PCR
3.7. Isolation of Total Protein
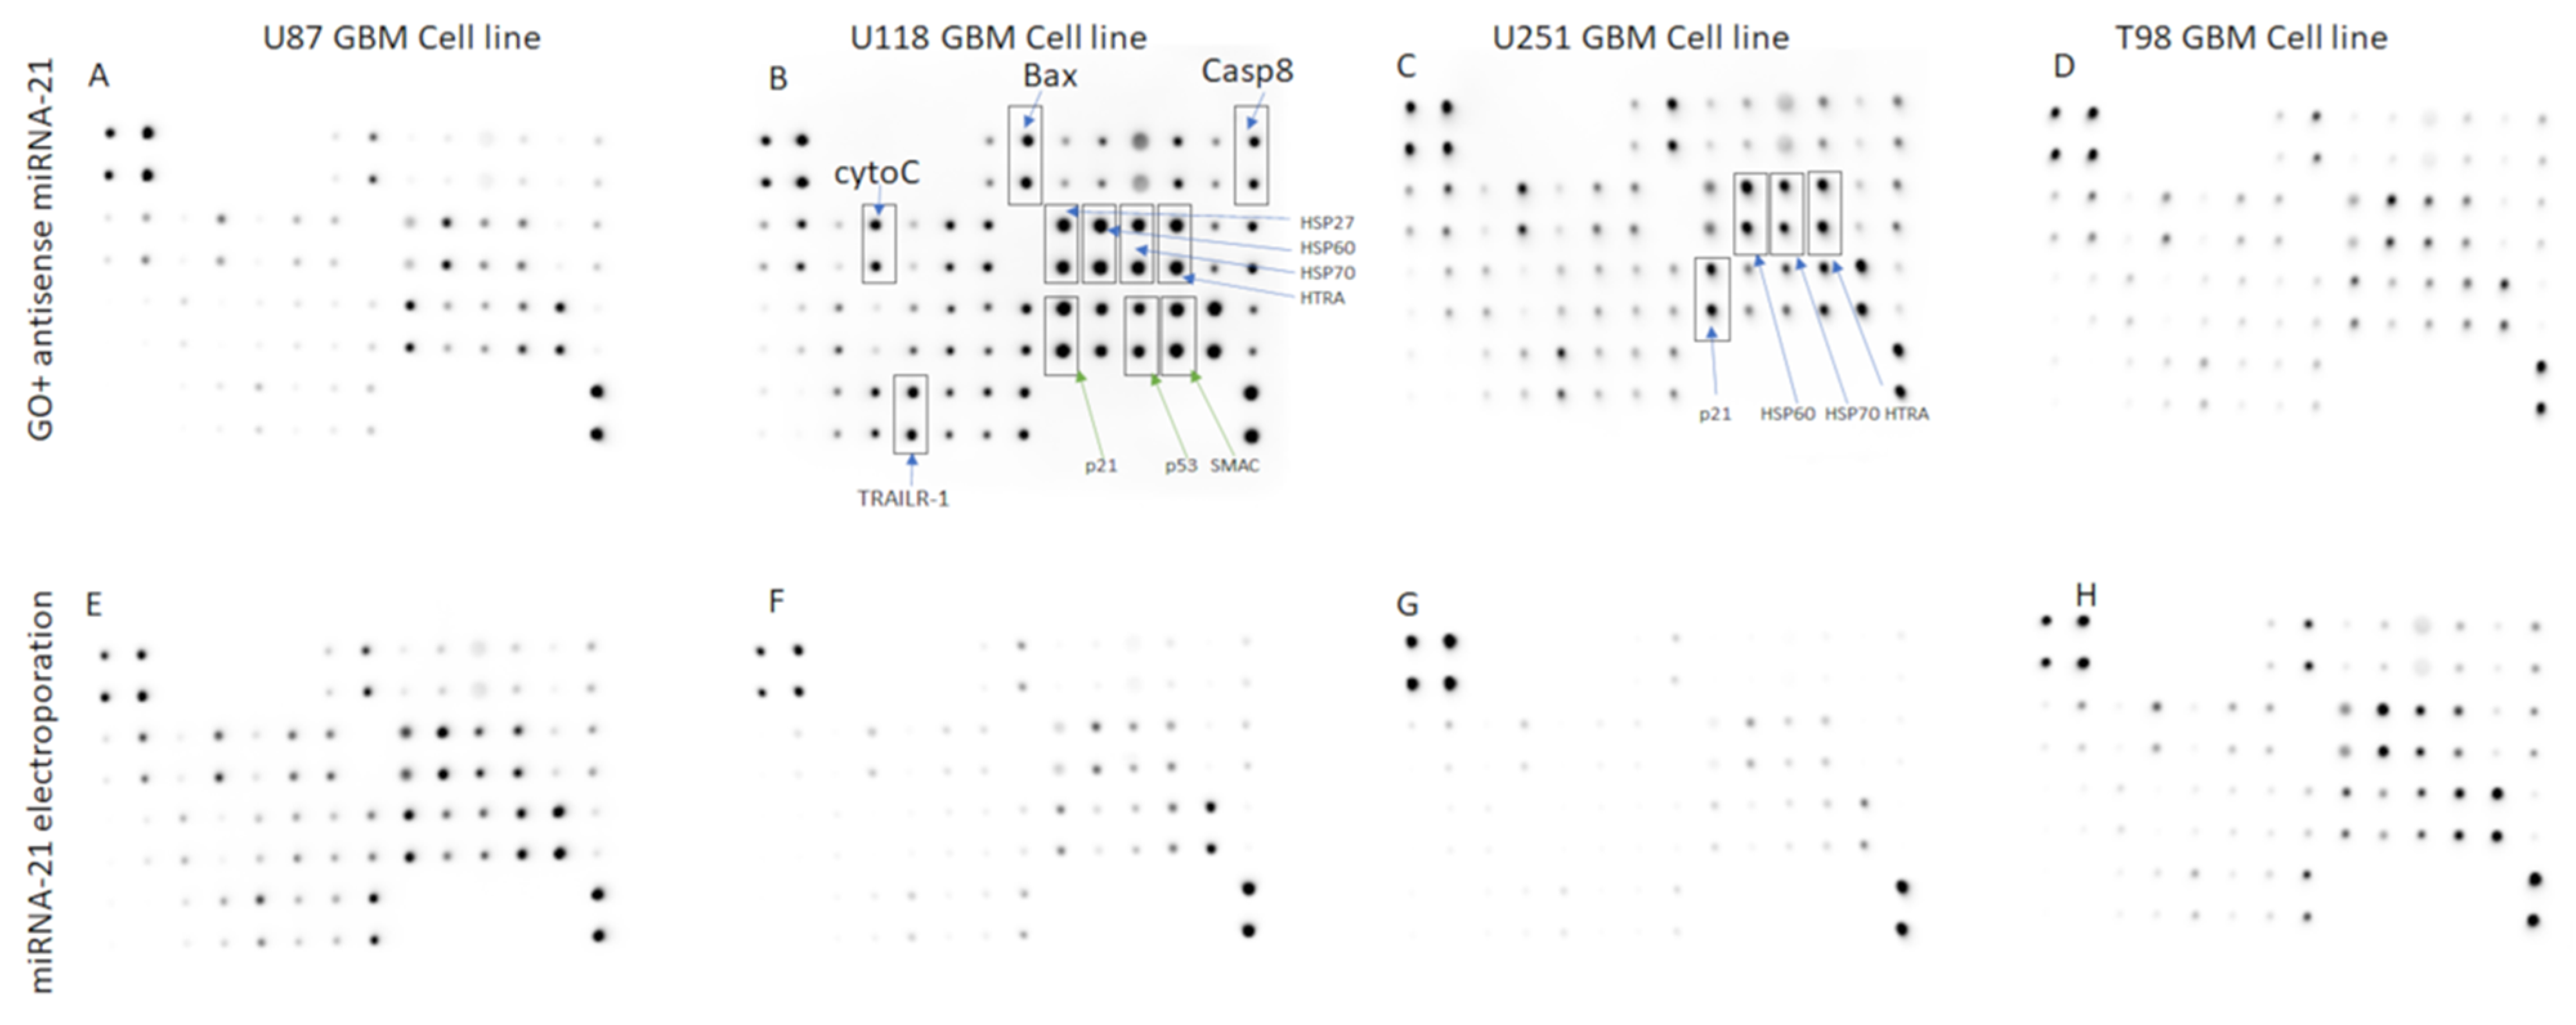
Human Apoptosis Antibody Array
3.8. Statistical Analysis
4. Conclusions
Supplementary Materials
Author Contributions
Funding
Institutional Review Board Statement
Informed Consent Statement
Data Availability Statement
Acknowledgments
Conflicts of Interest
Sample Availability
References
- Novoselov, K.S.; Geim, A.K.; Morozov, S.V.; Jiang, D.; Zhang, Y.; Dubonos, S.V.; Grigorieva, I.V.; Firsov, A.A. Electric Field Effect in Atomically Thin Carbon Films. Science 2004, 306, 666–669. [Google Scholar] [CrossRef] [Green Version]
- Zhao, H.; Ding, R.; Zhao, X.; Li, Y.; Qu, L.; Pei, H.; Yildirimer, L.; Wu, Z.; Zhang, W. Graphene-based Nanomaterials for Drug and/or Gene Delivery, Bioimaging, and Tissue Engineering. Drug Discov. Today 2017, 22, 1302–1317. [Google Scholar] [CrossRef]
- Loh, K.P.; Bao, Q.; Ang, P.K.; Yang, J. The Chemistry of Graphene. J. Mater. Chem. 2010, 20, 2277–2289. [Google Scholar] [CrossRef]
- Georgakilas, V.; Tiwari, J.N.; Kemp, K.C.; Perman, J.A.; Bourlinos, A.B.; Kim, K.S.; Zboril, R. Noncovalent Functionalization of Graphene and Graphene Oxide for Energy Materials, Biosensing, Catalytic, and Biomedical Applications. Chem. Rev. 2016, 116, 5464–5519. [Google Scholar] [CrossRef] [Green Version]
- Zhang, L.; Xia, J.; Zhao, Q.; Liu, L.; Zhang, Z. Functional Graphene Oxide as a Nanocarrier for Controlled Loading and Targeted Delivery of Mixed Anticancer Drugs. Small 2010, 6, 537–544. [Google Scholar] [CrossRef]
- Jin, R.; Ji, X.; Yang, Y.; Wang, H.; Cao, A. Self-assembled Graphene–dextran Nanohybrid for Killing Drug-resistant Cancer Cells. ACS Appl. Mater. Interfaces 2013, 5, 7181–7189. [Google Scholar] [CrossRef]
- Jaworski, S.; Sawosz, E.; Grodzik, M.; Winnicka, A.; Prasek, M.; Wierzbicki, M.; Chwalibog, A. In Vitro Evaluation of the Effects of Graphene Platelets on Glioblastoma Multiforme cells. Int. J. Nanomed. 2013, 8, 413. [Google Scholar]
- Hinzmann, M.; Jaworski, S.; Kutwin, M.; Jagiełło, J.; Koziński, R.; Wierzbicki, M.; Grodzik, M.; Lipińska, L.; Sawosz, E.; Chwalibog, A. Nanoparticles Containing Allotropes of Carbon Have Genotoxic Effects on Glioblastoma Multiforme Cells. Int. J. Nanomed. 2014, 9, 2409. [Google Scholar]
- Kurantowicz, N.; Strojny, B.; Sawosz, E.; Jaworski, S.; Kutwin, M.; Grodzik, M.; Wierzbicki, M.; Lipińska, L.; Mitura, K.; Chwalibog, A. Biodistribution of a High Dose of Diamond, Graphite, and Graphene Oxide Nanoparticles After Multiple Intraperitoneal Injections in Rats. Nanoscale Res. Lett. 2015, 10, 398. [Google Scholar] [CrossRef] [Green Version]
- Imani, R.; Mohabatpour, F.; Mostafavi, F. Graphene-based Nano-carrier Modifications for Gene Delivery Applications. Carbon 2018, 140, 569–591. [Google Scholar] [CrossRef]
- Vincent, M.; De Lázaro, I.; Kostarelos, K. Graphene Materials as 2D Non-viral Gene Transfer Vector Platforms. Gene Ther. 2017, 24, 123. [Google Scholar] [CrossRef] [PubMed] [Green Version]
- Cui, L.; Chen, Z.R.; Zhu, Z.; Lin, X.Y.; Chen, X.; Yang, C.J. Stabilization of ssRNA on Graphene Oxide Surface: An Effective Way to Design Highly Robust RNA Probes. Anal. Chem. 2013, 85, 2269–2275. [Google Scholar] [CrossRef] [PubMed]
- Tang, Z.; Wu, H.; Cort, J.R.; Buchko, G.W.; Zhang, Y.; Shao, Y.; Aksay, I.A.; Liu, J.; Lin, Y. Constraint of DNA on Functionalized Graphene Improves Its Biostability and Specificity. Small 2010, 6, 1205–1209. [Google Scholar] [CrossRef] [PubMed]
- Chen, B.; Liu, M.; Zhang, L.; Huang, J.; Yao, J.; Zhang, Z. Polyethylenimine-functionalized Graphene Oxide as an Efficient Gene Delivery Vector. J. Mater. Chem. 2011, 21, 7736–7741. [Google Scholar] [CrossRef]
- Zhang, L.; Lu, Z.; Zhao, Q.; Huang, J.; Shen, H.; Zhang, Z. Enhanced Chemotherapy Efficacy by Sequential Delivery of siRNA and Anticancer Drugs Using PEI-grafted Graphene Oxide. Small 2011, 7, 460–464. [Google Scholar] [CrossRef] [PubMed]
- Yang, X.; Niu, G.; Cao, X.; Wen, Y.; Xiang, R.; Duan, H.; Chen, Y. The Preparation of Functionalized Graphene Oxide for Targeted Intracellular Delivery of siRNA. J. Mater. Chem. 2012, 22, 6649–6654. [Google Scholar] [CrossRef]
- Zhang, L.; Wang, Z.; Lu, Z.; Shen, H.; Huang, J.; Zhao, Q.; Liu, M.; He, N.; Zhang, Z. PEGylated Reduced Graphene Oxide as a Superior ssRNA Delivery System. J. Mater. Chem. B 2013, 1, 749–755. [Google Scholar] [CrossRef]
- Dong, H.; Dong, C.; Ren, T.; Li, Y.; Shi, D. Surface-engineered Graphene-based Nanomaterials for Drug Delivery. J. Biomed. Nanotechnol. 2014, 10, 2086–2106. [Google Scholar] [CrossRef]
- Zhi, F.; Dong, H.; Jia, X.; Guo, W.; Lu, H.; Yang, Y.; Ju, H.; Zhang, X.; Hu, Y. Functionalized Graphene Oxide Mediated Adriamycin Delivery and miR-21 Gene Silencing to Overcome Tumor Multidrug Resistance in Vitro. PLoS ONE 2013, 8, e60034. [Google Scholar] [CrossRef] [Green Version]
- Yang, H.W.; Huang, C.Y.; Chih-Wen, L.; Liu, H.L.; Huang, C.W.; Liao, S.S.; Chen, P.Y.; Lu, Y.J.; Wei, K.C.; Ma, C.C. Gadolinium-functionalized Nanographene Oxide for Combined Drug and MicroRNA Delivery and Magnetic Resonance Imaging. Biomaterials 2014, 35, 6534–6542. [Google Scholar] [CrossRef]
- Bartel, D.P. MicroRNAs: Genomics, Biogenesis, Mechanism, and Function. Cell 2004, 116, 281–297. [Google Scholar] [CrossRef] [Green Version]
- Rissland, O.S.; Subtelny, A.O.; Wang, M.; Lugowski, A.; Nicholson, B.; Laver, J.D.; Sidhu, S.S.; Smibert, C.A.; Lipshitz, H.D.; Bartel, D.P. The Influence of MicroRNAs and Poly (A) Tail Length on Endogenous mRNA–protein Complexes. Genome Biol. 2017, 18, 211. [Google Scholar] [CrossRef]
- Piwecka, M.; Rolle, K.; Belter, A. Comprehensive Analysis of MicroRNA Expression Profile in Malignant Glioma Tissues. Mol. Oncol. 2015, 9, 1324–1340. [Google Scholar] [CrossRef]
- Ha, T.Y. MicroRNAs in Human Diseases: From Cancer to Cardiovascular Disease. Immune Netw. 2011, 11, 135–154. [Google Scholar] [CrossRef] [PubMed] [Green Version]
- MacFarlane, L.A.; Murphy, P.R. MicroRNA: Biogenesis, Function, and Role in Cancer. Curr. Genom. 2010, 11, 537–561. [Google Scholar] [CrossRef] [PubMed] [Green Version]
- Bader, A.G.; Brown, D.; Stoudemire, J.; Lammers, P. Developing Therapeutic MicroRNAs for Cancer. Gene Ther. 2011, 18, 1121–1126. [Google Scholar] [CrossRef] [PubMed] [Green Version]
- Wang, Z.; Rao, D.D.; Senzer, N.; Nemunaitis, J. RNA Interference and Cancer Therapy. Pharm. Res. 2011, 28, 2983–2995. [Google Scholar] [CrossRef]
- Liu, J.; Rivas, F.V.; Wohlschlegel, J.; Yates, J.R.; Parker, R.; Hannon, G.J. A Role for the P-body Component GW182 in MicroRNA Function. Nat. Cell Biol. 2005, 7, 1261–1266. [Google Scholar] [CrossRef] [PubMed]
- Thakkar, J.P.; Dolecek, T.A.; Horbinski, C.; Ostrom, Q.T.; Lighter, D.D.; Barbholtz-Sloan, J.; Villano, J.L. Epidemiologic and Molecular Prognostic Review of Glioblastoma. Cancer Epidemiol. Biomark. Prev. 2014, 23, 1985–1986. [Google Scholar] [CrossRef] [Green Version]
- Ozdemir-Kaynak, E.; Qutub, A.A.; Yesil-Celiktas, O. Advances in Glioblastoma Multiforme Treatment: New Models for Nanoparticle Therapy. Front. Physiol. 2018, 9, 170. [Google Scholar] [CrossRef] [Green Version]
- Nayak, S.; Herzog, R.W. Progress and Prospects: Immune Responses to Viral Vectors. Gene Ther. 2010, 17, 295. [Google Scholar] [CrossRef] [Green Version]
- Nayerossadat, N.; Maedeh, T.; Ali, P.A. Viral and Nonviral Delivery Systems for Gene Delivery. Adv. Biomed. Res. 2012, 1, 27. [Google Scholar] [CrossRef]
- Yin, H.; Kanasty, R.L.; Eltoukhy, A.A.; Vegas, A.J.; Dorkin, J.R.; Anderson, D.G. Non-viral Vectors for Gene-based Therapy. Nat. Rev. Genet. 2014, 15, 541–555. [Google Scholar] [CrossRef]
- Tomei, S.; Volontè, A.; Ravindran, S.; Mazzoleni, S.; Wang, E.; Galli, R.; Maccalli, C. MicroRNA Expression Profile Distinguishes Glioblastoma Stem Cells from Differentiated Tumor Cells. J. Pers. Med. 2021, 11, 264. [Google Scholar] [CrossRef] [PubMed]
- Buruiană, A.; Florian, Ș.I.; Florian, A.I.; Timiș, T.L.; Mihu, C.M.; Miclăuș, M.; Oșan, S.; Hrapșa, I.; Cataniciu, R.C.; Farcaș, M.; et al. The Roles of MiRNA in Glioblastoma Tumor Cell Communication: Diplomatic and Aggressive Negotiations. Int. J. Mol. Sci. 2020, 21, 1950. [Google Scholar] [CrossRef] [PubMed] [Green Version]
- Silber, J.; Lim, D.A.; Petritsch, C.; Persson, A.I.; Maunakea, A.K.; Yu, M.; Vandenberg, S.R.; Ginzinger, D.G.; James, C.D.; Costello, J.F.; et al. miR-124 and miR-137 Inhibit the Proliferation of Glioblastoma Multiforme Cells and Induce Differentiation of Brain Tumor Stem Cells. BMC Med. 2018, 6, 1–17. [Google Scholar] [CrossRef] [PubMed]
- Fernandez-Piñeiro, I.; Badiola, I.; Sanchez, A. Nanocarriers for MicroRNA Delivery in Cancer Medicine. Biotechnol. Adv. 2017, 35, 350–360. [Google Scholar] [CrossRef] [PubMed]
- Luo, G.; Luo, W.; Sun, X.; Lin, J.; Wang, M.; Zhang, Y.; Luo, W.; Zhang, Y. MicroRNA-21 Promotes Migration and Invasion of Glioma Cells via Activation of Sox2 and β-catenin Signaling. Mol. Med. Rep. 2017, 15, 187–193. [Google Scholar] [CrossRef] [Green Version]
- Xue, L.; Wang, Y.; Yue, S.; Zhang, J. The Expression of MiRNA-221 and MiRNA-222 in Gliomas Patients and Their Prognosis. Neurol. Sci. 2017, 38, 67–73. [Google Scholar] [CrossRef] [PubMed]
- Zhang, S.; Wan, Y.; Pan, T.; Gu, X.; Qian, C.; Sun, G.; Sun, L.; Xiang, Y.; Wang, Z.; Shi, L. MicroRNA-21 Inhibitor Sensitizes Human Glioblastoma U251 Stem Cells to Chemotherapeutic Drug Temozolomide. J. Mol. Neurosci. 2012, 47, 346–356. [Google Scholar] [CrossRef]
- Ren, Y.; Zhou, X.; Mei, M.; Yuan, X.B.; Han, L.; Wang, G.X.; Jia, Z.F.; Xu, P.; Pu, P.Y.; Kang, C.S. MicroRNA-21 Inhibitor Sensitizes Human Glioblastoma Cells U251 (PTEN-mutant) and LN229 (PTEN-wild type) to Taxol. BMC Cancer 2010, 10, 27. [Google Scholar] [CrossRef] [Green Version]
- Chan, J.A.; Krichevsky, A.M.; Kosik, K.S. MicroRNA-21 is an Antiapoptotic Factor in Human Glioblastoma Cells. Cancer Res. 2005, 65, 6029–6033. [Google Scholar] [CrossRef] [Green Version]
- Jiang, B.H.; Liu, L.Z. PI3K/PTEN Signaling in Tumorigenesis and Angiogenesis. Biochim. Biophys. Acta 2008, 1784, 150–158. [Google Scholar] [CrossRef]
- Zhang, J.; Han, L.; Ge, Y.; Zhou, X.; Zhang, A.; Zhang, C.; Zhong, Y.; You, Y.; Pu, P.; Kang, C. miR-221/222 Promotes Malignant Progression of Glioma through Activation of the Akt Pathway. Int. J. Oncol. 2010, 36, 913–920. [Google Scholar]
- Quintavalle, C.; Garofalo, M.; Zanca, C.; Romano, G.; Iaboni, M.; De Caro, M.D.B.; Martinez-Montero, J.C.; Incoronato, M.; Nuovo, G.; Croce, C.M.; et al. miR-221/222 Overexpression in Human Glioblastoma Increases Invasiveness by Targeting the Protein Phosphate PTPμ. Oncogene 2012, 31, 858. [Google Scholar] [CrossRef] [PubMed] [Green Version]
- Szczepaniak, J.; Strojny, B.; Sawosz Chwalibog, E.; Jaworski, S.; Jagiello, J.; Winkowska, M.; Grodzik, M. Effects of Reduced Graphene Oxides on Apoptosis and Cell Cycle of Glioblastoma Multiforme. Int. J. Mol. Sci. 2018, 19, 3939. [Google Scholar] [CrossRef] [PubMed] [Green Version]
- Kutwin, M.; Sawosz, E.; Jaworski, S.; Wierzbicki, M.; Strojny, B.; Grodzik, M.; Sosnowska, M.E.; Trzaskowski, M.; Chwalibog, A. Nanocomplexes of Graphene Oxide and Platinum Nanoparticles Against Colorectal Cancer colo205, HT-29, HTC-116, SW480, Liver Cancer HepG2, Human Breast Cancer MCF-7, and Adenocarcinoma LNCaP and Human Cervical Hela B Cell Lines. Materials 2019, 12, 909. [Google Scholar] [CrossRef] [Green Version]
- Piperno, A.; Mazzaglia, A.; Scala, A.; Pennisi, R.; Zagami, R.; Neri, G.; Torcasio, S.M.; Rosmini, C.; Mineo, P.G.; Potara, M.; et al. Casting Light on Intracellular Tracking of a New Functional Graphene-based MicroRNA Delivery System by FLIM and Raman Imaging. ACS Appl. Mater. Interfaces 2019, 11, 46101–46111. [Google Scholar] [CrossRef]
- Katas, H.; Mohd Amin, M.C.I.; Moideen, N.; Ng, L.Y.; Megat Baharudin, P.A.A. Cell growth inhibition effect of DsiRNA vectorised by pectin-coated chitosan-graphene oxide nanocomposites as potential therapy for colon cancer. J. Nanomater. 2017, 2017, 4298218. [Google Scholar] [CrossRef] [Green Version]
- Kuilla, T.; Bhadra, S.; Yao, D.; Kim, N.H.; Bose, J.S.; Lee, H. Recent Advances in Graphene-based Polymer Composites. Prog. Polym. Sci. 2010, 35, 1350–1375. [Google Scholar] [CrossRef]
- Liao, K.H.; Lin, Y.S.; Macosko, C.W.; Haynes, C.L. Cytotoxicity of Graphene Oxide and Graphene in Human Erythrocytes and Skin Fibroblasts. ACS Appl. Mater. Interfaces 2011, 3, 2607–2615. [Google Scholar] [CrossRef]
- Campbell, E.; Hasan, M.T.; Pho, C.; Callaghan, K.; Akkaraju, G.R.; Naumov, A.V. Graphene Oxide is a Multifunctional Platform for Intracellular Delivery, Imaging, and Cancer Sensing. Sci. Rep. 2019, 9, 416. [Google Scholar] [CrossRef] [PubMed] [Green Version]
- Jaworski, S.; Sawosz, E.; Kutwin, M.; Wierzbicki, M.; Hinzmann, M.; Grodzik, M.; Winnicka, A.; Lipińska, L.; Włodyga, K.; Chwalibog, A. In Vitro and in Vivo Effects of Graphene Oxide and Reduced Graphene Oxide on Glioblastoma. Int. J. Nanomed. 2015, 10, 1585. [Google Scholar]
- Sun, Q.; Wang, X.; Cui, C.; Li, J.; Wang, Y. Doxorubicin and Anti-VEGF SiRNA Co-delivery via Nano-graphene Oxide for Enhanced Cancer Therapy in Vitro and in Vivo. Int. J. Nanomed. 2018, 13, 3713. [Google Scholar] [CrossRef] [PubMed] [Green Version]
- Paul, A.; Hasan, A.; Kindi, H.A.; Gaharwar, A.K.; Rao, V.T.; Nikkhah, M.; Shin, S.R.; Krafft, D.; Dokmeci, M.R.; Shum-Tim, D.; et al. Injectable Graphene Oxide/Hydrogel-based Angiogenic Gene Delivery System for Vasculogenesis and Cardiac Repair. ACS Nano 2014, 8, 8050–8062. [Google Scholar] [CrossRef] [PubMed] [Green Version]
- Zhao, W.H.; Wu, S.Q.; Zhang, Y.D. Downregulation of miR-124 Promotes the Growth and Invasiveness of Glioblastoma Cells Involving Upregulation of PPP1R13L. Int. J. Mol. Med. 2013, 32, 101–107. [Google Scholar] [CrossRef]
- Zhang, G.; Chen, L.; Khan, A.A.; Li, B.; Gu, B.; Lin, F.; Su, X.; Yan, J. miRNA-124-3p/neuropilin-1(NRP-1) Axis Plays an Important Role in Mediating Glioblastoma Growth and Angiogenesis. Int. J. Cancer 2018, 143, 635–644. [Google Scholar] [CrossRef] [PubMed] [Green Version]
- Zhang, Y.; Dube, C.; Gibert, M.; Cruickshanks, N.; Wang, B.; Coughlan, M.; Yang, Y.; Setiady, I.; Deveau, C.; Saoud, K.; et al. The p53 Pathway in Glioblastoma. Cancers 2018, 10, 297. [Google Scholar] [CrossRef] [PubMed] [Green Version]
- Miao, W.; Liu, X.; Wang, H.; Fan, Y.; Lian, S.; Yang, X.; Wang, X.; Gio, G.; Li, Q.; Wang, S. p53 Upregulated Modulator of Apoptosis Sensitizes Drug-resistant U251 Glioblastoma Stem Cells to Temozolomide through Enhanced Apoptosis. Mol. Med. Rep. 2015, 11, 4165–4173. [Google Scholar] [CrossRef] [Green Version]
- Jeong, D.; Kim, J.; Nam, J.; Sun, H.; Lee, Y.H.; Lee, T.J.; Aguiar, R.C.T.; Kim, S.W. MicroRNA-124 Links p53 to the NF-κB Pathway in B-cell Lymphomas. Leukemia 2015, 29, 1868–1874. [Google Scholar] [CrossRef]
- Chang, T.H.; Tsai, M.F.; Gow, C.H.; Wu, S.G.; Liu, Y.N.; Chang, Y.L.; Yu, S.L.; Tsai, H.C.; Lin, S.W.; Chen, Y.W.; et al. Upregulation of MicroRNA-137. Expression by Slug Promotes Tumor Invasion and Metastasis of Non-small Cell Lung Cancer Cells through Suppression of TFAP2C. Cancer Lett. 2017, 402, 190–202. [Google Scholar] [CrossRef] [PubMed]
- Ma, X.; Choudhury, S.N.; Hua, X.; Dai, Z.; Li, Y. Interaction of the Oncogenic miR-21 MicroRNA and the p53 Tumor Suppressor Pathway. Carcinogenesis 2013, 34, 1216–1223. [Google Scholar] [CrossRef] [PubMed] [Green Version]
- Pu, X.X.; Huang, G.L.; Guo, H.Q.; Guo, C.C.; Li, H.; Ye, S.; Ling, S.; Jiang, L.; Tian, Y.; Lin, T.Y. Circulating miR-221 Directly Amplified from Plasma is a Potential Diagnostic and Prognostic Marker of Colorectal Cancer and Is Correlated with p53 Expression. J. Gastroenterol. Hepatol. 2010, 25, 1674–1680. [Google Scholar] [CrossRef] [PubMed]
- Reddy, S.; Song, L.; Zhao, Y.; Zhao, R.; Wu, D.; He, L.; Ramakrishana, S. Reduced graphene oxide-based electrochemically stimulated method for temozolomide delivery. Med. Devices Sens. 2018, 1, e10014. [Google Scholar] [CrossRef]
- Masoudi, M.S.; Mehrabian, E.; Mirzaei, H. MiR-21: A Key Player in Glioblastoma Pathogenesis. J. Cell. Biochem. 2018, 119, 1285–1290. [Google Scholar] [CrossRef]
- Kiprian, D.; Motyl, T.; Jezierska, A. 144. Białka z rodziny BCL-2 jako czynnki prognostyczne u chorych napromienianych z powodu nowotworów narządów głowy i szyi–doniesienie wstępne. Rep. Pract. Oncol. Radiother. 2003, 8, S245–S246. [Google Scholar] [CrossRef] [Green Version]
- Jurikova, M.; Danihel, Ľ.; Polák, Š.; Varga, I. Ki67, PCNA, and MCM Proteins: Markers of Proliferation in the Diagnosis of Breast Cancer. Acta Histochem. 2016, 118, 544–552. [Google Scholar] [CrossRef]
- Gao, Q.; Zhu, X.; Chen, J.; Mao, C.; Zhang, L.; Xu, Z. Upregulation of P53 Promoted G1 Arrest and Apoptosis in Human Umbilical Cord Vein Endothelial Cells from Preeclampsia. J. Hypertens. 2016, 34, 1380. [Google Scholar] [CrossRef] [Green Version]
- Wang, C.; Youle, R.J. The Role of Mitochondria in Apoptosis. Annu. Rev. Genet. 2009, 43, 95–118. [Google Scholar] [CrossRef] [Green Version]
- Johnstone, R.W.; Frew, A.J.; Smyth, M.J. The TRAIL apoptotic pathway in cancer onset, progression and therapy. Nat. Rev. Cancer 2008, 8, 782–798. [Google Scholar] [CrossRef]


| Target Gene | Forward Primer | Reverse Primer |
|---|---|---|
| p21 | CCTCATCCCGTGTTCTCCTTT | GTACCACCCAGCGGACAAGT |
| p53 | TTGCAATAGGTGTGCGTCAGA | AGTGCAGGCCAACTTGTTCAG |
| Bcl-2 | GAAGAGCAAATGAGCCAAAC | AACCTATGCAATGGGATTGA |
| BAX | GATGCGTCCACCAAGAAGCT | CGGCCCCAGTTGAAGTTG |
| PCNA | AGGCACTCAAGGACCTCATCA | GAGTCCATGCTCTGCAGGTTT |
| GAPDH | TGCACCACCAACTGCTTAGC | GGCATGGACTGTGGTCATGAG |
| Lin./Col. | C1 | C2 | C3 | C4 | C5 | C6 | C7 |
| L1 | Pos | Pos | Neg | Neg | BLANK | BLANK | Bad |
| L2 | Pos | Pos | Neg | Neg | BLANK | BLANK | Bad |
| L3 | CD40 | CD40L | cIAP-2 | cytoC | DR6 | Fas | FasL |
| L4 | CD40 | CD40L | cIAP-2 | cytoC | DR6 | Fas | FasL |
| L5 | IGFBP-1 | IGFBP-2 | IGFBP-3 | IGFBP-4 | IGFBP-5 | IGFBP-6 | IGF-1sR |
| L6 | IGFBP-1 | IGFBP-2 | IGFBP-3 | IGFBP-4 | IGFBP-5 | IGFBP-6 | IGF-1sR |
| L7 | sTNF-R2 | TNF-α | TNF-β | TRAILR-1 | TRAILR-2 | TRAILR-3 | TRAILR-4 |
| L8 | sTNF-R2 | TNF-α | TNF-β | TRAILR-1 | TRAILR-2 | TRAILR-3 | TRAILR-4 |
| Lin./Col. | C8 | C9 | C10 | C11 | C12 | C13 | C14 |
| L1 | Bax | Bcl-2 | Bcl-w | BID | BIM | Caspase 3 | Caspase 8 |
| L2 | Bax | Bcl-2 | Bcl-w | BID | BIM | Caspase 3 | Caspase 8 |
| L3 | BLANK | HSP27 | HSP60 | HSP70 | HTRA | IGF-I | IGF-II |
| L4 | BLANK | HSP27 | HSP60 | HSP70 | HTRA | IGF-I | IGF-II |
| L5 | Livin | p21 | p27 | p53 | SMAC | Survivin | sTNF-R1 |
| L6 | Livin | p21 | p27 | p53 | SMAC | Survivin | sTNF-R1 |
| L7 | XIAP | BLANK | BLANK | Neg | Neg | Neg | Pos |
| L8 | XIAP | BLANK | BLANK | Neg | Neg | Neg | Pos |
| Nanostructure | Cell Morphology | Cell Viability GBM U87, U118, U251, T98 | Gene and Protein Expression | |
|---|---|---|---|---|
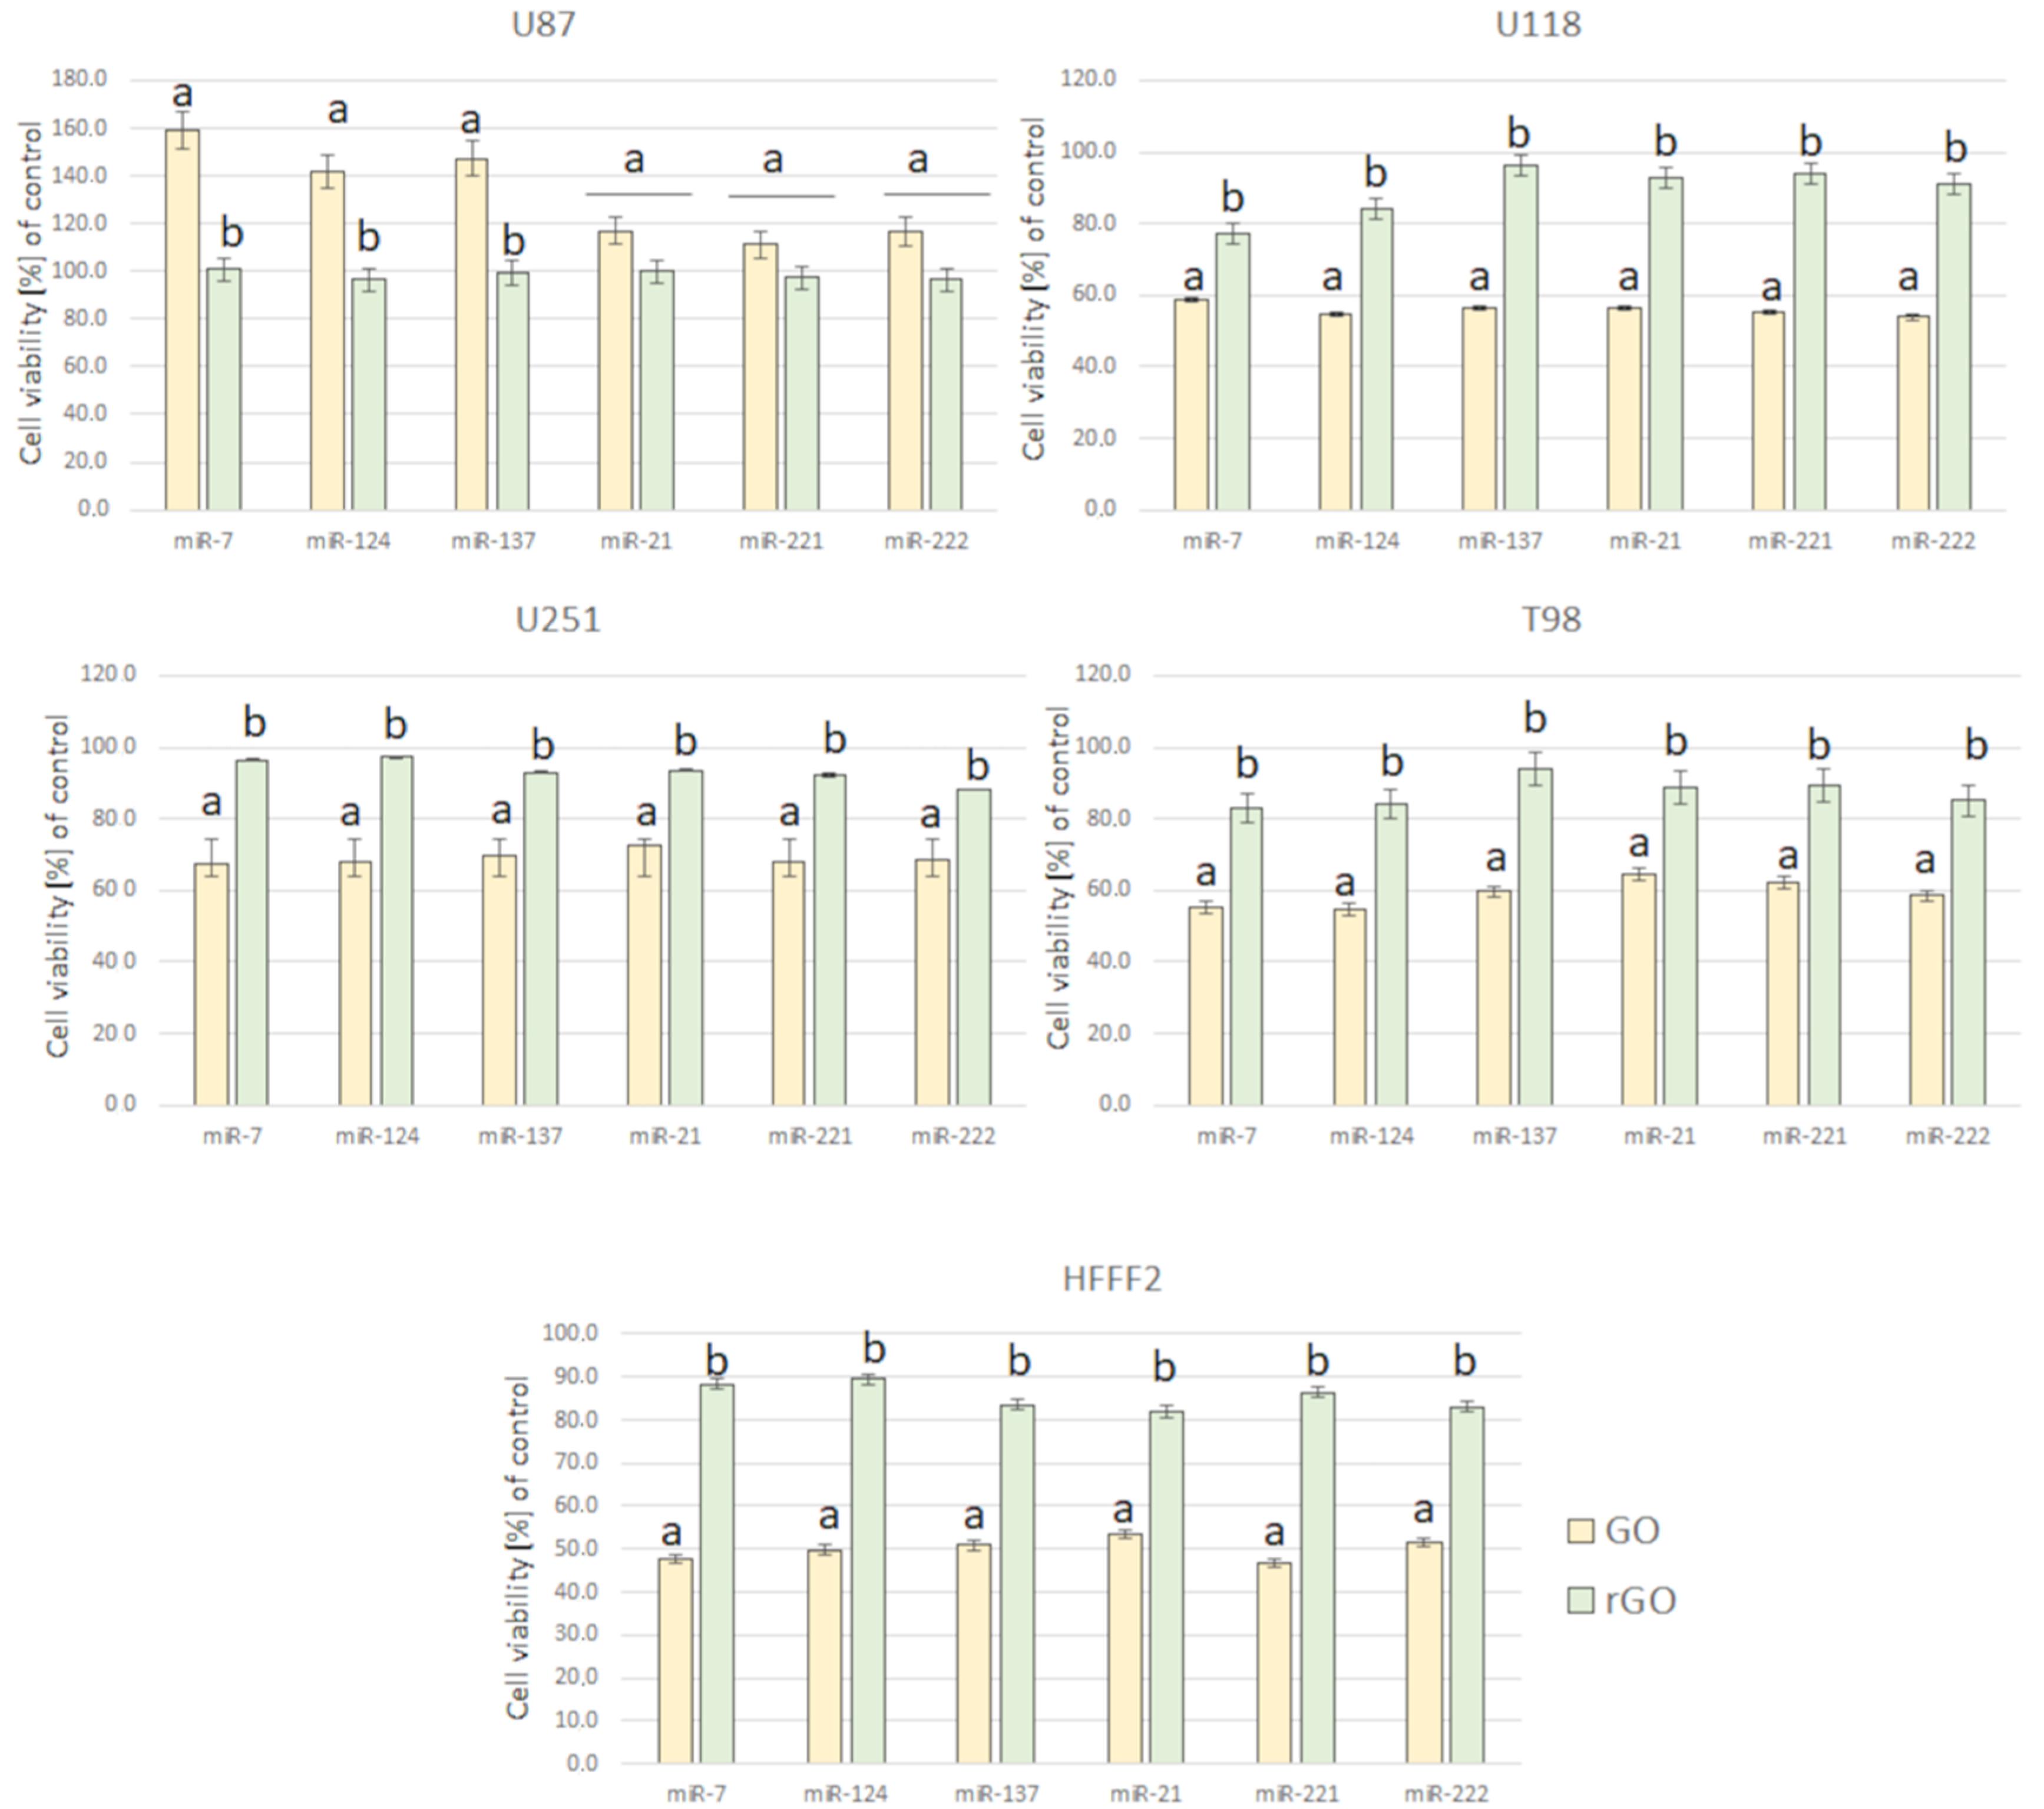
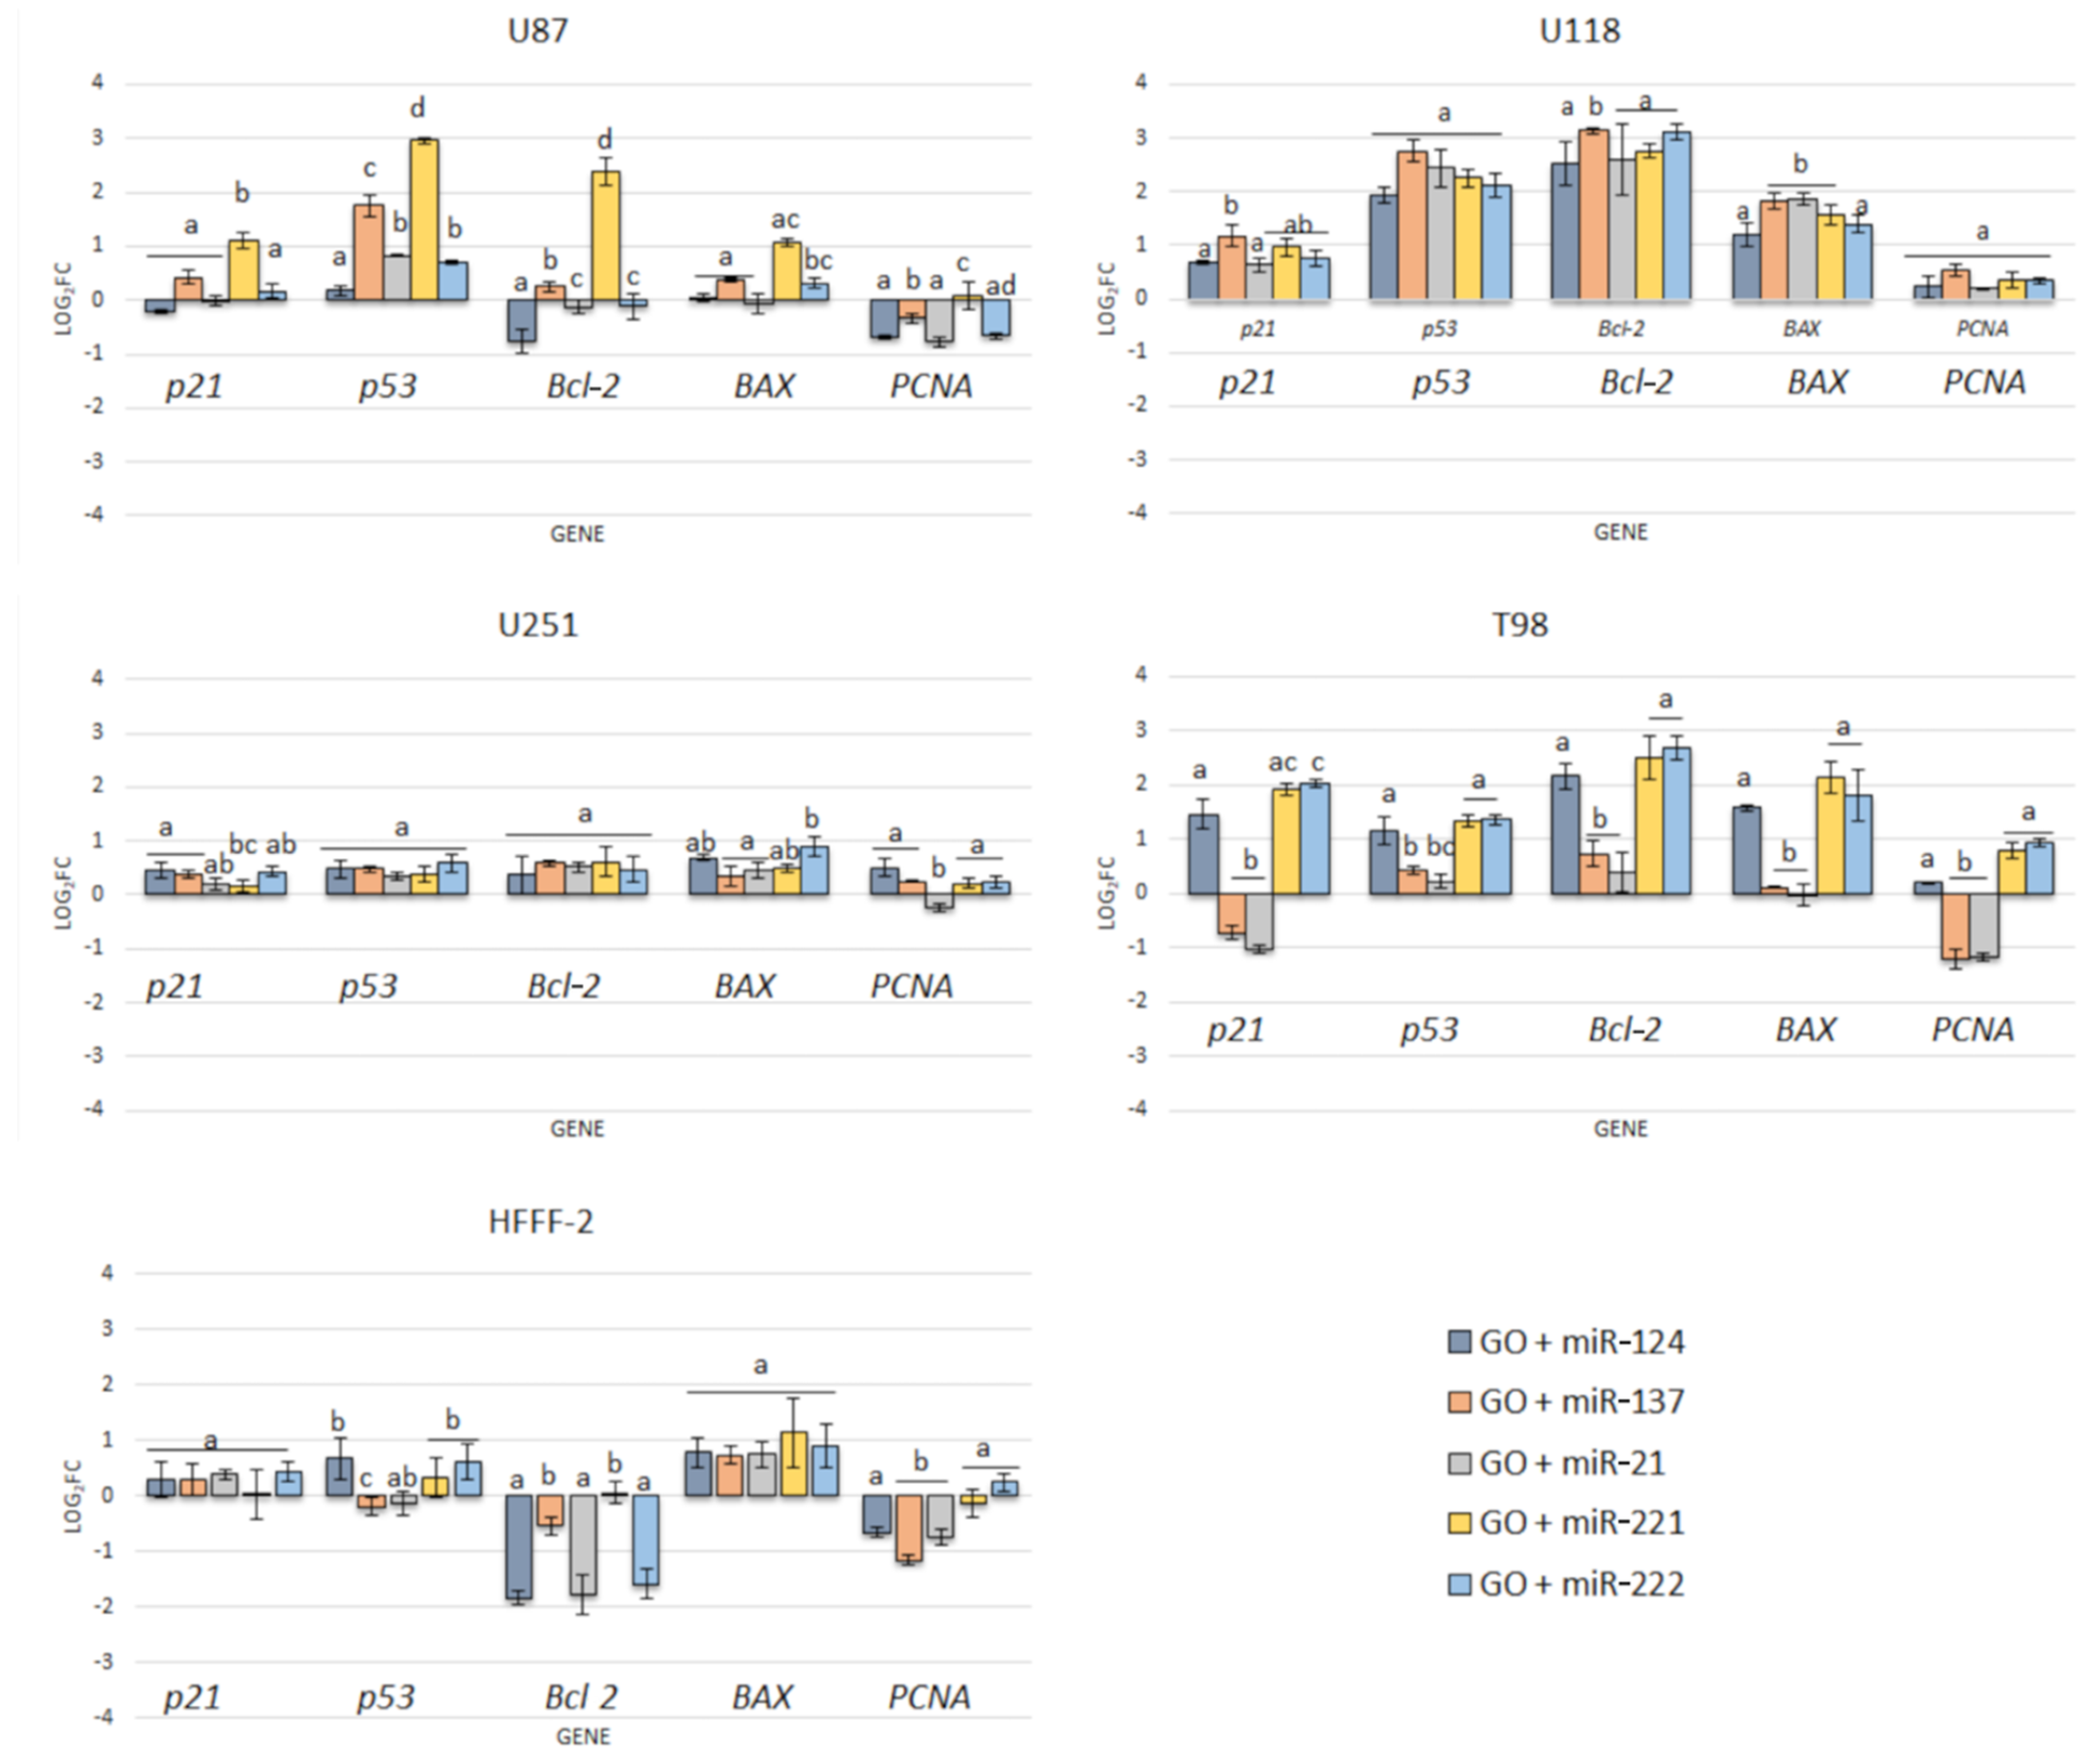
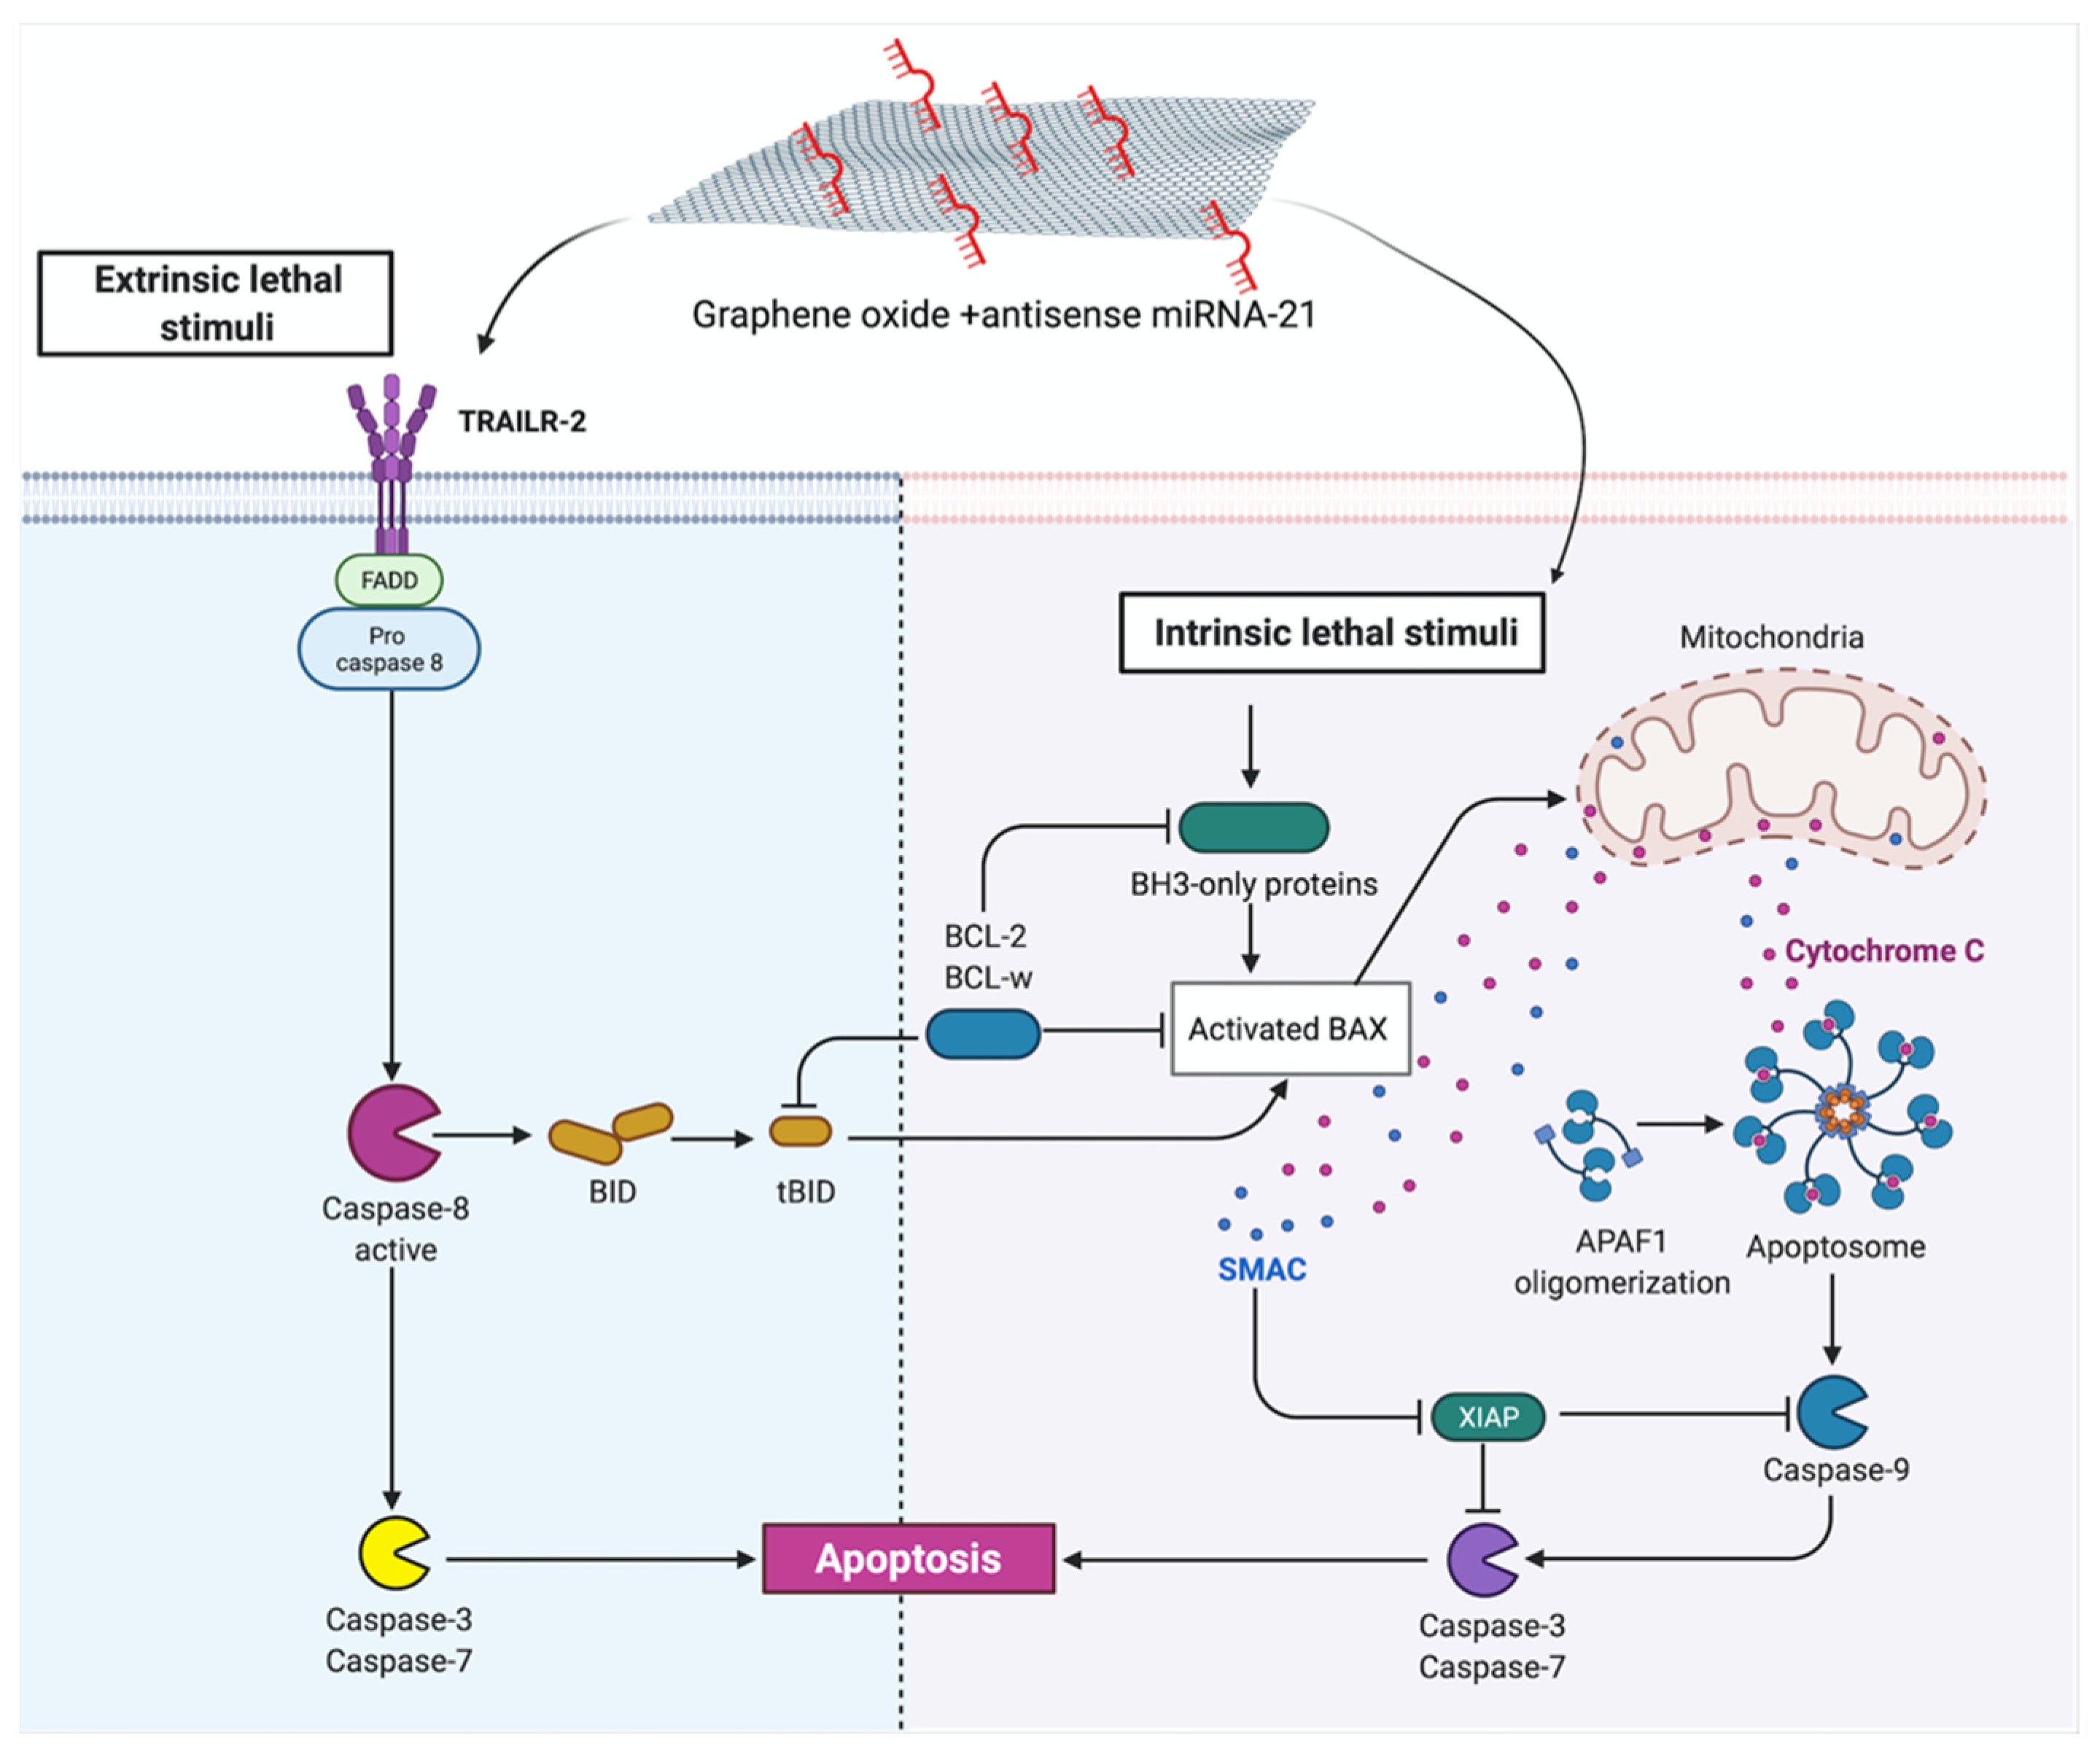
| Complexes of GO + miRNA-21 | Effect the cell structure, cell deformation, shortened tentacles | Reduce cell viability of U87, U118, U251 and T98 GBM cell line | Increase gene expression level of p21, p53, BAX Downregulate PCNA gene expression level Increased the protein expression level of BAX, cytoC, Smac and caspase -8 | |
| Complexes of rGO + antisense miRNA-21 | Effect the cell structure, minor cell deformation | No cytotoxic effect against U87, U118, U251 and T98 GBM cell line | - | |
| miRNA | Antisense miRNA-21 | Effect the cell structure, cell deformation, shortened tentacles | Reduce cell viability of U87, U118, U251 and T98 GBM cell line | Increase expression level of p21, p53, BAX Downregulate PCNA expression level |
Publisher’s Note: MDPI stays neutral with regard to jurisdictional claims in published maps and institutional affiliations. |
© 2021 by the authors. Licensee MDPI, Basel, Switzerland. This article is an open access article distributed under the terms and conditions of the Creative Commons Attribution (CC BY) license (https://creativecommons.org/licenses/by/4.0/).
Share and Cite
Kutwin, M.; Sosnowska, M.E.; Strojny-Cieślak, B.; Jaworski, S.; Trzaskowski, M.; Wierzbicki, M.; Chwalibog, A.; Sawosz, E. MicroRNA Delivery by Graphene-Based Complexes into Glioblastoma Cells. Molecules 2021, 26, 5804. https://0-doi-org.brum.beds.ac.uk/10.3390/molecules26195804
Kutwin M, Sosnowska ME, Strojny-Cieślak B, Jaworski S, Trzaskowski M, Wierzbicki M, Chwalibog A, Sawosz E. MicroRNA Delivery by Graphene-Based Complexes into Glioblastoma Cells. Molecules. 2021; 26(19):5804. https://0-doi-org.brum.beds.ac.uk/10.3390/molecules26195804
Chicago/Turabian StyleKutwin, Marta, Malwina Ewa Sosnowska, Barbara Strojny-Cieślak, Slawomir Jaworski, Maciej Trzaskowski, Mateusz Wierzbicki, Andre Chwalibog, and Ewa Sawosz. 2021. "MicroRNA Delivery by Graphene-Based Complexes into Glioblastoma Cells" Molecules 26, no. 19: 5804. https://0-doi-org.brum.beds.ac.uk/10.3390/molecules26195804