
A Novel L-Shaped Fluorescent Probe for AIE Sensing of Zinc (II) Ion by a DR/NIR Response

 , , and
Abstract
:
1. Introduction
2. Materials and Methods
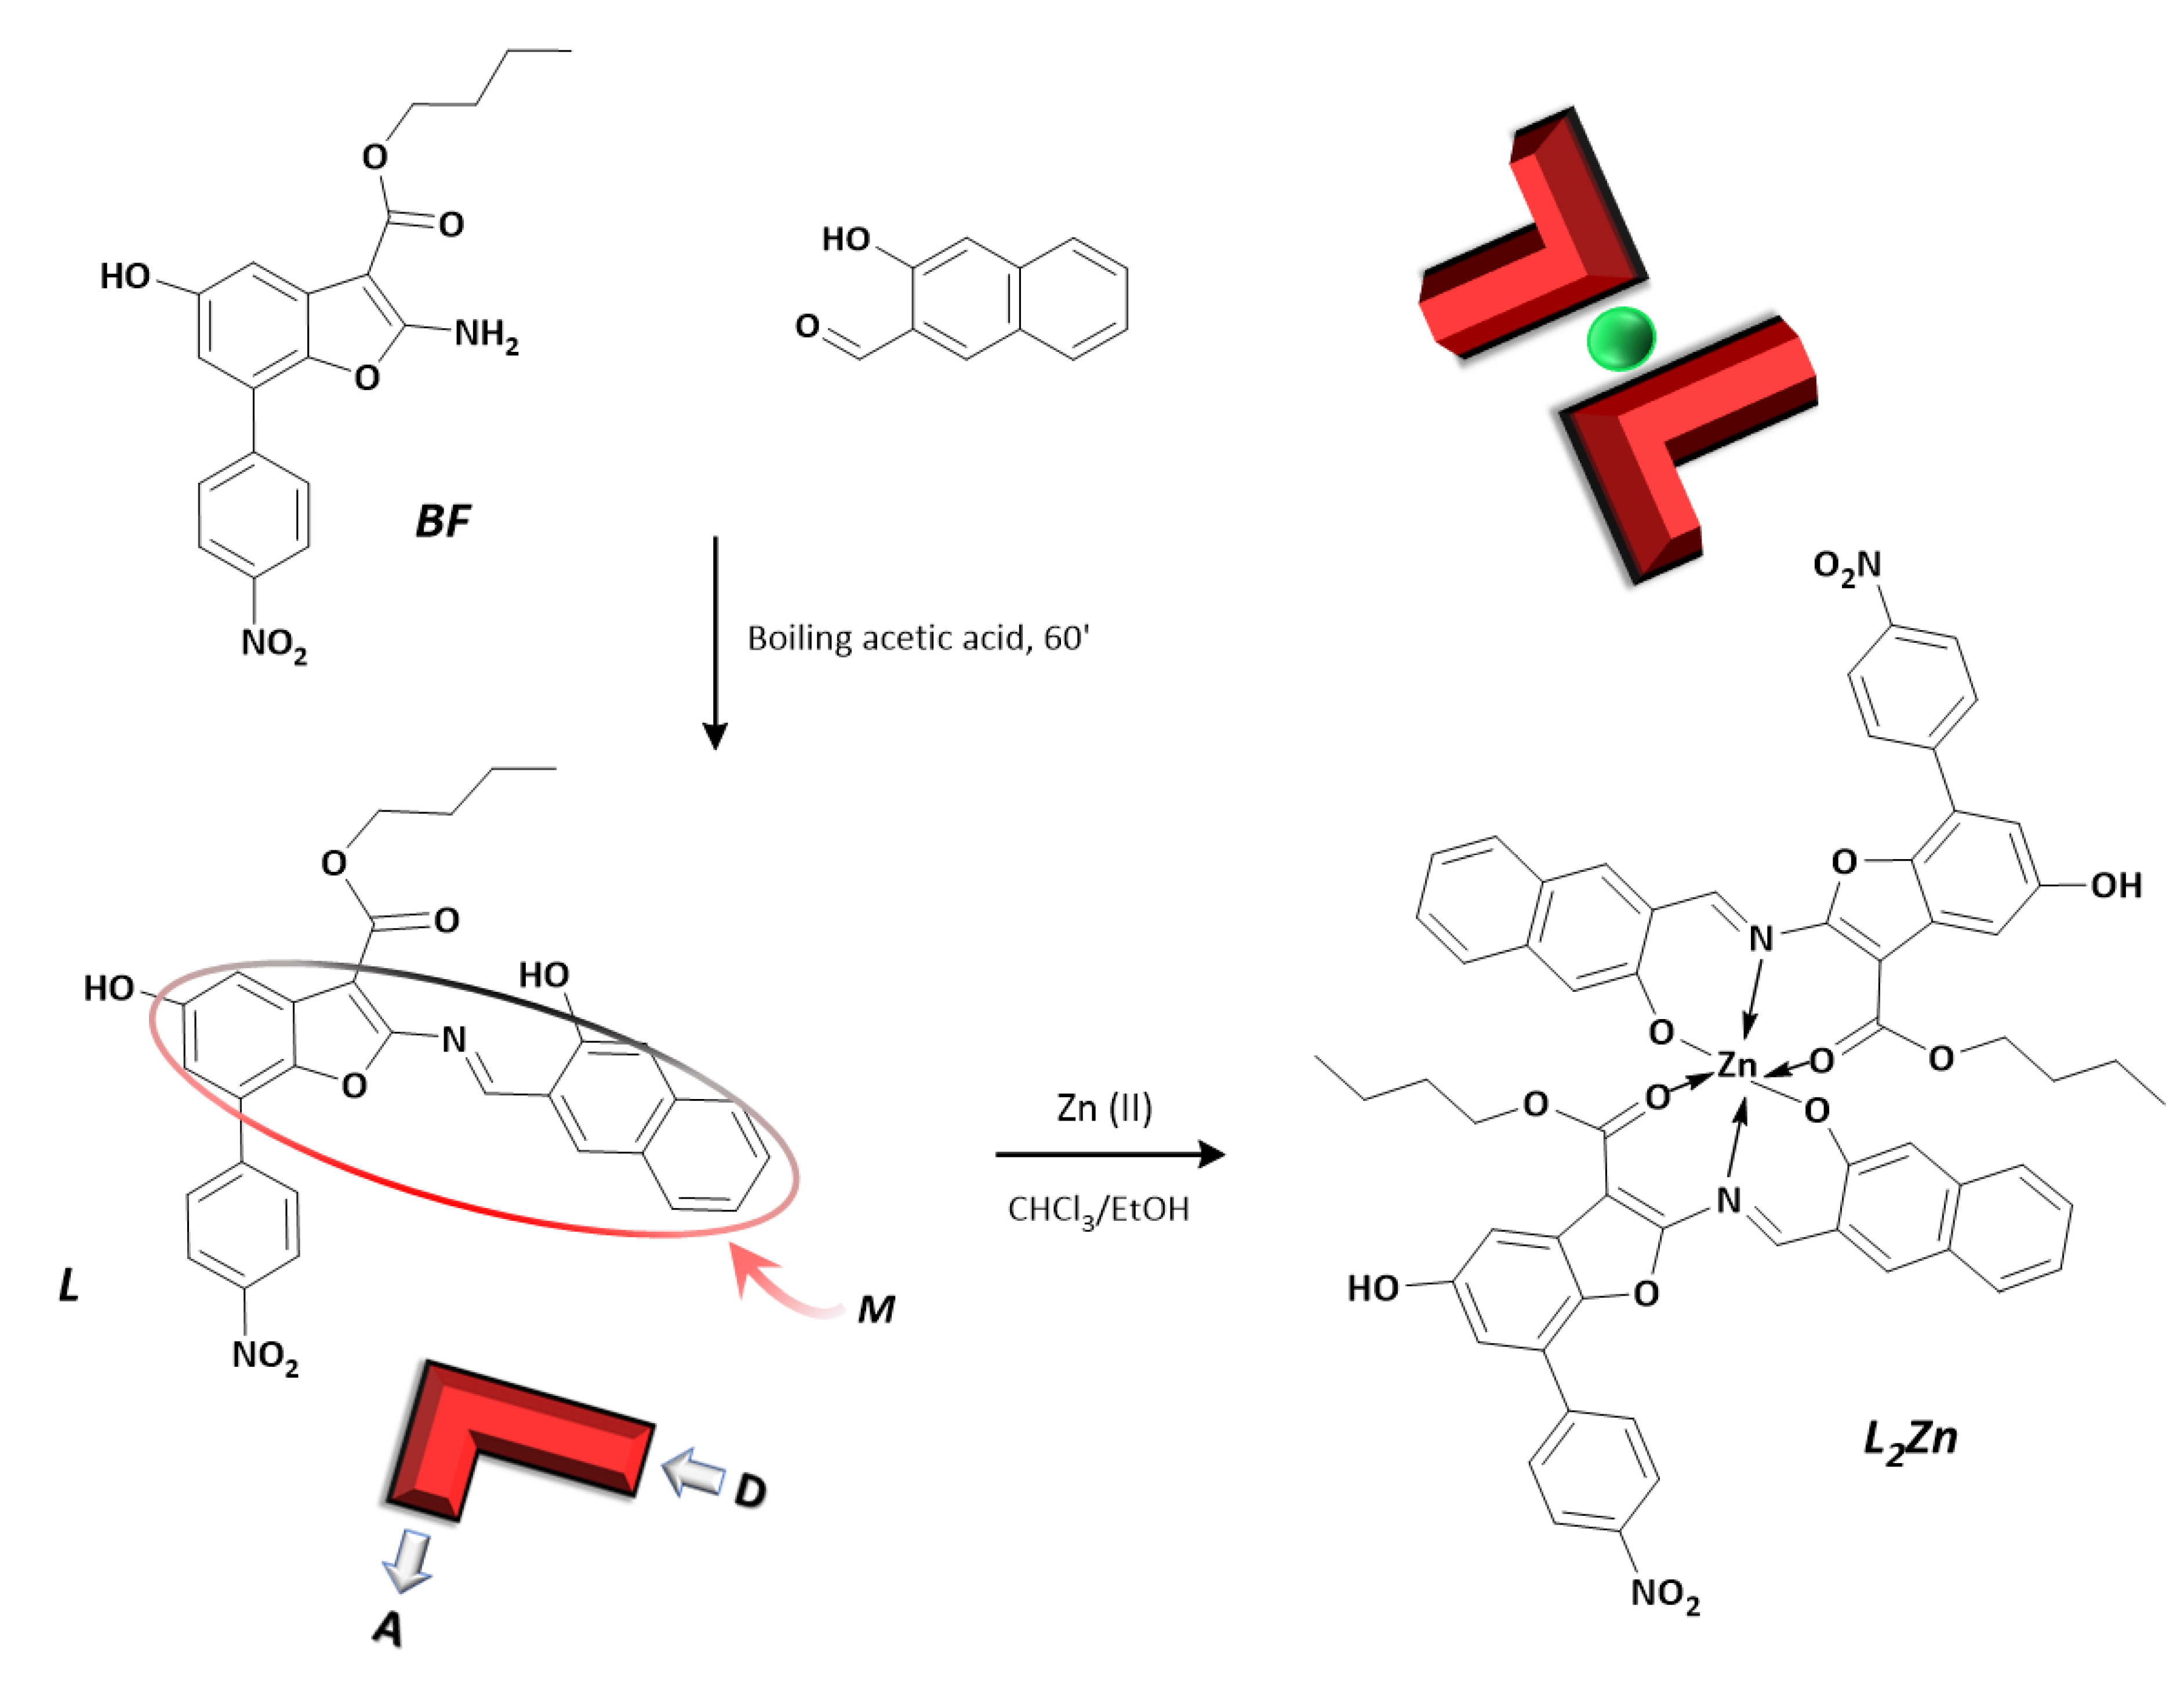
2.1. Synthesis of L
2.2. Synthesis of L2Zn
2.3. Job’s Plot Measurements
2.4. UV-Visible Titrations of L with Zinc (II) Cation and Naked-Eye Analysis for the Adduct L2Zn
2.5. Single-Crystal X-ray Analysis
2.6. DFT Computational Details
3. Results and Discussion
3.1. Design and Spectroscopic Behaviour of L
3.2. Synthesis and Spectroscopic Behaviour of L2Zn
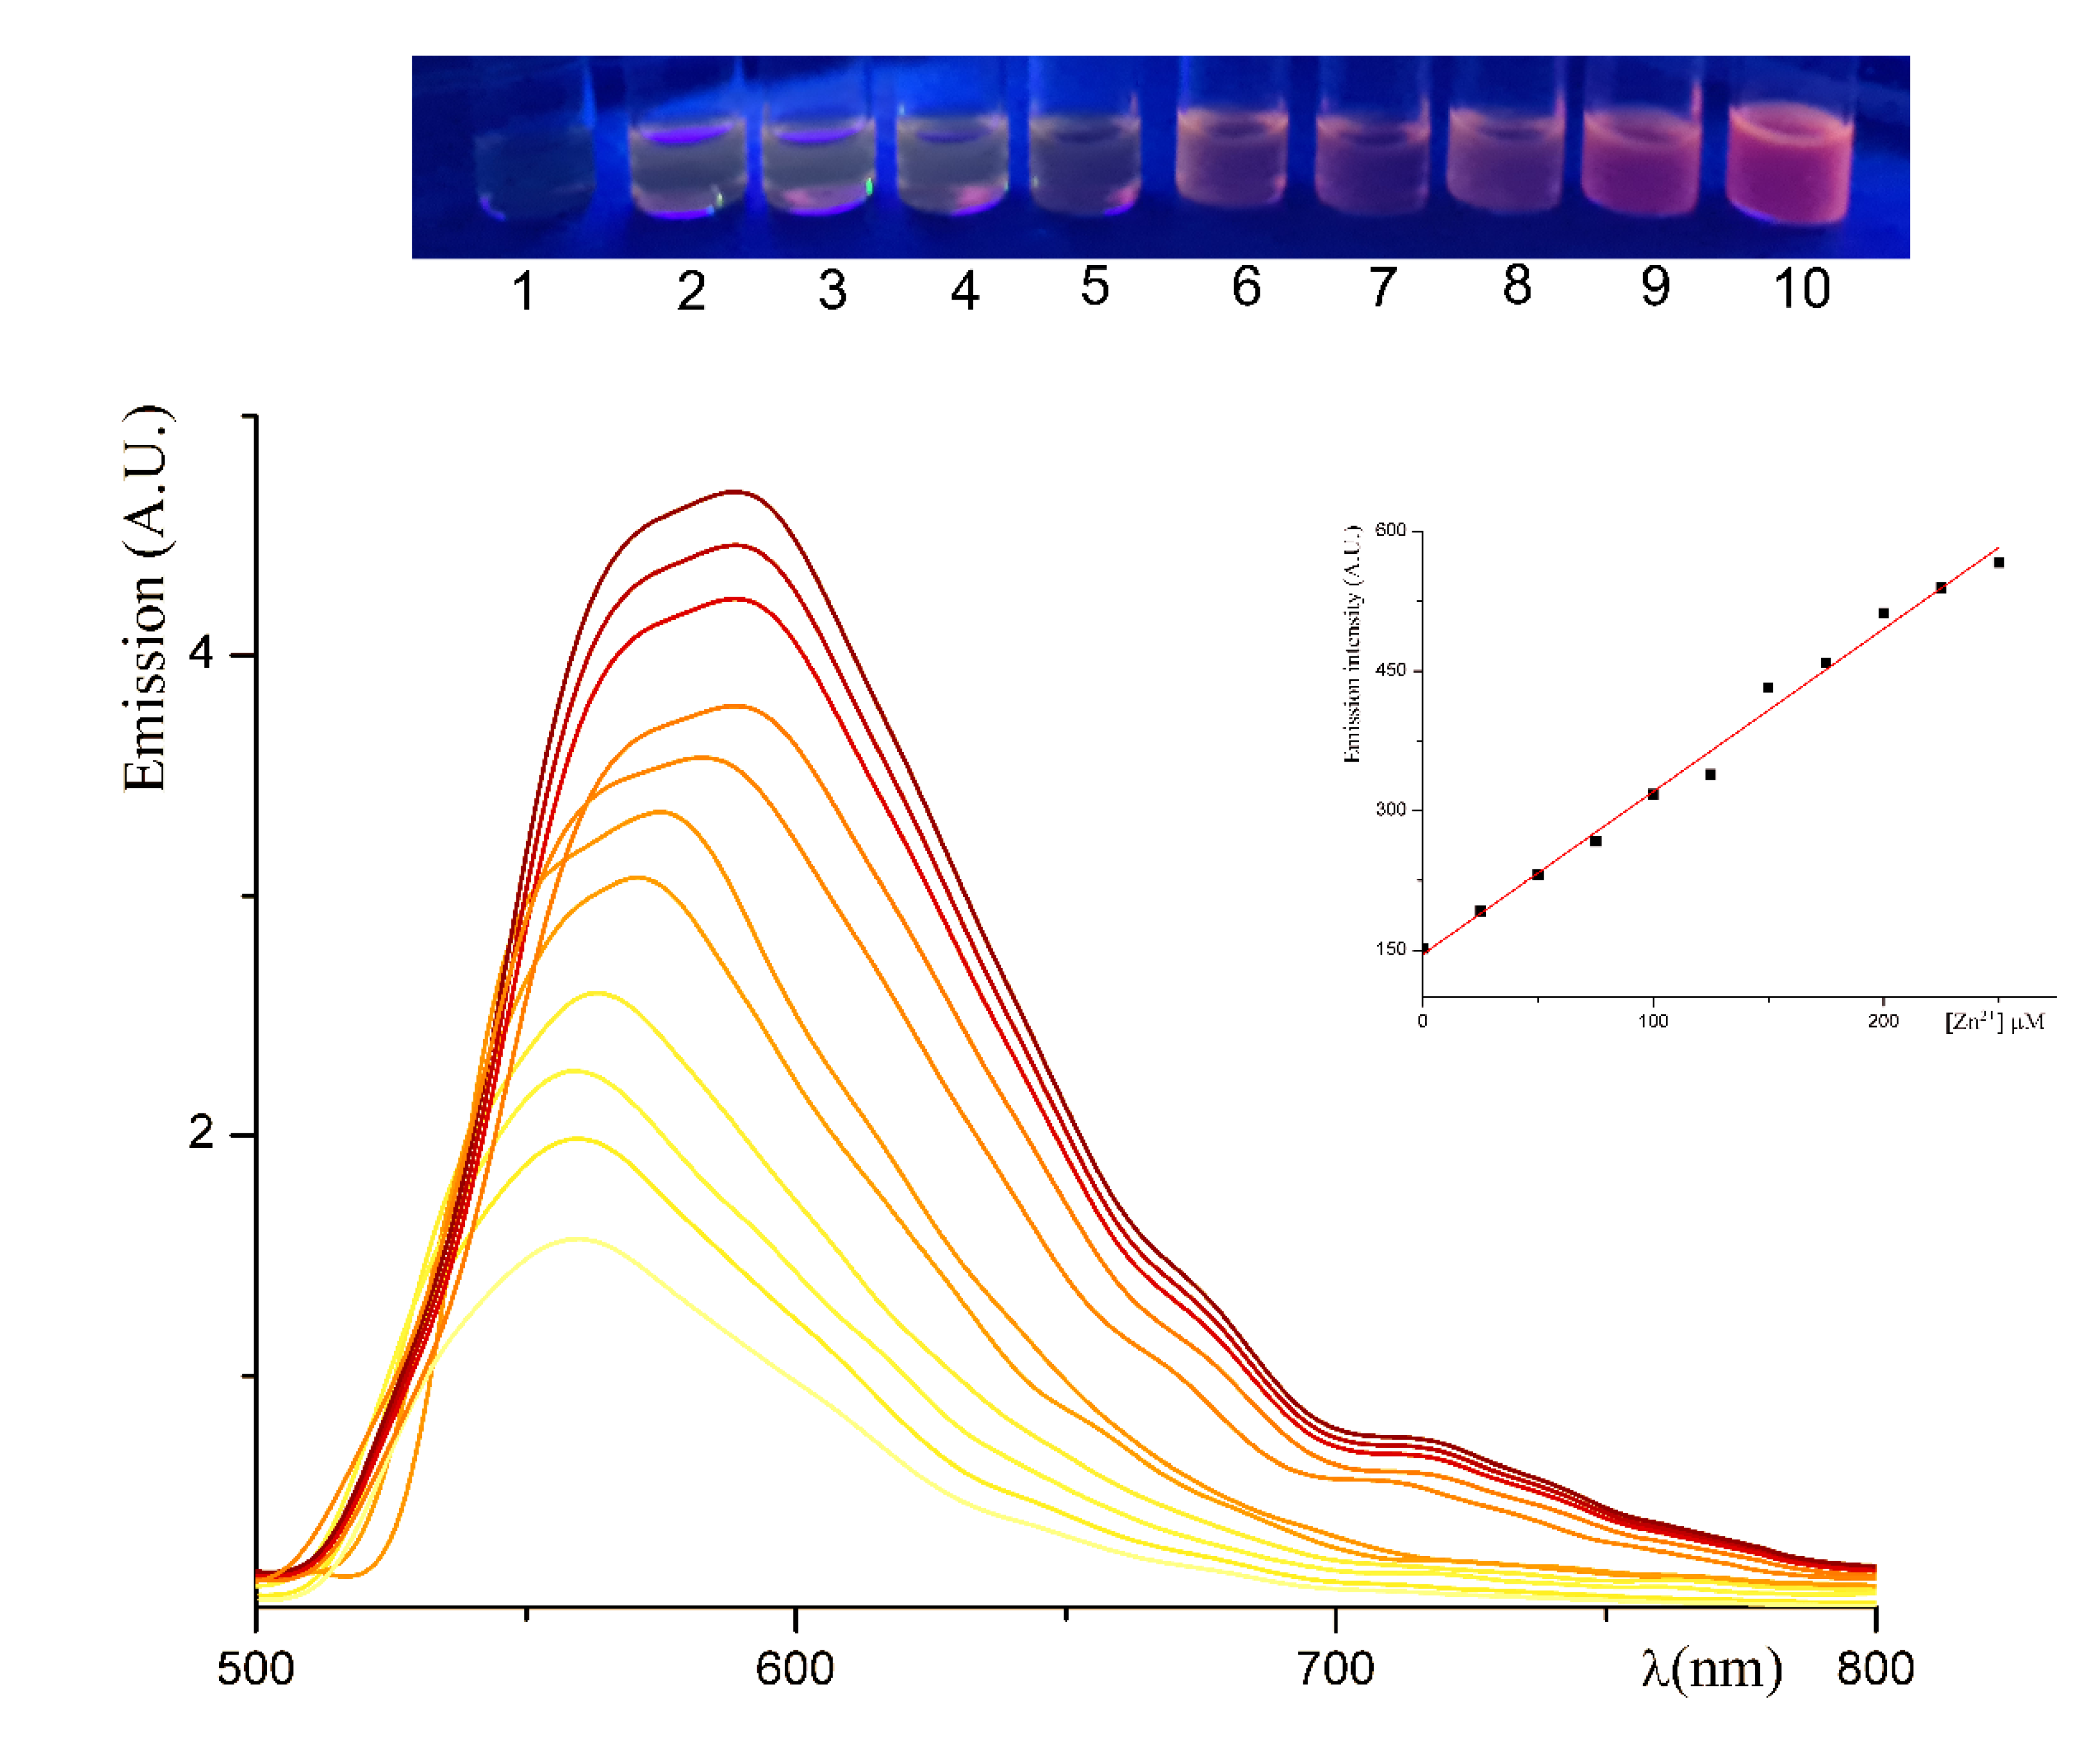
3.3. Responsiveness of the AIE Probe L to Zinc (II) Cation
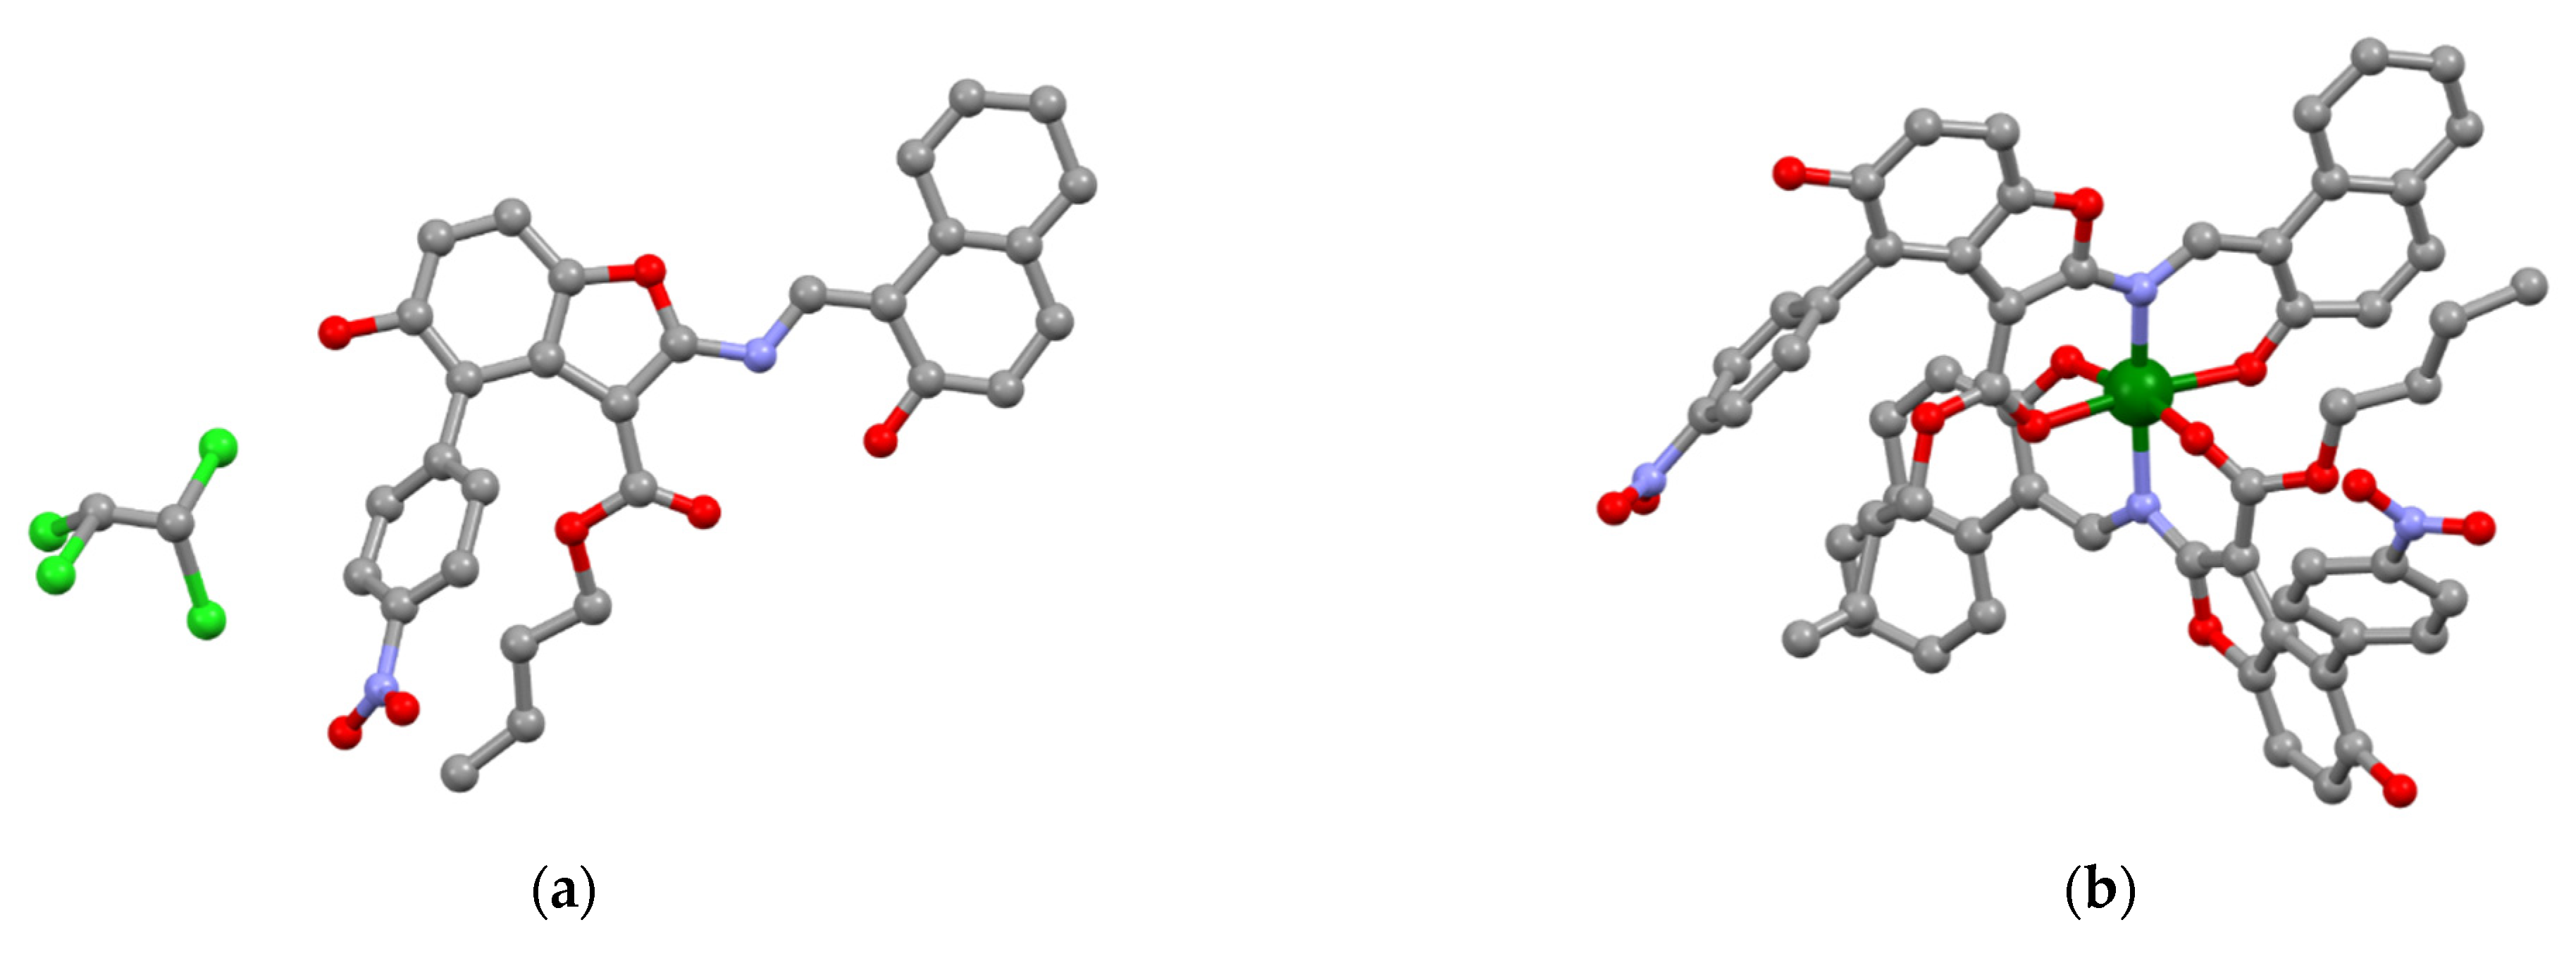
3.4. X-ray Structural Characterization of L and L2Zn Complex
3.5. DFT Analysis of L and L2Zn
4. Conclusions
Supplementary Materials
Author Contributions
Funding
Institutional Review Board Statement
Informed Consent Statement
Data Availability Statement
Conflicts of Interest
Sample Availability
References
- Guo, Z.; Park, S.; Yoon, J.; Shin, I. Recent progress in the development of near-infrared fluorescent probes for bioimaging applications. Chem. Soc. Rev. 2014, 43, 16–29. [Google Scholar] [CrossRef] [PubMed]
- Qian, J.; Tang, B.Z. AIE Luminogens for Bioimaging and Theranostics: From Organelles to Animals. Chem 2017, 3, 56–91. [Google Scholar] [CrossRef] [Green Version]
- Yang, Q.; Ma, Z.; Wang, H.; Zhou, B.; Zhu, S.; Zhong, Y.; Wang, J.; Wan, H.; Antaris, A.; Ma, R.; et al. Rational Design of Molecular Fluorophores for Biological Imaging in the NIR-II Window. Adv. Mater. 2017, 29, 1605497. [Google Scholar] [CrossRef]
- Englman, R.; Jortner, J. The energy gap law for radiationless transitions in large molecules. J. Mol. Phys. 1970, 18, 145–164. [Google Scholar] [CrossRef]
- Bixon, M.; Jortner, J.; Cortes, J.; Heitele, H.; Michel-Beyerle, M.E. Energy gap law for nonradiative and radiative charge transfer in isolated and in solvated supermolecules. J. Phys. Chem. 1994, 98, 7289–7299. [Google Scholar] [CrossRef]
- Alam, P.; Leung, N.L.C.; Zhang, J.; Kwok, R.T.K.; Lam, J.W.Y.; Tang, B.Z. AIE-based luminescence probes for metal ion detection. Coord. Chem. Rev. 2021, 429, 213693. [Google Scholar] [CrossRef]
- Singh, K.; Rotaru, A.M.; Beharry, A.A. Fluorescent Chemosensors as Future Tools for Cancer Biology. ACS Chem. Biol. 2018, 13, 1785–1798. [Google Scholar] [CrossRef]
- He, L.; Dong, B.; Liu, Y.; Lin, W. Fluorescent chemosensors manipulated by dual/triple interplaying sensing mechanisms. Chem. Soc. Rev. 2016, 45, 6449–6461. [Google Scholar] [CrossRef]
- Hong, Y.; Lam, J.W.Y.; Tang, B.Z. Aggregation-induced emission: Phenomenon, mechanism and applications. Chem. Commun. 2009, 4332–4353. [Google Scholar] [CrossRef]
- Niu, Y.; Peng, Q.; Deng, C.; Gao, X.; Shuai, Z. Theory of excited state decays and optical spectra: Application to polyatomic molecules. J. Phys. Chem. A 2010, 114, 7817–7831. [Google Scholar] [CrossRef] [PubMed]
- Peng, Q.; Niu, Y.; Deng, C.; Shuai, Z. Vibration correlation function formalism of radiative and non-radiative rates for complex molecules. Chem. Phys. 2010, 370, 215–222. [Google Scholar] [CrossRef]
- Shuai, Z.; Peng, Q. Excited states structure and processes: Understanding organic light-emitting diodes at the molecular level. Phys. Rep. 2014, 537, 123–156. [Google Scholar] [CrossRef]
- Li, K.; Liu, Y.; Li, Y.; Feng, Q.; Hou, H.; Tang, B.Z. 2,5-bis(4-alkoxycarbonylphenyl)-1,4-diaryl-1,4-dihydropyrrolo[3,2-b]pyrrole (AAPP) AIEgens: Tunable RIR and TICT characteristics and their multifunctional applications. Chem. Sci. 2017, 8, 7258–7267. [Google Scholar] [CrossRef] [PubMed] [Green Version]
- Wen, X.; Wang, Q.; Fan, Z. An active fluorescent probe based on aggregation-induced emission for intracellular bioimaging of Zn2+ and tracking of interactions with single-stranded DNA. Anal. Chim. Acta 2018, 1013, 79–86. [Google Scholar] [CrossRef] [PubMed]
- Roy, E.; Nagar, A.; Chaudhary, S.; Pal, S. Advanced Properties and Applications of AIEgens-Inspired Smart Materials. Ind. Eng. Chem. Res. 2020, 59, 10721–10736. [Google Scholar] [CrossRef]
- Zhao, Z.; Zhang, H.; Lam, J.W.Y.; Tang, B.Z. Aggregation-Induced Emission: New Vistas at the Aggregate Level. Angew. Chem.-Int. Ed. 2020, 59, 9888–9907. [Google Scholar] [CrossRef] [PubMed]
- Alam, P.; Climent, C.; Alemany, P.; Laskar, I.R. “Aggregation-induced emission” of transition metal compounds: Design, mechanistic insights, and applications. J. Photochem. Photobiol. C Photochem. Rev. 2019, 41, 100317. [Google Scholar] [CrossRef]
- Naskar, B.; Dhara, A.; Maiti, D.K.; Kukułka, M.; Mitoraj, M.P.; Srebro-Hooper, M.; Prodhan, C.; Chaudhuri, K.; Goswami, S. Aggregation-Induced Emission-Based Sensing Platform for Selective Detection of Zn2+: Experimental and Theoretical Investigations. ChemPhysChem 2019, 20, 1630–1639. [Google Scholar] [CrossRef] [PubMed]
- Chen, C.; Xu, Y.; Wan, Y.; Fan, W.; Si, Z. Aggregation-Induced Phosphorescent Emission from ReI Complexes: Synthesis and Property Studies. Eur. J. Inorg. Chem. 2016, 2016, 1340–1347. [Google Scholar] [CrossRef]
- Qin, Y.; Peng, Q.; Chen, F.; Liu, Y.; Li, K.; Zang, S. AIE Ligand Constructed Zn(II) Complex with Reversible Photo-induced Color and Emission Changes. Chem. Res. Chin. Univ. 2021, 37, 123–128. [Google Scholar] [CrossRef]
- Hu, R.; Yang, X.; Qin, A.; Tang, B.Z. AIE polymers in sensing, imaging and theranostic applications. Mater. Chem. Front. 2021, 5, 4073–4088. [Google Scholar] [CrossRef]
- Huang, M.; Yu, R.; Xu, K.; Ye, S.; Kuang, S.; Zhu, X.; Wan, Y. An arch-bridge-type fluorophore for bridging the gap between aggregation-caused quenching (ACQ) and aggregation-induced emission (AIE). Chem. Sci. 2016, 7, 4485–4491. [Google Scholar] [CrossRef] [Green Version]
- Caruso, U.; Panunzi, B.; Diana, R.; Concilio, S.; Sessa, L.; Shikler, R.; Nabha, S.; Tuzi, A.; Piotto, S. AIE/ACQ effects in two DR/NIR emitters: A structural and DFT comparative analysis. Molecules 2018, 23, 1947. [Google Scholar] [CrossRef] [PubMed] [Green Version]
- Tateno, K.; Ogawa, R.; Sakamoto, R.; Tsuchiya, M.; Otani, T.; Saito, T. Acid-responsive fluorescent compounds based on nitro-group-substituted L-shaped pentacycles, pyrrolo[1,2-a][1,8]naphthylidines. Org. Lett. 2014, 16, 3212–3215. [Google Scholar] [CrossRef] [PubMed]
- Diana, R.; Caruso, U.; Di Costanzo, L.; Bakayoko, G.; Panunzi, B. A novel DR/NIR T-shaped aiegen: Synthesis and x-ray crystal structure study. Crystals 2020, 10, 269. [Google Scholar] [CrossRef] [Green Version]
- Zheng, M.; Sun, M.; Zhang, D.; Liu, T.; Xue, S.; Yang, W. Fluorescence response of pyridinyl- and/or dibutylaniline-Capped 2,6,9,10-Tetravinylanthracenes to metal ions. Dye. Pigment. 2014, 101, 109–115. [Google Scholar] [CrossRef]
- Oh, J.W.; Kim, T.H.; Yoo, S.W.; Lee, Y.O.; Lee, Y.; Kim, H.; Kim, J.; Kim, J.S. Multisignaling metal sensor: Optical, electrochemical, and electrochemiluminescent responses of cruciform-shaped alkynylpyrene for selective recognition of Fe3+. Sens. Actuators B Chem. 2013, 177, 813–817. [Google Scholar] [CrossRef]
- Ekbote, A.; Jadhav, T.; Misra, R. T-Shaped donor-acceptor-donor type tetraphenylethylene substituted quinoxaline derivatives: Aggregation-induced emission and mechanochromism. New J. Chem. 2017, 41, 9346–9353. [Google Scholar] [CrossRef]
- Grabowski, Z.R.; Rotkiewicz, K.; Rettig, W. Structural Changes Accompanying Intramolecular Electron Transfer: Focus on Twisted Intramolecular Charge-Transfer States and Structures. Chem. Rev. 2003, 103, 3899–4031. [Google Scholar] [CrossRef] [PubMed]
- Kanibolotsky, A.L.; Forgie, J.C.; McEntee, G.J.; Talpur, M.M.A.; Skabara, P.J.; Westeate, T.D.J.; McDouall, J.J.W.; Auinge, M.; Coles, S.J.; Hursthouse, M.B. Controlling the conformational changes in donor-acceptor [4]dendralenes through intramolecular charge-transfer processes. Chem. -A Eur. J. 2009, 15, 11581–11593. [Google Scholar] [CrossRef] [PubMed] [Green Version]
- Kwok, R.T.K.; Leung, C.W.T.; Lam, J.W.Y.; Tang, B.Z. Biosensing by luminogens with aggregation-induced emission characteristics. Chem. Soc. Rev. 2015, 44, 4228–4238. [Google Scholar] [CrossRef] [PubMed]
- Panunzi, B.; Diana, R.; Caruso, U. A highly efficient white luminescent zinc (II) based metallopolymer by RGB approach. Polymers 2019, 11, 1712. [Google Scholar] [CrossRef] [PubMed] [Green Version]
- Castellano, F.N.; Pomestchenko, I.E.; Shikhova, E.; Hua, F.; Muro, M.L.; Rajapakse, N. Photophysics in bipyridyl and terpyridyl platinum(II) acetylides. Coord. Chem. Rev. 2006, 250, 1819–1828. [Google Scholar] [CrossRef]
- Caruso, U.; Panunzi, B.; Roviello, A.; Tuzi, A. Fluorescent metallopolymers with Zn(II) in a Schiff base/phenoxide coordination environment. Inorg. Chem. Commun. 2013, 29, 138–140. [Google Scholar] [CrossRef]
- Lamansky, S.; Djurovich, P.; Murphy, D.; Abdel-Razzaq, F.; Lee, H.E.; Adachi, C.; Burrows, P.E.; Forrest, S.R.; Thompson, M.E. Highly phosphorescent bis-cyclometalated iridium complexes: Synthesis, photophysical characterization, and use in organic light emitting diodes. J. Am. Chem. Soc. 2001, 123, 4304–4312. [Google Scholar] [CrossRef] [PubMed]
- Borbone, F.; Caruso, U.; Palma, S.D.; Fusco, S.; Nabha, S.; Panunzi, B.; Shikler, R. High solid state photoluminescence quantum yields and effective color tuning in polyvinylpyridine based zinc(II) metallopolymers. Macromol. Chem. Phys. 2015, 216, 1516–1522. [Google Scholar] [CrossRef]
- You, Y.; Nam, W. Photofunctional triplet excited states of cyclometalated Ir(iii) complexes: Beyond electroluminescence. Chem. Soc. Rev. 2012, 41, 7061–7084. [Google Scholar] [CrossRef]
- Caruso, U.; Panunzi, B.; Roviello, A.; Tingoli, M.; Tuzi, A. Two aminobenzothiazole derivatives for Pd(II) and Zn(II) coordination: Synthesis, characterization and solid state fluorescence. Inorg. Chem. Commun. 2011, 14, 46–48. [Google Scholar] [CrossRef]
- Diana, R.; Panunzi, B. Zinc (Ii) and aiegens: The “clip approach” for a novel fluorophore family. A review. Molecules 2021, 26, 4176. [Google Scholar] [CrossRef]
- Mei, J.; Leung, N.L.C.; Kwok, R.T.K.; Lam, J.W.Y.; Tang, B.Z. Aggregation-Induced Emission: Together We Shine, United We Soar! Chem. Rev. 2015, 115, 11718–11940. [Google Scholar] [CrossRef]
- Wei, Y.; Wang, L.; Huang, J.; Zhao, J.; Yan, Y. Multifunctional Metallo-Organic Vesicles Displaying Aggregation-Induced Emission: Two-Photon Cell-Imaging, Drug Delivery, and Specific Detection of Zinc Ion. ACS Appl. Nano Mater. 2018, 1, 1819–1827. [Google Scholar] [CrossRef]
- Diana, R.; Panunzi, B. The role of zinc(II) ion in fluorescence tuning of tridentate pincers: A review. Molecules 2020, 25, 4984. [Google Scholar] [CrossRef]
- Leung, N.L.C.; Xie, N.; Yuan, W.; Liu, Y.; Wu, Q.; Peng, Q.; Miao, Q.; Lam, J.W.Y.; Tang, B.Z. Restriction of intramolecular motions: The general mechanism behind aggregation-induced emission. Chem. -A Eur. J. 2014, 20, 15349–15353. [Google Scholar] [CrossRef] [PubMed]
- Diana, R.; Panunzi, B.; Shikler, R.; Nabha, S.; Caruso, U. Highly efficient dicyano-phenylenevinylene fluorophore as polymer dopant or zinc-driven self-assembling building block. Inorg. Chem. Commun. 2019, 104, 145–149. [Google Scholar] [CrossRef]
- Wan, Q.; Tong, J.; Zhang, B.; Li, Y.; Wang, Z.; Tang, B.Z. Exploration of High Efficiency AIE-Active Deep/Near-Infrared Red Emitters in OLEDs with High-Radiance. Adv. Opt. Mater. 2020, 8, 1901520. [Google Scholar] [CrossRef]
- Yang, W.; Liu, C.; Gao, Q.; Du, J.; Shen, P.; Liu, Y.; Yang, C. A morphology and size-dependent ON-OFF switchable NIR-emitting naphthothiazolium cyanine dye: AIE-active CIEE effect. Opt. Mater. 2017, 66, 623–629. [Google Scholar] [CrossRef]
- Carella, A.; Roviello, V.; Iannitti, R.; Palumbo, R.; La Manna, S.; Marasco, D.; Trifuoggi, M.; Diana, R.; Roviello, G.N. Evaluating the biological properties of synthetic 4-nitrophenyl functionalized benzofuran derivatives with telomeric DNA binding and antiproliferative activities. Int. J. Biol. Macromol. 2019, 121, 77–88. [Google Scholar] [CrossRef]
- Caruso, U.; Panunzi, B.; Roviello, G.N.; Roviello, G.; Tingoli, M.; Tuzi, A. Synthesis, structure and reactivity of amino-benzodifurane derivatives. Comptes Rendus Chim. 2009, 12, 622–634. [Google Scholar] [CrossRef]
- Caruso, U.; Diana, R.; Tuzi, A.; Panunzi, B. Novel solid-state emissive polymers and polymeric blends from a T-Shaped benzodifuran scaffold: A comparative study. Polymers 2020, 12, 718. [Google Scholar] [CrossRef] [PubMed] [Green Version]
- Diana, R.; Panunzi, B.; Shikler, R.; Nabha, S.; Caruso, U. A symmetrical azo-based fluorophore and the derived salen multipurpose framework for emissive layers. Inorg. Chem. Commun. 2019, 104, 186–189. [Google Scholar] [CrossRef]
- Reshma, R.; Selwin Joseyphus, R.; Arish, D.; Reshmi Jaya, R.J.; Johnson, J. Tridentate imidazole-based Schiff base metal complexes: Molecular docking, structural and biological studies. J. Biomol. Struct. Dyn. 2021. [Google Scholar] [CrossRef] [PubMed]
- Jayendran, M.; Begum, P.M.S.; Kurup, M.R.P. Structural, spectral and biological investigations on Cu(II) and Zn(II) complexes derived from NNO donor tridentate Schiff base: Crystal structure of a 1D Cu(II) coordination polymer. J. Mol. Struct. 2020, 1206, 127682. [Google Scholar] [CrossRef]
- Borbone, F.; Caruso, U.; Causà, M.; Fusco, S.; Panunzi, B.; Roviello, A.; Shikler, R.; Tuzi, A. Series of O,N,O-tridentate ligands zinc(II) complexes with high solid-state photoluminescence quantum yield. Eur. J. Inorg. Chem. 2014, 16, 2695–2703. [Google Scholar] [CrossRef]
- Kabsch, W. Integration, scaling, space-group assignment and post-refinement. Acta Crystallogr. Sect. D Biol. Crystallogr. 2010, 66, 133–144. [Google Scholar] [CrossRef] [PubMed] [Green Version]
- Burla, M.C.; Carrozzini, B.; Cascarano, G.L.; Giacovazzo, C.; Polidori, G. Solving proteins at non-atomic resolution by direct methods. J. Appl. Crystallogr. 2015, 48, 1692–1698. [Google Scholar] [CrossRef]
- Sheldrick, G.M. A short history of SHELX. Acta Crystallogr. Sect. A Found. Crystallogr. 2008, 64, 112–122. [Google Scholar] [CrossRef] [PubMed] [Green Version]
- Farrugia, L.J. WinGX and ORTEP for Windows: An update. J. Appl. Crystallogr. 2012, 45, 849–854. [Google Scholar] [CrossRef]
- MacRae, C.F.; Sovago, I.; Cottrell, S.J.; Galek, P.T.A.; McCabe, P.; Pidcock, E.; Platings, M.; Shields, G.P.; Stevens, J.S.; Towler, M.; et al. Mercury 4.0: From visualization to analysis, design and prediction. J. Appl. Crystallogr. 2020, 53, 226–235. [Google Scholar] [CrossRef] [PubMed] [Green Version]
- Dovesi, R.; Pascale, F.; Civalleri, B.; Doll, K.; Harrison, N.M.; Bush, I.; D’Arco, P.; Noel, Y.; Rera, M.; Carbonniere, P.; et al. The CRYSTAL code, 1976-2020 and beyond, a long story. J. Chem. Phys. 2020, 152, 204111. [Google Scholar] [CrossRef]
- Becke, A.D. Density-functional thermochemistry. III. The role of exact exchange. J. Chem. Phys. 1993, 98, 5648–5652. [Google Scholar] [CrossRef] [Green Version]
- Lee, C.; Yang, W.; Parr, R.G. Development of the Colle-Salvetti correlation-energy formula into a functional of the electron density. Phys. Rev. B 1988, 37, 785–789. [Google Scholar] [CrossRef] [Green Version]
- Grimme, S.; Antony, J.; Ehrlich, S.; Krieg, H. A consistent and accurate ab initio parametrization of density functional dispersion correction (DFT-D) for the 94 elements H-Pu. J. Chem. Phys. 2010, 132, 154104. [Google Scholar] [CrossRef] [Green Version]
- Vilela Oliveira, D.; Laun, J.; Peintinger, M.F.; Bredow, T. BSSE-correction scheme for consistent gaussian basis sets of double- and triple-zeta valence with polarization quality for solid-state calculations. J. Comput. Chem. 2019, 40, 2364–2376. [Google Scholar] [CrossRef] [PubMed]
- Weigend, F.; Ahlrichs, R. Balanced basis sets of split valence, triple zeta valence and quadruple zeta valence quality for H to Rn: Design and assessment of accuracy. Phys. Chem. Chem. Phys. 2005, 7, 3297–3305. [Google Scholar] [CrossRef] [PubMed]
- Gentile, F.S.; Pannico, M.; Causà, M.; Mensitieri, G.; Di Palma, G.; Scherillo, G.; Musto, P. Metal defects in HKUST-1 MOF revealed by vibrational spectroscopy: A combined quantum mechanical and experimental study. J. Mater. Chem. A 2020, 8, 10796–10812. [Google Scholar] [CrossRef]
- Bhalla, V.; Arora, H.; Kumar, M. Aggregates of a triphenylene based chemosensing ensemble for sensitive detection of cyanide ions in an aqueous medium. Dalton Trans. 2013, 42, 4450–4455. [Google Scholar] [CrossRef]
- Xu, H.; Chen, W.; Zhang, W.; Ju, L.; Lu, H. A selective purine-based fluorescent chemosensor for the “naked-eye” detection of zinc ions (Zn2+): Applications in live cell imaging and test strips. New J. Chem. 2020, 44, 15195–15201. [Google Scholar] [CrossRef]
- Jang, H.J.; Kang, J.H.; Lee, M.; Lim, M.H.; Kim, C. Fluorescent Sensor for Sequentially Monitoring Zinc(II) and Cyanide Anion in Near-Perfect Aqueous Media. Ind. Eng. Chem. Res. 2018, 57, 54–62. [Google Scholar] [CrossRef]
- Xie, Y.-Z.; Shan, G.-G.; Li, P.; Zhou, Z.-Y.; Su, Z.-M. A novel class of Zn(II) Schiff base complexes with aggregation-induced emission enhancement (AIEE) properties: Synthesis, characterization and photophysical/electrochemical properties. Dye. Pigment. 2013, 96, 467–474. [Google Scholar] [CrossRef]
- Pan, Y.; Wang, J.; Guo, X.; Liu, X.; Tang, X.; Zhang, H. A new three-dimensional zinc-based metal-organic framework as a fluorescent sensor for detection of cadmium ion and nitrobenzene. J. Colloid Interface Sci. 2018, 513, 418–426. [Google Scholar] [CrossRef] [PubMed]
- Diana, R.; Panunzi, B.; Tuzi, A.; Piotto, S.; Concilio, S.; Caruso, U. An amphiphilic pyridinoyl-hydrazone probe for colorimetric and fluorescence pH sensing. Molecules 2019, 24, 3833. [Google Scholar] [CrossRef] [PubMed] [Green Version]
- Zhang, G.; Chen, Q.; Zhang, Y.; Kong, L.; Tao, X.; Lu, H.; Tian, Y.; Yang, J. Bulky group functionalized porphyrin and its Zn (II) complex with high emission in aggregation. Inorg. Chem. Commun. 2014, 46, 85–88. [Google Scholar] [CrossRef]
- Diana, R.; Panunzi, B.; Concilio, S.; Marrafino, F.; Shikler, R.; Caruso, T.; Caruso, U. The effect of bulky substituents on two π-conjugated mesogenic fluorophores. Their organic polymers and zinc-bridged luminescent networks. Polymers 2019, 11, 1379. [Google Scholar] [CrossRef] [PubMed] [Green Version]
- Chao, D.; Ni, S. Nanomolar pyrophosphate detection and nucleus staining in living cells with simple terpyridine-Zn(II) complexes. Sci. Rep. 2016, 6, 26477. [Google Scholar] [CrossRef] [PubMed] [Green Version]
- Diana, R.; Panunzi, B.; Tuzi, A.; Caruso, U. Two tridentate pyridinyl-hydrazone zinc(II) complexes as fluorophores for blue emitting layers. J. Mol. Struct. 2019, 1197, 672–680. [Google Scholar] [CrossRef]
- Yan, Y.; Yin, G.Q.; Khalife, S.; He, Z.H.; Xu, C.; Li, X. Self-assembly of emissive metallocycles with tetraphenylethylene, BODIPY and terpyridine in one system. Supramol. Chem. 2019, 31, 597–605. [Google Scholar] [CrossRef] [PubMed]
- Zou, Y.; Huang, S.; Liao, Y.; Zhu, X.; Chen, Y.; Chen, L.; Liu, F.; Hu, X.; Tu, H.; Zhang, L.; et al. Isotopic graphene-isolated-Au-nanocrystals with cellular Raman-silent signals for cancer cell pattern recognition. Chem. Sci. 2018, 9, 2842–2849. [Google Scholar] [CrossRef] [Green Version]
- Wang, W.J.; Hao, L.; Chen, C.Y.; Qiu, Q.M.; Wang, K.; Song, J.B.; Li, H. Red-shift in fluorescence emission of D-A type asymmetrical Zn(II) complexes by extending the π-π stacking interaction. RSC Adv. 2017, 7, 20488–20493. [Google Scholar] [CrossRef] [Green Version]
- Huang, Q.; Cheng, J.; Tang, Y.; Wu, Y.; Xia, D.; Zheng, Y.; Guo, M. Significantly Red-Shifted Emissions of Nonconventional AIE Polymers Containing Zwitterionic Components. Macromol. Rapid Commun. 2021, 42, 2100174. [Google Scholar] [CrossRef] [PubMed]
- Guo, Z.; Shao, A.; Zhu, W.-H. Long wavelength AIEgen of quinoline-malononitrile. J. Mater. Chem. C 2016, 4, 2640–2646. [Google Scholar] [CrossRef]
- Qin, J.-c.; Wang, B.-d.; Yang, Z.-y.; Yu, K.-c. A ratiometric fluorescent chemosensor for Zn2+ in aqueous solution through an ESIPT coupled AIE process. Sens. Actuators B Chem. 2016, 224, 892–898. [Google Scholar] [CrossRef]
- Dong, Y.-J.; Meng, Z.; Ho, C.-L.; Wong, W.-Y. A novel “turn-on” dipyrrin-type fluorescent detector of Zn2+ based on tetraphenylethene. Tetrahedron 2017, 73, 3305–3309. [Google Scholar] [CrossRef]
- Wen, X.; Wang, Q.; Fan, Z. Highly selective turn-on fluorogenic chemosensor for Zn(II) detection based on aggregation-induced emission. J. Lumin. 2018, 194, 366–373. [Google Scholar] [CrossRef]
- Liang, Z.-Q.; Zou, Z.-Y.; Ping, D.; Ye, C.-Q.; Chen, S.-R.; Zhao, X.-J.; Chen, J.-H.; Wang, X.-M.; Tao, X.-T. Tailoring the sensing behaviors to Zn2+ and AIEE properties of phenanthroline derivatives through isomer engineering. Dye. Pigment. 2018, 150, 382–389. [Google Scholar] [CrossRef]
- Xu, B.; Chi, Z.; Zhang, X.; Li, H.; Chen, C.; Liu, S.; Zhang, Y.; Xu, J. A new ligand and its complex with multi-stimuli-responsive and aggregation-induced emission effects. Chem. Commun. 2011, 47, 11080–11082. [Google Scholar] [CrossRef] [PubMed]
- Wan, J.; Zhang, W.; Guo, H.; Liang, J.; Huang, D.; Xiao, H. Two spirobifluorene-based fluorescent probes with aggregation-induced emission properties: Synthesis and application in the detection of Zn2+ and cell imaging. J. Mater. Chem. C 2019, 7, 2240–2249. [Google Scholar] [CrossRef]
- Gabr, M.T.; Pigge, F.C. A selective fluorescent sensor for Zn2+ based on aggregation-induced emission (AIE) activity and metal chelating ability of bis(2-pyridyl)diphenylethylene. Dalton Trans. 2016, 45, 14039–14043. [Google Scholar] [CrossRef] [PubMed]
- Pramanik, S.; Bhalla, V.; Kumar, M. Hexaphenylbenzene-based fluorescent aggregates for detection of zinc and pyrophosphate ions in aqueous media: Tunable self-assembly behaviour and construction of a logic device. New J. Chem. 2017, 41, 4806–4813. [Google Scholar] [CrossRef]
- Feng, G.; Zhang, C.-J.; Lu, X.; Liu, B. Zinc(II)-Tetradentate-Coordinated Probe with Aggregation-Induced Emission Characteristics for Selective Imaging and Photoinactivation of Bacteria. ACS Omega 2017, 2, 546–553. [Google Scholar] [CrossRef]
- Park, C.; Hong, J.-I. A new fluorescent sensor for the detection of pyrophosphate based on a tetraphenylethylene moiety. Tetrahedron Lett. 2010, 51, 1960–1962. [Google Scholar] [CrossRef]
- Musib, D.; Reena Devi, L.; Raza, M.K.; Binita Chanu, S.; Roy, M. A New Thiophene-based Aggregation-induced Emission Chemosensor for Selective Detection of Zn2+ Ions and Its Turn off. Chem. Lett. 2020, 49, 473–476. [Google Scholar] [CrossRef]
- Singhal, D.; Althagafi, I.; Kumar, A.; Yadav, S.; Prasad, A.K.; Pratap, R. Thieno[3,2-c]pyran: An ESIPT based fluorescence “turn-on” molecular chemosensor with AIE properties for the selective recognition of Zn2+ ion. New J. Chem. 2020, 44, 12019–12026. [Google Scholar] [CrossRef]
- Pasha, S.S.; Yadav, H.R.; Choudhury, A.R.; Laskar, I.R. Synthesis of an aggregation-induced emission (AIE) active salicylaldehyde based Schiff base: Study of mechanoluminescence and sensitive Zn(ii) sensing. J. Mater. Chem. C 2017, 5, 9651–9658. [Google Scholar] [CrossRef]
- Li, Y.; Yu, H.; Shao, G.; Gan, F. A tetraphenylethylene-based “turn on” fluorescent sensor for the rapid detection of Ag+ ions with high selectivity. J. Photochem. Photobiol. A Chem. 2015, 301, 14–19. [Google Scholar] [CrossRef]
- Xie, S.; Wong, A.Y.H.; Kwok, R.T.K.; Li, Y.; Su, H.; Lam, J.W.Y.; Chen, S.; Tang, B.Z. Fluorogenic Ag+–Tetrazolate Aggregation Enables Efficient Fluorescent Biological Silver Staining. Angew. Chem.-Int. Ed. 2018, 57, 5750–5753. [Google Scholar] [CrossRef] [PubMed] [Green Version]
- Wang, N.; Zhang, J.; Xu, X.-D.; Feng, S. Turn-on fluorescence in a pyridine-decorated tetraphenylethylene: The cooperative effect of coordination-driven rigidification and silver ion induced aggregation. Dalton Trans. 2020, 49, 1883–1890. [Google Scholar] [CrossRef] [PubMed]
- Borbone, F.; Caruso, U.; Concilio, S.; Nabha, S.; Piotto, S.; Shikler, R.; Tuzi, A.; Panunzi, B. From cadmium(II)-aroylhydrazone complexes to metallopolymers with enhanced photoluminescence. A structural and DFT study. Inorganica Chimica Acta 2017, 458, 129–137. [Google Scholar] [CrossRef]
- Panunzi, B.; Diana, R.; Concilio, S.; Sessa, L.; Tuzi, A.; Piotto, S.; Caruso, U. Fluorescence pH-dependent sensing of Zn(II)by a tripodal ligand. A comparative X-ray and DFT study. J. Lumin. 2019, 212, 200–206. [Google Scholar] [CrossRef]
- Gui, S.; Huang, Y.; Hu, F.; Jin, Y.; Zhang, G.; Yan, L.; Zhang, D.; Zhao, R. Fluorescence Turn-On Chemosensor for Highly Selective and Sensitive Detection and Bioimaging of Al3+ in Living Cells Based on Ion-Induced Aggregation. Anal. Chem. 2015, 87, 1470–1474. [Google Scholar] [CrossRef] [PubMed]
- Diana, R.; Caruso, U.; Concilio, S.; Piotto, S.; Tuzi, A.; Panunzi, B. A real-time tripodal colorimetric/fluorescence sensor for multiple target metal ions. Dye. Pigment. 2018, 155, 249–257. [Google Scholar] [CrossRef]
- Shyamal, M.; Mazumdar, P.; Maity, S.; Samanta, S.; Sahoo, G.P.; Misra, A. Highly Selective Turn-On Fluorogenic Chemosensor for Robust Quantification of Zn(II) Based on Aggregation Induced Emission Enhancement Feature. ACS Sens. 2016, 1, 739–747. [Google Scholar] [CrossRef]


| Sample | λab (a) | ε·103 | λem (b) | λab (c) | λem (d) | PLQY% (e) | CIE (f) |
|---|---|---|---|---|---|---|---|
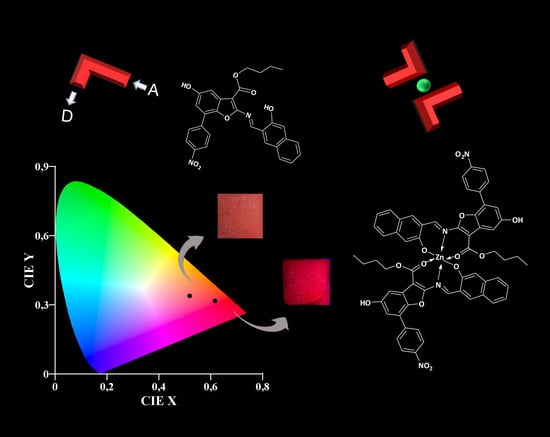
| L | 457 | 32.1 | 533 | 468 | 607 | 7.5 | 0.52; 0.34 |
| L2Zn | 477 | 32.9 | 578 | 500 | 661 | 22 | 0.62; 0.32 |
| L | L2Zn | |
|---|---|---|
| CCDC number | 2123894 | 2120416 |
| Asymmetric unit content | L⋅C2H2Cl4 | L2Zn |
| Color | Red | Dark-red |
| Temperature (K) | 100 | 100 |
| Wavelength (Å) | 0.7000 | 0.7000 |
| Crystal system | Monoclinic | Monoclinic |
| Space group | P 21 | P 21/n |
| a (Å) | 6.128 (1) | 15.987 (3) |
| b (Å) | 16.358 (3) | 15.202 (3) |
| c (Å) | 14.990 (3) | 22.151 (4) |
| β (°) | 92.52 (3) | 108.36 (3) |
| Theta range (°) | 18.67–1.34 | 26.02–1.36 |
| R-merge | 0.105 | 0.049 |
| I/s (I) | 4.44/1.96 | 11.6/4.14 |
| Completeness (%) | 94.6/96.2 | 94.3/91.5 |
| Mosaicity (°) | 0.24 | 0.21 |
| Volume (Å3) | 1501.2 | 5109.4 |
| Z | 2 | 4 |
| Calculated density (g/cm3) | 1.53 | 1.44 |
| Data/restraints/parameters | 2274/331/410 | 9951/0/715 |
| R1 indices (I > 2s(I)) | 0.0999 (0.1582, all data) | 0.0591 (0.0881, all data) |
| wR2 | 0.2468 (0.2921, all data) | 0.1631 (0.1867, all data) |
| F(000) | 712 | 2304 |
| Largest diff. peak and hole | 0.58 and −0.38 e−/Å3 | 1.47 and −0.49 e−/Å3 |
| Goodness-of-fit on F2 | 1.02 | 1.03 |
Publisher’s Note: MDPI stays neutral with regard to jurisdictional claims in published maps and institutional affiliations. |
© 2021 by the authors. Licensee MDPI, Basel, Switzerland. This article is an open access article distributed under the terms and conditions of the Creative Commons Attribution (CC BY) license (https://creativecommons.org/licenses/by/4.0/).
Share and Cite
Diana, R.; Caruso, U.; Gentile, F.S.; Di Costanzo, L.; Panunzi, B. A Novel L-Shaped Fluorescent Probe for AIE Sensing of Zinc (II) Ion by a DR/NIR Response. Molecules 2021, 26, 7347. https://0-doi-org.brum.beds.ac.uk/10.3390/molecules26237347
Diana R, Caruso U, Gentile FS, Di Costanzo L, Panunzi B. A Novel L-Shaped Fluorescent Probe for AIE Sensing of Zinc (II) Ion by a DR/NIR Response. Molecules. 2021; 26(23):7347. https://0-doi-org.brum.beds.ac.uk/10.3390/molecules26237347
Chicago/Turabian StyleDiana, Rosita, Ugo Caruso, Francesco Silvio Gentile, Luigi Di Costanzo, and Barbara Panunzi. 2021. "A Novel L-Shaped Fluorescent Probe for AIE Sensing of Zinc (II) Ion by a DR/NIR Response" Molecules 26, no. 23: 7347. https://0-doi-org.brum.beds.ac.uk/10.3390/molecules26237347