Article

Rosa platyacantha Schrenk from Kazakhstan—Natural Source of Bioactive Compounds with Cosmetic Significance

by
Askhat Sabitov
1,†,
Katarzyna Gaweł-Bęben
2,*,†,
Zuriyadda Sakipova
1,
Marcelina Strzępek-Gomółka
2,
Uliana Hoian
2,
Elmira Satbayeva
1,
Kazimierz Głowniak
2 and
Agnieszka Ludwiczuk
3
1
Department of Pharmaceutical Technology, Asfendiyarov Kazakh National Medical University, 94 Tole bi Str., Almaty 050012, Kazakhstan
2
Department of Cosmetology, The University of Information Technology and Management in Rzeszow, Sucharskiego 2, 35-225 Rzeszów, Poland
3
Independent Laboratory of Natural Products Chemistry, Department of Pharmacognosy, Medical University of Lublin, 1 Chodzki Str., 20-093 Lublin, Poland
*
Author to whom correspondence should be addressed.
These authors contributed equally to this work.
Submission received: 11 April 2021 / Revised: 26 April 2021 / Accepted: 27 April 2021 / Published: 28 April 2021
(This article belongs to the Special Issue Biological Activities of Natural Products II)

Abstract

:
Plants belonging to the Rosa genus are known for their high content of bioactive molecules and broad spectrum of healing and cosmetic activities. Rosa platyacantha Schrenk is a wild-type species abundant in the mountainous regions of Kazakhstan. The phytochemical composition as well as the bioactivity of R. platyacantha extracts have not been fully investigated to date. In this study, various parts of R. platyacantha plant, collected in Almaty region, Kazakhstan, were used to prepare five hydroalcoholic extracts (R1–R5). The extracts were compared for the content of phytochemicals and selected biological activities, which are important for the potential cosmetic application of R. platyacantha. Extract R3, prepared from flower buds, showed the most significant antioxidant and tyrosinase inhibitory potential, decreasing the monophenolase and diphenolase activities of tyrosinase. Extract R3 showed also collagenase inhibitory activity and cytotoxicity against human melanoma cells A375, being less cytotoxic for noncancerous skin keratinocytes HaCaT. Analysis of fractions E and F, obtained from R3 extracts, revealed that quercetin, kaempferol, rutin, and their derivatives are more likely responsible for the tyrosinase inhibitory properties of R. platyacantha extracts.

1. Introduction

Species belonging to genus Rosa are among one the most popular ornamental and cutter plants on the planet. Genus Rosa is composed of over 200 species; however, only around 10–15 species were used to propagate modern cultivars, making the remaining wild-type species less studied [1]. Extracts and compounds isolated from various Rosa species are widely used as traditional medicines [2,3] and explored against a variety of diseases such as skin disorders [4], hepatotoxicity [5], renal disturbances [6], diarrhea [7], arthritis [8], diabetes [9], hyperlipidaemia [10], and cancer [11]. Alcoholic extracts from different Rosa species have shown also some antiviral activity with no cytotoxic effects [12]. The anticancer effect of Rosa is explained by the rich content of antioxidants. It was shown that neutral and acidic phenols are the main components of the extract which has antiproliferative and apoptotic effect on the cancer cells [13]. Rosa extracts also could have an opposite effect and increase the cell survival; for example, extracts of R. canina contain the isoflavone phytoestrogens, which increase the survival of estrogen-dependent cancer cell lines such as breast cancer cells (MCF-7) in vitro [14]. Extracts from other Rosa sp., such as R. rugosa, contain also other active compounds affecting the epigenetics of cancer cells, inhibiting the activity of histone acetyltransferase and inducing apoptosis of prostate cancer cell lines [15].
Rosa species are also a particularly rich source of active ingredients for the cosmetic industry. R. alba, R. borboniana, R. canina, R. centifolia, R. damascena, R. davurica, R. floribunda, R. gallica, R. hybrida, R. moschata, R. multiflora, R. rubiginosa, R. rugosa, and R. spinosissima are among the species currently used in cosmetic products, possessing scientifically proven skin care activities [16]. For example, ethanolic extract from R. multiflora flowers prevents ultraviolet (UV)-induced biochemical damages, leading to photoaging by decreasing reactive oxygen species (ROS), interleukin (IL)-6, IL-8, and matrix metalloproteinase (MMP)-1 levels [17]. R. canina hip powder, containing seeds and shells, was recently shown to increase cell longevity, improve skin wrinkles, moisture, and elasticity [4]. Petal extract of R. gallica decreased the expression of solar UV-induced MMP-1, which is a hallmark of wrinkle formation [18]. Extracts and compounds isolated from R. canina, R. gallica, and R. rugosa have been extensively studied to assess their efficacy as potential skin-lightening ingredients [19,20,21]. It was found that polyphenols abundant in Rosa sp. extracts, especially quercetin, kaempferol, and ellagic acid possess in vitro inhibitory activity toward tyrosinase, which is an enzyme responsible for melanin synthesis [21].
The phytochemical composition of Rosa genus varies between different and the same species and depends on geographic locations, ecology, soil composition, and other environmental factors, especially for the concentration of vitamin C and phenolic compounds [22]. Recent studies by Dani et al. showed that the phytochemical composition of Rosa sp. depends also on the floral development and senescence [23]. The most studied parts of Rosa plants are rose hips, which are known as a rich source of natural antioxidants, e.g., PUFA (polyunsaturated fatty acids) such as linoleic acid, but also flavonoids, triterpenoids, and phytosterols [24]. Galactolipids, which are also found in rose hips, have shown some anti-inflammatory and antitumor activities [25]. Flower buds of R. rugosa were shown recently to contain acidic polysaccharides with antioxidant and anti-aging properties [26] as well as neuroactive depside glucosides, flavonoids, and tannins [27]. Flavonoids, including kaempferol and quercetin derivatives, were also found in R. damascena flower buds [28]. The leaves of various Rosa species were shown to contain significant amounts of polyphenols, comprising from to 5.7 ± 0.08% to 15.2 ± 0.21% of dried weight [29]. In R. canina, the polyphenolic content is higher in the leaves than in the fruits [30].
In the current research, we have studied the phytochemical composition and selected cosmetic activities of Rosa platyacantha Schrenk growing in the mountains of Trans-Ili Alatau, Northern Tian Shan Mountain (Almaty, Kazakhstan). This Rosa species has not been characterized in the scientific literature to date. In addition, it is evident that plants growing in unfavorable environmental conditions, such as the mountains of Almaty region, are generally rich in phytochemical compounds with a broad spectrum of biological activities, including antioxidant, anti-inflammatory, and UV-protecting properties [21,31,32,33]. The extracts from such plants are a potentially interesting source of active ingredients for cosmetic products protecting the skin from the harmful impact of environmental factors, such as air pollution and UV radiation. For that reason, in this study, R. platyacantha extracts prepared from various parts of the plant were investigated for their antioxidant potential, elastase, collagenase, and tyrosinase inhibitory properties, and anti-melanoma activity in vitro. The extract from flower buds, with the most significant tyrosinase inhibitory properties, was fractionated in order to identify the compounds responsible for the tyrosinase inhibition.

2. Results and Discussion

2.1. Phytochemical Content and Antioxidant Extracts from Various Parts of R. platyacantha

Hydroalcoholic extracts, prepared from the flowers, leaves, buds, leaves with stems, and flowers without petals of R. platyacantha (R1–R5, respectively), were first compared for total phenolics and flavonoids content. Extracts R2-R5 were characterized by the similar content of phenolics (14.53–13.30 mg GAE/g dried weight, dw), whereas extract R1 contained a significantly lower amount of these compounds (8.61 mg GAE/g dw). The content of flavonoids was comparable between extracts and varied from 2.03 to 2.49 µg/g dw (Table 1).
Phenolic compounds, especially flavonoids, are considered the most active group of natural compounds with broad spectrum of health, food, and cosmetic applications [34]. As shown by several researchers, phenolic compounds and flavonoids are potent antioxidants; therefore, they may serve as effective scavengers of reactive oxygen species (ROS) [35]. Although low amounts of ROS are important for intracellular signaling, elevated ROS levels may cause DNA, lipid, and protein damage and thus lead to the development of premature skin aging, pigmentation disorders, or skin cancer [36,37].
The antioxidant potential of R1–R5 extracts was first compared using DPPH and ABTS radical scavenging assays. In both methods, the highest and lowest antioxidant activity was detected in R. platyacantha extracts with the highest and lowest phenolics content, respectively (Table 1).
The ability of R1–R5 extracts to protect the cells from the harmful effect of ROS was also analyzed in vitro using spontaneously immortalized human keratinocyte cell line HaCaT [38]. In this assay, the cells were stressed with H2O2 in the presence or absence of R1–R5 extracts at 25 and 10 µg/mL, and the intracellular ROS generation was monitored using the fluorogenic dye H2DCFDA. After the diffusion into the cell, H2DCFDA is deacetylated by cellular esterases and subsequently oxidized by ROS into 2′,7′-dichlorofluorescein (DCF) [39]. As shown in Figure 1, stimulation of HaCaT cells with H2O2 increased the DCF fluorescence intensity around four times, indicating increased intracellular ROS production. Pre-treatment of the cells with R1–R5 extracts reduced the intracellular ROS levels by 2.5 times in comparison with the cells without pre-treatment. Observed reduction of the intracellular oxidative stress was comparable with that of a known ROS scavenger NAC [40].

2.2. Chromatographic Analysis of R. platyacantha Extracts

The extracts R1–R5 were subjected for HPLC/ESI-QTOF-MS analysis, and the identified compounds are presented in Table 2. Based on the surface areas of the peaks corresponding to identified compounds (Figure S1), the relative content of phytochemicals was classified as high (+++), moderate (++), or low (+), as indicated in Table 2.
Chromatographic analysis of the extracts obtained from different parts of R. platyacantha showed that the most characteristic components are quinic acid (1), methoxygallic acid isomer (11), and methyl brevifolincarboxylate (19). Methoxygallic acid isomer was the most abundant compound in R3 and R5 extracts. The content of quinic acid and methyl brevifolincarboxylate was comparable between extracts R1, R2, R4, and R5 and relatively lower in extract R3.
While quinic acid, ellagic acid, and their derivatives are compounds commonly identified in various Rosa sp. extracts [41,42,43], to our knowledge, this is the first report indicating the presence of brevifolin derivatives in a species from Rosa genus.
There are very few reports in the literature on the chemical composition of R. platyacantha [44,45]. Both publications reported the presence of hydrolysable tannins (gallotannins and ellagitannins) in fruits of R. platyacantha. Ellagic and gallic acids were identified in the methanol extract obtained from this plant material [44,45]. The results of the current research confirm the presence of both acids and their derivatives also in extracts obtained from other parts of the R. platyacantha. For the first time, the occurrence of brevifolin derivatives were confirmed. The latter compounds are known to occur in pomegranate, sweet oranges, and Zanthoxylum species [46]. It is also interesting to note that the pharmacological profile of brevifolin is reported similar to ellagic acid [47]. From the chemical point of view, ellagitannins may also undergo oxidation to compounds containing a dehydrohexahydroxydiphenoyl group, which is also accompanied by the presence of brevifolin carboxylic acid [48]. This compound was also detected in all extracts obtained from R. platyacantha.
Among other characteristic components worth mentioning is the presence of gallic acid derivatives as well as flavonoids belonging to flavonols, especially quercetin derivatives. These compounds are known from the scientific literature as effective antioxidants and were previously detected in the extracts from other Rosa species [41,42,43,49]. The abundance of quinic acid, quercetin, and gallic acid as well as their derivatives in R. platyacantha extracts explains their significant antioxidant activity [50].

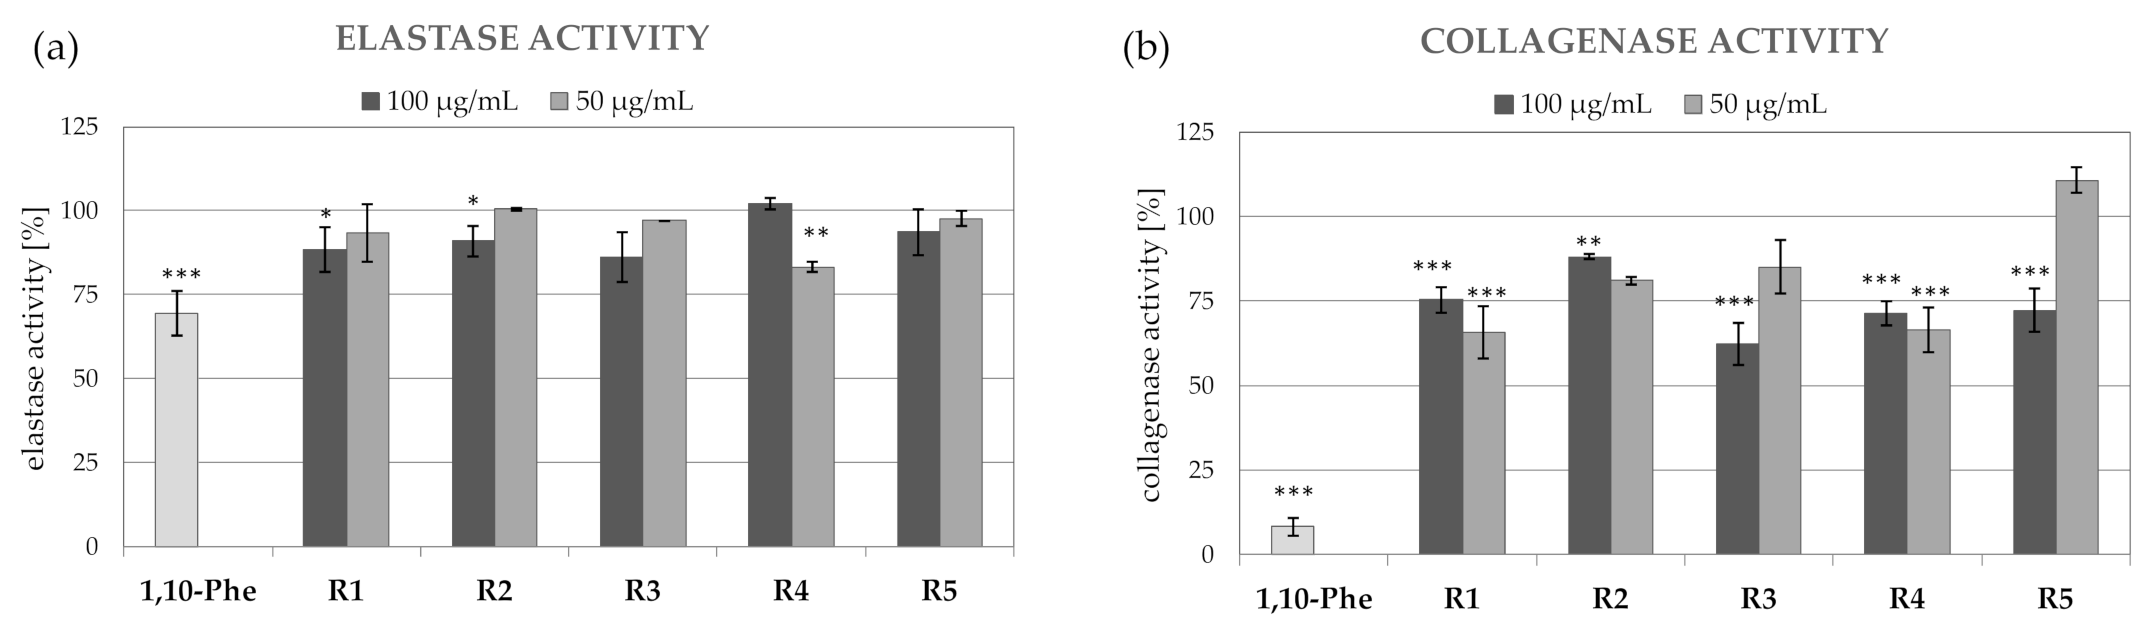
2.3. Anti-Collagenase and Anti-Elastase Activity of R. platyacantha Extracts

The upregulated activity of collagenase and elastase plays a pivotal role in wrinkling of the skin via the impairment of collagen and elastic fibers configuration and the subsequent loss of skin elasticity. Increased activity of collagenase and elastase is caused by both intrinsic (chronologic) and extrinsic aging (UV radiation) factors [51,52]. In general, the extracts from R. platyacantha were more effective collagenase than elastase inhibitors (Figure 2). All tested extracts showed significant collagenase inhibition at 100 µg/mL, with extract R3 being the most active (38% collagenase inhibition). Extracts R1, R2, and R3 significantly decreased the activity of collagenase also at 50 µg/mL (18–34% inhibition). The activity of elastase was significantly decreased only by R1 and R2 extracts at 100 µg/mL (11–13% inhibition) and extract R4 at 50 µg/mL (16% inhibition).
Several natural inhibitors of collagenase and elastase were identified to date in plant extracts, including Rosa species. R. rugosa extract was shown to inhibit collagenase activity [53] and R. damascena extract from petals inhibits elastase [54]. The extracts from R. hybrida and R. centifolia showed inhibitory potential toward both collagenase and elastase activities [55,56].

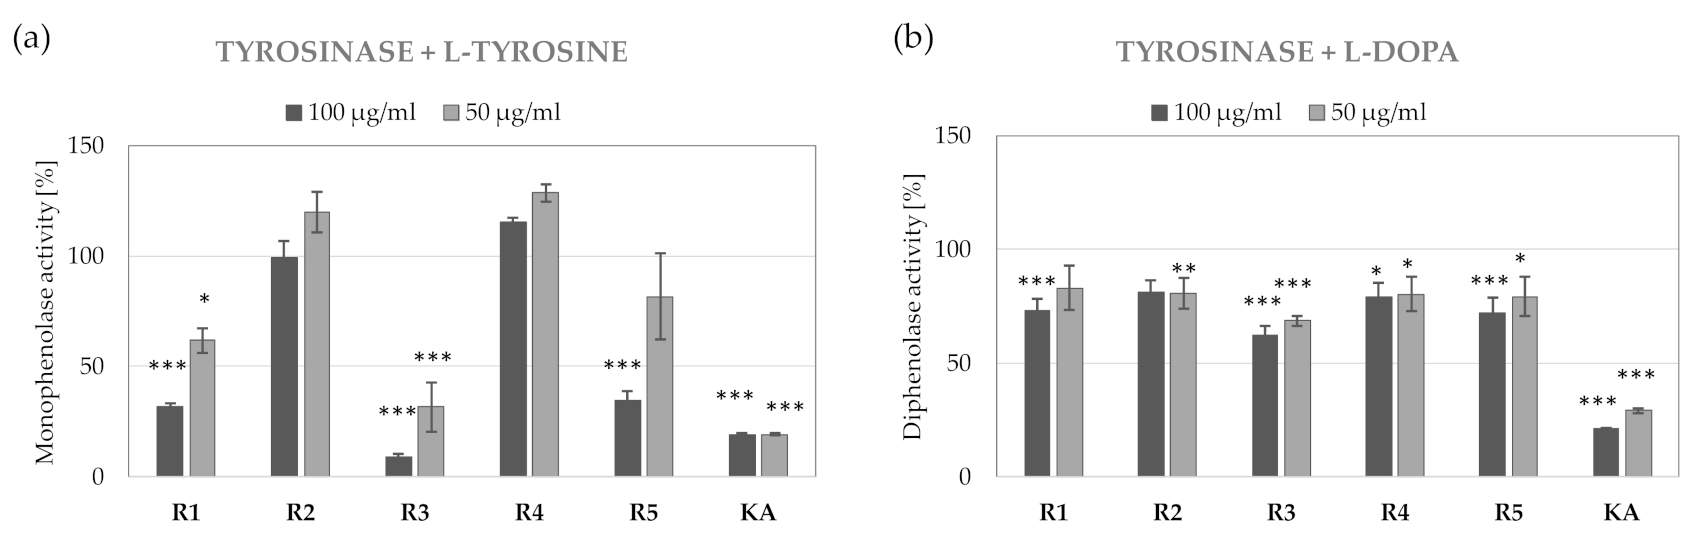
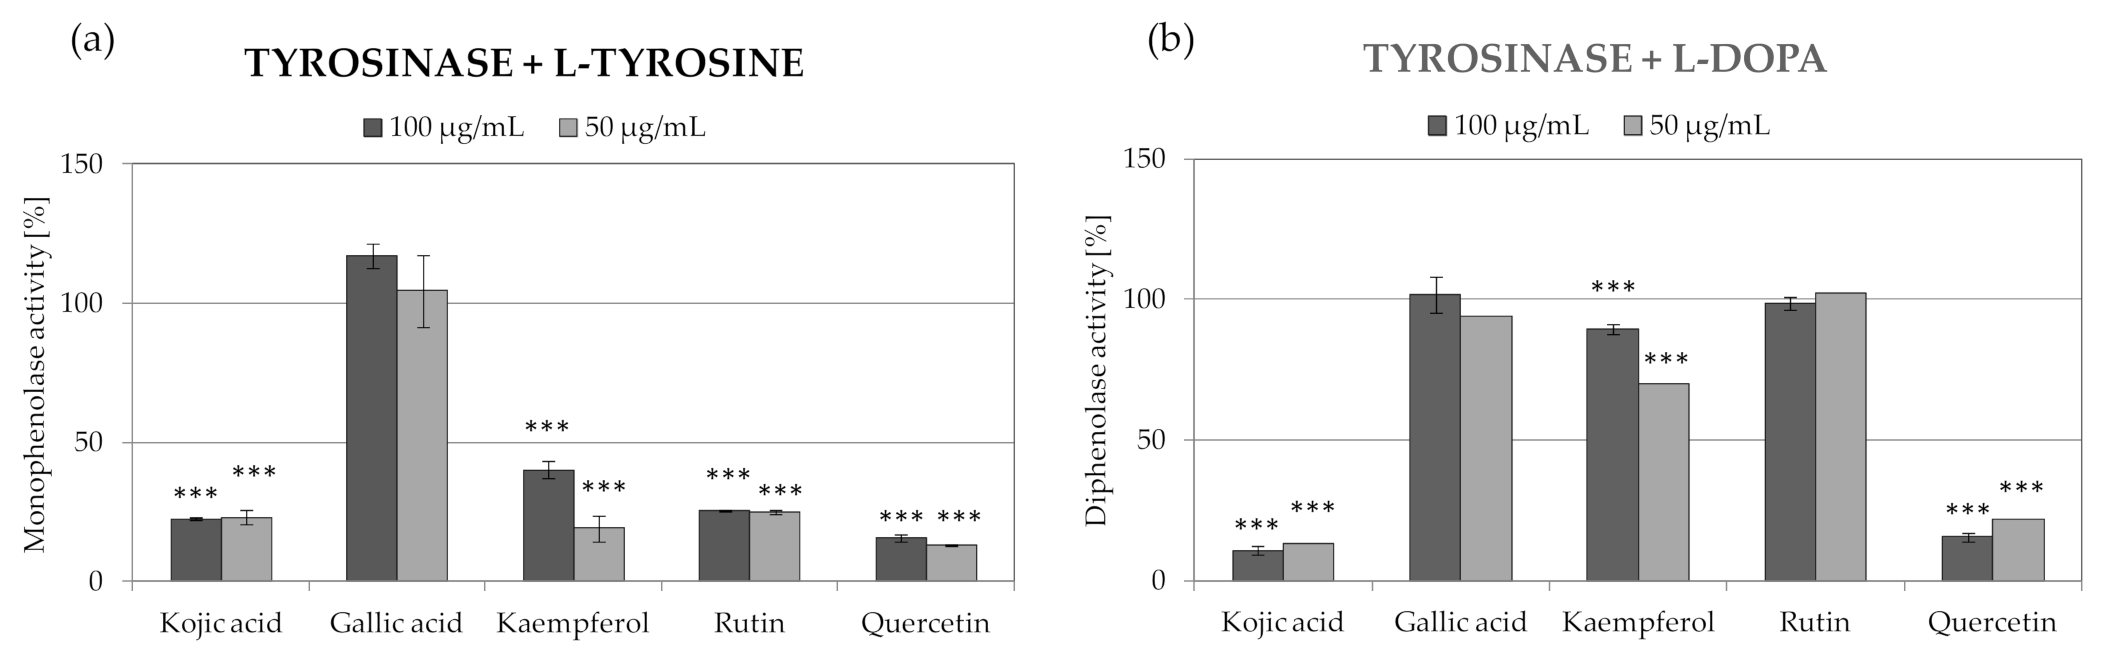
2.4. Anti-Tyrosinase Activity of R. platyacantha Extracts

Using plant extracts for the treatment of skin pigmentation disorders gained popularity in recent years [57]. Tyrosinase (EC. 1.14.18.1), a key enzyme of melanogeneis is the most popular target for skin lightening cosmetic ingredients. Tyrosinase catalyzes the rate-limiting conversion of L-tyrosine to L-dihydroxyphenylalanine (L-DOPA) (monophenolase activity) and subsequently to dopaquinone (diphenolase activity) [58].
R. platyacantha extracts inhibited monophenolase and diphenolase activity of tyrosinase in a dose-dependent manner, with R3 extract being the most active. At 100 µg/mL, R3 extract inhibits 90% of monophenolase (Figure 3a) and 38% of diphenolase (Figure 3b) activity of tyrosinase. Extracts R2 and R4 decreased diphenolase activity by 20% (Figure 3b) but had no impact of monophenolase activity of tyrosinase (Figure 3a).

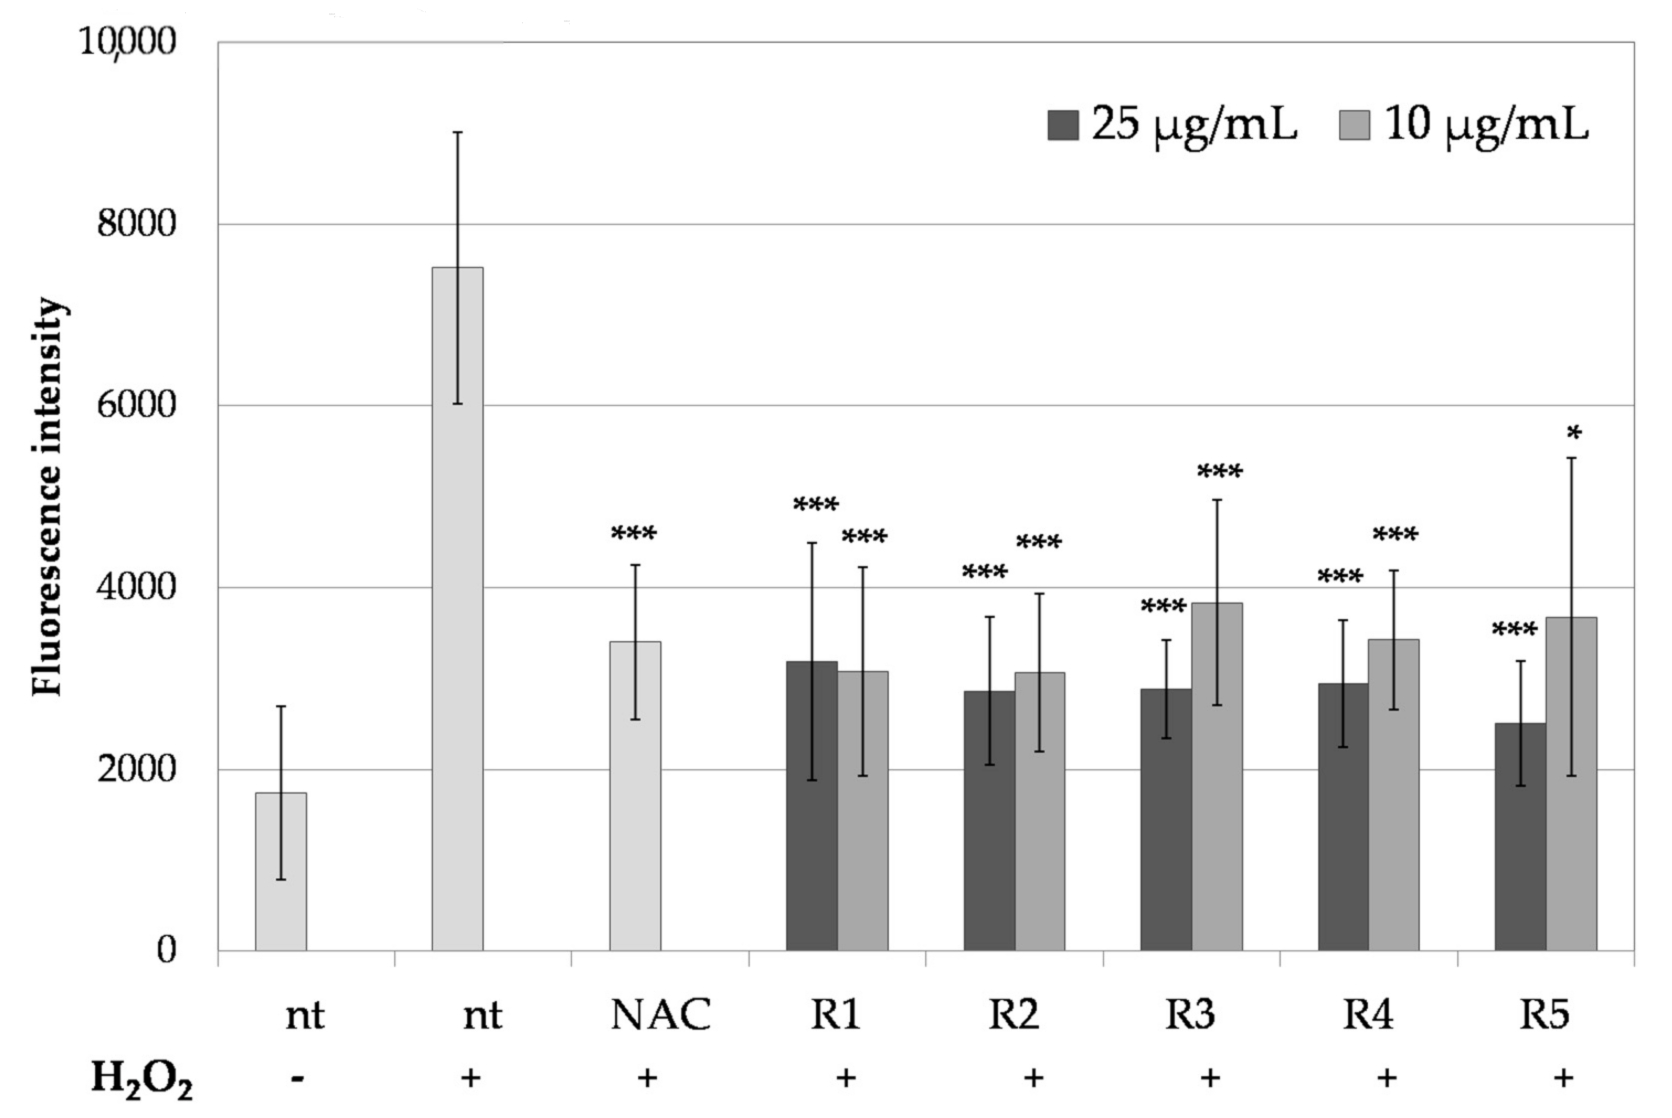
2.5. Anti-Melanoma Activity of R. platyacantha Extracts In Vitro

Several phenolic compounds identified in R. platyacantha extract, including ellagic and gallic acids [59,60], kaempferol [61], and quercetin [62] were previously shown to induce apoptosis in melanoma cell lines in vitro. Therefore, extracts rich in these compounds might be used in melanoma chemoprevention, suppressing the initiation, promotion, and progression of cancer cells. The addition of chemopreventing agents in cosmetics may increase their effectiveness due to the repeated application directly on the skin surface [63].
R1–R5 extracts were analyzed for their cytotoxicity in vitro against human (A375, SH-4) and murine (B16-F10) melanoma cell lines and noncancerous human keratinocytes HaCaT (Table 3). Except for the R1 extract, all analyzed extracts were cytotoxic for the melanoma cell lines. The most significant cytotoxicity was observed for R3 and R5 extracts against the A375 cell line (IC50 = 97.31 and 72.90 µg/mL, respectively). The cytotoxic effect of these extracts against noncancerous HaCaT cells was 1.9–2.4 times lower (IC50 = 187.30 and 174.20 µg/mL, respectively). To our knowledge, this is the first report showing the anti-melanoma activity of Rosa spp. extracts. The extracts from R. canina were previously proven cytotoxic for colon, cervix, hepatocellular and non-small cell lung carcinoma and leukemia cell lines [13,14]. R. rugosa decreased the proliferation of prostate cancer cells [15]. R. roxburghii was shown to induced intrinsic apoptosis in esophageal squamous carcinoma, gastric carcinoma, and pulmonary carcinoma cell lines [64].

2.6. Fractionation of R3 Extract and Chromatographic Analysis of the Fractions

Among the compared biological activities, extract R3 was characterized by the most significant antioxidant and anti-melanoma properties as well as an exceptional ability to inhibit both mono- and diphenolase activities of tyrosinase. For that reason, extract R3 was separated into nine fractions (A–I) in order to identify active compounds responsible for the observed antioxidant, anti-melanoma, and tyrosinase inhibitory activities. Fractions A and B were excluded from further analysis, as they contained trace amounts of organic compounds and were not dissolving in DMSO. Fractions C–I were first analyzed for their phytochemical composition. The results are presented in Table 4. Based on the peak’s surface areas in corresponding chromatograms (Figure S2), the relative content of each compound was estimated as high (+++), moderate (++), and low (+) and indicated in Table 4. The most abundant compounds in all fractions were gallic acid and its derivatives (methoxygallic acid isomer and methoxygallic acid glucoside isomer). Fractions E–I contained also quercetin and brevifolin derivatives, whereas these compounds were absent in fractions C and D.

2.7. Antioxidant and Anti-Melanoma Activities of Fractions C-I Separated from R3 Extract

The antiradical potential of fractions C–I was compared using DPPH and ABTS scavenging assays, revealing that the most active antiradical compounds were present in fraction E. Fraction C was the least active (Table 5).
The comparison of in vitro cytotoxicity of fractions C-I against HaCaT keratinocytes and A375 melanoma cells showed that the compounds present in fractions F-I are not cytotoxic for both tested cell lines. The most significant cytotoxic effect against melanoma cells was detected in fraction D (IC50 = 70.30 µg/mL). This fraction was also the most cytotoxic for noncancerous HaCaT cells, but the calculated IC50 value (137.60 µg/mL) was about two times higher than for A375 melanoma cells (Table 6). The two compounds identified in fraction D were gallic acid and methoxygallic acid isomer. The relative content of gallic acid was the highest among all analyzed fractions. Gallic acid was previously shown to induce apoptosis in A375.S2 melanoma cells through the upregulation of the proapoptotic proteins such as Bax, downregulation of antiapoptotic proteins such as Bcl-2, and activation of caspase-9 and caspase-3 [60].

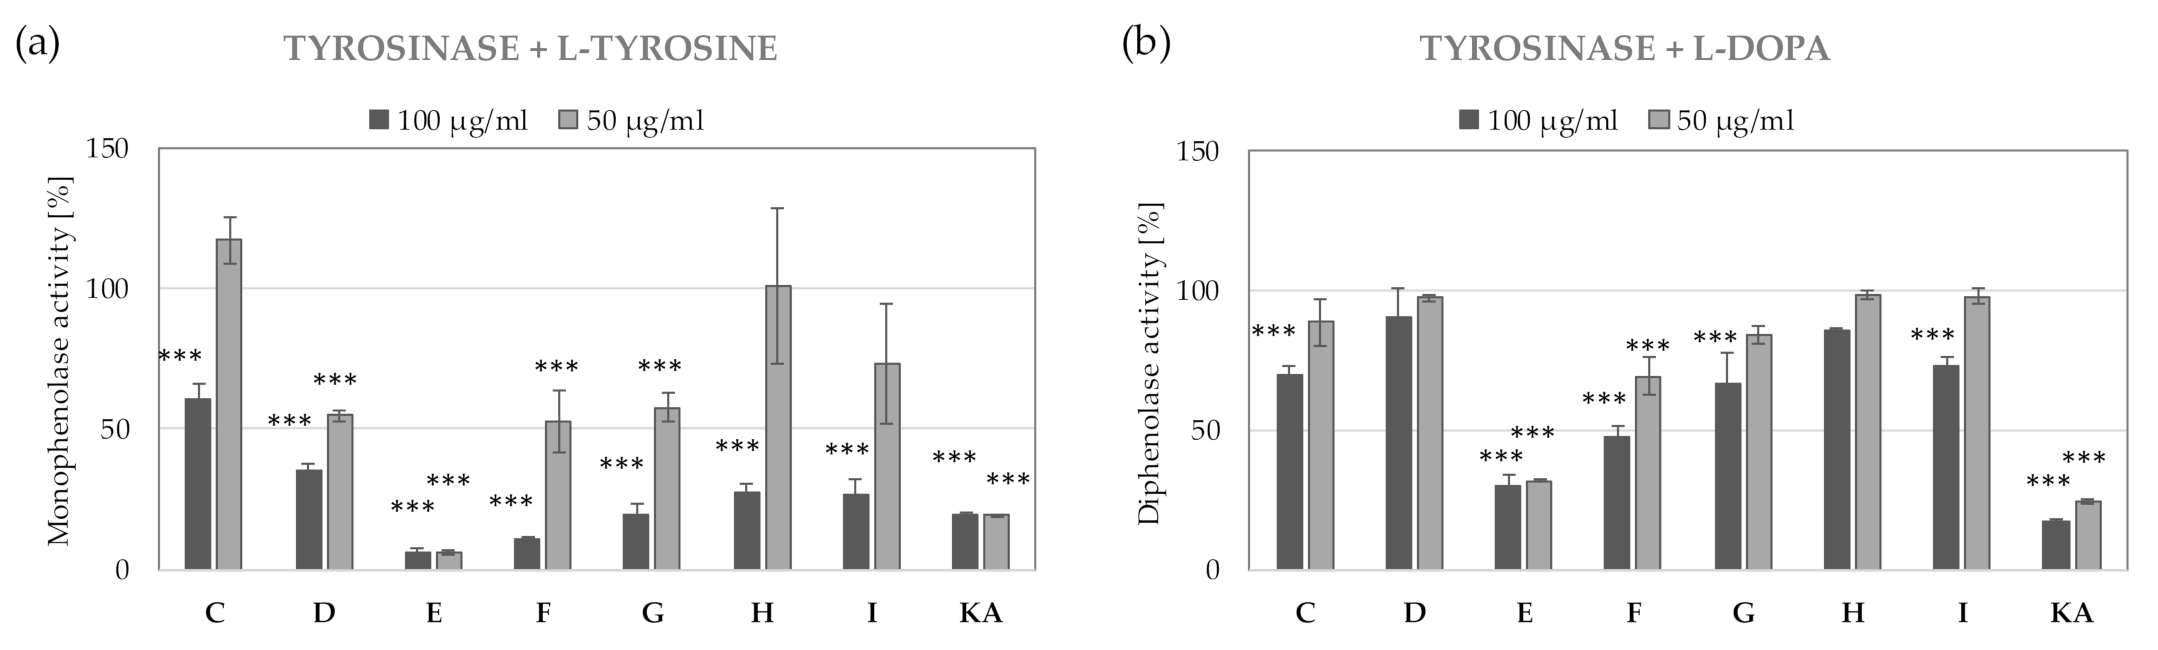
2.8. Identification of Tyrosinase Inhibitors from E and F Fractions Separated from R3 Extract

In the tyrosinase inhibitory studies, fractions E and F showed the most significant inhibition of monophenolase and diphenolase activities. Fraction E reduced the monophenolase activity of tyrosinase by >90% and was more effective than kojic acid at the corresponding concentrations (Figure 4).
Chromatographic analysis showed that fraction E, characterized by the highest tyrosinase inhibitory activity, contains mostly gallic acid and its derivatives. The content of these compounds in the second most active fraction F was much lower, suggesting that gallic acid and its derivatives are not responsible for the observed tyrosinase inhibitory properties. Other compounds present in E and F fractions included derivatives of kaempferol, quercetin, and rutin. In order to identify the compound responsible for the tyrosinase inhibitory potential of fractions E and F and extract R3, pure reference compounds were analyzed in the same assay. As shown in Figure 5, quercetin, rutin, and kaempferol were effective inhibitors of the monophenolase activity of tyrosinase, which was comparable with the widely used tyrosinase inhibitor—kojic acid. The diphenolase activity of tyrosinase was decreased by quercetin (78% inhibition at 50 µg/mL) and kaempferol (30% inhibition at 50 µg/mL). The mono- and diphenolase activities of tyrosinase were not affected by gallic acid. Based on obtained data, it might be concluded that quercetin, kaempferol, rutin, and their derivatives are responsible for the tyrosinase inhibitory properties of R. platyacantha flower buds extract. Quercetin has been already described in a B16 murine melanoma model as an effective tyrosinase inhibitor from R. canina. The inhibition of melanogenesis by quercetin was due to the inhibition of both tyrosinase activity and of the protein expression [49].

3. Materials and Methods

3.1. Chemicals and Reagents

A375 (ATCC CRL-1619) human malignant melanoma, SH-4 (ATCC CRL-7724) human melanoma, and B16-F10 (ATCC CRL-6475) murine melanoma cell lines were purchased from LGC Standards (Łomianki, Poland). Immortalized human keratinocytes HaCaT were purchased from CLS Cell Lines Service GmbH (Eppelheim, Germany). Fetal bovine serum (FBS) was obtained from Pan-Biotech (Aidenbach, Germany). Dulbecco’s modified Eagle’s medium (DMEM)/high glucose, with and without phenol red, Dulbecco’s phosphate buffered saline (DPBS), mushroom tyrosinase from Agaricus bisporus, L-tyrosine, 3,4-dihydroxy-l-phenylalanine (L-DOPA), 2,2-Diphenyl-1-picrylhydrazyl (DPPH), 2′,7′-dichlorofluorescin diacetate (H2DCFDA), N-acetylcysteine (NAC), N-Succinyl-Ala-Ala-Ala-p-nitroanilide (SANA), kojic acid (≥99.0%), chlorogenic acid (≥95%), ellagic acid (≥95%), gallic acid (97.5–102.5%), kaempferol (≥97.0%), quercetin (≥95.0%), rutin (≥94.0%), 1,10-phenantroline (≥99.0%), and neutral red solution (3.3 g/L) were purchased from Merck (Darmstadt, Germany). Water (H2O), formic acid (HCOOH), and acetonitrile (CH₃CN) for HPLC analysis were purchased from J.T. Baker (Witko, Łódź, Poland).

3.2. Plant Material

Rosa platyacantha Schrenk plant was collected on 23 of May 2019 in the mountains of Trans-Ili Alatau, Northern Tian Shan mountain region (Almaty, Kazakhstan). Identification of the plant was made by the Institute of Botany and Phytointroduction located in Almaty, Kazakhstan. Collected plant material was dried in room temperature with relative humidity 50 ± 5% in a ventilated premises for a duration of 5 days. A voucher specimen of the plant is being kept in Almaty, in the Institute of Botany and Phytointroduction of the Committee for Science of the Ministry of Education and Science of Republic of Kazakhstan.

3.3. Extraction Procedure and Fractionation

For the purpose of this study, five extracts from various parts of R. platyacantha were prepared, as described in Table 7.
First, 30 g of dried plant material was mixed with 400 mL of 70% methanol and put for 30 min to an ultrasonic bath (Bandelin SONOREX Digital 10P) at 30 °C. Then, the extract was filtered, and a fresh portion of solvent was added (300 mL). After 30 min of ultrasound extraction, the plant material was left for overnight maceration; then, the extract was filtered, a new portion of solvent was added, and ultrasound-assisted extraction was performed. Filtrates from each extraction step were collected, and solvent was removed by rotary evaporator under reduced pressure.
Five mg of extract obtained from R. platyacantha closed flowers (R3) was absorbed on small portion of silica gel (230–400 mesh). Dry Column Vacuum Chromatography (DCVC) was used for the fractionation of this extract. Adsorbed extract was loaded in a dry column filled with silica gel (230–400 mesh) and eluted with 200 mL of n-hexane-EtOAc (7:3, v/v), n-hexane-EtOAc (1:1, v/v), n-hexane-EtOAc (3:7, v/v), EtOAc, EtOAc-MeOH (7:3, v/v), EtOAc-MeOH (1:1, v/v), EtOAc-MeOH (3:7, v/v), MeOH, and MeOH-water (9:1, v/v) successively. Collected fractions were monitored by TLC using n-hexane-EtOAc (1:1, v/v) and EtOAc-MeOH (1:1, v/v) as mobile phases. This procedure give nine fractions (A–I).

3.4. Total Phenolics and Flavonoids Content

The content of total phenolic compounds was determined as described by Fukumoto and Mazza [65] with slight modifications. First, 150 µL of extracts (1 mg/mL) was mixed with 750 µL of Folin–Ciocalteu reagent (1:10 v/v, in water) and incubated for 5 min at room temperature. The samples were mixed with 600 µL 7.5% (m/v) Na2CO3 and incubated for 30 min at room temperature (RT) in darkness. The absorbance was measured at λ = 740 nm using a DR 600 Spectrophotometer (Hach Lange, Wrocław, Poland). The calibration curve (y = 0.4046x − 0.429; R2 = 0.9978) was prepared using 0–100 µg/mL gallic acid. The content of total phenolics was calculated as gallic acid equivalents (GAE) in mg per g of dried extract weight (dw).
The content of flavonoids was analyzed according to the method described by Matejić et al. [66] with some modifications. First, 150 µL of analyzed extracts (1 mg/mL) were mixed with 650 µL reaction mixture (61.5 mL 80% C2H5OH + 1.5 mL 10% Al(NO3)3·9H2O + 1.5 mL 1 M CH3COOK). Following 40 min incubation at RT, in darkness, the absorbance of the samples was measured at λ = 415 nm. The calibration curve (y = 0.313x − 0.3127, R2 = 0.9988) was prepared using 0–100 µg/mL quercetin. The content of flavonoids is expressed as quercetin equivalents (QuE) per gram of dried extract weight (dw).

3.5. Chromatographic Analysis

The purified samples were analyzed qualitatively by an HPLC/ESI-QTOF-MS system in negative ion mode with the use of a 6530B Accurate-mass-QTOF-MS (Agilent Technologies, Inc., Santa Clara, CA, USA) mass spectrometer with an ESI-Jet Stream ion source. The Agilent 1260 chromatograph was equipped with a DAD detector, autosampler, binary gradient pump, and column oven. The column used as stationary phase was Gemini® 3 µm NX-C18 110 Å, LC Column 100 × 2 mm. Gradient of solvents: water with 0.1% formic acid (solvent A) and acetonitrile with 0.1% formic acid (solvent B) were used as the mobile phases. The following gradient procedure was adopted: 0–45 min, 0–60% of B; 45–46 min, 60–90% B; 46–50 min 90% (B), the post time was 10 min. The total time of analysis was 60 min, with a stable flow rate at 0.200 mL/min. Injection volume for extracts was 10 μL. ESI-QToF-MS analysis was performed according to the following parameters of the ion source: Dual spray jet stream ESI, positive and negative ion mode, gas (N2) flow rate: 12 L/min., nebulizer pressure: 35 psig, vaporizer temp.: 300 °C; m/z range 100–1000 mass units, with acquisition Mode Auto MS/MS, collision-induced dissociation (CID): 10 and 40 V with MS scan rate 1 spectrum per s, 2 spectra per cycle, skimmer: 65 V, fragmentor: 140 V and octopole RF Peak: 750 V. Identification of compounds was based on Metlin database (https://metlin.scripps.ed) (accessed on 27 January 2021) and compared with literature data.

3.6. DPPH Radical Scavenging Assay

The antiradical activity of R. platyacantha extracts and fractions was established using a DPPH radical scavenging assay, according to the modified protocol described by Matejic et al. [66]. First, 100 μL of extracts or fractions (0.0005–1 mg/mL) was mixed with 100 μL of DPPH in working solution (25 mM in 99.9% methanol; A540 ≈ 1). Then, 100 μL of the solvent (methanol) mixed with 100 μL DPPH was used as a control sample. After 20 min incubation at RT in darkness, the absorbance of the samples was measured at λ = 540 nm using a FilterMax F5 microplate reader (Molecular Devices, San Jose, CA, USA). Obtained values of measurements were corrected by the absorbance values of the samples without DPPH. The percentage of DPPH radical scavenging was calculated based on the following equation:
% of DPPH˙ scavenging = [1 − (Abs(S)/Abs(C))] × 100%
where Abs(S)—the corrected absorbance of the sample, Abs(C)—the corrected absorbance of the control sample.
Obtained results were used to calculated IC50 values defined as the concentration of dried extract/fraction that is required to scavenge 50% of the DPPH radical activity.

3.7. ABTS Radical Scavenging Assay

The antioxidant activity of R. platyacantha extracts was compared using ABTS radical scavenging assay [67] with modifications. ABTS working solution was prepared by dissolving 7 mM ABTS in 2.45 mM K2S2O8 in distilled H2O (A405 ≈ 1). Then, 15 μL of extracts diluted in DMSO in the concentration range from 0.0005 to 1 mg/ mL was mixed with 135 μL ABTS working solution. Then, 15 μL DMSO mixed with 135 μL ABTS served as a control sample. Following 15 min incubation at RT in darkness, the absorbance of the samples was measured at λ = 405 nm using a microplate reader (FilterMax F5 Molecular Devices, USA). The obtained values were corrected by the absorbance value of the sample without ABTS. The percentage of ABTS radical neutralization was calculated based on the following equation:
% of ABTS scavenging = [1 − (Abs(S)/Abs(C))] × 100
where Abs(S)—the corrected absorbance of the extract, Abs(C)—the corrected absorbance of the control sample (ABTS + solvent).
The IC50 value was defined as the concentration of dried extract in µg/mL that is required to scavenge 50% of ABTS radical activity.

3.8. Tyrosinase Inhibitory Assay

The inhibition of the monophenolase and diphenolase activities of mushroom tyrosinase by R. platyacantha extracts and fractions was analyzed as previously described by Wang et al. and Uchida et al., respectively [68,69]. For the monophenolase inhibitory assay, 80 µL of phosphate buffer (100 mM, pH = 6.8) was mixed with 20 µL of the analyzed sample or kojic acid as an inhibitory control (final concentrations: 100 µg/mL, 50 µg/mL and 25 µg/mL). Then, 20 µL mushroom tyrosinase working solution (500 U/mL) was added per sample followed by 10 min pre-incubation at RT. Following the addition of 80 µL, 2 mM L-tyrosine the samples were incubated for 20 min at RT in darkness.
The diphenolase inhibitory assay was performed by mixing 120 µL of phosphate buffer (100 mM, pH = 6.8) with 20 µL of diluted samples or kojic acid as an inhibitory control (final concentrations: 100, 50, and 25 µg/mL) and 20 µL mushroom tyrosinase solution (500 U/mL). The reaction mixture was incubated for 10 min at RT. Following the addition of 40 µL 4 mM L-DOPA, the samples were incubated for a further 20 min at RT in darkness.
In both assays, the formation of dopachrome in the presence or absence of analyzed samples was measured spectrophotometrically at λ = 450 nm using a FilterMax F5 microplate reader (Molecular Devices, San Jose, CA, USA). The values were corrected by the absorbance of the extracts without tyrosinase, L-tyrosine, and L-DOPA. A control sample (100% tyrosinase activity) contained phosphate buffer, tyrosinase, an equal volume of the solvent, and the appropriate dose of each substrate. The activity of tyrosinase was calculated based on the equation:
% of tyrosinase activity = [Abs(S)/Abs(C)] × 100%
where Abs(S)—the absorbance of the sample (extract + tyrosinase + substrate), Abs(C)—the absorbance of the control sample (solvent + tyrosinase + substrate).

3.9. Elastase Inhibitory Assay

The inhibition of elastase by R. platyacantha extracts was established using the protocol described by Horng and co-workers [70]. First, 100 µL Tris-HCl (0.2 M, pH 6.8), containing 0.15 M NaCl and 0.01 M CaCl2 was mixed with 15 µL of sample (100 µg/mL and 50 µg/mL), 0.1 M 1,10-phenantroline (metalloprotease inhibitor) or DMSO (solvent control), and 25 µL elastase working solution (50 µg/mL, 2 U/mL, in 0.1 Tris-HCl, pH 6.8). Following 10 min incubation at room temperature, 20 µL of 2.9 mM SANA was added to each sample, mixed, and incubated for 30 min at 37 °C. The absorbance of the samples at λ = 405 nm was measured using a FilterMax F5 microplate reader (Molecular Devices, San Jose, CA, USA). The obtained values were corrected by the absorbance of the diluted extracts without elastase and SANA. The activity of elastase was calculated based on the equation:
% of elastase activity = [Abs(S)/Abs(C)] × 100%
where Abs(S)—the absorbance of the sample (extract + elastase + SANA) and Abs(C)—the absorbance of the control sample (solvent + elastase + SANA).

3.10. Collagenase Inhibitory Assay

The collagenase inhibitory potential of the extracts obtained from various parts of R. platyacantha at 100 µg/mL and 50 µg/mL was analyzed using Collagenase Activity Colorimetric Test (Sigma Aldrich, St. Louis, MO, USA). Here, 0.01 M 1,10-phenantroline was used as inhibitory control. The analysis and the calculation of collagenase activity (U/mL) was performed according to the manufacturer’s instructions. Then, obtained values were used to calculate the collagenase activity in comparison with the control sample (100% collagenase activity), using the following equation:
% of collagenase activity = [Act(S)/Act(C)] × 100%
where Act(S)—collagenase activity of the analyzed sample and Act(C)—collagenase activity of the control sample.

3.11. In Vitro Cytotoxicity Assay

The cytotoxicity of R. platyacantha extracts and fractions was investigated using Neutral Red Uptake Test [71]. A375, SH-4 human melanoma, B16-F10 murine melanoma, and HaCaT human keratinocyte cell lines were maintained in DMEM supplemented with 10% FBS at 37 °C in a humidified atmosphere with 5% CO2. For the experimental purpose, 3 × 10³ cells were plated per well onto a 96-well plate and grown overnight. Then, the cells were treated with various concentrations of R. platyacantha extracts (12.5–400 µg/mL) or an equal volume of DMSO as solvent control. Following 48 h of culture, the cells were incubated for 3 h with 33 µg/mL neutral red solution in DMEM containing 1% FBS, rinsed with DPBS and lysed using acidified ethanol solution (50% v/v ethanol, 1% v/v acetic acid). The absorbance of the released neutral red was measured at λ = 540 nm using FilterMax F5 microplate reader (Molecular Devices, San Jose, CA, USA) and corrected by the absorbance at λ = 620 nm. The mean measured value for the lysate from control cells was set as 100% cellular viability and used to calculate the percentage of viable cells following extracts treatment. Obtained values were used to calculated IC50, which was defined as the concentration of dried extract/fraction decreasing the viability of each cell line by 50%.

3.12. Detection of Intracellular ROS using H2DCFDA

The influence of R1–R5 R. platyacantha extracts on the intracellular ROS levels in H2O2-treated HaCaT keratinocytes was measured using 2′,7′-dichlorofluorescin diacetate (H2DCFDA) assay described by Wu and Yotnda [72] with some modifications. First, 1 × 10⁴ HaCaT keratinocytes were plated per well onto black-walled, 96-well plates and cultured overnight in DMEM supplemented with 10% FBS. The cells were loaded with 5 µM H2DCFDA diluted in serum-free, phenol red-free DMEM at 37 °C and 5% CO2 for 30 min, in darkness. Diluted R1–R5 extracts (final concentrations 25 µg/mL and 10 µg/mL) or a known ROS-scavenger N-acetyl-l-cysteine (NAC, 2 mM) were pre-mixed in serum-free, phenol red-free DMEM with 1 mM H2O2 and applied to H2DCFDA-loaded cells. Equal volume of the serum-free, phenol-red free DMEM was applied to the control cells. Then, the cells were incubated at 37 °C and 5% CO2 in darkness. The fluorescence intensity of the forming 2′,7′-dichlorofluorescein (DCF) was measured following 60 min of incubation using a FilterMax F5 microplate reader (Molecular Devices, San Jose, CA, USA) at maximum excitation and emission spectra of 485 and 535 nm, respectively. Obtained values were corrected by the fluorescence of the appropriately diluted R1–R5 extracts, NAC or serum-free, phenol red-free DMEM (background fluorescence).

3.13. Statistical Analysis

All experiments were conducted in at least three replicates. Obtained data were analyzed using GraphPad Prism 7.0 Software (GraphPad Software, San Diego, CA, USA). The statistical significance between results was analyzed using one-way analysis of variance (ANOVA) followed by Tukey’s test. All data are showed as mean ± SD.

4. Conclusions

The study is the first complex characterization of the chemical profile and selected biological properties of extracts obtained from various parts of R. platyacantha grown in the Almaty region in Kazakhstan. The phytochemical studies confirm the presence of gallic and ellagic acids and their derivatives as the most characteristic components of this Rosa species. For the first time, the occurrence of brevifolin derivatives was confirmed in genus Rosa, while the presence of flavonoids was confirmed in the investigated R. platyacantha.
The presented results also indicate that the extract prepared from closed flowers (buds) (R3) of R platyacantha is the richest source of phytocompounds with significant antioxidant potential, as confirmed by standard DPPH and ABTS radical scavenging assays as well as in vitro studies on HaCaT keratinocytes. The R3 extract was also effective against human melanoma cells, showing considerably lower cytotoxicity toward noncancerous skin cells. Moreover, closed flowers extract was effectively inhibiting the monophenolase and diphenolase activities of tyrosinase, suggesting its significant skin-lightening potential. Active compounds of the extracts that might be responsible for the observed activities include especially quercetin and its derivatives, e.g., rutin. Gallic acid, ellagic acid, and kaempferol are also active ingredients.
Based on the biological activity profile, flower buds extract from R. platyacantha should be considered as an effective active ingredient of skin lightening, anti-aging, and protecting cosmetics. Further studies involving human skin cell lines and 3D tissue models should be performed in order to provide additional data on the safety and cosmetic effectiveness of the R. platyacantha extracts.

Supplementary Materials

The following are available online, Figure S1: The TIC chromatogram recorded in the negative ionization modes for the R. platyacantha extracts R1–R5., Figure S2: The TIC chromatogram recorded in the negative ionization modes for the fractions obtained from R. platyacantha extract R3.

Author Contributions

Conceptualization, A.L. and K.G.-B.; Collection and identification of plant material, A.S., Z.S., E.S. and K.G.; Extraction of plant material, fractionation of the extract, A.S., Z.S. and A.L.; HPLC/ESI-QTOF-MS analysis of the extract and fractions A.S., and A.L.; Investigation of antiradical activity, collagenase, elastase and tyrosinase inhibitory activity, cytotoxicity in vitro M.S.-G., K.G.-B., U.H. and E.S.; Writing—original draft preparation K.G.-B., A.S.; Writing—review and editing A.L. All authors have read and agreed to the published version of the manuscript.

Funding

This research was funded by the Polish National Agency for Academic Exchange, the International Academic Partnerships Program under Grant No. PPI/APM/2018/1/00042/U/00.

Institutional Review Board Statement

Not applicable.

Informed Consent Statement

Not applicable.

Data Availability Statement

Data is contained within the article.

Acknowledgments

The authors are grateful to Krzysztof Kamil Wojtanowski for his help in LC-MS analyses and compounds identification. This work was supported in part by Medical University of Lublin (statutory research project DS 28).

Conflicts of Interest

The authors declare no conflict of interest.

Sample Availability

Samples of the plant material are available from the authors.

References

  1. Saint-Oyant, L.H.; Ruttink, T.; Hamama, L.; Kirov, I.; Lakhwani, D.; Zhou, N.N.; Bourke, P.M.; Daccord, N.; Leus, L.; Schulz, D.; et al. A high-quality genome sequence of Rosa chinensis to elucidate ornamental traits. Nat. Plants 2018, 4, 473–484. [Google Scholar] [CrossRef] [PubMed] [Green Version]
  2. Tsioutsiou, E.E.; Giordani, P.; Hanlidou, E.; Biagi, M.; De Feo, V.; Cornara, L. Ethnobotanical Study of Medicinal Plants Used in Central Macedonia, Greece. Evid. Based Complement. Altern. Med. 2019, 2019, 4513792. [Google Scholar] [CrossRef] [PubMed]
  3. Hayta, S.; Polat, R.; Selvi, S. Traditional uses of medicinal plants in ElazIǧ (Turkey). J. Ethnopharmacol. 2014, 154, 613–623. [Google Scholar] [CrossRef] [PubMed]
  4. Phetcharat, L.; Wongsuphasawat, K.; Winther, K. The effectiveness of a standardized rose hip powder, containing seeds and shells of Rosa canina, on cell longevity, skin wrinkles, moisture, and elasticity. Clin. Interv. Aging 2015, 10, 1849–1856. [Google Scholar]
  5. Moradkhani, S.; Rezaei-Dehghanzadeh, T.; Nili-Ahmadabadi, A. Rosa persica hydroalcoholic extract improves cadmium-hepatotoxicity by modulating oxidative damage and tumor necrosis factor-alpha status. Environ. Sci. Pollut. Res. 2020, 27, 31259–31268. [Google Scholar] [CrossRef]
  6. Changizi Ashtiyani, S.; Najafi, H.; Jalalvandi, S.; Hosseinei, F. Protective effects of Rosa canina L fruit extracts on renal disturbances induced by reperfusion injury in rats. Iran. J. Kidney Dis. 2013, 7, 290–298. [Google Scholar]
  7. Komiazyk, M.; Palczewska, M.; Sitkiewicz, I.; Pikula, S.; Groves, P. Neutralization of cholera toxin by Rosaceae family plant extracts. BMC Complement. Altern. Med. 2019, 19, 140. [Google Scholar] [CrossRef] [Green Version]
  8. Cheng, B.C.Y.; Fu, X.Q.; Guo, H.; Li, T.; Wu, Z.Z.; Chan, K.; Yu, Z.L. The genus Rosa and arthritis: Overview on pharmacological perspectives. Pharmacol. Res. 2016, 114, 219–234. [Google Scholar] [CrossRef]
  9. Taghizadeh, M.; Rashidi, A.A.; Taherian, A.A.; Vakili, Z.; Mehran, M. The Protective Effect of Hydroalcoholic Extract of Rosa canina (Dog Rose) Fruit on Liver Function and Structure in Streptozotocin-Induced Diabetes in Rats. J. Diet. Suppl. 2018, 15, 624–635. [Google Scholar] [CrossRef]
  10. Ninomiya, K.; Matsuda, H.; Kubo, M.; Morikawa, T.; Nishida, N.; Yoshikawa, M. Potent anti-obese principle from Rosa canina: Structural requirements and mode of action of trans-tiliroside. Bioorg. Med. Chem. Lett. 2007, 17, 3059–3064. [Google Scholar] [CrossRef]
  11. Turan, I.; Demir, S.; Kilinc, K.; Yaman, S.O.; Misir, S.; Kara, H.; Genc, B.; Mentese, A.; Aliyazicioglu, Y.; Deger, O. Cytotoxic effect of Rosa canina extract on human colon cancer cells through repression of telomerase expression. J. Pharm. Anal. 2018, 8, 394–399. [Google Scholar] [CrossRef]
  12. Sargin, S.A. Potential anti-influenza effective plants used in Turkish folk medicine: A review. J. Ethnopharmacol. 2021, 265, 113319. [Google Scholar] [CrossRef]
  13. Jiménez, S.; Gascón, S.; Luquin, A.; Laguna, M.; Ancin-Azpilicueta, C.; Rodríguez-Yoldi, M.J. Rosa canina extracts have antiproliferative and antioxidant effects on caco-2 human colon cancer. PLoS ONE 2016, 11, e0159136. [Google Scholar] [CrossRef] [Green Version]
  14. Guimarães, R.; Barros, L.; Calhelha, R.C.; Carvalho, A.M.; Queiroz, M.J.R.P.; Ferreira, I.C.F.R. Bioactivity of Different Enriched Phenolic Extracts of Wild Fruits from Northeastern Portugal: A Comparative Study. Plant Foods Hum. Nutr. 2014, 69, 37–42. [Google Scholar] [CrossRef]
  15. Lee, Y.H.; Jung, M.G.; Kang, H.B.; Choi, K.C.; Haam, S.; Jun, W.; Kim, Y.J.; Cho, H.Y.; Yoon, H.G. Effect of anti-histone acetyltransferase activity from Rosa rugosa Thunb. (Rosaceae) extracts on androgen receptor-mediated transcriptional regulation. J. Ethnopharmacol. 2008, 118, 412–417. [Google Scholar] [CrossRef]
  16. Cosmetic Ingredient Database (CosIng). Available online: https://ec.europa.eu/growth/sectors/cosmetics/cosing_en (accessed on 17 March 2021).
  17. Kwak, C.S.; Yang, J.; Shin, C.Y.; Chung, J.H. Rosa multiflora Thunb Flower Extract Attenuates Ultraviolet-Induced Photoaging in Skin Cells and Hairless Mice. J. Med. Food. 2020, 23, 988–997. [Google Scholar] [CrossRef]
  18. Shin, E.J.; Han, A.R.; Lee, M.H.; Song, Y.R.; Lee, K.M.; Nam, T.G.; Lee, P.; Lee, S.Y.; Lim, T.G. Extraction conditions for Rosa gallica petal extracts with anti-skin aging activities. Food Sci. Biotechnol. 2019, 28, 1439–1446. [Google Scholar] [CrossRef]
  19. Fujii, T.; Ikeda, K.; Saito, M. Inhibitory effect of rose hip (Rosa canina L.) on melanogenesis in mouse melanoma cells and on pigmentation in brown guinea pigs. Biosci. Biotechnol. Biochem. 2011, 75, 489–495. [Google Scholar] [CrossRef] [Green Version]
  20. Song, Y.R.; Lim, W.C.; Han, A.; Lee, M.H.; Shin, E.J.; Lee, K.M.; Nam, T.G.; Lim, T.G. Rose Petal Extract (Rosa gallica) Exerts Skin Whitening and Anti-Skin Wrinkle Effects. J. Med. Food 2020, 23, 870–878. [Google Scholar] [CrossRef]
  21. Ren, G.; Xue, P.; Sun, X.; Zhao, G. Determination of the volatile and polyphenol constituents and the antimicrobial, antioxidant, and tyrosinase inhibitory activities of the bioactive compounds from the by-product of Rosa rugosa Thunb. var. plena Regal tea. BMC Complement. Altern. Med. 2018, 18, 307. [Google Scholar] [CrossRef] [Green Version]
  22. Roman, I.; Stǎnilǎ, A.; Stǎnilǎ, S. Bioactive compounds and antioxidant activity of Rosa canina L. biotypes from spontaneous flora of Transylvania. Chem. Cent. J. 2013, 7, 73. [Google Scholar] [CrossRef] [PubMed] [Green Version]
  23. Dani, K.G.S.; Fineschi, S.; Michelozzi, M.; Trivellini, A.; Pollastri, S.; Loreto, F. Diversification of petal monoterpene profiles during floral development and senescence in wild roses: Relationships among geraniol content, petal colour, and floral lifespan. Oecologia 2020. [CrossRef] [PubMed]
  24. Mármol, I.; Sánchez-De-Diego, C.; Jiménez-Moreno, N.; Ancín-Azpilicueta, C.; Rodríguez-Yoldi, M. Therapeutic applications of rose hips from different Rosa species. Int. J. Mol. Sci. 2017, 18, 1137. [Google Scholar] [CrossRef]
  25. Christensen, L. Galactolipids as Potential Health Promoting Compounds in Vegetable Foods. Recent Patents Food Nutr. Agric. 2012, 1, 50–58. [Google Scholar]
  26. Tang, Y.; Zhu, Z.Y.; Liu, Y.; Sun, H.; Song, Q.Y.; Zhang, Y. The chemical structure and anti-aging bioactivity of an acid polysaccharide obtained from rose buds. Food Funct. 2018, 9, 2300–2312. [Google Scholar] [CrossRef] [PubMed]
  27. Chang, S.W.; Du, Y.E.; Qi, Y.; Lee, J.S.; Goo, N.; Koo, B.K.; Bae, H.J.; Ryu, J.H.; Jang, D.S. New Depsides and Neuroactive Phenolic Glucosides from the Flower Buds of Rugosa Rose (Rosa rugosa). J. Agric. Food Chem. 2019, 67, 7289–7296. [Google Scholar] [CrossRef] [PubMed]
  28. Kwon, E.K.; Lee, D.Y.; Lee, H.; Kim, D.O.; Baek, N.I.; Kim, Y.E.; Kim, H.Y. Flavonoids from the buds of Rosa damascena inhibit the activity of 3-hydroxy-3-methylglutaryl-coenzyme a reductase and angiotensin I-converting enzyme. J. Agric. Food Chem. 2010, 58, 882–8866. [Google Scholar] [CrossRef] [PubMed]
  29. Nowak, R.; Gawlik-Dziki, U. Polyphenols of Rosa L. leaves extracts and their radical scavenging activity. Z. Naturforsch C J. Biosci. 2007, 62, 32–38. [Google Scholar] [CrossRef] [Green Version]
  30. Polumackanycz, M.; Kaszuba, M.; Konopacka, A.; Marzec-Wróblewska, U.; Wesolowski, M.; Waleron, K.; Buciński, A.; Viapiana, A. Phenolic Composition and Biological Properties of Wild and Commercial Dog Rose Fruits and Leaves. Molecules 2020, 25, 5272. [Google Scholar] [CrossRef]
  31. Sermukhamedova, O.; Sakipova, Z.; Ternynko, I.; Gemedzhieva, N. Representatives of motherwort genus (Leonurus SPP.): Aspects of pharmacognostic features and relevance of new species application. Acta Poloniae Pharm.Drug Res. 2017, 74, 31–40. [Google Scholar]
  32. Kartbaeva, E.B.; Donald, G.R.; Sakipova, Z.B.; Ibragimova, L.N.; Bekbolatova, E.N.; Ternynko, I.I.; Fernandes, P.D.; Boylan, F. Antinociceptive activity of cistanche salsa stolons, growing in the republic of Kazakhstan. Rev. Bras. Farmacogn. 2017, 27, 587–591. [Google Scholar] [CrossRef]
  33. Di Ferdinando, M.; Brunettia, C.; Agatib, G.; Tattini, M. Multiple functions of polyphenols in plants inhabiting unfavorable Mediterranean areas. Environ. Exp. Bot. 2014, 103, 107–116. [Google Scholar] [CrossRef]
  34. Zillich, O.V.; Schweiggert-Weisz, U.; Eisner, P.; Kerscher, M. Polyphenols as active ingredients for cosmetic products. Int. J. Cosmet. Sci. 2015, 37, 455–464. [Google Scholar] [CrossRef]
  35. Pietta, P.G. Flavonoids as antioxidants. J. Nat. Prod. 2000, 63, 1035–1042. [Google Scholar] [CrossRef]
  36. Wittgen, H.G.; van Kempen, L.C. Reactive Oxygen Species in Melanoma and Its Therapeutic Implications. Melanoma Res. 2007, 17, 400–409. [Google Scholar] [CrossRef]
  37. Poljšak, B.; Dahamane, R. Free radicals and extrinsic skin aging. Dermatol. Res. Pract. 2012, 2012, 135206. [Google Scholar] [CrossRef] [Green Version]
  38. Boukamp, P.; Petrussevska, R.T.; Breitkreutz, D.; Hornung, J.; Markham, A.; Fusenig, N.E. Normal keratinization in a spontaneously immortalized aneuploid human keratinocyte cell line. J. Cell Biol. 1988, 106, 761–771. [Google Scholar] [CrossRef] [Green Version]
  39. Gomes, A.; Fernandes, E.; Lima, J.L.F.C. Fluorescence probes used fordetection of reactive oxygen species. J. Biochem. Biophys. 2005, 65, 45–80. [Google Scholar] [CrossRef]
  40. Aldini, G.; Altomare, A.; Baron, G.; Vistoli, G.; Carini, M.; Borsani, L.; Sergio, F. N-Acetylcysteine as an antioxidant and disulphide breaking agent: The reasons why. Free Radic. Res. 2018, 52, 751–762. [Google Scholar] [CrossRef]
  41. Cendrowski, A.; Ścibisz, I.; Kieliszek, M.; Kolniak-Ostek, J.; Mitek, M. UPLC-PDA-Q/TOF-MS Profile of Polyphenolic Compounds of Liqueurs from Rose Petals (Rosa rugosa). Molecules 2017, 22, 1832. [Google Scholar] [CrossRef] [Green Version]
  42. Hosni, K.; Chrif, R.; Zahed, N.; Abid, I.; Medfei, W.; Sebei, H.; Brahim, N.B. Fatty acid and phenolic constituents of leaves, flowers and fruits of tunisian dog rose (Rosa canina L.). Riv. Ital. Sostanze Gr. 2010, 87, 117–123. [Google Scholar]
  43. Abdel-Hameed, E.S.S.; Bazaid, S.A.; Salman, M.S. Characterization of the phytochemical constituents of Taif rose and its antioxidant and anticancer activities. Biomed. Res. Int. 2013, 2013, 345465. [Google Scholar] [CrossRef] [PubMed] [Green Version]
  44. Bikbulatova, T.N.; Beisekova, K.D. Chemical composition of the fruit of Rosa platyacantha. Khimiya Prir. Soedin. 1979, 3, 420–421. [Google Scholar]
  45. Bikbulatova, T.N.; Erzhanova, M.S.; Terent’ev, P.B.; Beisekova, K.D.; Seifullina, A.A. hydrolyzable tannin substance from the fruit of Rosa platyacantha. Chem. Nat. Compd. 1985, 21, 789–791. [Google Scholar] [CrossRef]
  46. Hussein, S.A.M.; Barakat, H.H.; Merfort, I.; Nawwar, M.A.M. Tannins from the leaves of Punica granatum. Phytochemistry 1997, 45, 819–823. [Google Scholar] [CrossRef]
  47. Wang, X.; Xing, D.; Ding, Y.; Chen, Y.; Meng, Z.; Du, L. Determination and pharmacokinetic study of brevifolin in rat after ig administration of pomegranate leaf extract. Chin. Pharmacol. Bull. 2005, 2, 369–372. [Google Scholar]
  48. Sójka, M.; Janowski, M.; Grzelak-Błaszczyk, K. Stability and transformations of raspberry (Rubus idaeus L.) ellagitannins in aqueous solutions. Eur. Food Res. Technol. 2019, 245, 1113–1122. [Google Scholar] [CrossRef] [Green Version]
  49. Fujii, T.; Saito, M. Inhibitory effect of quercetin isolated from rose hip (Rosa canina L.) against melanogenesis by mouse melanoma cells. Biosci. Biotechnol. Biochem. 2009, 73, 1989–1993. [Google Scholar] [CrossRef] [Green Version]
  50. Dai, J.; Mumper, R.J. Plant Phenolics: Extraction, Analysis and Their Antioxidant and Anticancer Properties. Molecules 2010, 15, 7313–7352. [Google Scholar] [CrossRef]
  51. Imokawa, G.; Ishida, K. Biological mechanisms underlying the ultraviolet radiation-induced formation of skin wrinkling and sagging I: Reduced skin elasticity, highly associated with enhanced dermal elastase activity, triggers wrinkling and sagging. Int. J. Mol. Sci. 2015, 16, 7753–7775. [Google Scholar] [CrossRef] [Green Version]
  52. Tundis, R.; Loizzo, M.R.; Bonesi, M.; Menichini, F. Potential role of natural compounds against skin aging. Curr. Med. Chem. 2015, 22, 1515–1538. [Google Scholar] [CrossRef]
  53. Jiratchayamaethasakul, C.; Ding, Y.; Hwang, O.; Im, S.-T.; Jang, Y.; Myung, S.-W.; Lee, J.M.; Kim, H.-S.; Ko, S.-C.; Lee, S.H. In vitro screening of elastase, collagenase, hyaluronidase, and tyrosinase inhibitory and antioxidant activities of 22 halophyte plant extracts for novel cosmeceuticals. Fish Aquatic. Sci. 2020, 23, 6. [Google Scholar] [CrossRef]
  54. Mawarni, E.; Ginting, C.N.; Chiuman, L.; Girsang, E.; Handayani, R.; Siwianti, A.; Widowati, W. Antioxidant and Elastase Inhibitor Potential of Petals and Receptacle of Rose Flower (Rosa damascena). Pharm. Sci. Res. 2020, 7, 105–113. [Google Scholar] [CrossRef]
  55. Choi, E.K.; Guo, H.; Choi, J.K.; Jang, S.K.; Shin, K.; Cha, Y.S.; Choi, Y.; Seo, D.W.; Lee, Y.B.; Joo, S.S.; et al. Extraction conditions of white rose petals for the inhibition of enzymes related to skin aging. Lab. Anim. Res. 2015, 31, 148–152. [Google Scholar] [CrossRef] [Green Version]
  56. Thring, T.S.; Hili, P.; Naughton, D.P. Anti-collagenase, anti-elastase and anti-oxidant activities of extracts from 21 plants. BMC Complement. Altern Med. 2009, 9, 27. [Google Scholar] [CrossRef] [Green Version]
  57. Kanlayavattanakul, M.; Lourith, N. Skin hyperpigmentation treatment using herbs: A review of clinical evidences. J. Cosmet. Laser Ther. 2018, 20, 123–131. [Google Scholar] [CrossRef]
  58. Pillaiyar, T.; Manickam, M.; Namasivayam, V. Skin whitening agents: Medicinal chemistry perspective of tyrosinase inhibitors. J. Enzyme Inhib. Med. Chem. 2017, 32, 403–425. [Google Scholar] [CrossRef] [Green Version]
  59. Jensen, J.D.; Dunn, J.H.; Luo, Y.; Liu, W.; Fujita, M.; Dellavalle, R.P. Ellagic acid inhibits melanoma growth in vitro. Dermatol. Rep. 2011, 3, e36. [Google Scholar] [CrossRef]
  60. Lo, C.; Lai, T.Y.; Yang, J.H.; Yang, J.S.; Ma, Y.S.; Weng, S.W.; Chen, Y.Y.; Lin, J.G.; Chung, J.G. Gallic acid induces apoptosis in A375.S2 human melanoma cells through caspase-dependent and -independent pathways. Int. J. Oncol. 2010, 37, 377–385. [Google Scholar]
  61. Yang, J.; Xiao, P.; Sun, J.; Guo, L. Anticancer effects of kaempferol in A375 human malignant melanoma cells are mediated via induction of apoptosis, cell cycle arrest, inhibition of cell migration and downregulation of m-TOR/PI3K/AKT pathway. J. BUON 2018, 23, 218–223. [Google Scholar]
  62. Harris, Z.; Donovan, M.G.; Branco, G.M.; Limesand, K.H.; Burd, R. Quercetin as an Emerging Anti-Melanoma Agent: A Four-Focus Area Therapeutic Development Strategy. Front. Nutr. 2016, 3, 48. [Google Scholar] [CrossRef]
  63. Chhabra, G.; Ndiaye, M.A.; Garcia-Peterson, L.M.; Ahmad, N. Melanoma chemoprevention: Current status and future prospects. Photochem. Photobiol. 2017, 93, 975–989. [Google Scholar] [CrossRef] [Green Version]
  64. Liu, W.; Li, S.-Y.; Huang, X.-E.; Cui, J.-J.; Zhao, T.; Zhang, H. Inhibition of tumor growth in vitro by a combination of extracts from Rosa roxburghii Tratt and fagopyrum cymosum. Asian Pac. J. Cancer Prev. 2012, 13, 2409–2414. [Google Scholar] [CrossRef] [Green Version]
  65. Fukumoto, L.R.; Mazza, G. Assessing antioxidant and prooxidant activities of phenolic compounds. J. Agric. Food Chem. 2000, 48, 3597–3604. [Google Scholar] [CrossRef]
  66. Matejić, J.S.; Džamić, A.M.; Mihajilov-Krstev, T.M.; Ranđelović, V.N.; Krivošej, Z.D.; Marin, P.D. Total phenolic and flavonoid content, antioxidant and antimicrobial activity of extracts from Tordylium maximum. J. Appl. Pharm. Sci. 2013, 3, 55–59. [Google Scholar]
  67. Re, R.; Pellegrini, N.; Proteggente, A.; Pannala, A.; Yang, M.; Rice-Evans, C. Antioxidant activity applying an improved ABTS radical cation decolorization assay. Free Radic. Biol. Med. 1999, 26, 1231–1237. [Google Scholar] [CrossRef]
  68. Wang, Y.; Hao, M.-M.; Sun, Y.; Wang, L.-F.; Wang, H.; Zhang, Y.-J.; Li, H.-Y.; Zhuang, P.-W.; Yang, Z. Synergistic Promotion on Tyrosinase Inhibition by Antioxidants. Molecules 2018, 23, 106. [Google Scholar] [CrossRef] [Green Version]
  69. Uchida, R.; Ishikawa, S.; Tomoda, H. Inhibition of tyrosinase activity and melanin pigmentation by 2-hydroxytyrosol. Acta Pharm. Sin. B 2014, 4, 141–145. [Google Scholar] [CrossRef] [Green Version]
  70. Horng, C.; Wu, H.C.; Chiang, N.N.; Lee, C.F.; Huang, Y.S.; Wang, H.Y.; Yang, J.S.; Chen, F.A. Inhibitory effects of burdock leaves on elastase and tyrosinase activity. Exp. Ther. Med. 2017, 14, 3247–3252. [Google Scholar] [CrossRef] [Green Version]
  71. Repetto, G.; del Peso, A.; Zurita, J.L. Neutral red uptake assay for the estimation of cell viability/cytotoxicity. Nat. Protoc. 2008, 3, 1125–1131. [Google Scholar] [CrossRef]
  72. Wu, D.; Yotnda, P. Production and detection of reactive oxygen species (ROS) in cancers. J. Vis. Exp. 2011, 57, 3357. [Google Scholar] [CrossRef] [PubMed]
Figure 1. The effect of R1–R5 R. platyacantha extracts on the intracellular ROS levels in HaCaT keratinocytes treated for 60 min with 1 mM H2O2; nt—no pre-treatment, NAC—2 mM N-acetylcysteine; values on graph represent mean ± SD (n = 3), *** p < 0.001, * p < 0.05 in comparison with “nt + H2O2” sample.
Molecules 26 02578 g001
Figure 2. Elastase (a) and collagenase (b) inhibitory activity of R1–R5 extracts from various parts of R. platyacantha, 1,10-phenantroline (1,10-Phe) was used as inhibitor control; values on graphs represent means ± SD (n = 3), *** p < 0.001, ** p < 0.01, * p < 0.05.
Molecules 26 02578 g002
Figure 3. Inhibition of monophenolase (a) and diphenolase (b) activity of tyrosinase by R1–R5 extracts from various parts of R. platyacantha; KA- kojic acid, values on graphs represent mean ± SD (n = 3), *** p < 0.001, ** p < 0.01, * p < 0.05.
Molecules 26 02578 g003
Figure 4. Inhibition of monophenolase (a) and diphenolase (b) activity of tyrosinase by C-I fractions of closed flower extract (R3) of R. platyacantha KA- kojic acid, values on graphs represent mean ± SD (n = 3), *** p < 0.001.
Molecules 26 02578 g004
Figure 5. Inhibition of monophenolase (a) and diphenolase (b) activity of tyrosinase by main constituents identified in fraction E from extract R3, values on graphs represent mean ± SD (n = 3), *** p < 0.001.
Molecules 26 02578 g005
Table 1. Comparison of the total phenolics and flavonoids content and antiradical activity of R1–R5 extracts from various parts of R. platyacantha; each value represents mean ± SD (n = 3).
R1R2R3R4R5Vitamin C
Total phenolic
(mg GAE/g dw)
8.61 ± 0.1814.53 ± 0.1813.30 ± 0.1614.05 ± 0.2813.68 ± 0.27-
Flavonoids
(mg QE/g dw)
2.42 ± 0.052.45 ± 0.032.42 ± 0.052.49 ± 0.092.03 ± 0.06-
DPPH Scavenging
(IC50, µg/mL)
2.77 ± 0.051.68 ± 0.251.50 ± 0.191.59 ± 0.141.10 ± 0.340.96 ± 0.05
ABTS Scavenging
(IC50, µg/mL)
16.16 ± 1.267.16 ± 0.2210.83 ± 0.859.89 ± 0.839.21 ± 0.540.97 ± 0.06
Table 2. Compounds found in R. platyacantha R1–R5 extracts after HPLC/ESI-QTOF-MS analysis in negative ion mode; the relative content of identified compounds was indicated as high (+++), moderate (++), or low (+) based on the peak’s surface area in corresponding chromatograms (Figure S1).
NoRetention TimeNameFormulaMolecular Ion [M − H]Fragmentation IonsR1R2R3R4R5
11.920Quinic acid C7H12O6191.0581173.0438; 127.0426; 109.0287++++++++++++++
22.507Citric acid C₆H₈O₇ 191.0362173.0119; 111.0086+++++
32.955Gallic acid glucoside isomerC13H16O10331.0683271.0432; 169.0143; 125.0230++-++
43.396Homoisocitric acidC7H10O7205.0373173.0207; 155.0111; 111.0145+----
54.092Gallic acid C7H6O5169.0147125.0258; 107.0141+++++++
64.530TheogallinC14H16O10343.0685191,0497; 127.0389+++++++++
76.495Gallic acid glucoside isomerC13H16O10331.0659169.0139; 125.0222+++++
87.826Gallic acid derivativeC23H19O18581.0449313.0490; 169.0104+-+-+
99.877Methoxygallic glucoside isomerC14H18O10345.0820183.0275; 124.0151+-+--
1010.127Chlorogenic acidC16H18O9353.0867191.0373; 135.0308; 109.0238-+-++++
1111.639Methoxygallic acid isomerC8H10O6183.0453168.0215; 124.0238+++++++++++
1213.378Ellagic acid derivativeC34H26O22783.0488300.9905; 275.0111; 249.0302+-+-+
1316.619Ellagitanin derivativeC30H24O25785.0836300.9934; 275.0111; 249.0375; 169.0107+++--
1417.214Ellagitannin derivativeC34H26O22785.0836300.9981; 275.0185; 249.0428; 162.0121; 125.0163+----
1517.255Cryptochlorogenic acidC16H18O9353.0496191.0380; 179.0113; 173.0244; 135.0268++-+-
1617.559StrictininC27H22O18633.0723300.9669; 247.9903; 249.0121; 168.9972; 125.0082-++++
1719.218Brevifolin carboxylic acidC13H8O8291.0133247.0116; 205.0041+++++++++
1820.860BrevifolinC12H7O6247.0235201.0169; 190.0258; 173.0207; 145.0278; 135.0421+++++
1921.130Methyl brevifolincarboxylateC14H10O8305.0290273.0069; 245.0075; 217.0119; 189.0166; 161.0237; 145.0269; 133.0273; 117.0349++++++++++++
2023.021Quercetin galloylglucoside isomerC28H24O16615.1014463.0872; 300.0281; 271.0297; 255.0269; 169.0140; 151.0020; 124.0151; 107.0091+++++
2123.281Quercetin galloylglucoside isomerC28H24O16615.1014463.0900; 300.0276; 271.0283; 255.0223; 169.0140; 150.9999; 124.0139+---+
2223.951Ellagic acid glucosideC20H16O13463.0584300.9994; 226.9924; 200.0078; 173.0221; 145.0286; 117.0374--+++++
2323.997Quercetin 3-O glucosideC21H20O12463.0896300.0254; 271.0243; 255.0273; 179.0005; 151.0029; 135.0105; 108.0183+++--
2424.351Ellagic acidC14H6O8 301.0003283.9966; 245.0068; 201.0123; 173.0243; 145.0273; 117.0332+----
2525.490Quercetin glucuronideC21H18O13477.0700301.0350; 255.0315; 178.9994; 151.0048; 107.0153+++++++
2626.172DigalloylglucosideC22H12O13483.0237301.0079; 285.0134; 270.9967; 228.0068; 173.0232; 144.0312; 117.0321+-+-+
2726.326Quercetin 7-O-glucosideC21H20O12463.0896300.0280; 257.0421; 179.0005; 151.0045; 107.0183+-+-+
2828.380Quercetin galloylglucoside isomerC28H24O16615.1014301.0386; 255.0328; 179.0003; 169.0139; 151.0065; 125.0231+++++++
2929.197RutinC27H30O16609.1278463.0905; 300.0289; 271.0273; 255.0265; 179.0031; 151.0050; 107.0139++---+
3031.014Kaempferol rutinosideC27H30O15593.1105285.0352; 255.0270; 227.0305; 150.9958; 145.0285; 119.0489+-++-
3134.432KaempferolC15H10O6285.0388229.0512; 150.9980; 107.0111+----
Table 3. Cytotoxicity of R1–R5 extracts from various parts of R. platyacantha (IC50 in µg/mL).
R1R2R3R4R5
HaCaT>500180.60241.40304.30293.90
A365>500120.4097.31199.5072.90
SH4>500149.70169.00129.90142.00
B16F10>500226.10187.30136.80174.20
Table 4. Comparison of the chemical composition of the fractions C-I obtained from extract R3 after HPLC/ESI-QTOF-MS analysis in negative ion mode; the relative content of identified compounds was indicated as high (+++), moderate (++), and low (+) based on the surface areas of the peaks in corresponding chromatograms (Figure S2).
NoRetention TimeNameFormulaCDEFGHI
11.920Quinic acid C7H12O6----+++
22.507Citric acid C₆H₈O₇ -------
32.955Gallic acid glucoside isomerC13H16O10---++--
43.396Homoisocitric acidC7H10O7----+--
54.092Gallic acid C7H6O5-+++++++++
64.530TheogallinC14H16O10----+++
76.495Gallic acid glucoside isomerC13H16O10--++---
87.826Gallic acid derivativeC23H19O18---+---
99.877Methoxygallic acid glucoside isomerC14H18O10--+++---
1010.127Chlorogenic acidC16H18O9---+---
1111.639Methoxygallic acid isomerC8H10O6++++++++-+++
1213.378Ellagic acid derivativeC34H26O22--++---
1316.619Ellagitanin derivativeC30H24O25--+----
1417.214Ellagitannin derivativeC34H26O22---+-+-
1517.255CryptochlorogenicC16H18O9-------
1617.559StrictininC27H22O18---+---
1719.218Brevifolin carboxylic acidC13H8O8---++++
1820.860Brevifolin C12H7O6--+-+++
1921.130Methyl brevifolincarboxylateC14H10O8--+++++
2023.021Quercetin galloylglucoside isomerC28H24O16--+----
2123.281Quercetin galloylglucoside isomerC28H24O16--+----
2223.951Ellagic acid glucosideC20H16O13-------
2323.997Quercetin 3-O glucosideC21H20O12--+++++
2424.351Ellagic acidC14H6O8-------
2525.490Quercetin glucuronideC21H18O13---++++
2626.172DigalloylglucosideC22H12O13--+----
2726.326Quercetin 7-O-glucosideC21H20O12-------
2828.380Quercetin galloylglucoside isomerC28H24O16--+++-+
2929.197Rutin C27H30O16--++---
3031.014Kaempferol rutinoside C27H30O15--++---
3134.432KaempferolC15H10O6-------
Table 5. DPPH and ABTS scavenging activity of C-I fractions of flower buds extract (R3) of R. platyacantha (IC50, µg/mL ± SD); each value represents mean ± SD (n = 3).
CDEFGHI
DPPH Scavenging11.99 ± 0.962.60 ± 0.102.17 ± 0.046.86 ± 0.503.87 ± 0.265.89 ± 0.605.14 ± 0.57
ABTS Scavenging2 510.00 ± 449.814.77 ± 0.104.30 ± 0.5513.87 ± 0.058.52 ± 0.2711.14 ± 0.9110.39 ± 0.19
Table 6. Cytotoxicity of C-I fractions of closed flower extract (R3) of R. platyacantha (IC50, µg/mL).
CDEFGHI
HaCaT251.50137.60190.70>500>500>500>500
A375170.6070.30205.80>500>500>500>500
Table 7. Extracts prepared from various parts of Rosa platyacantha Schrenk.
Extract SymbolR1R2R3R4R5
R. platyacantha partFlowersLeavesClosed flowers (buds)Leaves with stemsFlowers without petals
Publisher’s Note: MDPI stays neutral with regard to jurisdictional claims in published maps and institutional affiliations.

