Article

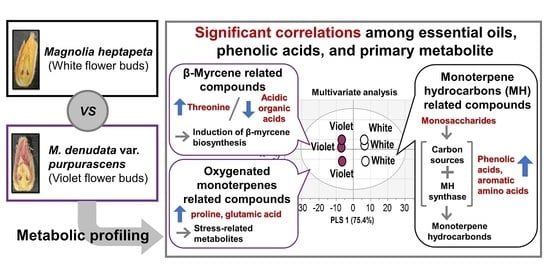
Profiles of Essential Oils and Correlations with Phenolic Acids and Primary Metabolites in Flower Buds of Magnolia heptapeta and Magnolia denudata var. purpurascens

Biodiversity Research Institute, Jeju Technopark, Seogwipo, Jeju 63608, Korea
*
Author to whom correspondence should be addressed.
Submission received: 4 December 2021 / Revised: 28 December 2021 / Accepted: 28 December 2021 / Published: 30 December 2021

Abstract

:
Magnolia flower buds are a source of herbal medicines with various active compounds. In this study, differences in the distribution and abundance of major essential oils, phenolic acids, and primary metabolites between white flower buds of Magnolia heptapeta and violet flower buds of Magnolia denudata var. purpurascens were characterised. A multivariate analysis revealed clear separation between the white and violet flower buds with respect to primary and secondary metabolites closely related to metabolic systems. White flower buds contained large amounts of monoterpene hydrocarbons (MH), phenolic acids, aromatic amino acids, and monosaccharides, related to the production of isoprenes, as MH precursors, and the activity of MH synthase. However, concentrations of β-myrcene, a major MH compound, were higher in violet flower buds than in white flower buds, possibly due to higher threonine levels and low acidic conditions induced by comparatively low levels of some organic acids. Moreover, levels of stress-related metabolites, such as oxygenated monoterpenes, proline, and glutamic acid, were higher in violet flower buds than in white flower buds. Our results support the feasibility of metabolic profiling for the identification of phytochemical differences and improve our understanding of the correlated biological pathways for primary and secondary metabolites.

Graphical Abstract

1. Introduction

Magnolia is the largest genus in the family Magnoliaceae, with 210 flowering plants distributed in East and Southeast Asia [1]. Among many members of the genus, Magnolia heptapeta (Buc’hoz) Dandy and Magnolia denudata var. purpurascens (Maxim.) Rehder & E.H. Wilson are widely used as ornamental trees in South Korea; these species are characterised by highly fragrant and large cup-shaped flowers [2]. Furthermore, these two Magnolia species are regarded as medicinal plants owing to their multiple biological effects, including antioxidant, antidermatophytic, and antimicrobial activities [3,4]. M. heptapeta is utilised commercially due to its pharmacological safety, and M. denudata var. purpurascens is a natural source of medicinal products with no side effects [4,5].
The dried flower buds of Magnolia, commonly called Flos Magnoliae (also called Shin-I or Xin-yi), are a traditional herbal medicine used for the treatment of headaches, nasal congestion, gastrointestinal disorders, anxiety, and allergic rhinitis [6,7]. Previous studies have shown that various biological activities of Magnolia flower buds are related to their secondary metabolites, including essential oils and phenolic acids [7,8,9]. Although Magnolia essential oil possesses only a small fraction of the total secondary metabolites in the species, it is regarded as one of the major biologically active substances [7,10,11]. Phenolic acids are natural antioxidants in many herbal plants [12]. In addition, these secondary metabolites are commonly produced by central primary metabolic pathways, such as glycolysis, tricarboxylic acid (TCA) cycle, and amino acid and phenylpropanoid pathways. Thus, capturing the relevant primary and secondary metabolic profiles is important for understanding variation and divergence in the relative compositions of medicinal plants and for enhancing organoleptic and nutritional traits [13].
Metabolic profiling is widely employed to provide a holistic view of the chemical constituents of various medicinal plants [14,15,16]. Combined with chemometric and statistical techniques, such as principal component analysis (PCA), partial least-squares discriminant analysis (PLS-DA), and correlation analyses, metabolomics provides a comprehensive overview of metabolic data and biological processes [17,18]. These approaches are useful for obtaining information about relationships between primary and secondary metabolism by the detection of differences in phytochemical contents related to metabolic networks [18].
The relationship between phenolics and primary metabolites in white and violet Magnolia flowers has been investigated by metabolic profiling [19]. However, to the best of our knowledge, metabolic profiling data for phenolic acids and primary metabolites in combination with essential oils in M. heptapeta and M. denudata var. purpurascens flower buds have not been reported. Hence, the objective of this study was to evaluate the interactions between major secondary metabolites (essential oils and phenolic acids) and low-molecular-weight primary metabolites (amino acids, organic acids, sugars, sugar alcohols, and an inorganic acid) in M. heptapeta and M. denudate var. purpurascens flower buds. In this study, essential oils and low-molecular-weight primary metabolites were analysed by gas chromatography-mass spectrometry (GC-MS), and phenolic acids were quantified by high-performance liquid chromatography (HPLC). Furthermore, metabolic differences were assessed by multivariate analyses, including PCA and PLS-DA. A correlation analysis was performed to evaluate the relationships among metabolites, and metabolic mapping was conducted to investigate the differences in metabolites related to metabolic pathway. The profiles of essential oils, phenolic acids, and primary metabolites in M. heptapeta and M. denudata var. purpurascens flower buds may help in understanding the relationship among these metabolites.

2. Results and Discussion

2.1. Composition and Contents of Essential Oils

The capacity to produce essential oils varies greatly among medicinal plant species [20]. Moreover, the constituents of volatile oils differ among Magnolia genotypes [9]. In this study, the composition and contents of essential oils were compared in two types of Magnolia flower buds by GC-MS (Figure S1). The essential oil yields of white and violet flower buds were 0.35% and 0.2% (w/w), respectively. These results revealed that the hydro-distillation of white and violet flower buds generated different essential oil yields.
GC-MS data indicated that 30 compounds accounted for 93.24% and 87.51% of compounds in white and violet flower buds, respectively. The area percentages and retention indices (RI) of the identified compounds are presented in Table 1. The dominant constituents of the essential oils were monoterpene hydrocarbons (MHs), accounting for 58% of compounds in white flower buds and 54% in violet flower buds. The most notable difference was the percentage of β-myrcene, which was 1.73-times higher in violet flower buds (17.19%) than in white flower buds (9.94%). This compound has many biological activities, including antioxidant, anti-inflammatory, anticancer, analgesic, and anti-aging effects [21]. However, the concentrations of α-pinene and β-pinene were 1.31- and 1.68-times higher in white flower buds (6.33% and 12.92%) than in violet flower buds (4.83% and 7.67%, respectively). The sabinene content was slightly higher in white flower buds (15.19%) than in violet flower buds (14.98%). The detection of α-pinene, β-pinene, and sabinene in Magnolia flower buds, which have important physiological effects and practical applications, is consistent with previous findings. Research on essential oils of Magnolia acuminate indicated that α-pinene and β-pinene were the main constituents [22]. Moreover, in essential oil of Magnolia biondii, the major chemical components were α-pinene, β-pinene, and sabinene [23]. Regarding these compounds, another study found that α-pinene and β-pinene contents have significantly positive correlations with those of sabinene [24].
Oxygenated monoterpenes (MO), sesquiterpene hydrocarbons (SH), and oxygenated sesquiterpenes (SO) were present at low percentages in Magnolia essential oils. MO contents in white and violet flower buds were 10.64% and 14.82%, respectively (Table 1). Among MO, 1,8-cineole was dominant, with percentages of 7.59% in white flower buds and 11.61% in violet flower buds. This is consistent with previous reports revealing that the major MO compound in Magnolia flower buds is 1,8-cineole, which has antimicrobial and anti-inflammatory properties [6,25]. SH was also evaluated as a constituent of the essential oils in white and violet flower buds at 14.53% and 14.51%, respectively. The primary SH in Magnolia flower buds is germacrene D, which exhibits antimicrobial activity [26]. However, there was no significant difference in the content of germacrene D between violet flower buds (7.99%) and white flower buds (7.73%). SO contents in white and violet flower buds were 10.14% and 4.54%, respectively. α-Eudesmol and β-eudesmol, two major SO compounds, showed higher values in white flower buds (2.04% and 3.66%, respectively) than in violet flower buds (0.43% and 0.91%, respectively). Previous studies have demonstrated that β-eudesmol has diverse pharmacological activities, such as anticancer and anti-inflammatory effects, as well as effects on the nervous system [27,28].

2.2. Quantification of Phenolic Acids by HPLC

Together with essential oil compounds, phenolic acids are regarded as efficient natural components in medicinal plants with protective effects against oxidative stress [29]. In addition, the dynamic accumulation of essential oils is correlated with the biosynthesis of phenolic acids during plant growth [30,31]. Thus, phenolic acids isolated from white and violet-coloured Magnolia flower buds were analysed by HPLC (Figure S2 and Table 2). Six phenolic acid compounds (chlorogenic acid, caffeic acid, coumaric acid, rutin, ferulic acid, and cinnamic acid) were present in white and violet Magnolia flower buds. The dominant phenolic acid identified in the Magnolia flower buds was rutin, which has been used as an active component in various herbal medicines with various physiological functions, such as antioxidant, antibacterial, anti-inflammatory, antiallergic, and antiviral activities [32]. In this study, the level of rutin was 1.60-times higher in white flower buds (69.14 ± 4.63 mg/g dry weight (wt.)) than in violet flower buds (43.20 ± 2.76 mg/g (wt.)). Park et al. previously reported that rutin is the predominant phenolic compound in Magnolia flowers, but violet flowers contain higher amounts of rutin than those in white flowers [19]. These differences in rutin contents among studies are not surprising because phytochemical contents may be affected by various factors, including genetic variation, growth stage, climate, and location [33].
The second most abundant phenolic acid in Magnolia flower buds was chlorogenic acid, which is found in various medicinal plants and has beneficial properties, such as antioxidant, hypoglycaemic, antiviral, and hepatoprotective activities [34]. We detected higher levels of chlorogenic acid in violet flower buds (4.37 ± 0.08 mg/g (wt.)) than in white flower buds (3.55 ± 0.29 mg/g (wt.)). This result is consistent with that of Park et al. [19]. The caffeic acid and ferulic acid concentrations were also higher in violet flower buds than in white flower buds; however, the amounts in both forms of flower bud were remarkably low. Concentrations of other minor compounds, i.e., coumaric acid and cinnamic acid, were higher in white flower buds than in violet flower buds.

2.3. Metabolic Profiling of Magnolia Flower Buds by PCA

Low-molecular-weight primary metabolites, such as amino acids, organic acids, sugars, and sugar alcohols, generally assemble the building blocks of secondary metabolites and are closely linked to plant metabolism [35]. However, it is not clear how these primary metabolites are linked to functional secondary metabolites (essential oils and phenolic acids) in Magnolia flower buds. For the comprehensive profiling of primary and secondary metabolites in Magnolia flower buds, 18 amino acids, 7 organic acids, 6 sugars, 2 sugar alcohols, 1 phenolic acid, and 1 inorganic acid were evaluated by GC-MS (Figure S3 and Table S1). Thus, data for 34 primary metabolites and 37 secondary metabolites were collected from white and violet flower buds.
PCA was applied to the entire dataset to determine the overall clustering pattern of two types of samples based on differences in primary and secondary metabolites (Figure 1). PCA, a well-known unsupervised technique, is widely used as a first step to objectively interpret and compare large-scale metabolic data [36]. The PCA score plot revealed that the first two principal components (PCs) explained 91.9% of the total variance (Figure 1A). In addition, PC1 explained 75.4% of the variance, clearly resolving samples into two groups corresponding to white and violet flower buds. To further investigate the main metabolites responsible for the separation between the two groups, PCA loadings were inspected (Figure 1B). Most MH, SO, phenolic acids, aromatic amino acids, and monosaccharides clustered on the right side of the loading plot, showing that these compounds were more abundant in white flower buds than in violet flower buds. The representative metabolites positive for PC1 were β-pinene, β-eudesmol, rutin, tryptophan, and galactose with eigenvector values of 0.1365, 0.1365, 0.1334, 0.1327, and 0.1359, respectively. MO, polysaccharides, serine-threonine metabolism-related amino acids, and proline metabolism-related amino acids were grouped on the left side of the loading plots, indicating higher amounts of these metabolites in violet flower buds. Notably, the metabolites that contributed negatively to PC1 were 1,8-cineole, sucrose, threonine, and proline with eigenvector values of −0.1362, −0.1315, −0.1276, and −0.1203, respectively. Our results agree with previous studies and corroborate findings that higher amounts of monosaccharides were found in white coloured Magnolia for production of phenolic acids while polysaccharides were hydrolysed into monosaccharides for use as an energy source [19,35].
Overall, the PCA results indicated that most MH, SO, phenolic acids, aromatic amino acids, and monosaccharides were more abundant in white flower buds than in violet flower buds. In contrast, the amounts of MO, polysaccharides, serine-threonine metabolism-related amino acids, and proline metabolism-related amino acids were higher in violet flower buds than in white flower buds.

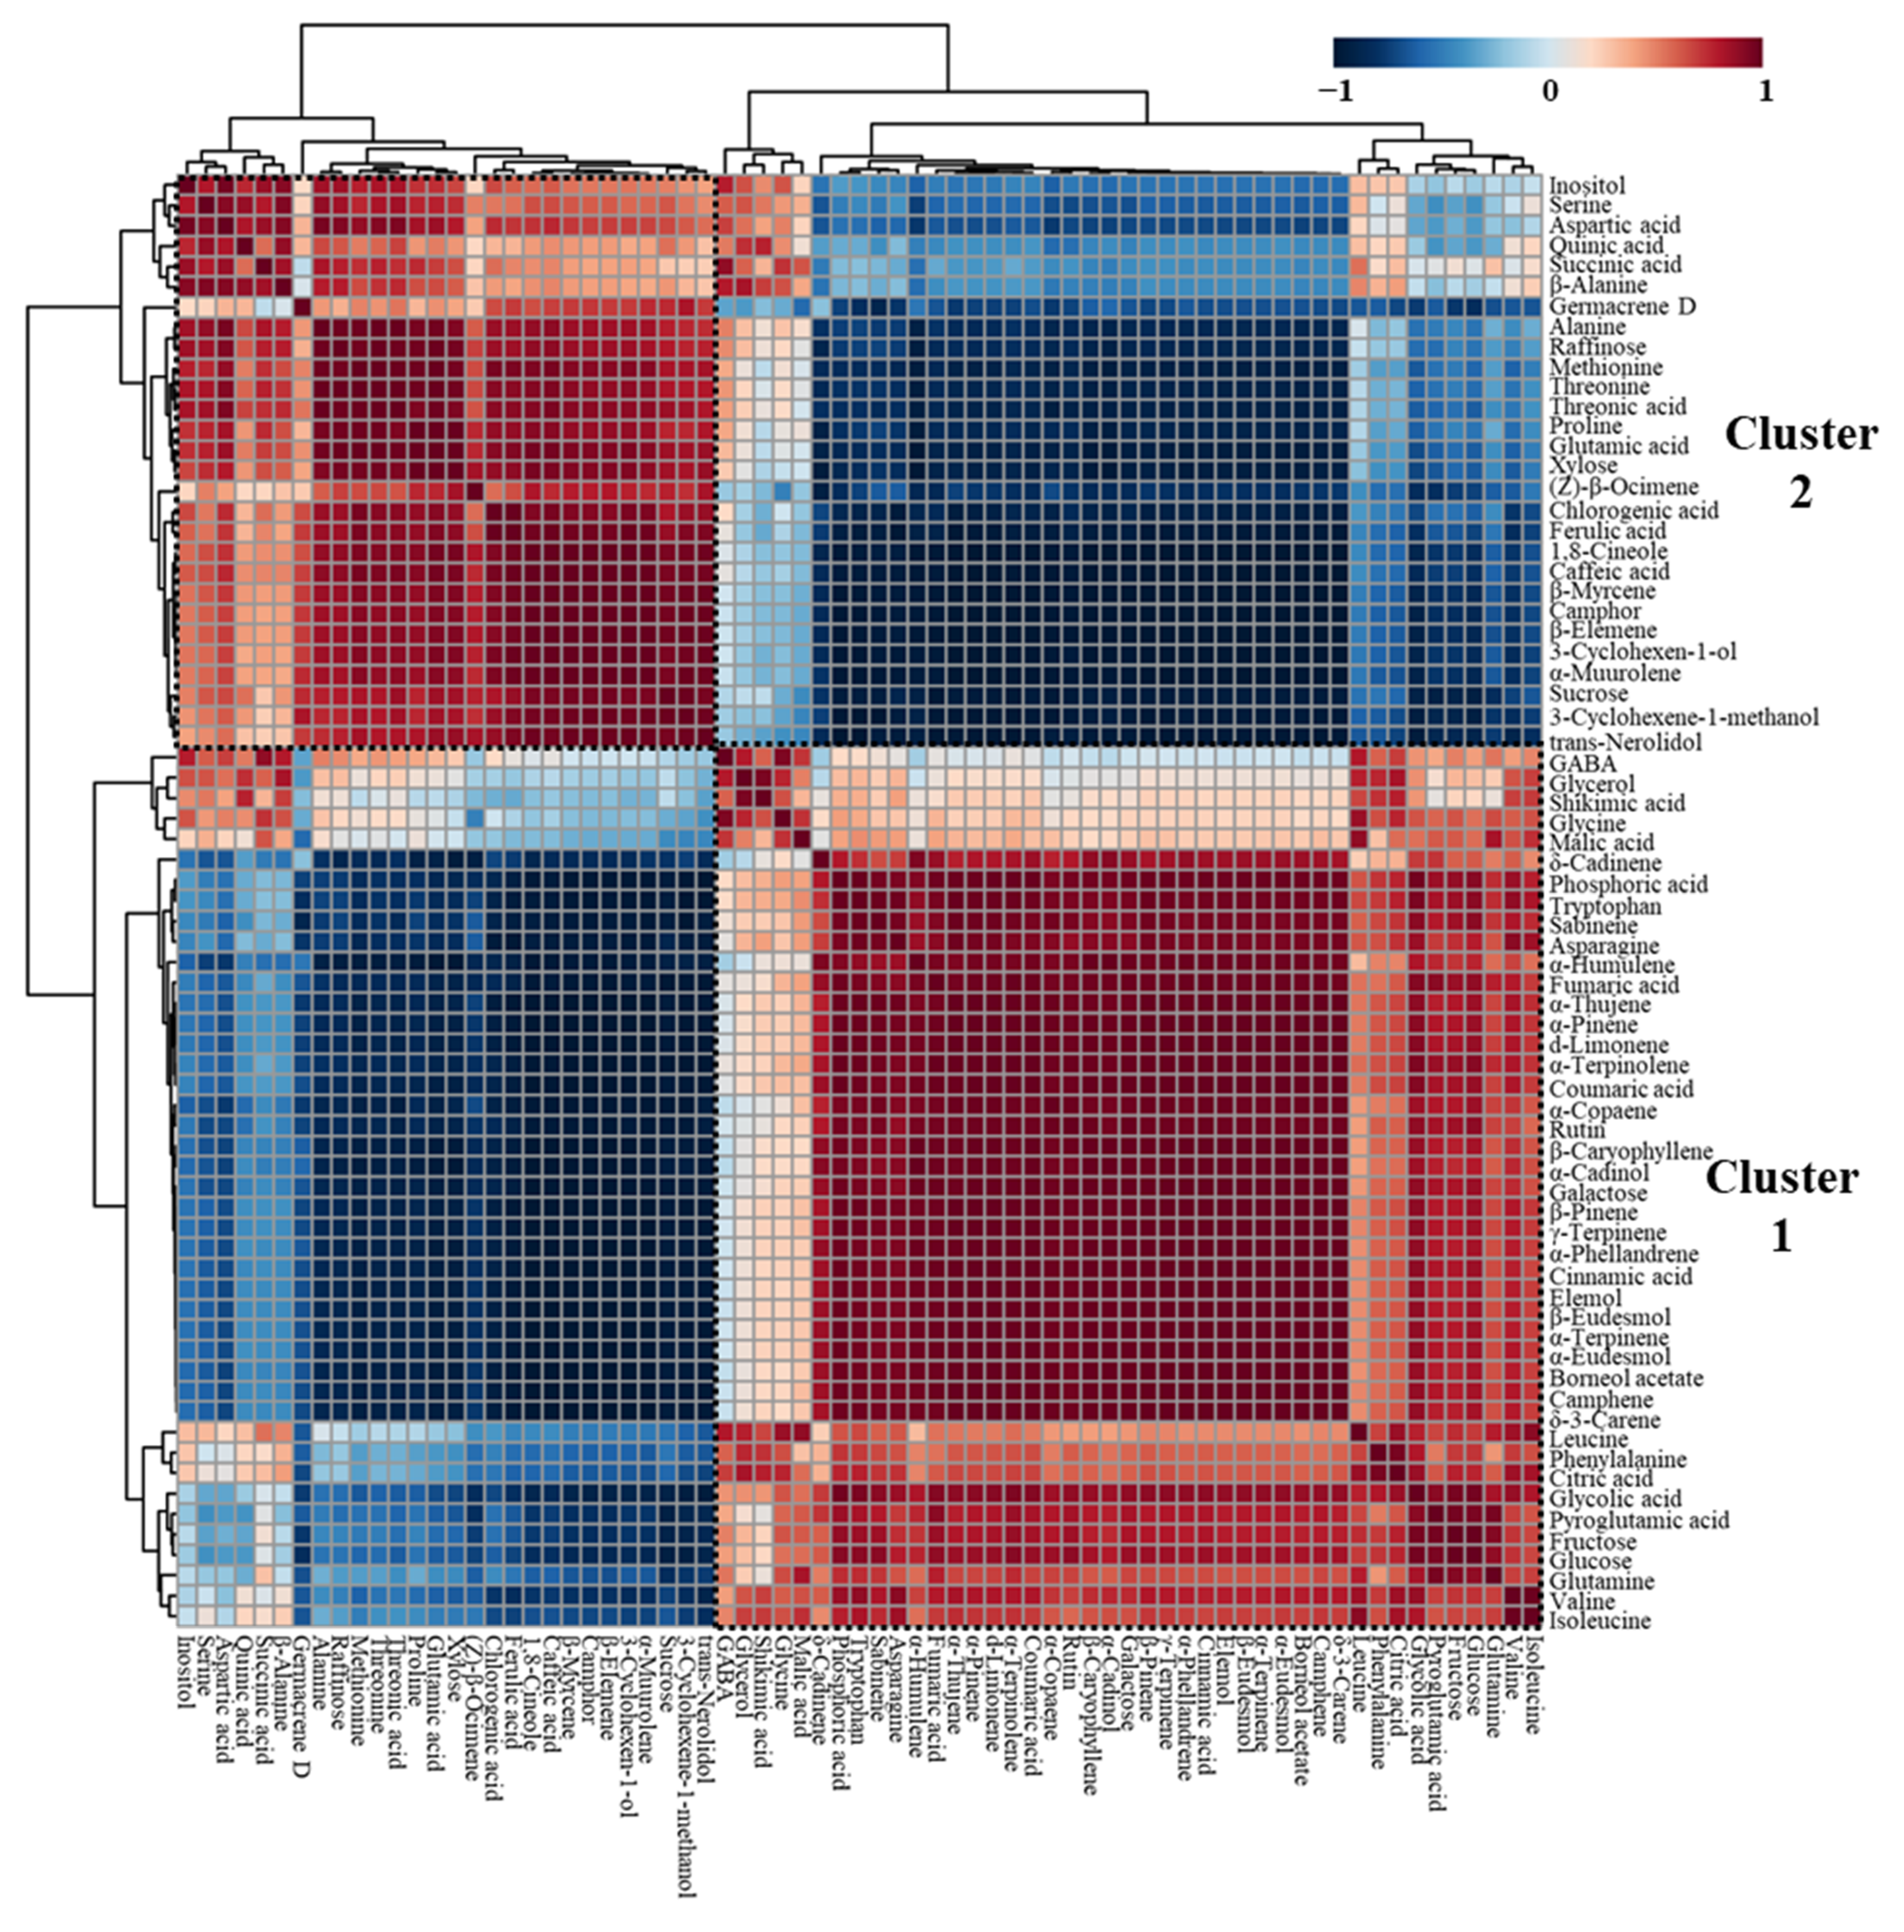
2.4. Correlations among Essential Oils, Phenolic Acids, and Hydrophilic Compounds

Correlation analyses based on Pearson correlation coefficients provide powerful information of relationships among metabolites [35,37]. Therefore, a hierarchical cluster analysis (HCA) with Pearson correlation coefficients was performed to understand the relationships between primary and secondary metabolites in white and violet flower buds (Figure 2, Table S2). In Figure 2, the shade of blue or red represents correlation coefficients closer to −1 or 1, respectively.
Pairwise correlations between metabolites formed two major clusters (shown in dotted lines), and metabolites from the same classes, such as MH, MO, and SO, generally clustered together. Furthermore, these outcomes were consistent with the PCA results (Figure 1B). In cluster 1, most of the MH, SO, aromatic amino acids, organic acids, monosaccharides, and several phenolic acids, which had positive values on PC1 in PCA loading plots, clustered together with positive correlations. For example, β-pinene was highly correlated with β-eudesmol (r = 0.9984, p < 0.0001), tryptophan (r = 0.9770, p = 0.0008), fumaric acid (r = 0.9714, p = 0.0012), galactose (r = 0.9900, p = 0.0002), and rutin (r = 0.9738, p = 0.0010). In addition, positively correlated metabolites in cluster 2 included most of the MO, polysaccharides, serine-threonine metabolism-related amino acids, and proline metabolism-related amino acids, and those with negative values on PC1 in PCA loading plots. For instance, 1,8-cineole was highly correlated with sucrose (r = 0.9407, p = 0.0052), threonine (r = 0.9179, p = 0.0098), and proline (r = 0.9135, p = 0.0109). However, β-myrcene, the major MH in Magnolia flower buds, was also assigned to cluster 2, rather than cluster 1. β-Myrcene was significantly positively correlated with 1,8-cineole (r = 0.9970, p < 0.0001) and was negatively correlated with β-pinene (r = −0.9996, p < 0.0001).
Overall, the observed metabolite-to-metabolite correlations reflected significant differences in metabolites between the two types of Magnolia flower buds and closely related metabolic pathways.

2.5. Classification of Magnolia Flower Buds Based On PLS-DA

Although PCA and HCA are useful tools for summarising metabolomics data, these methods have limitations in capturing the number of significantly relevant components [38,39]. Thus, we used PLS-DA to identify novel metabolites that effectively discriminated between white and violet flower buds (Figure 3). PLS-DA, a supervised technique, is suitable for maximising separation between varieties and identifying metabolite contributors for classification [38,40]. The goodness of fit in the PLS-DA model is estimated by the coefficient of determination (RX2), where a value closer to 1 indicates a good fit. The prediction accuracy of the PLS-DA model is explained by the cross-validation coefficient of determination (Q2), where values above 0.9 indicate an excellent model. We obtained RX2 and Q2 values of 0.840 and 0.994, respectively (Figure 3A). Thus, the PLS-DA clearly separated the two types of Magnolia flower buds with a high goodness of fit and reliable predictive ability.
To gain more insight into the metabolites contributing to the differences between white and violet flower buds, the variable importance in projection (VIP) scores were assessed (Figure 3B). VIP describes the residual sum of squares of the PLS weight, and values greater than 1.00 are considered highly influential. Setting VIP > 1.00 and p-value < 0.05 as thresholds, 47 metabolites effectively distinguished between white and violet flower buds (Figure S4). Moreover, a metabolic pathway map was produced to correlate relative metabolite contents of white and violet Magnolia flower buds with the biosynthetic pathway (Figure 4). The imported data was calculated by dividing the average data of violet flower buds into those of white flower buds, and then converted into log2-transformed values (log2FC). The positive and negative values of log2FC were visualised as a gradient of red and green colours, respectively. Shades of green colour represented higher amounts in white flower buds, and shades of red colour represented higher amounts in violet flower buds.
Among these influential metabolites, MH was the largest class of variables with significant discriminatory ability. Eleven MH compounds (α-thujene, α-pinene, camphene, sabinene, β-pinene, α-phellandrene, δ-3-carene, α-terpinene, limonene, γ-terpinene, and α-terpinolene) were more abundant in the white flower buds than in violet flower buds. Regarding terpene synthesis, the accumulation of carbohydrates provides carbon building blocks for isoprene production by glycolysis; these five-carbon isoprene units form the backbone structure of terpenes and are joined to C10 monoterpene and C15 sesquiterpene substrates with various synthases [41,42]. Of these enzymes, monoterpene synthase produces various cyclic and acyclic monoterpenes by multiple mechanisms involving cationic intermediates and hydride shifts; however, the enzyme activity varies substantially among different conditions [43]. In particular, aromatic amino acids and phenolic acids stabilize the synthase content and promote the rearrangement of isoprene units [44]. Interestingly, our results revealed that the levels of galactose, tryptophan, rutin, cinnamic acid, and coumaric acid were higher in white flower buds than in violet flower buds, and monosaccharides, aromatic amino acids, and phenolic acids were representative differential metabolites linked to MH synthesis. A higher concentration of galactose may be required as a carbon source to generate isoprene units. As a consecutive metabolic reaction in isoprene synthesis, MH production might be catalysed by monoterpene synthases with high levels of tryptophan, rutin, cinnamic acid, and coumaric acid in white flower buds [44].
However, we noted that only the content of β-myrcene was comparatively higher in violet flower buds. Unlike other MH shown to have higher contents in white flower buds, β-myrcene has an acyclic unsubstituted monoterpene form [45]. In addition, myrcene biosynthesis needs characteristic monoterpene synthases, and sequences of these monoterpene synthases feature higher contents of threonine and serine residues and low contents of acidic residues [43,46]. Our results also suggested that the content of threonine was elevated, whereas fumaric acid and glycolic acid, which caused acidic pH conditions, were significantly low in violet flower buds compared to white flower buds. Hence, these observations implied that higher concentration of threonine and lower concentrations of some organic acids contributed to the changes of monoterpene synthesis mechanisms, increasing β-myrcene production in violet flower buds. Furthermore, different content pattern of β-myrcene compared with other MH in Magnolia flower buds might be due to the specialized structure of this compound.
The MO group showed significant differences between Magnolia species, with higher amounts of 1,8-cineole, camphor, 3-cyclohexane-1-ol, and 3-cyclohexane-1-methanol and lower amounts of borneol acetate in violet flower buds than in white flower buds. In particular, the high abundance of 1,8-cineole, the major MO in Magnolia flower buds, normally reflects an oxidative stress response mechanism under a high level of reactive oxygen species (ROS) [47]. Stress conditions in plants can also result in the accumulation of proline, an oxidative stress biomarker [48]. Moreover, proline metabolism is usually derived from the synthesis of glutamic acid, which acts as a precursor of proline [49]. Our results showed that levels of stress-related amino acids, proline and glutamic acid, were higher in violet flower buds, and similar to levels of 1,8-cineole. Thus, we suggest that defensive mechanisms against ROS stimulate the production of oxidative stress-related MO compounds (1,8-cineole) and amino acids (proline and glutamic acid) in violet flower buds.
Various patterns were observed for SH levels. Specifically, β-caryophyllene, α-humulene, and α-coupaene were more abundant in white flower buds, and β-elemene and α-muurolene were more abundant in violet flower buds. This may be explained by the fact that sesquiterpenes generated by sesquiterpene synthases have more diverse structures and contents than those of monoterpenes due to the increased number of possible combinations with five carbons of isoprene units [50]. However, SO levels clearly differed between the two Magnolia flower buds, with significantly higher levels of β-eudesmol, α-eudesmol, α-cadinol, and elemol in white flower buds. In violet flower buds, only trans-nerolidol levels were higher than those in white flower buds. Although the significance of these metabolites is not yet apparent, these results indicated that the biosynthesis of major SO compounds was higher in white flower buds than in violet flower buds.

3. Materials and Methods

3.1. Preparation of Plant Materials

Healthy flower buds of Magnolia heptapeta (Buc’hoz) Dandy and Magnolia denudata var. purpurascens (Maxim.) Rehder & E.H. Wilson were collected in the Namwon region of Jeju, Korea, in February 2021. The harvested samples were mixed; one kilogram of each sample was stored at 4 °C to determine the chemical composition of the essential oils. To analyse phenolic acids and low-molecular-weight hydrophilic compounds, the remaining flower buds were dried in a drying oven at 45 °C for 72 h. The dried plant materials were ground into a fine powder using a grinding machine.

3.2. Essential Oil Extraction

The essential oils were isolated from 1 kg of fresh flower buds by hydrodistillation using a Clevenger-type apparatus for 8 h. The essential oils were spontaneously separated from the aqueous layer and then moved into dark vials using a pipette. The essential oil yield based on % (v/w) was calculated on a fresh weight basis. The extracted essential oils were stored at 4 °C prior to further processing [51].

3.3. Chemical Composition Analysis of Essential Oil

The constituents of the essential oils were characterised using a previously reported method with slight modifications [52]. The isolated essential oils were diluted 1:1000 (v/v) with hexane, followed by filtration through a 0.50 µm PTFE filter (Advantec, Tokyo, Japan). The samples were analysed on an Agilent 7890A GC (Agilent, Palo Alto, CA, USA) equipped with an Agilent 5975C MSD. An HP-5MS capillary column (30 m × 0.25 mm i.d. × 0.25 μm film thickness; 19091S-433, Agilent) was equipped into the GC, and helium gas was used as the carrier gas at a flow rate of 1.00 mL/min. The split ratio was set to 10:1, the injection volume was 1 μL, the injection temperature was 230 °C, the standard electronic impact (EI)-MS source temperature was 230 °C, and the MS quadrupole temperature was 150 °C. The spectral data were scanned over an m/z mass range of 50–550, and the ionisation voltage was set to 70 eV. The oven temperature was programmed with the following gradient conditions: starting at 40 °C for 2 min, followed by ramping to 250 °C at 3 °C/min, and holding at this temperature for 10 min. ChemStation (Agilent) was used to analyse the chromatograms and mass spectra. Each volatile compound was identified by comparing the retention indices to those of n-alkanes (C8-C20) reported in the literature as well as EI-MS data reported in the literature and registered by the National Institute of Standards and Technology (NIST) [53,54,55]. Peaks were assigned when the similarity was >90%. The relative percentage areas of compounds in the samples were obtained from the chromatograms by normalising the peak area.

3.4. Phenolic Acid Extraction and Analysis

Phenolic acids were extracted and analysed according to a previously reported method with slight modifications [56]. A total of 100 mg of the powdered sample was placed into a 2 mL tube and mixed with 1 mL of methanol and 200 µL of 0.1 M hydrochloric acid (HCl). The samples were vortexed for 1 min and sonicated for 1 h. Next, the mixture was centrifuged at 13,000 rpm for 10 min, and 800 µL of the supernatant was transferred into a new 2 mL tube. The samples were re-extracted by adding 1 mL of methanol to the remaining pellet. After centrifugation under the same conditions described above, the supernatant was collected, concentrated, and re-dissolved in 1 mL of methanol. The resulting extract was filtered using a 0.50 µm PTFE filter (Advantec) into amber glass screw thread vials (Agilent). Phenolic acids were separated using a Waters Alliance e2695 HPLC system (Waters Corp., Milford, MA, USA), equipped with a photodiode array detector and a Zorbax CB-C18 column (250 × 4.6 mm, 5 µm particle size; Agilent). As gradient elution solvents, 0.1% acetic acid in water (solvent A) and 0.1% acetic acid in acetonitrile (solvent B) were used. The gradient elution was processed as follows: 0 min, 92% A/8% B; 2 min, 90% A/10% B; 35 min, 70% A/30% B; 50 min, 10% A/90% B; 51 min, 0% A/100% B; 60 min, 0% A/100% B; 63 min, 92% A/8% B. The sample injection volume was 10 µL, and the column flow rate and temperature were set at 1 mL/min and 40 °C, respectively. Peaks were monitored at wavelengths of 200–400 nm, and the chromatogram was obtained at 280 nm. Each phenolic acid was identified by comparing the retention time and UV absorbance spectra with those of the standards. Quantification was performed by plotting the concentrations of the standards (2.5, 5, 10, and 20. 40, 60, and 80 ppm), and the calibration curves were drawn.

3.5. Low-Molecular-Weight Hydrophilic Compound Extraction and Analysis

The extraction and analysis of low-molecular-weight hydrophilic compounds (amino acids, organic acids, sugars, and sugar alcohols) were carried out according to a previously described method [35]. Fifteen milligrams of dried samples were added to 1 mL of methanol: chloroform: water (2.5:1:1, v/v), and 60 μL of ribitol (0.2 mg/mL in methanol) was introduced as an internal standard (IS). Thereafter, the samples were briefly vortexed and placed in a thermo shaker at 37 °C for 30 min with shaking at 1200 rpm. The tubes were centrifuged at 13,000 rpm for 3 min, and 800 μL of the supernatant was transferred into new tubes. Next, each sample was mixed with 400 μL of deionised water, followed by centrifugation at 13,000 rpm for 5 min. The upper layer of the methanol/chloroform phase was pipetted into a fresh tube and concentrated for 3 h. The residues were freeze-dried for at least 18 h at −80 °C. For the derivatisation step, the lyophilised samples were treated with 80 μL of methoxyamine hydrochloride in pyridine (2%, w/v) and incubated at 30 °C and 1200 rpm for 90 min. Next, 80 μL of N-methyl-N-(trimethylsilyl) trifluoroacetamide in pyridine was added, and the mixture was reacted at 37 °C and 1200 rpm for 30 min. Finally, the low-molecular-weight hydrophilic compounds were analysed on an Agilent 7890A GC equipped with an Agilent 5975C MSD and separated on a CP-Sil 8CB low-bleed/MS fused-silica capillary column (30 m × 0.25 mm i.d. × 0.25 μm film thickness; CP5860, Agilent). Each 1.0 µL sample was injected with a 25:1 split ratio mode. Helium gas was used as the carrier gas at a rate of 1 mL/min. The injector, MS quadrupole, and ion source temperatures were set to 230 °C, 150 °C, and 230 °C, respectively. The oven temperature was programmed as follows: 80 °C for 2 min, followed by an increase to 320 °C at a rate of 15 °C/min, and holding at this temperature for 10 min. The spectral data were scanned at m/z 85–600, and the ionisation voltage was set at 70 eV. Chromatographic data were processed using ChemStation (Agilent). The identities of the compounds were confirmed by comparing the NIST and in-house libraries. For relative quantification, peak areas of metabolites based on the IS were calculated based on the selected ions.

3.6. Statistical Analysis

The metabolite data for the Magnolia flower bud samples were obtained with three biological replicates and are presented as means ± standard deviation. The resultant data were normalised with unit variance scaling and then subjected to PCA and PLS-DA using soft independent modelling of class analogy (SIMCA) (version 17.0; Umetrics, Umeå, Sweden). PCA, an unsupervised pattern recognition technique, was applied to evaluate metabolite patterns. Moreover, PLS-DA, a supervised classification method, was conducted to reveal separation between experimental groups and to obtain insight into the factors contributing to the separation. Independent Student’s t-tests were used for comparisons of levels of metabolites between the two groups using GraphPad Prism 8 (San Diego, CA, USA), with p < 0.05 as the threshold for significance. Pearson’s correlation analysis and HCA were performed using MetaboAnalyst 5.0 (www.metaboanalyst.ca) (accessed on 9 October 2021) to reveal correlations among metabolites. PathVisio software (version 3.3.0, www.pathvisio.org) (accessed on 28 December 2021) was employed to visualize metabolic pathway maps with log2-transformed experimental data. The metabolic pathway was drawn based on the Arabidopsis thaliana pathway in WikiPathways (www.wikipathways.org) (accessed on 28 December 2021) and reference pathway in the KEGG database (www.genome.jp/kegg/pathway.html) (accessed on 27 December 2021).

4. Conclusions

We performed the first comprehensive metabolic profiling of phenolic acids and primary metabolites together with essential oils in the white flower buds of M. heptapeta and violet flower buds of M. denudata var. purpurascens. The chemical compositions of essential oils from white and violet flower buds were notably different, with higher levels of MH and SO in white flower buds and higher levels of β-myrcene and MO in violet flower buds. A multivariate analysis of data for secondary metabolites (essential oils and phenolic acids) and primary metabolites (amino acids, organic acids, sugars, sugar alcohols, and an inorganic acid) showed that metabolite differences and correlations in Magnolia flower buds depended on common or closely related metabolic pathways. In white flower buds, elevated levels of aromatic amino acids and phenolic acids led to optimum conditions for the synthesis of MH, and monosaccharides were used as building blocks of isoprene units, which construct MH. In violet flower buds, higher threonine and lower acidic organic acid levels were significantly correlated with elevated β-myrcene production. Associated with the stress response mechanism, MO and proline metabolism-related amino acid levels were higher in violet flower buds than in white flower buds. Thus, these results confirmed the value of metabolic profiling using chemometric tools for detecting significant correlations between essential oils, phenolic acids, and low-molecular-weight primary metabolites in white and violet flower buds. In addition, our results provide useful information about functional essential oils and phenolic acids in Magnolia flower buds. When Magnolia flower buds are used as foods or herbal medicines, our insights are expected to contribute to the selection of sources enriched for desired nutrients.

Supplementary Materials

The following are available online, Figure S1: Representative GC-MS chromatogram of essential oils from M. heptapeta (white) and M. denudata var. purpurascens (violet) flower buds. Peak annotation: 1, α-thujene; 2, α-pinene; 3, camphene; 4, sabinene; 5, β-pinene; 6, β-myrcene; 7, α-phellandrene; 8, δ-3-carene; 9, α-terpinene; 10, limonene; 11, 1,8-cineole; 12, (Z)-β-ocimene; 13, γ-terpinene; 14, α-terpinolene; 15, camphor; 16, 3-cyclohexen-1-ol; 17, 3-cyclohexene-1-methanol; 18, borneol acetate; 19, α-copaene; 20, β-elemene; 21, β-caryophyllene; 22, α-humulene; 23, germacrene D; 24, α-muurolene; 25, δ-cadinene; 26, elemol; 27, trans-nerolidol; 28, β-eudesmol; 29, α-eudesmol; 30, α-cadinol. Figure S2: Representative HPLC chromatogram of phenolic acids from M. heptapeta (white) and M. denudata var. purpurascens (violet) flower buds. Peak annotation: 1, chlorogenic acid; 2, caffeic acid; 3, coumaric acid; 4, rutin; 5, ferulic acid; 6, cinnamic acid. Figure S3: Representative GC-MS chromatogram of low-molecular hydrophilic compound in M. heptapeta (white) and M. denudata var. purpurascens (violet) flower buds. Peak annotation: 1, glycolic acid; 2, alanine; 3, valine; 4, glycerol; 5, phosphoric acid; 6, leucine; 7, isoleucine; 8, proline; 9, glycine; 10, succinic acid; 11, fumaric acid; 12, serine; 13, threonine; 14, β-alanine; 15, malic acid; 16, aspartic acid; 17, methionine; 18, pyroglutamic acid; 19, γ-aminobutyric acid; 20, threonic acid; 21, glutamic acid; 22, phenylalanine; 23, xylose; 24, asparagine; 25, glutamine; 26, shikimic acid; 27, citric acid; 28, quinic acid; 29, fructose-1; 30, fructose-2; 31, galactose; 32, glucose-1; 33, glucose-2; 34, inositol; 35, tryptophan; 36, sucrose; 37, raffinose. Figure S4: Box plots of significantly different metabolites (p < 0.05) between M. heptapeta (white) and M. denudata var. purpurascens (violet) flower buds. Table S1: Composition and contents (ratio/g) of low-molecular-weight hydrophilic compounds in M. heptapeta (white) and M. denudata var. purpurascens (violet) flower buds. Table S2: Results of the Pearson correlation analysis.

Author Contributions

Conceptualization, H.H., Y.-H.J. and Y.-M.H.; resources, S.C.K., B.G. and H.B.H.; methodology, H.H. and H.B.H.; formal analysis, H.H.; visualization, H.H.; writing—original draft preparation, H.H.; writing—review and editing, H.H., Y.-H.J. and Y.-M.H.; supervision, Y.-H.J. and Y.-M.H. All authors have read and agreed to the published version of the manuscript.

Funding

This research received no external funding.

Institutional Review Board Statement

Not applicable.

Informed Consent Statement

Not applicable.

Data Availability Statement

Not applicable.

Conflicts of Interest

The authors declare no conflict of interest.

Sample Availability

Samples of the compounds are not available from the authors.

References

  1. Farag, M.A.; Al-Mahdy, D.A. Comparative Study of the Chemical Composition and Biological Activities of Magnolia Grandiflora and Magnolia virginiana Flower Essential Oils. Nat. Prod. Res. 2013, 27, 1091–1097. [Google Scholar] [CrossRef]
  2. Jeong, J.-G. A Herbological Study on the Plants of Magnoliaceae in Korea. Kor. J. Herbol. 2018, 33, 57–63. [Google Scholar] [CrossRef]
  3. Bajpai, V.K.; Yoon, J.I.; Kang, S.C. Antioxidant and Antidermatophytic Activities of Essential Oil and Extracts of Magnolia liliflora Desr. Food Chem. Toxicol. 2009, 47, 2606–2612. [Google Scholar] [CrossRef]
  4. Meng, Y.; Wang, D.; Dong, Y.; Chen, X.; Wang, X. The Variation of Oxidative Stability and Sensory Attributes of Sunflower Oil Induced by Essential Oil from Magnolia liliflora Desr. during High-temperature Storage. Int. J. Food Sci. Tech. 2021, 56, 3355–3366. [Google Scholar] [CrossRef]
  5. Park, H.; Kim, H.-S.; Eom, S.J.; Kim, K.; Paik, H.-D. Antioxidative and Anticanceric Activities of Magnolia (Magnolia denudata) Flower Petal Extract Fermented by Pediococcus acidilactici KCCM 11614. Molecules 2015, 20, 12154–12165. [Google Scholar] [CrossRef] [PubMed] [Green Version]
  6. Hu, M.; Bai, M.; Ye, W.; Wang, Y.; Wu, H. Variations in Volatile Oil Yield and Composition of “Xin-Yi”(Magnolia biondii Pamp. Flower Buds) at Different Growth Stages. J. Oleo Sci. 2018, 67, 779–787. [Google Scholar] [CrossRef] [PubMed] [Green Version]
  7. Sowndhararajan, K.; Cho, H.; Yu, B.; Kim, S. Comparison of Essential Oil Compositions of Fresh and Dried Fruits of Magnolia Kobus DC. J. Appl. Pharm. Sci 2016, 6, 146–149. [Google Scholar] [CrossRef] [Green Version]
  8. Jo, Y.; Seo, G.-U.; Yuk, H.-G.; Lee, S. Antioxidant and Tyrosinase Inhibitory Activities of Methanol Extracts from Magnolia denudata and Magnolia denudata var. Purpurascens Flowers. Food Res. Int. 2012, 47, 197–200. [Google Scholar] [CrossRef]
  9. Li, Y.; Kong, D.; Fu, Y.; Sussman, M.R.; Wu, H. The Effect of Developmental and Environmental Factors on Secondary Metabolites in Medicinal Plants. Plant Physiol. Biochem. 2020, 148, 80–89. [Google Scholar] [CrossRef]
  10. Ma, Q.; Wei, R.; Zhang, X.; Sang, Z.; Dong, J. Structural Elucidation and Neuroprotective Activities of Lignans from the Flower Buds of Magnolia biondii Pamp. Z. Naturforsch. C 2021, 76, 147–152. [Google Scholar] [CrossRef]
  11. Morshedloo, M.R.; Quassinti, L.; Bramucci, M.; Lupidi, G.; Maggi, F. Chemical Composition, Antioxidant Activity and Cytotoxicity on Tumour Cells of the Essential Oil from Flowers of Magnolia Grandiflora Cultivated in Iran. Nat. Prod. Res. 2017, 31, 2857–2864. [Google Scholar] [CrossRef] [PubMed]
  12. Souri, E.; Amin, G.; Farsam, H.; Barazandeh, T.M. Screening of Antioxidant Activity and Phenolic Content of 24 Medicinal Plant Extracts. DARU 2008, 16, 83–87. [Google Scholar]
  13. Pott, D.M.; Osorio, S.; Vallarino, J.G. From Central to Specialized Metabolism: An Overview of some Secondary Compounds Derived from the Primary Metabolism for their Role in Conferring Nutritional and Organoleptic Characteristics to Fruit. Front. Plant Sci. 2019, 10, 835. [Google Scholar] [CrossRef] [Green Version]
  14. Meng-Ying, L.V.; Jian-Bo, S.; Min, W.; Hong-Yan, F.; Zhang, Z.; Feng-Guo, X.U. Comparative Analysis of Volatile Oils in the Stems and Roots of Ephedra sinica via GC-MS-Based Plant Metabolomics. Chin. J. Nat. Med. 2016, 14, 133–140. [Google Scholar] [CrossRef]
  15. Xiang, Z.; Wang, X.; Gao, H.; Zhang, M.; Zeng, S. GC-MS and HPLC Metabolic Profiling Studies of Curcuma wenyujin Rhizomes obtained at Different Harvest Times. Anal. Lett. 2012, 45, 1–14. [Google Scholar] [CrossRef]
  16. Rai, A.; Saito, K.; Yamazaki, M. Integrated Omics Analysis of Specialized Metabolism in Medicinal Plants. Plant J. 2017, 90, 764–787. [Google Scholar] [CrossRef]
  17. Kim, J.K.; Park, S.-Y.; Lim, S.-H.; Yeo, Y.; Cho, H.S.; Ha, S.-H. Comparative Metabolic Profiling of Pigmented Rice (Oryza Sativa L.) Cultivars Reveals Primary Metabolites are Correlated with Secondary Metabolites. J. Cereal Sci. 2013, 57, 14–20. [Google Scholar] [CrossRef]
  18. Park, S.-Y.; Lim, S.-H.; Ha, S.-H.; Yeo, Y.; Park, W.T.; Kwon, D.Y.; Park, S.U.; Kim, J.K. Metabolite Profiling Approach Reveals the Interface of Primary and Secondary Metabolism in Colored Cauliflowers (Brassica Oleracea L. ssp. Botrytis). J. Agric. Food Chem. 2013, 61, 6999–7007. [Google Scholar] [CrossRef]
  19. Park, C.H.; Park, S.; Lee, S.Y.; Kim, J.K.; Park, S.U. Analysis of Metabolites in White Flowers of Magnolia denudata Desr. and Violet Flowers of Magnolia liliiflora Desr. Molecules 2018, 23, 1558. [Google Scholar] [CrossRef] [Green Version]
  20. Zrira, S.; Bessiere, J.M.; Menut, C.; Elamrani, A.; Benjilali, B. Chemical Composition of the Essential Oil of Nine Eucalyptus Species Growing in Morocco. Flavour fragr. J. 2004, 19, 172–175. [Google Scholar] [CrossRef]
  21. Surendran, S.; Qassadi, F.; Surendran, G.; Lilley, D.; Heinrich, M. Myrcene—What are the Potential Health Benefits of this Flavouring and Aroma Agent? Front. Nutr. 2021, 8, 400. [Google Scholar] [CrossRef]
  22. Schühly, W.; Ross, S.A.; Mehmedic, Z.; Fischer, N.H. Essential Oil Analysis of the Follicles of Four North American Magnolia Species. Nat. Prod. Commun. 2008, 3, 1934578X0800300715. [Google Scholar] [CrossRef] [Green Version]
  23. Nie, J.; Li, R.; Jiang, Z.; Wang, Y.; Tan, J.; Tang, S.; Zhang, Y. Screening and Evaluation of Radical Scavenging Active Compounds in the Essential Oil from Magnolia biondii Pamp by Electronic Nose Coupled with Chemical Methodology. Ind. Crops Prod. 2020, 144, 112060. [Google Scholar] [CrossRef]
  24. Ebadi, M.; Mollaei, S.; Khurizadeh, S. Evaluation of Volatile and Phenolic Compounds, and Antioxidant Activity of Different Parts of Ferulago angulata (Schlecht.) Boiss. Ind. Crops Prod. 2019, 140, 111589. [Google Scholar] [CrossRef]
  25. Aprotosoaie, A.C.; Luca, V.S.; Trifan, A.; Miron, A. Antigenotoxic potential of some dietary non-phenolic phytochemicals. In Studies in Natural Products Chemistry; ur-Rahman, A., Ed.; Elsevier: Amsterdam, The Netherlands, 2018; Volume 60, pp. 223–297. [Google Scholar] [CrossRef]
  26. Kurade, N.P.; Jaitak, V.; Kaul, V.K.; Sharma, O.P. Chemical Composition and Antibacterial Activity of Essential Oils of Lantana camara, Ageratum houstonianum and Eupatorium adenophorum. Pharm. Biol. 2010, 48, 539–544. [Google Scholar] [CrossRef] [Green Version]
  27. Acharya, B.; Chaijaroenkul, W.; Na-Bangchang, K. Therapeutic Potential and Pharmacological Activities of β-eudesmol. Chem. Biol. Drug Des. 2021, 97, 984–996. [Google Scholar] [CrossRef]
  28. Russo, E.B.; Marcu, J. Chapter Three—Cannabis Pharmacology: The Usual Suspects and a Few Promising Leads. In Advances in Pharmacology; Kendall, D., Alexander, S.P.H., Eds.; Academic Press: Cambridge, MA, USA, 2017; Volume 80, pp. 67–134. [Google Scholar] [CrossRef]
  29. Li, Y.; Tan, B.; Cen, Z.; Fu, Y.; Zhu, X.; He, H.; Kong, D.; Wu, H. The Variation in Essential Oils Composition, Phenolic Acids and Flavonoids is Correlated with Changes in Antioxidant Activity during Cinnamomum loureirii Bark Growth. Arab. J. Chem. 2021, 14, 103249. [Google Scholar] [CrossRef]
  30. Afshari, M.; Rahimmalek, M. Variation in Essential Oil Composition, Bioactive Compounds, Anatomical and Antioxidant Activity of Achillea Aucheri, an Endemic Species of Iran, at Different Phenological Stages. Chem. Biodivers. 2018, 15, e1800319. [Google Scholar] [CrossRef]
  31. Hazrati, S.; Mollaei, S.; Rabbi Angourani, H.; Hosseini, S.J.; Sedaghat, M.; Nicola, S. How do Essential Oil Composition and Phenolic Acid Profile of Heracleum persicum Fluctuate at Different Phenological Stages? Food Sci. Nutr. 2020, 8, 6192–6206. [Google Scholar] [CrossRef] [PubMed]
  32. Patel, K.; Patel, D.K. The Beneficial Role of Rutin, a Naturally Occurring Flavonoid in Health Promotion and Disease Prevention: A Systematic Review and Update. In Bioactive Food as Dietary Interventions for Arthritis and Related Inflammatory Diseases; Elsevier: Amsterdam, The Netherlands, 2019; pp. 457–479. [Google Scholar] [CrossRef]
  33. Guo, L.; Wang, S.; Zhang, J.; Yang, G.; Zhao, M.; Ma, W.; Zhang, X.; Li, X.; Han, B.; Chen, N. Effects of Ecological Factors on Secondary Metabolites and Inorganic Elements of Scutellaria baicalensis and Analysis of Geoherblism. Sci. China Life Sci. 2013, 56, 1047–1056. [Google Scholar] [CrossRef] [PubMed] [Green Version]
  34. Marques, V.; Farah, A. Chlorogenic Acids and Related Compounds in Medicinal Plants and Infusions. Food Chem. 2009, 113, 1370–1376. [Google Scholar] [CrossRef]
  35. Hyeon, H.; Xu, J.L.; Kim, J.K.; Choi, Y. Comparative Metabolic Profiling of Cultivated and Wild Black Soybeans Reveals Distinct Metabolic Alterations Associated with their Domestication. Food Res. Int. 2020, 134, 109290. [Google Scholar] [CrossRef] [PubMed]
  36. Kim, T.J.; Hyeon, H.; Park, N.I.; Yi, T.G.; Lim, S.-H.; Park, S.-Y.; Ha, S.-H.; Kim, J.K. A High-Throughput Platform for Interpretation of Metabolite Profile Data from Pepper (Capsicum) Fruits of 13 Phenotypes Associated with Different Fruit Maturity States. Food Chem. 2020, 331, 127286. [Google Scholar] [CrossRef] [PubMed]
  37. Rosato, A.; Tenori, L.; Cascante, M.; Carulla, P.R.; Dos Santos, V.A.; Saccenti, E. From Correlation to Causation: Analysis of Metabolomics Data using Systems Biology Approaches. Metabolomics 2018, 14, 1–20. [Google Scholar] [CrossRef] [PubMed] [Green Version]
  38. Saccenti, E.; Timmerman, M.E. Approaches to Sample Size Determination for Multivariate Data: Applications to PCA and PLS-DA of Omics Data. J. Proteome Res. 2016, 15, 2379–2393. [Google Scholar] [CrossRef]
  39. Hyeon, H.; Min, C.W.; Moon, K.; Cha, J.; Gupta, R.; Park, S.U.; Kim, S.T.; Kim, J.K. Metabolic Profiling-Based Evaluation of the Fermentative Behavior of Aspergillus oryzae and Bacillus Subtilis for Soybean Residues Treated at Different Temperatures. Foods 2020, 9, 117. [Google Scholar] [CrossRef] [Green Version]
  40. Ruiz-Perez, D.; Guan, H.; Madhivanan, P.; Mathee, K.; Narasimhan, G. So You Think You can PLS-DA? BMC Bioinform. 2020, 21, 1–10. [Google Scholar] [CrossRef]
  41. Pazouki, L.; Niinemets, Ü. Multi-Substrate Terpene Synthases: Their Occurrence and Physiological Significance. Front. Plant Sci. 2016, 7, 1019. [Google Scholar] [CrossRef] [Green Version]
  42. Korman, T.P.; Opgenorth, P.H.; Bowie, J.U. A Synthetic Biochemistry Platform for Cell Free Production of Monoterpenes from Glucose. Nat. Commun. 2017, 8, 1–8. [Google Scholar] [CrossRef]
  43. Trapp, S.; Croteau, R. Defensive Resin Biosynthesis in Conifers. Annu. Rev. Plant Biol. 2001, 52, 689–724. [Google Scholar] [CrossRef]
  44. El Tamer, M.K. Molecular Regulation of Plant Monoterpene Biosynthesis in Relation to Fragrance. 2002. Available online: https://edepot.wur.nl/121357 (accessed on 5 December 2021).
  45. Behr, A.; Johnen, L. Myrcene as a Natural Base Chemical in Sustainable Chemistry: A Critical Review. ChemSusChem 2009, 2, 1072–1095. [Google Scholar] [CrossRef]
  46. Dudareva, N.; Martin, D.; Kish, C.M.; Kolosova, N.; Gorenstein, N.; Fäldt, J.; Miller, B.; Bohlmann, J. (E)-β-Ocimene and Myrcene Synthase Genes of Floral Scent Biosynthesis in Snapdragon: Function and Expression of Three Terpene Synthase Genes of a New Terpene Synthase Subfamily. Plant Cell 2003, 15, 1227–1241. [Google Scholar] [CrossRef] [PubMed] [Green Version]
  47. Caser, M.; Chitarra, W.; D’Angiolillo, F.; Perrone, I.; Demasi, S.; Lovisolo, C.; Pistelli, L.; Pistelli, L.; Scariot, V. Drought Stress Adaptation Modulates Plant Secondary Metabolite Production in Salvia Dolomitica Codd. Ind. Crops Prod. 2019, 129, 85–96. [Google Scholar] [CrossRef]
  48. Trovato, M.; Forlani, G.; Signorelli, S.; Funck, D. Proline metabolism and its functions in development and stress tolerance. In Osmoprotectant-Mediated Abiotic Stress Tolerance in Plants: Recent Advances and Future Perspectives; Hossain, M.A., Kumar, V., Burritt, D.J., Fujita, M., Mäkelä, P., Eds.; Springer Nature: Cham, Switzerland, 2019; pp. 41–72. [Google Scholar] [CrossRef]
  49. Shimizu, K. Main metabolism. In Bacterial Cellular Metabolic Systems; Woodhead Publ. Co.: Oxford, UK, 2013; pp. 1–54. [Google Scholar]
  50. Nagegowda, D.A. Plant Volatile Terpenoid Metabolism: Biosynthetic Genes, Transcriptional Regulation and Subcellular Compartmentation. FEBS Lett. 2010, 584, 2965–2973. [Google Scholar] [CrossRef] [PubMed] [Green Version]
  51. Mehdizadeh, L.; Ghasemi Pirbalouti, A.; Moghaddam, M. Storage Stability of Essential Oil of Cumin (Cuminum Cyminum L.) as a Function of Temperature. Int. J. Food Prop. 2017, 20, 1742–1750. [Google Scholar] [CrossRef]
  52. Ramírez, J.; Andrade, M.D.; Vidari, G.; Gilardoni, G. Essential Oil and Major Non-Volatile Secondary Metabolites from the Leaves of Amazonian Piper subscutatum. Plants 2021, 10, 1168. [Google Scholar] [CrossRef] [PubMed]
  53. Ferretti, G.; Maggi, F.; Tirillini, B. Essential Oil Composition of Hypericum richeri Vill. from Italy. Flavour Fragr. J. 2005, 20, 295–298. [Google Scholar] [CrossRef]
  54. Rahimi, M.R.; Zamani, R.; Sadeghi, H.; Tayebi, A.R. An Experimental Study of Different Drying Methods on the Quality and Quantity Essential Oil of Myrtus Communis L. Leaves. J. Essent. Oil-Bear. Plants 2015, 18, 1395–1405. [Google Scholar] [CrossRef]
  55. Gamal El-Din, M.I.; Youssef, F.S.; Ashour, M.L.; Eldahshan, O.A.; Singab, A.N.B. Comparative Analysis of Volatile Constituents of Pachira Aquatica Aubl. and Pachira Glabra Pasq., their Anti-Mycobacterial and Anti-Helicobacter Pylori Activities and their Metabolic Discrimination using Chemometrics. J. Essent. Oil-Bear. Plants 2018, 21, 1550–1567. [Google Scholar] [CrossRef]
  56. Yeo, H.J.; Park, C.H.; Park, Y.E.; Hyeon, H.; Kim, J.K.; Lee, S.Y.; Park, S.U. Metabolic Profiling and Antioxidant Activity during Flower Development in Agastache Rugosa. Physiol. Mol. Biol. Plants 2021, 27, 445–455. [Google Scholar] [CrossRef]
Figure 1. Score plots (A) and loading plots (B) of principal components 1 and 2 for the principal component analysis of essential oils, phenolic acids, and hydrophilic metabolites measured from M. heptapeta (white) and M. denudata var. purpurascens (violet) flower buds. MH, monoterpene hydrocarbons; MO, oxygenated monoterpene; SH, sesquiterpene hydrocarbons; SO, oxygenated sesquiterpene; PA, phenolic acids; AA, amino acids; OA, organic acids; SA, sugar alcohols. Plot annotations: 1, α-thujene; 2, α-pinene; 3, camphene; 4, sabinene; 5, β-pinene; 6, β-myrcene; 7, α-phellandrene; 8, δ-3-carene; 9, α-terpinene; 10, limonene; 11, 1,8-cineole; 12, (Z)-β-ocimene; 13, γ-terpinene; 14, α-terpinolene; 15, camphor; 16, 3-cyclohexen-1-ol; 17, 3-cyclohexene-1-methanol; 18, borneol acetate; 19, α-copaene; 20, β-elemene; 21, β-caryophyllene; 22, α-humulene; 23, germacrene D; 24, α-muurolene; 25, δ-cadinene; 26, elemol; 27, trans-nerolidol; 28, β-eudesmol; 29, α-eudesmol; 30, α-cadinol; 31, glycolic acid; 32, alanine; 33, valine; 34, glycerol; 35, phosphoric acid; 36, leucine; 37, isoleucine; 38, proline; 39, glycine; 40, succinic acid; 41, fumaric acid; 42, serine; 43, threonine; 44, β-alanine; 45, malic acid; 46, aspartic acid; 47, methionine; 48, pyroglutamic acid; 49, γ-aminobutyric acid; 50, threonic acid; 51, glutamic acid; 52, phenylalanine; 53, xylose; 54, asparagine; 55, glutamine; 56, shikimic acid; 57, citric acid; 58, quinic acid; 59, fructose; 60, galactose; 61, glucose; 62, inositol; 63, tryptophan; 64, sucrose; 65, raffinose; 66, chlorogenic acid; 67, caffeic acid; 68, coumaric acid; 69, rutin; 70, ferulic acid; 71, cinnamic acid.
Molecules 27 00221 g001
Figure 2. Correlation matrix of 71 metabolites from white and violet Magnolia flower buds. Each square indicates the Pearson’s correlation coefficient for a pair of compounds, and the correlation coefficient is represented by the shade of blue or red, as indicated on the colour scale.
Molecules 27 00221 g002
Figure 3. Partial least squares discriminant analysis (PLS-DA) score plots (A) and variable importance in projection (VIP) scores above 1.0 (B) for M. heptapeta (white) and M. denudata var. purpurascens (violet) flower buds.
Molecules 27 00221 g003
Figure 4. Metabolic pathway visualization and relative metabolite abundance of Magnolia flower buds. Fold changes (FC) from white to violet flower buds were converted into log2-transformed values (log2FC). A log2FC value range is −2 < log2FC < 2. If log2FC value is higher than zero (indicated in red), metabolite content is higher in violet flower buds than in white flower buds. If log2FC value is less than zero (indicated in green), metabolite content is higher in white flower buds than in violet flower buds.
Molecules 27 00221 g004
Table 1. Essential oil chemical compositions of M. heptapeta (white) and M. denudata var. purpurascens (violet) flower buds.
NO.TypeCompoundsRTRIRelative Content (%)
WhiteViolet
1MHα-Thujene8.028925 0.552 ± 0.0030.498 ± 0.005
2MHα-Pinene8.234930 6.328 ± 0.0194.828 ± 0.087
3MHCamphene8.787944 0.406 ± 0.0090.248 ± 0.003
4MHSabinene9.787971 15.789 ± 0.05514.58 ± 0.334
5MHβ-Pinene9.869973 12.921 ± 0.0527.668 ± 0.202
6MHβ-Myrcene10.581992 9.936 ± 0.05217.194 ± 0.143
7MHα-Phellandrene11.0511003 0.444 ± 0.0020.363 ± 0.004
8MHδ-3-Carene11.2921009 0.196 ± 0.0020.107 ± 0.002
9MHα-Terpinene11.5751015 1.788 ± 0.0111.254 ± 0.003
10MHLimonene12.0861027 3.811 ± 0.0062.948 ± 0.058
11MO1,8-Cineole12.1921029 7.589 ± 0.00711.606 ± 0.193
12MH(Z)-β-Ocimene13.0391048 0.231 ± 0.0040.240 ± 0.005
13MHγ-Terpinene13.4391057 4.644 ± 0.0142.881 ± 0.029
14MHα-Terpinolene14.7571087 0.889 ± 0.0060.818 ± 0.007
15MOCamphor17.2861143 0.238 ± 0.0010.354 ± 0.004
16MO3-Cyclohexen-1-ol18.8101147 0.876 ± 0.0040.954 ± 0.002
17MO3-Cyclohexene-1-methanol19.4511168 1.499 ± 0.0091.613 ± 0.023
18MOBorneol acetate23.7151286 0.440 ± 0.0030.295 ± 0.004
19SHα-Copaene27.4851374 0.114 ± 0.0010.100 ± 0.003
20SHβ-Elemene28.2091391 0.333 ± 0.0090.673 ± 0.008
21SHβ-Caryophyllene29.2741417 2.610 ± 0.0422.031 ± 0.038
22SHα-Humulene30.6681451 0.660 ± 0.0090.562 ± 0.018
23SHGermacrene D31.8091479 7.729 ± 0.0377.986 ± 0.234
24SHα-Muurolene32.6381500 0.399 ± 0.0140.665 ± 0.020
25SHδ-Cadinene33.5441523 2.682 ± 0.0492.495 ± 0.089
26SOElemol34.5731550 1.042 ± 0.0040.193 ± 0.005
27SOtrans-Nerolidol35.1731566 0.491 ± 0.0100.586 ± 0.015
28SOβ-Eudesmol38.3021650 3.658 ± 0.0230.908 ± 0.023
29SOα-Eudesmol38.4201653 2.039 ± 0.0320.430 ± 0.032
30SOα-Cadinol38.5081655 2.905 ± 0.0172.426 ± 0.054
Monoterpene hydrocarbons (MH) 57.936 ± 0.11853.627 ± 0.582
Oxygenated monoterpenes (MO) 10.642 ± 0.01214.823 ± 0.162
Sesquiterpene hydrocarbons (SH) 14.528 ± 0.12214.513 ± 0.403
Oxygenated sesquiterpenes (SO) 10.136 ± 0.0434.543 ± 0.111
Total 93.2487.51
Each value is the mean of three replications ± standard deviation.
Table 2. Composition and contents of phenolic acids in M. heptapeta (white) and M. denudata var. purpurascens (violet) flower buds.
NO.Name (mg/g Dry Weight)FormulaWhiteViolet
1Chlorogenic acidC16H18O93.548 ± 0.2854.372 ± 0.075
2Caffeic acidC9H8O40.186 ± 0.0080.356 ± 0.011
3Coumaric acidC9H8O30.117 ± 0.0030.065 ± 0.004
4RutinC27H30O1669.136 ± 4.62543.200 ± 2.763
5Ferulic acidC10H10O40.132 ± 0.0060.156 ± 0.001
6Cinnamic acidC9H8O20.084 ± 0.0030.018 ± 0.001
Each value is the mean of three replications ± standard deviation.
Publisher’s Note: MDPI stays neutral with regard to jurisdictional claims in published maps and institutional affiliations.

