
Variation in Population and Solvents as Factors Determining the Chemical Composition and Antioxidant Potential of Arctostaphylos uva-ursi (L.) Spreng. Leaf Extracts


Abstract
:1. Introduction
2. Results and Discussion
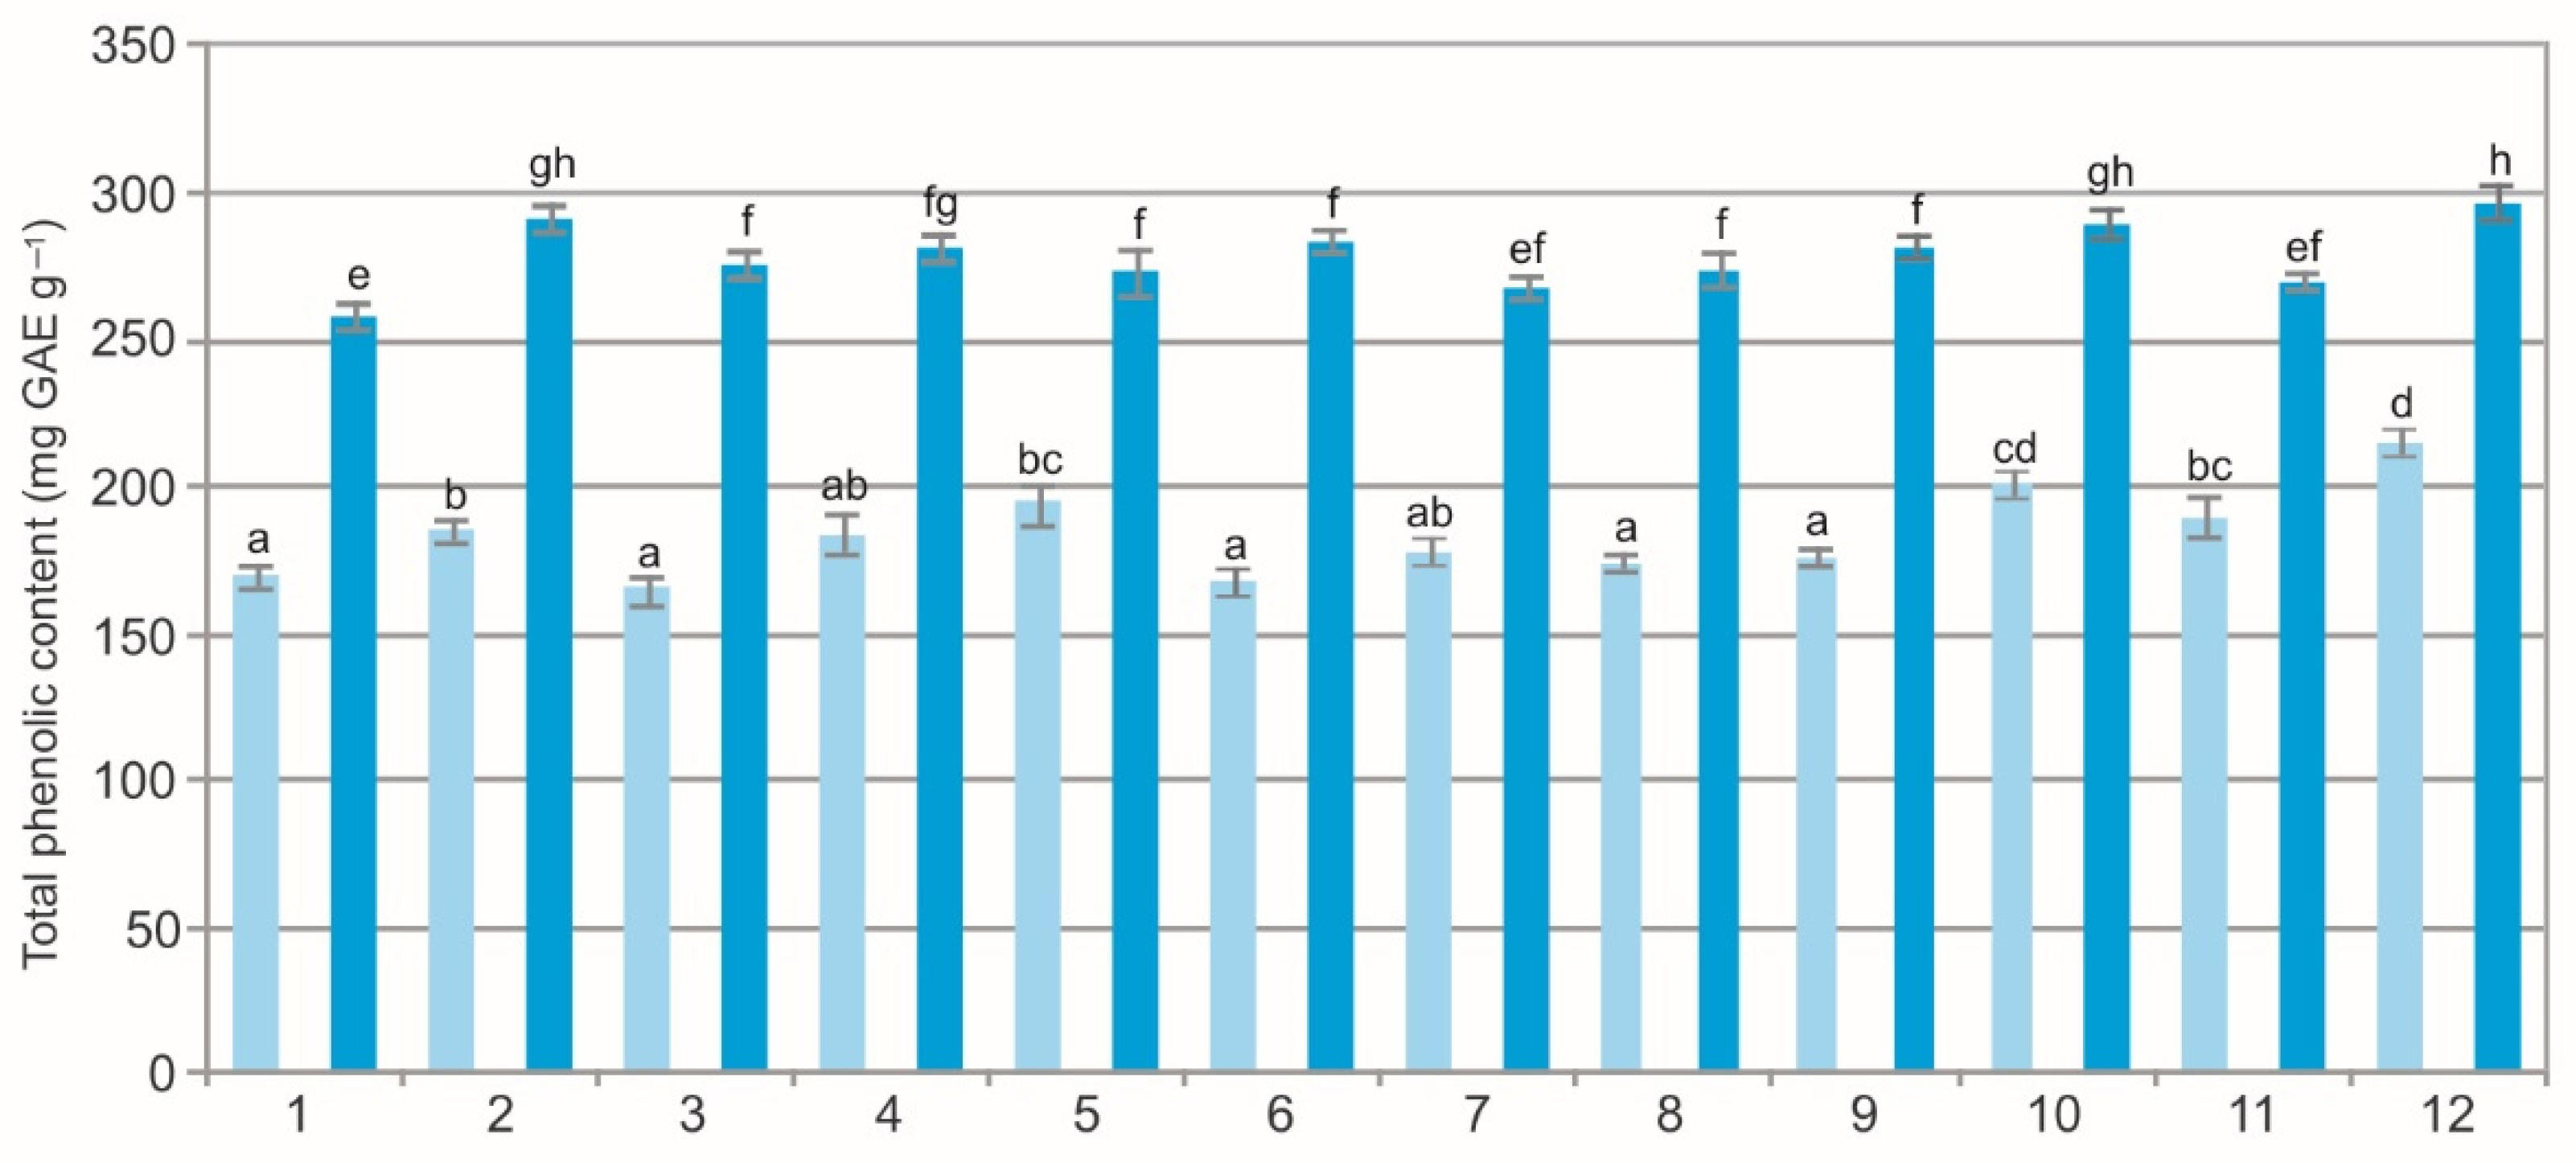
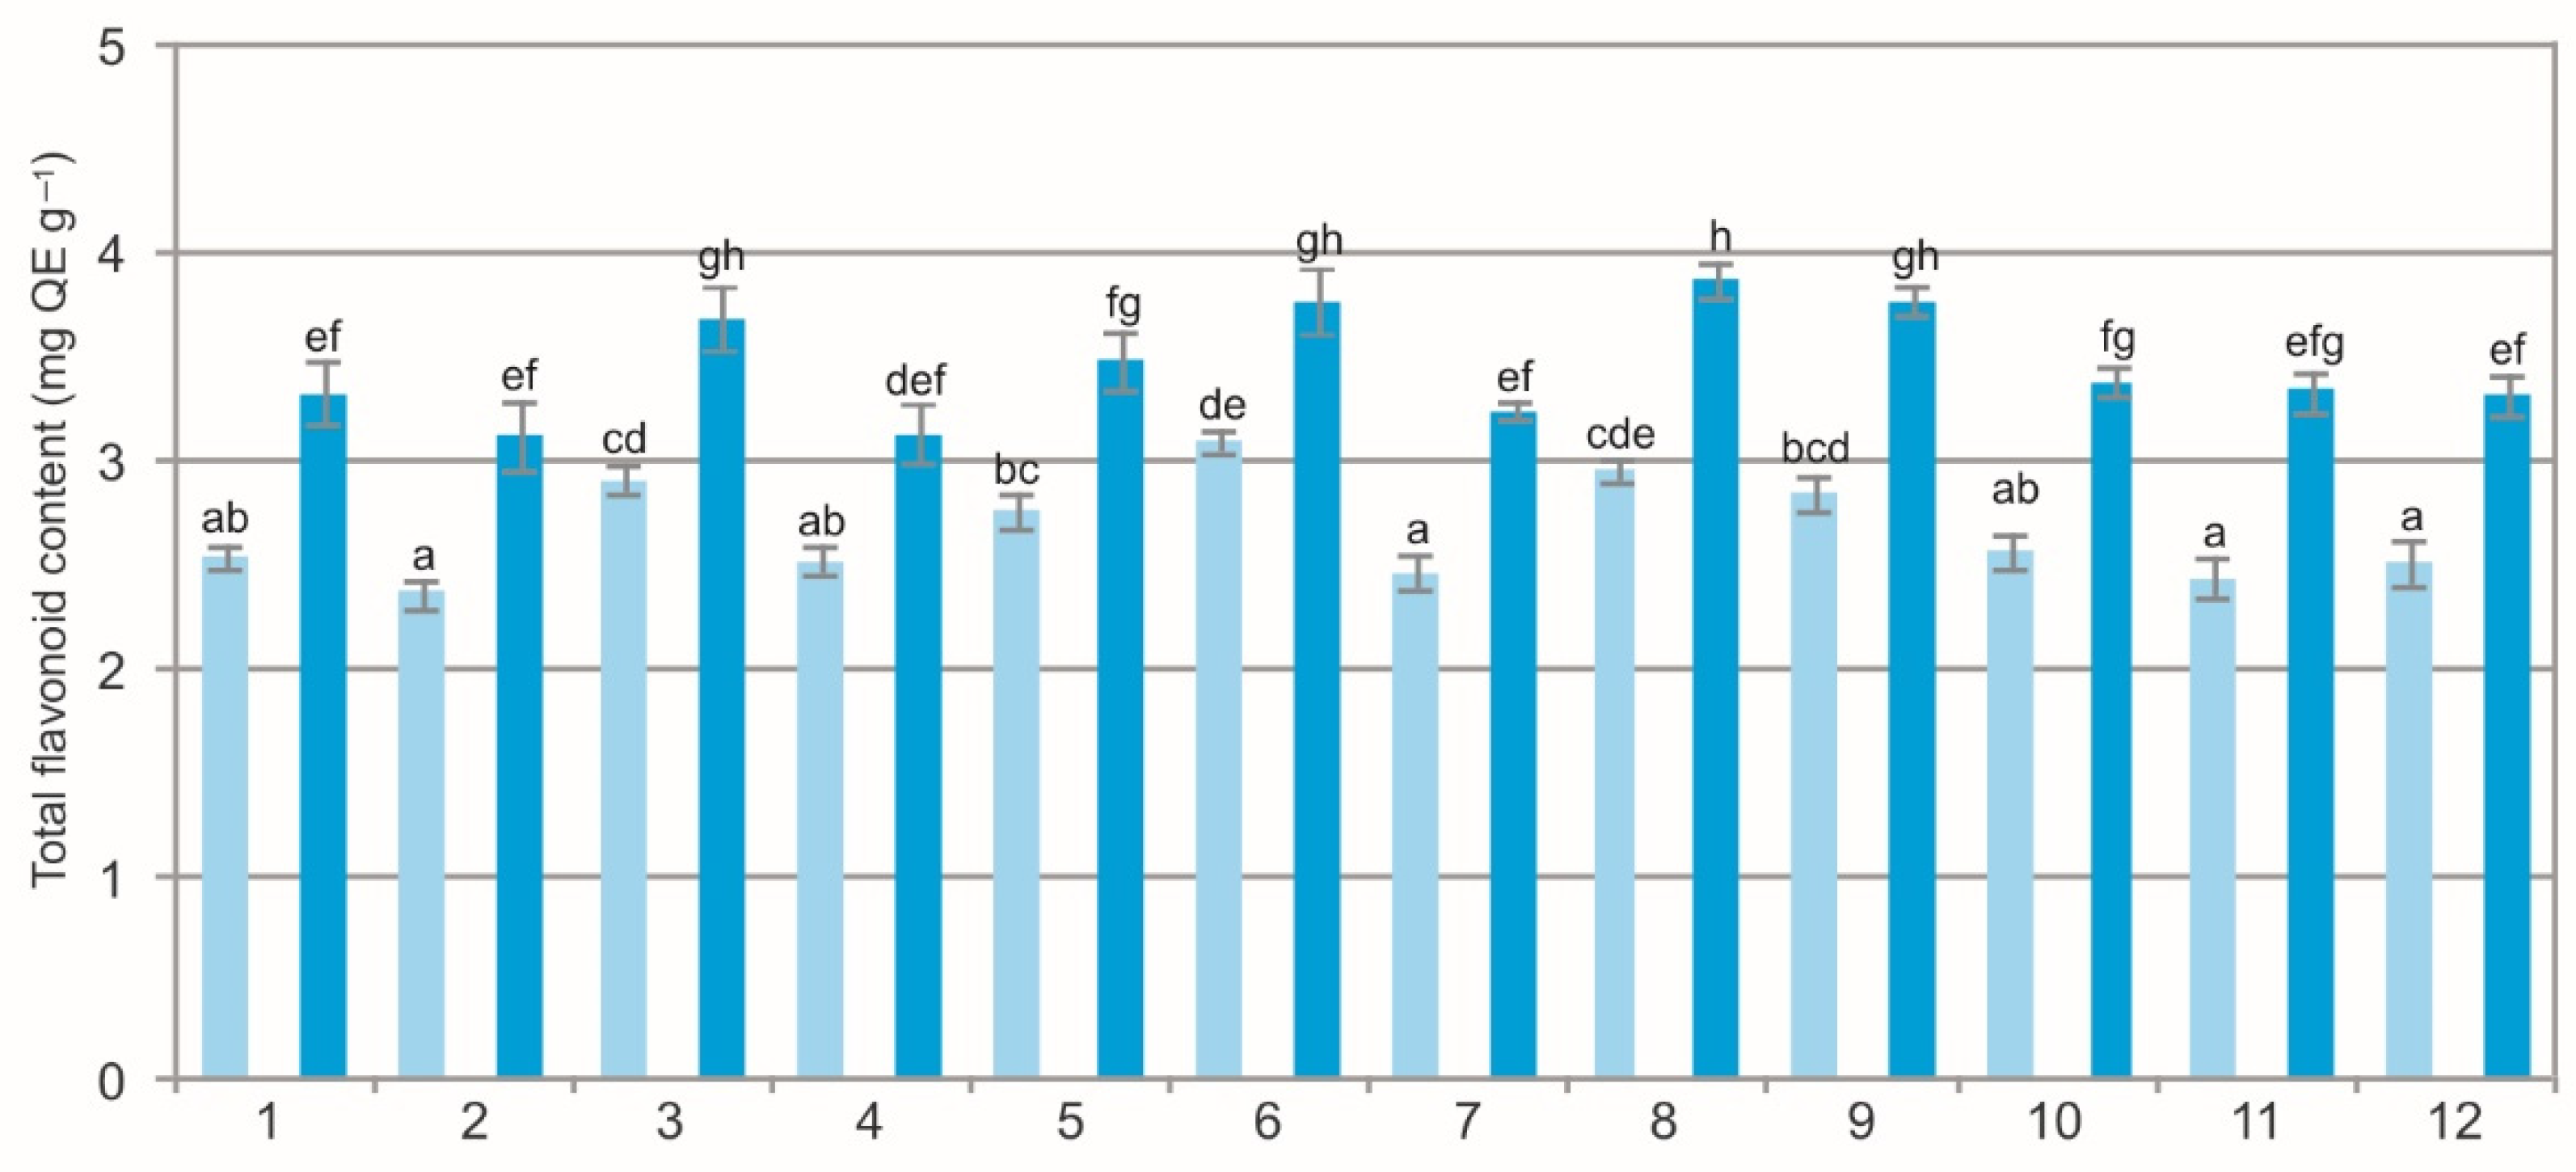
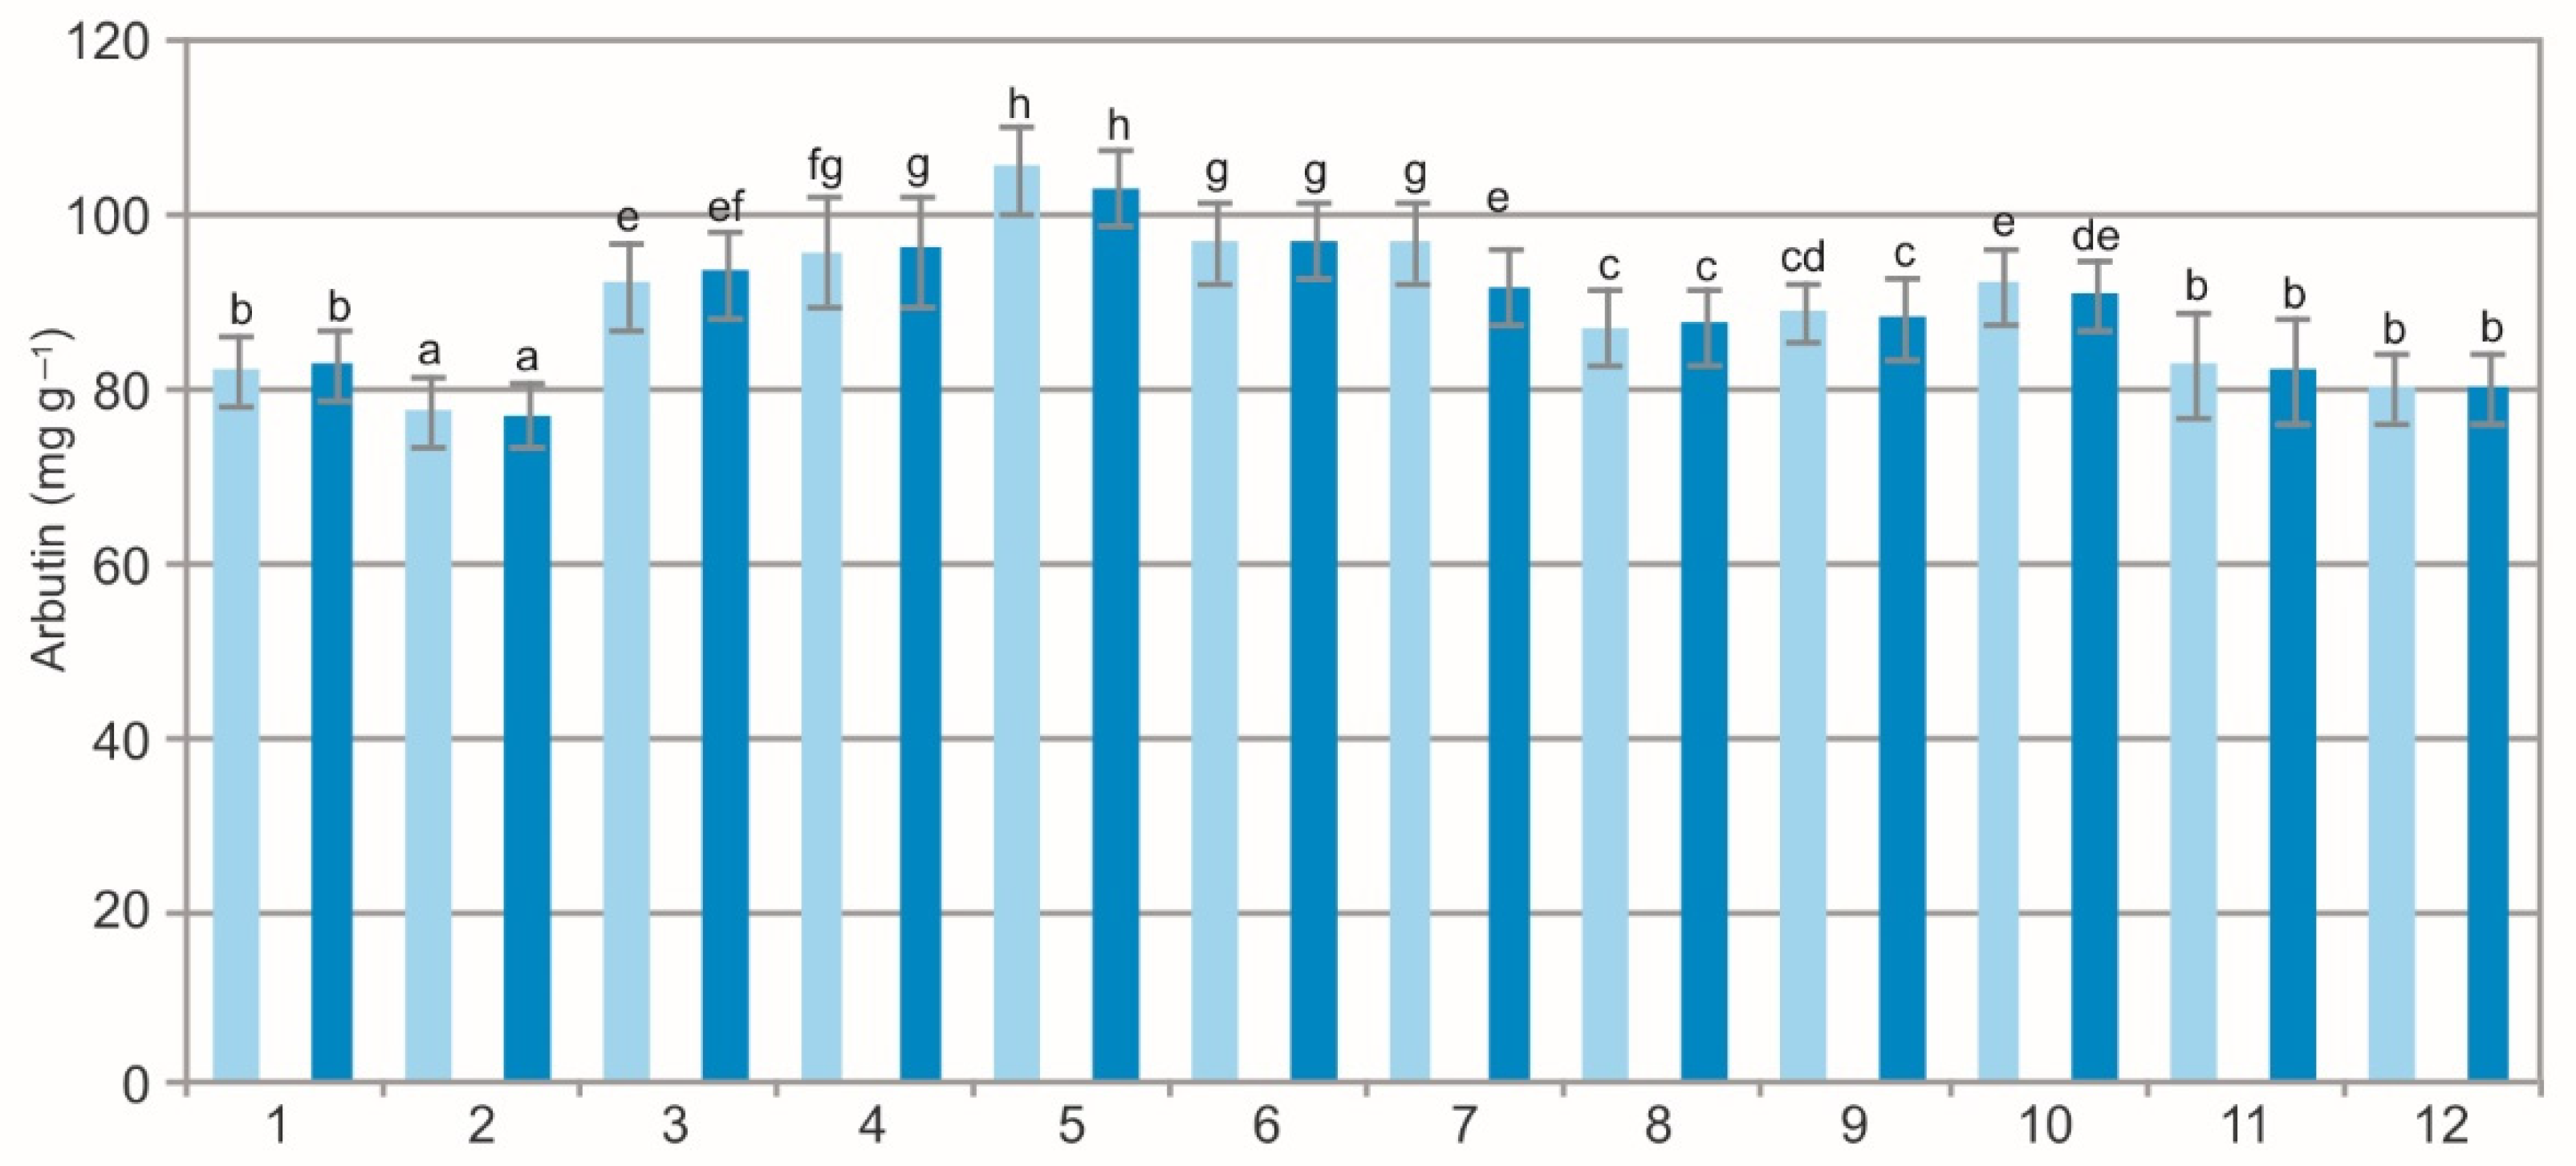
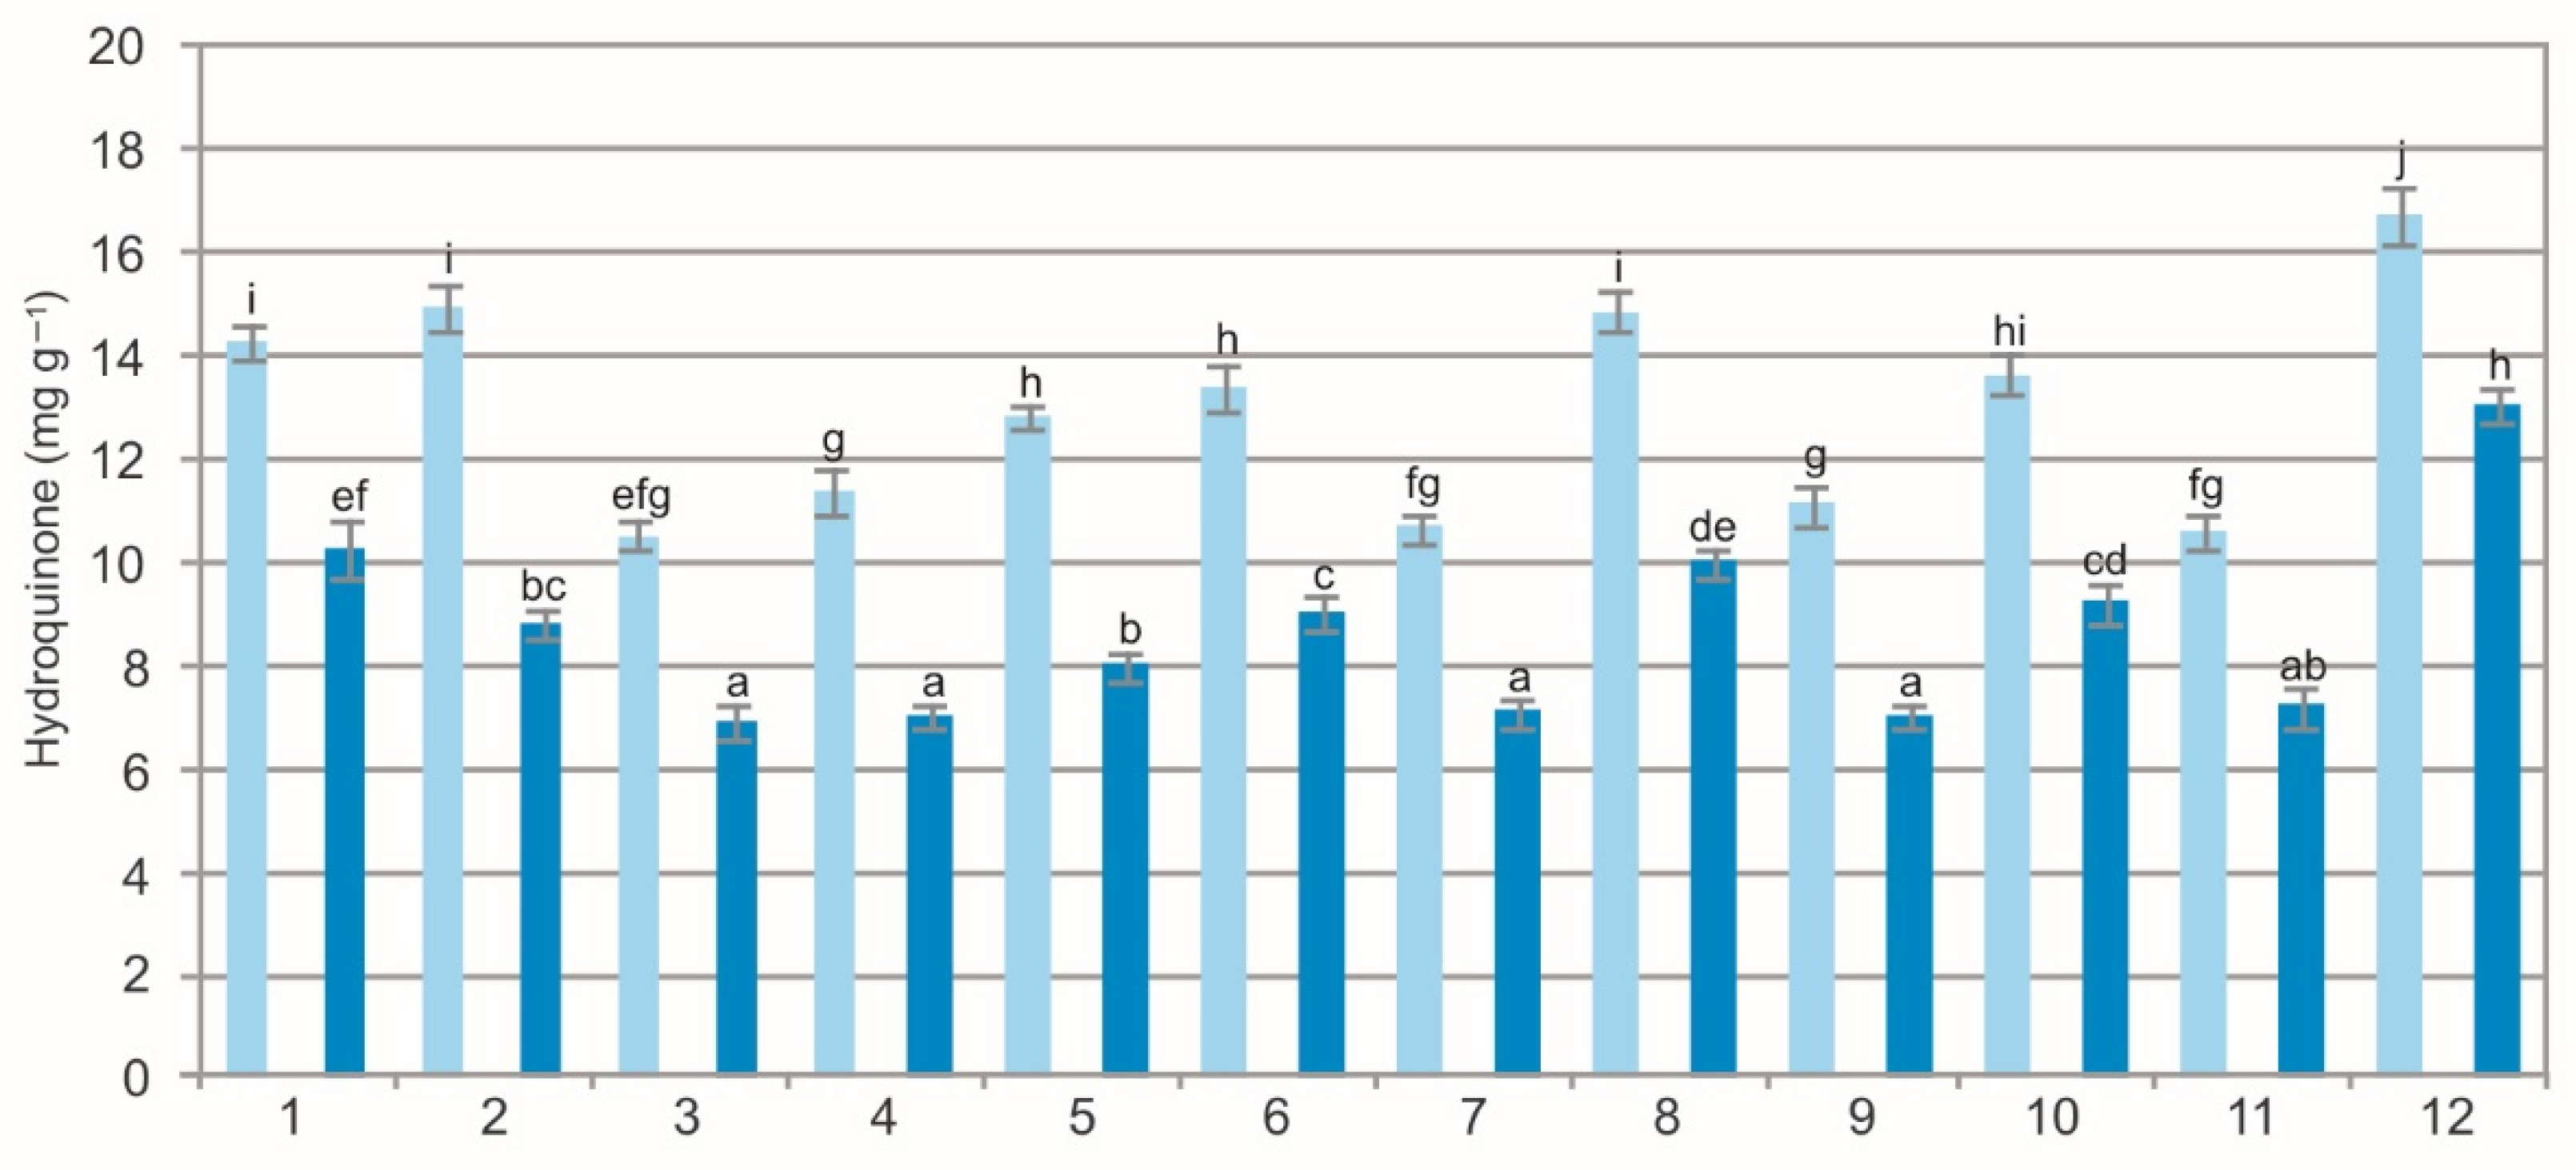
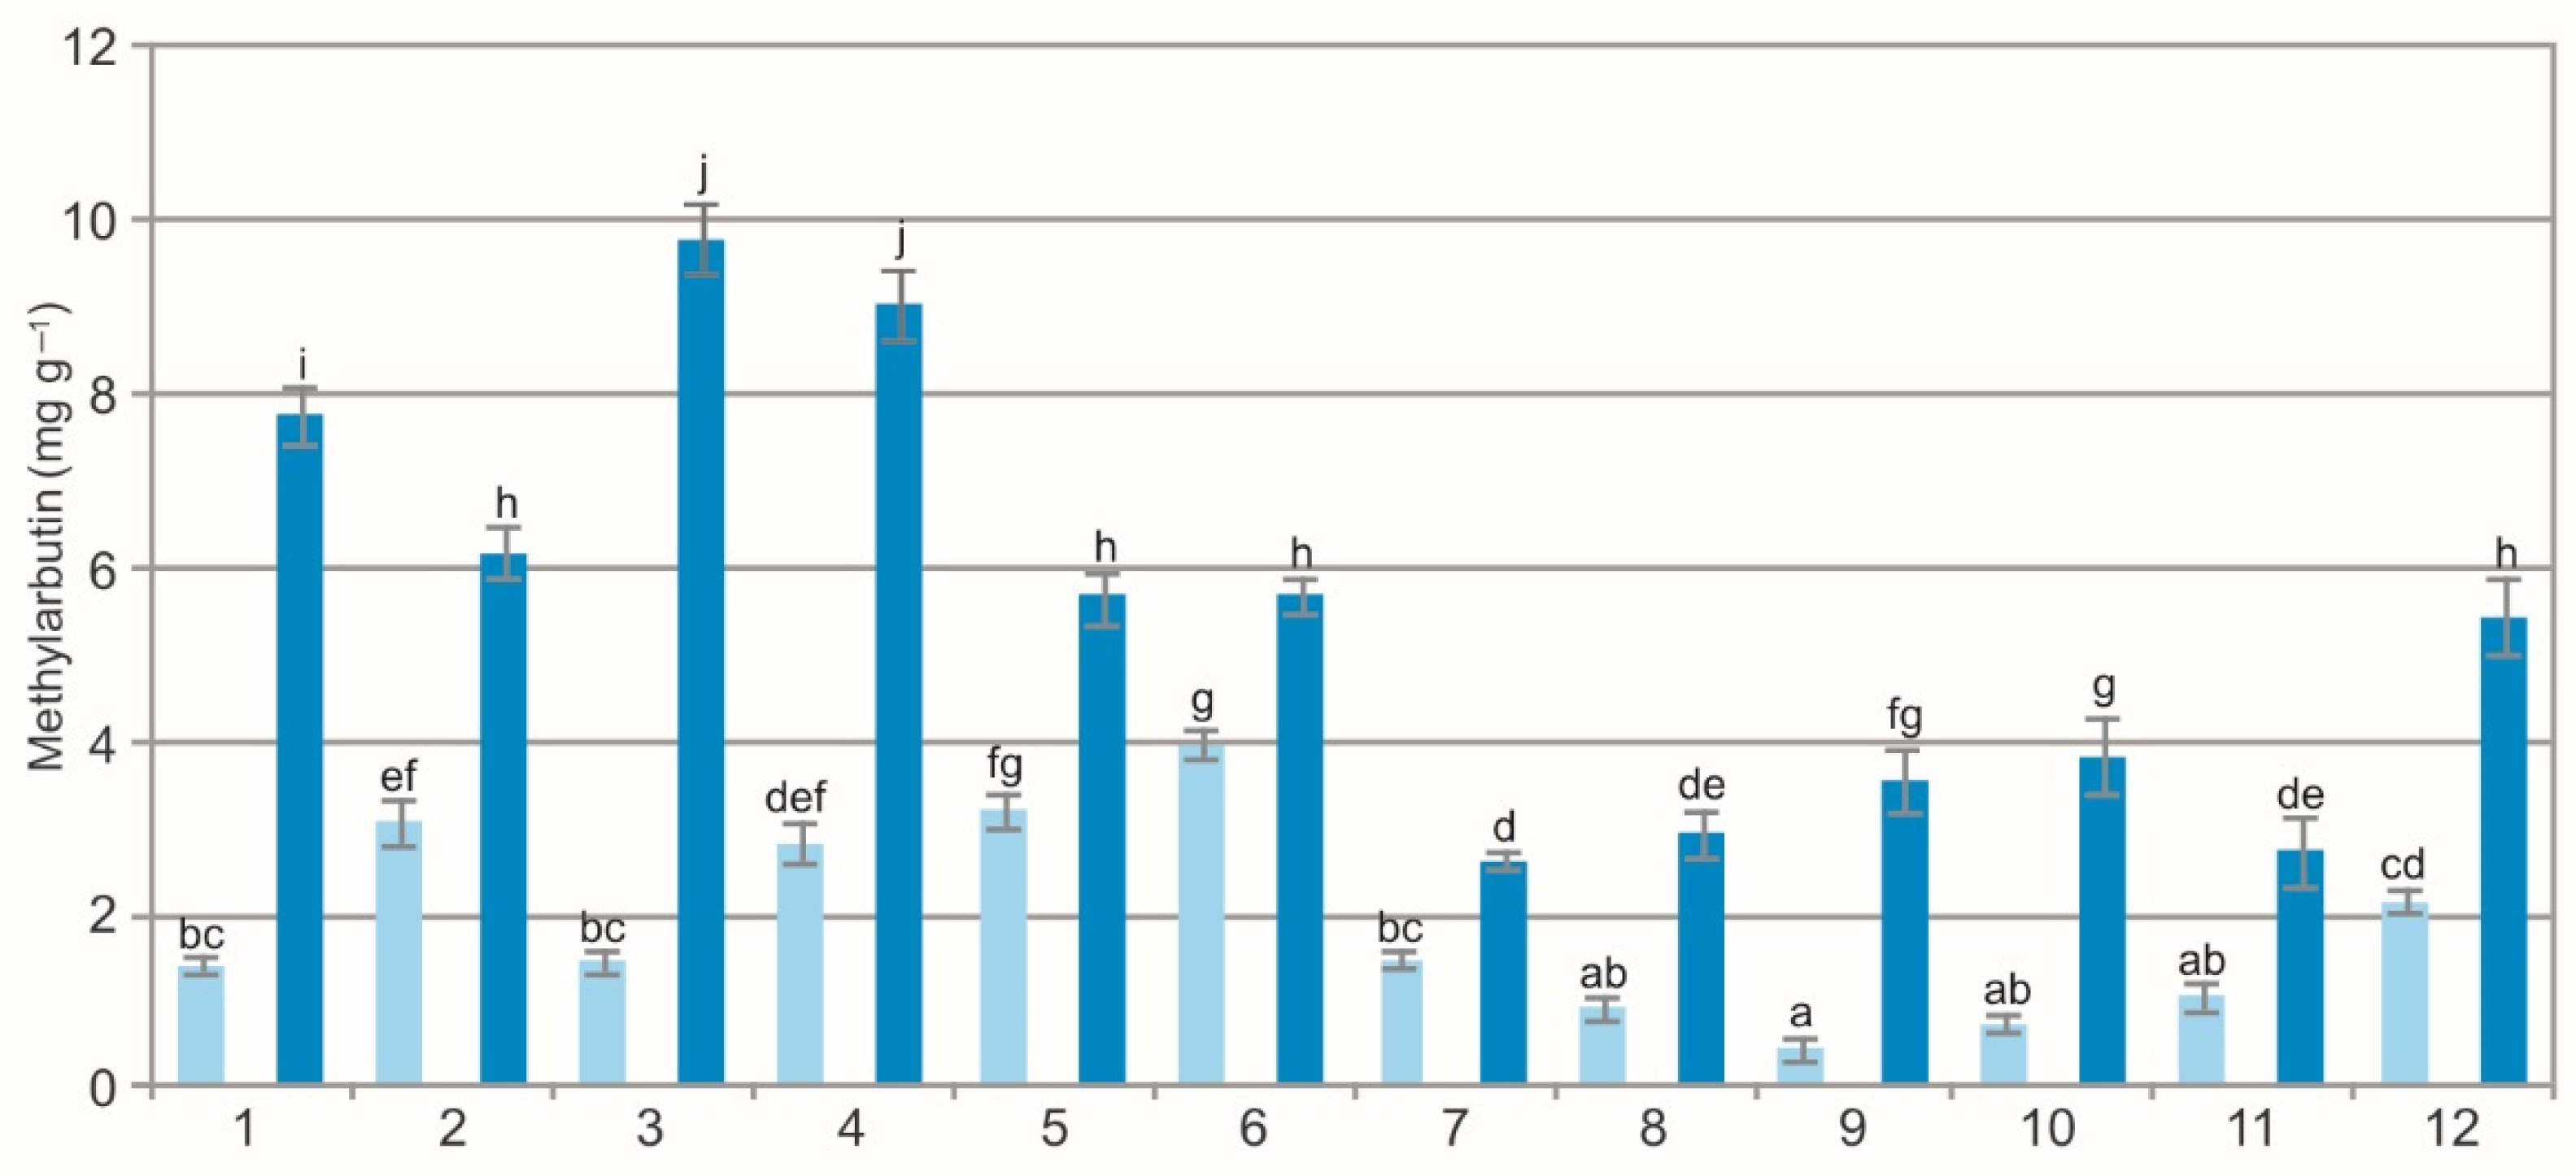
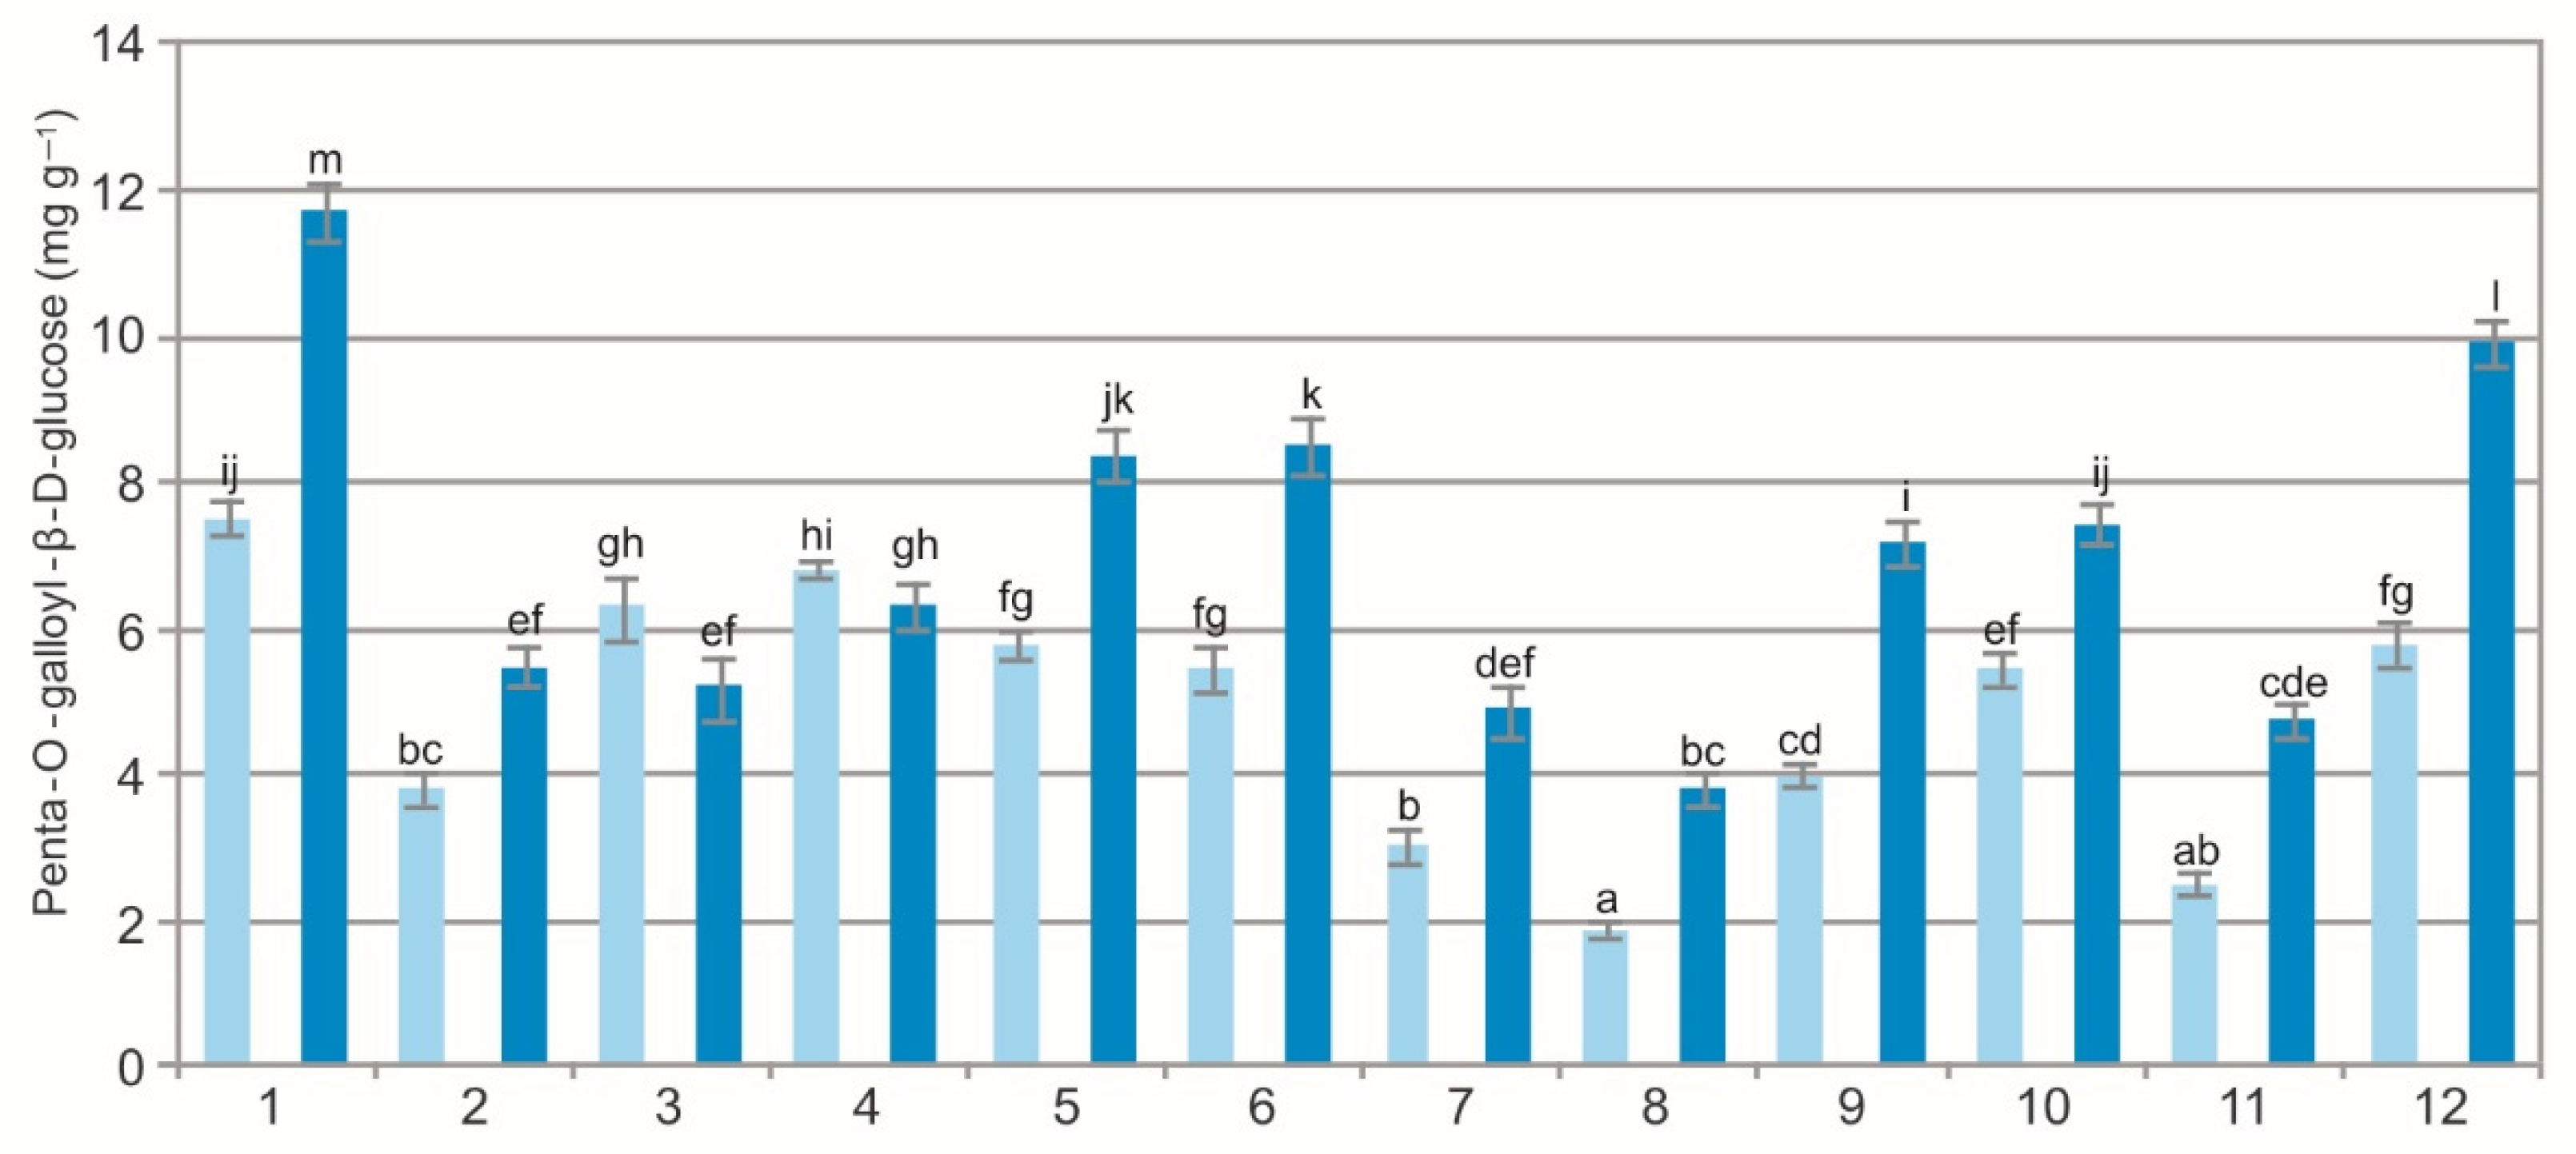
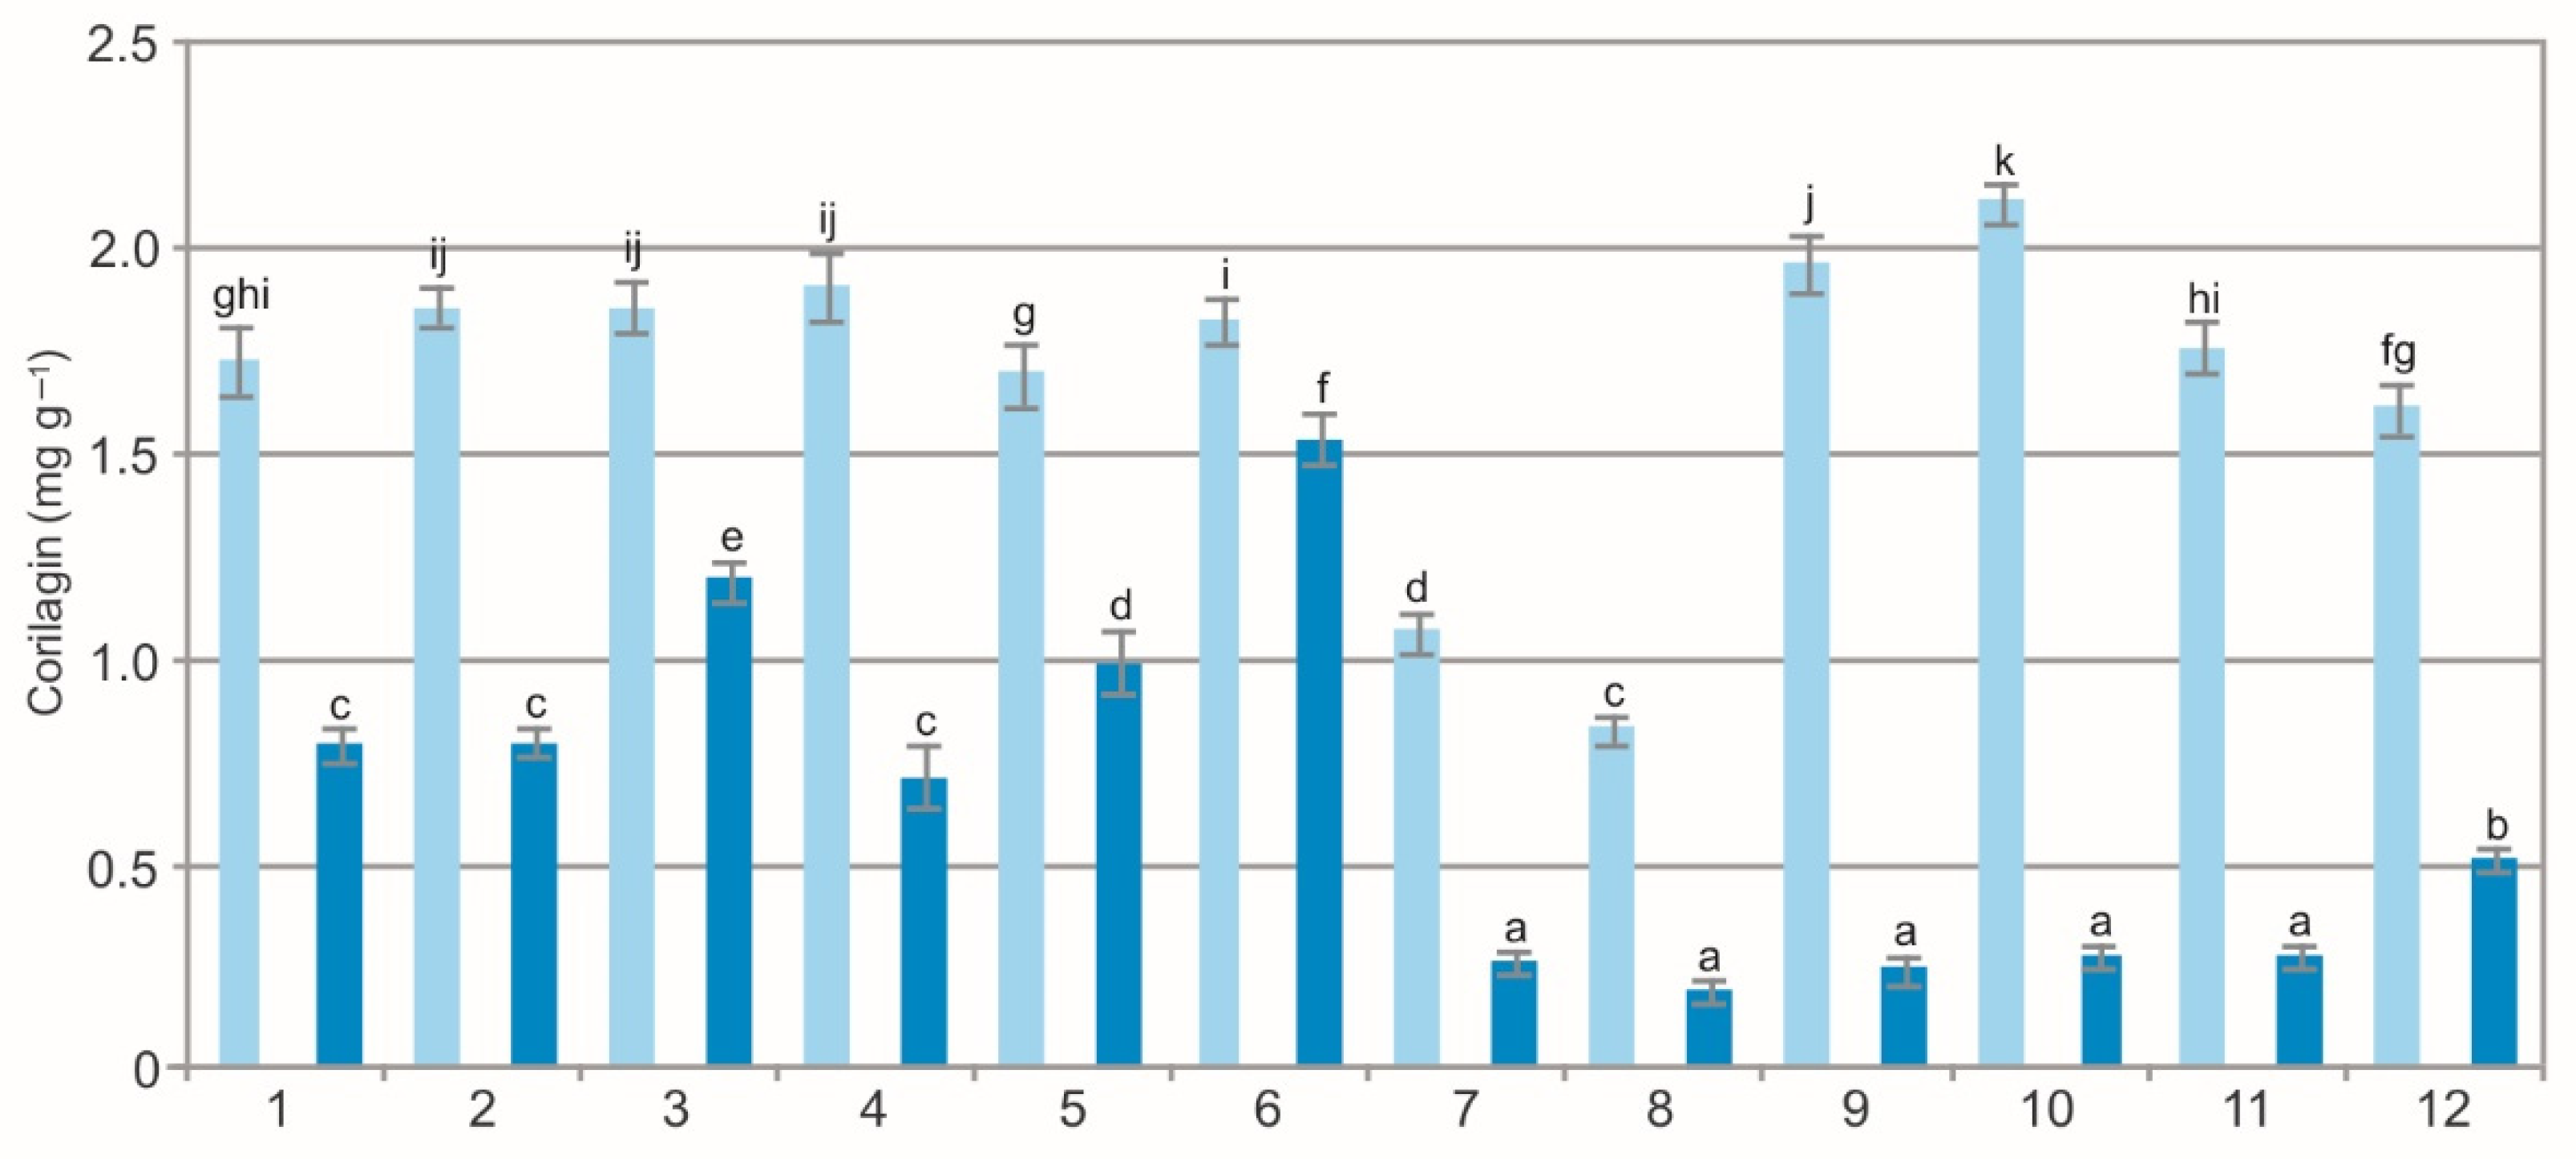
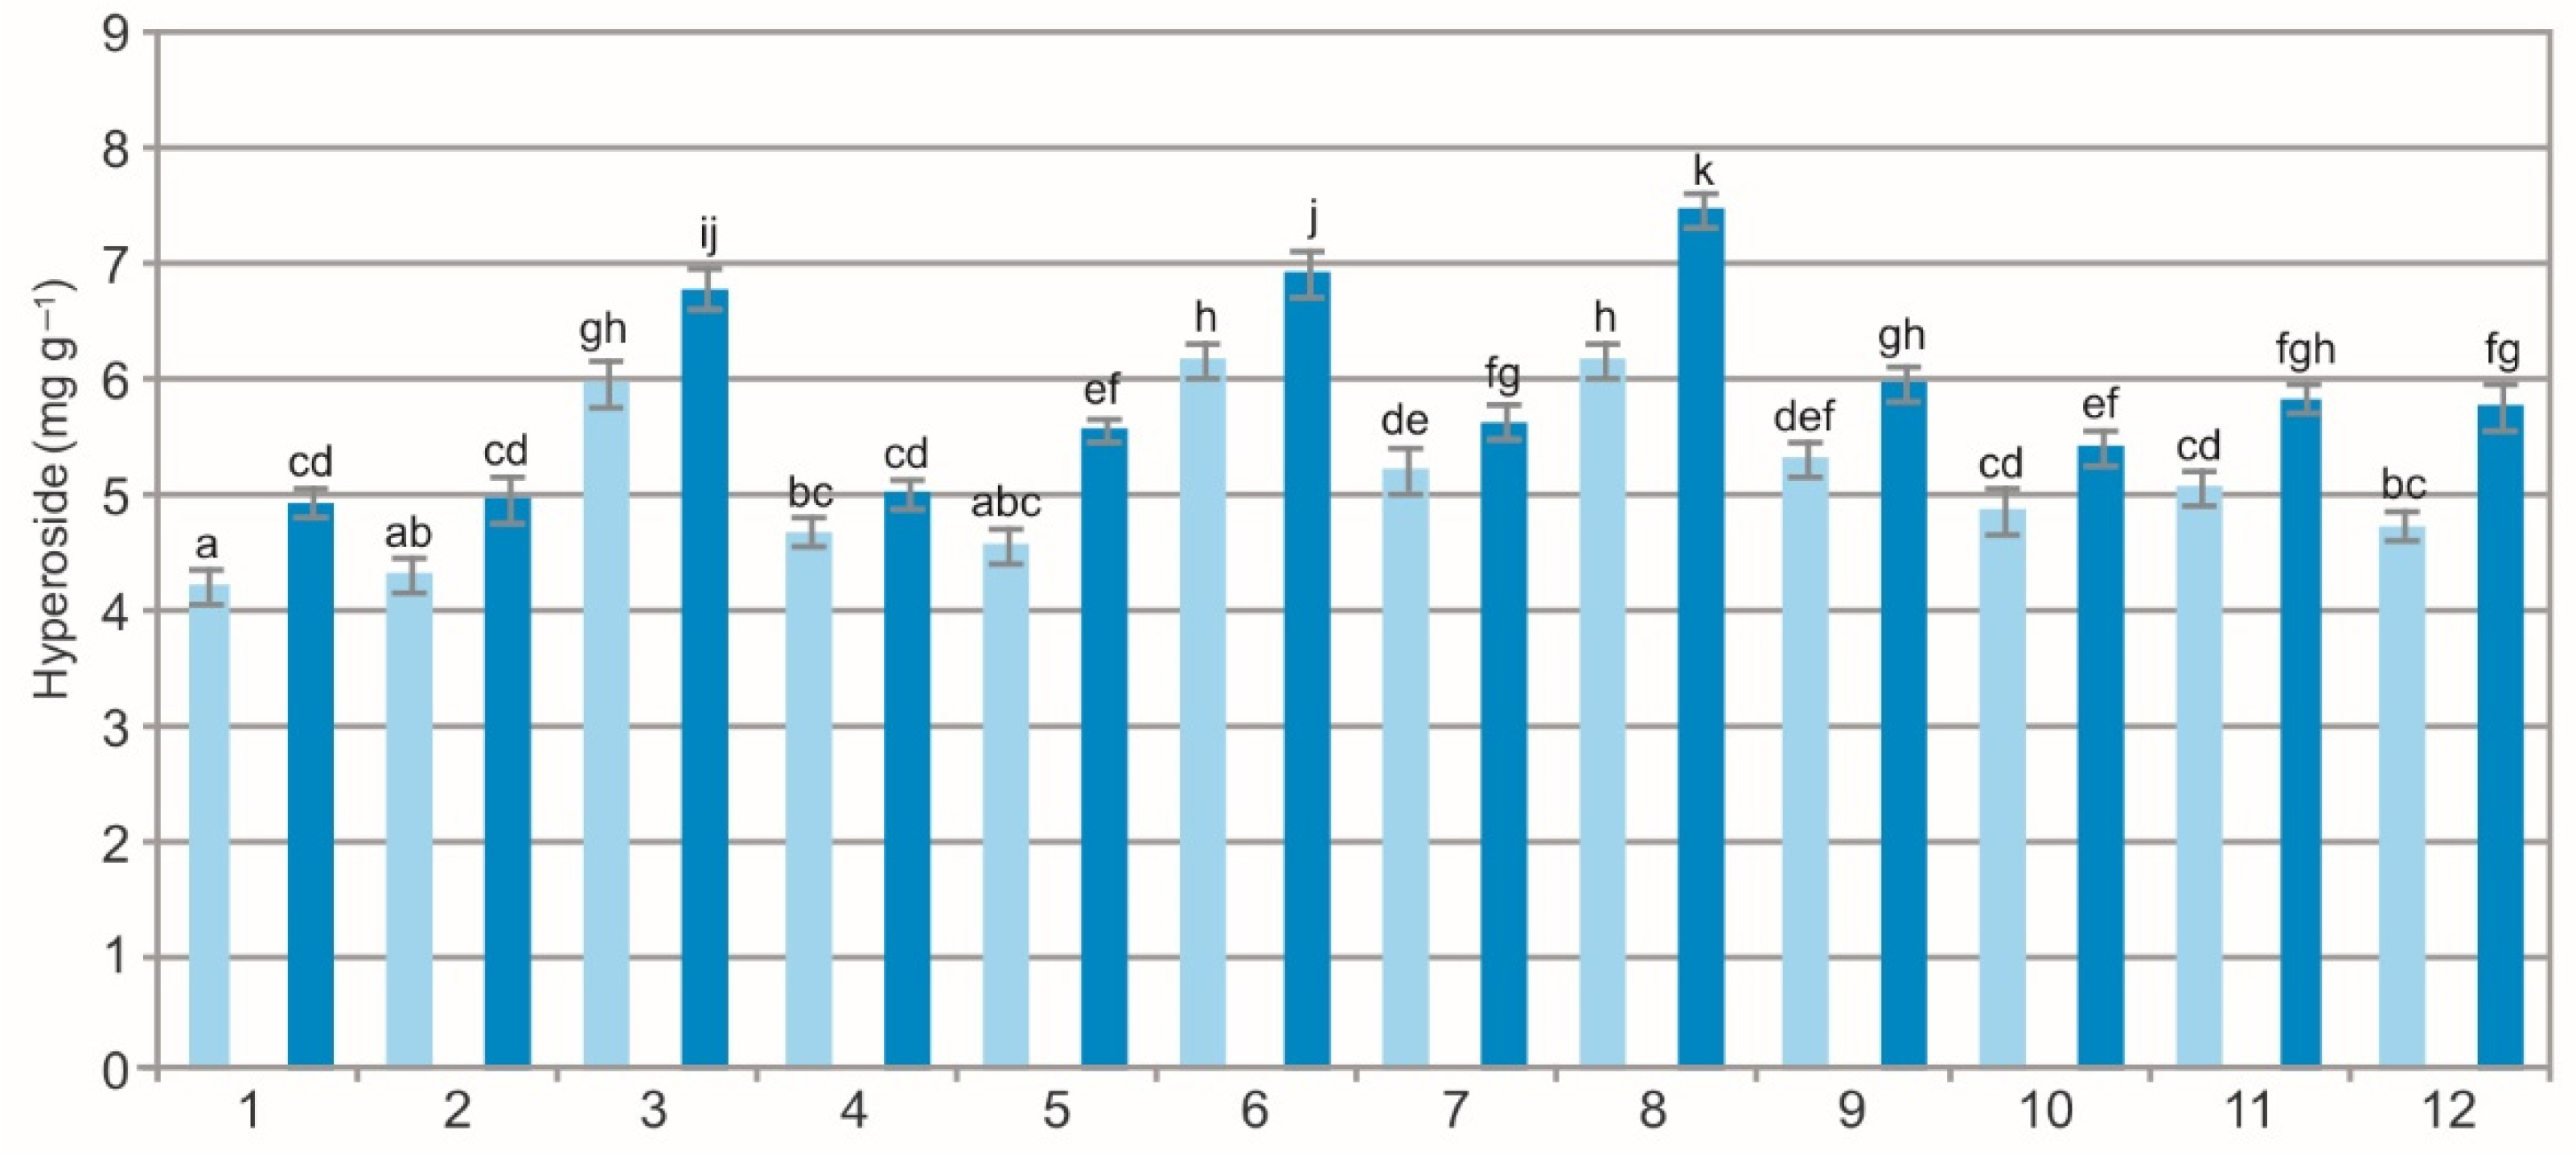
2.1. Characteristics of Secondary Metabolites
2.2. Antioxidant Activity
3. Materials and Methods
3.1. Chemicals
3.2. Habitat Characteristics and Plant Material
3.3. Extraction Procedure
3.3.1. Ethanol Extracts
3.3.2. Water Extracts (Infusions)
3.4. Phytochemical Characterization
3.4.1. Total Phenolic Concentration
3.4.2. Total Flavonoid Concentration
3.4.3. High-Performance Liquid Chromatography (HPLC)
3.4.4. Antioxidant Activity
3.5. Statistical Analysis
4. Conclusions
Author Contributions
Funding
Institutional Review Board Statement
Informed Consent Statement
Data Availability Statement
Conflicts of Interest
Sample Availability
References
- Chiocchio, I.; Mandrone, M.; Tomasi, P.; Marincich, L.; Poli, F. Plant secondary metabolites: An opportunity for circular economy. Molecules 2021, 26, 495. [Google Scholar] [CrossRef] [PubMed]
- Ramawat, K.G.; Arora, J. Medicinal Plants Domestication, Cultivation, Improvement, and Alternative Technologies for the Production of High Value Therapeutics: An Overview. In Medicinal Plants; Ekiert, H.M., Ramawat, K.G., Arora, J., Eds.; Sustainable Development and Biodiversity 28; Springer: Cham, Switzerland, 2021; pp. 1–29. [Google Scholar]
- Chen, S.L.; Yu, H.; Lo, H.M.; Wu, Q.; Li, C.F.; Steinmetz, A. Conservation and sustainable use of medicinal plants: Problems, progress, and prospects. Chin. Med. 2016, 11, 37. [Google Scholar] [CrossRef] [PubMed] [Green Version]
- Stefanescu, B.E.; Szabo, K.; Mocan, A.; Crisan, G. Phenolic compounds from five Ericaceae species leaves and their related bioavailability and health benefits. Molecules 2019, 24, 2046. [Google Scholar] [CrossRef] [PubMed] [Green Version]
- Lourenço, S.C.; Moldão-Martins, M.; Alves, V.D. Antioxidants of natural plant origins: From sources to food jndustry applications. Molecules 2019, 24, 4132. [Google Scholar] [CrossRef] [PubMed] [Green Version]
- Sugier, D.; Sugier, P.; Pawełek, M.; Gawlik-Dziki, U. Salix myrsinifolia Salisb. as a source of phenolic glycosides: Distribution and characteristic of habitat conditions in the mid-eastern Poland. Acta Sci. Pol. Hortorum Cultus 2011, 10, 75–88. [Google Scholar]
- Gawlik-Dziki, U.; Sugier, D.; Dziki, D.; Sugier, P. Bioaccessibility in vitro of nutraceuticals from bark of selected Salix species. Sci. World J. 2014, 2014, 782763. [Google Scholar] [CrossRef] [Green Version]
- Sugier, P.; Jakubowicz-Gil, J.; Sugier, D.; Kowalski, R.; Gawlik-Dziki, U.; Kołodziej, B.; Dziki, D. Chemical characteristics and anticancer activity of essential oil from Arnica montana L. rhizomes and roots. Molecules 2020, 25, 1284. [Google Scholar] [CrossRef] [Green Version]
- Asensio, E.; Vitales, D.; Pérez, I.; Peralba, L.; Viruel, J.; Montaner, C.; Vallès, J.; Garnatje, T.; Sales, E. Phenolic compounds content and genetic diversity at population level across the natural distribution range of Bearberry (Arctostaphylos uva-ursi, Ericaceae) in the Iberian Peninsula. Plants 2020, 9, 1250. [Google Scholar] [CrossRef]
- Sugier, P.; Sęczyk, Ł.; Sugier, D.; Krawczyk, R.; Wójcik, M.; Czarnecka, J.; Okoń, S.; Plak, A. Chemical characteristics and antioxidant activity of Arctostaphylos uva-ursi L. Spreng. at the southern border of the geographical range of the species in Europe. Molecules 2021, 26, 7692. [Google Scholar] [CrossRef]
- Tumova, L.; Doleckova, I.; Hendrychova, H.; Kasparova, M. Arbutin content and tyrosinase activity of Bergenia extracts. Nat. Prod. Commun. 2017, 12, 549–552. [Google Scholar]
- Cho, J.-Y.; Park, K.Y.; Lee, K.H.; Lee, H.J.; Lee, S.-H.; Cho, J.A.; Kim, W.-S.; Shin, S.-C.; Park, K.-H.; Moon, J.-H. Recovery of arbutin in high purity from fruit peels of pear (Pyrus pyrifolia Nakai). Food Sci. Biotechnol. 2011, 20, 801–807. [Google Scholar] [CrossRef]
- Jurica, K.; Brčić Karačonji, I.; Mikolić, A.; Milojković-Opsenica, D.; Benković, V.; Kopjar, N. In vitro safety assessment of the strawberry tree (Arbutus unedo L.) water leaf extract and arbutin in human peripheral blood lymphocytes. Cytotechnology 2018, 70, 1261–1278. [Google Scholar] [CrossRef] [PubMed]
- Lukas, B.; Schmiderer, C.; Mitteregger, U.; Novak, J. Arbutin in marjoram and oregano. Food Chem. 2010, 121, 185–190. [Google Scholar] [CrossRef]
- Bilz, M.; Kell, S.P.; Maxted, N.; Lansdown, R.V. European Red List of Vascular Plants; Publications Office of the European Union: Luxembourg, 2011; pp. 1–130. [Google Scholar]
- Allen, D.; Bilz, M.; Leaman, D.J.; Miller, R.M.; Timoshyna, A.; Window, J. European Red List of Medicinal Plants; Publications Office of the European Union: Luxembourg, 2014. [Google Scholar]
- Procházka, F. Černý a červený seznam cévnatých rostlin České republiky (stav v roce 2000). Příroda 2001, 18, 1–166. [Google Scholar]
- Petrova, A.; Vladimirov, V. Red List of Bulgarian Vascular Plants. Phytol. Balc. 2009, 15, 63–94. [Google Scholar]
- Kaźmierczakowa, R.; Bloch-Orłowska, J.; Celka, Z.; Cwener, A.; Dajdok, Z.; Michalska-Hejduk, D.; Pawlikowski, P.; Szczęśniak, E.; Ziarnek, K. Polska Czerwona Lista Paprotników i Roślin Kwiatowych. Polish Red List of Pteridophytes and Flowering Plants; Instytut Ochrony Przyrody Polskiej Akademii Nauk: Kraków, Poland, 2016. [Google Scholar]
- Carrión, J.A.P.; Mur, C. Propagación vegetativa de la gayuba (Arctostaphylos uva-ursi L.). An. INIA Ser. Recur. Nat. 1980, 4, 173–182. [Google Scholar]
- Pihlik, U. Arctostaphyos uva-ursi in Estonia. 2: Biomass resources and their rational exploitation. Eesti NSV Tead. Akad. TOIM Biol. 1989, 38, 40–51. [Google Scholar]
- Polish Pharmaceutical Society. Polish Pharmacopoeia VI.; The Minister of Health: Warsaw, Poland, 2002. [Google Scholar]
- Lamien-Meda, A.; Lukas, B.; Schmiderer, C.; Franz, C.; Novak, J. Validation of a quantitative assay of arbutin using gas chromatography in Origanum majorana and Arctostaphylos uva-ursi extracts. Phytochem. Anal. 2009, 20, 416–420. [Google Scholar] [CrossRef]
- Panusa, A.; Petrucci, R.; Marrosu, G.; Multari, G.; Gallo, F.R. UHPLC-PDA-ESI-TOF/MS metabolic profiling of Arctostaphylos pungens and Arctostaphylos uva-ursi. A comparative study of phenolic compounds from leaf methanolic extracts. Phytochemistry 2015, 115, 79–88. [Google Scholar] [CrossRef]
- Beaux, D.; Fleurentin, J.; Mortier, F. Effect of extracts of Orthosiphon stamineus Benth, Hieracium pilosella L., Sambucus nigra L. and Arctostaphylos uva-ursi (L.) Spreng. in rats. Phyther. Res. 1999, 13, 222–225. [Google Scholar] [CrossRef]
- Vranješ, M.; Popović, B.M.; Štajner, D.; Ivetić, V.; Mandić, A.; Vranješ, D. Effects of bearberry, parsley and corn silk extracts on diuresis, electrolytes composition, antioxidant capacity and histopathological features in mice kidneys. J. Funct. Foods 2016, 21, 272–282. [Google Scholar] [CrossRef]
- Wrona, M.; Blasco, S.; Becerril, R.; Nerin, C.; Sales, E.; Asensio, E. Antioxidant and antimicrobial markers by UPLC®–ESI-Q-TOF-MSE of a new multilayer active packaging based on Arctostaphylos uva-ursi. Talanta 2019, 196, 498–509. [Google Scholar] [CrossRef] [PubMed]
- Carpenter, R.; O’Grady, M.N.; O’Callaghan, Y.; O’Brien, N.M.; Kerry, J.P. Evaluation of the antioxidant potential of grape seed and bearberry extracts in raw and cooked pork. Meat Sci. 2007, 76, 604–610. [Google Scholar] [CrossRef] [PubMed]
- Azman, N.A.M.; Gallego, M.G.; Segovia, F.; Abdullah, S.; Shaarani, S.M.; Almajano-Pablos, M.P. Study of the properties of bearberry leaf extract as a natural antioxidant in model foods. Antioxidants 2016, 5, 11. [Google Scholar] [CrossRef] [Green Version]
- Boo, Y.C. Arbutin as a skin depigmenting agent with antimelanogenic and antioxidant properties. Antioxidants 2021, 10, 1129. [Google Scholar] [CrossRef]
- Amarowicz, R.; Pegg, R.B. Inhibition of proliferation of human carcinoma cell lines by phenolic compounds from a bearberry-leaf crude extract and its fractions. J. Funct. Foods 2013, 5, 660–667. [Google Scholar] [CrossRef]
- Amarowicz, R.; Pegg, R.B.; Rahimi-Moghaddam, P.; Barl, B.; Weil, J.A. Free-radical scavenging capacity and antioxidant activity of selected plant species from the Canadian prairies. Food Chem. 2004, 84, 551–562. [Google Scholar] [CrossRef]
- Annuk, H.; Hirmo, S.; Türi, E.; Mikelsaar, M.; Arak, E.; Wadström, T. Effect on cell surface hydrophobicity and susceptibility of Helicobacter pylori to medicinal plant extracts. FEMS Microbiol. Lett. 1999, 172, 41–45. [Google Scholar] [CrossRef] [Green Version]
- Vučić, D.M.; Petković, M.R.; Rodić-Grabovac, D.B.; Vasić, S.M.; Čomić, L.R. In vitro efficacy of extracts of Arctostaphylos uva-ursi L. on clinical isolated Escherichia coli and Enterococcus faecalis strains. Kragujev. J. Sci. 2013, 35, 107–113. [Google Scholar]
- Turković, A.H.; Gunjač, M.; Marjanović, M.; Lovrić, M.; Butorac, A.; Rašić, D.; Peraica, M.; Bok, V.V.; Šola, I.; Rusak, G.; et al. Proteome changes in human bladder T24 cells induced by hydroquinone derived from Arctostaphylos uva-ursi herbal preparation. J. Ethnopharmacol. 2022, 289, 115092. [Google Scholar] [CrossRef]
- Schindler, G.; Patzak, U.; Brinkhaus, B.; von Niecieck, A.; Wittig, J.; Krähmer, N.; Glöckl, I.; Veit, M. Urinary excretion and metabolism of arbutin after oral administration of Arctostaphylos uvae ursi extract as film-coated tablets and aqueous solution in healthy humans. J. Clin. Pharmacol. 2002, 42, 920–927. [Google Scholar] [CrossRef] [PubMed]
- Jurica, K.; Karačonji, I.B.; Šegan, S.; Opsenica, D.M.; Kremer, D. Quantitative analysis of arbutin and hydroquinone in strawberry tree (Arbutus unedo L., Ericaceae) leaves by gas chromatography-mass spectrometry. Arh. Hig. Rada Toksikol. 2015, 66, 197–202. [Google Scholar] [CrossRef] [PubMed] [Green Version]
- De Arriba, S.G.; Naser, B.; Nolte, K.-U. Risk assessment of free hydroquinone derived from Arctostaphylos uva-ursi folium herbal preparations. Int. J. Toxicol. 2014, 32, 442–453. [Google Scholar] [CrossRef]
- Song, X.C.; Canellas, E.; Dreolin, N.; Nerin, C.; Goshawk, J. Discovery and characterization of phenolic compounds in bearberry (Arctostaphylos uva-ursi) leaves using Liquid Chromatography-Ion Mobility-High-Resolution Mass Spectrometry. J. Agric. Food Chem. 2021, 69, 10856–10868. [Google Scholar] [CrossRef]
- Naczk, M.; Pegg, R.B.; Amarowicz, R. Protein-precipitating capacity of bearberry-leaf (Arctostaphylos uva-ursi L. Sprengel) polyphenolics. Food Chem. 2011, 124, 1507–1513. [Google Scholar] [CrossRef]
- Cui, T.; Nakamura, K.; Ma, L.; Li, J.Z.; Kayahara, H. Analyses of arbutin and chlorogenic acid, the major phenolic constituents in oriental pear. J. Agric. Food Chem. 2005, 53, 3882–3887. [Google Scholar] [CrossRef] [PubMed]
- Sasaki, C.; Ichitani, M.; Kunimoto, K.K.; Asada, C.; Nakamura, Y. Extraction of arbutin and its comparative content in branches, leaves, stems, and fruits of Japanese pear Pyrus pyrifolia cv. Kousui. Biosci. Biotechnol. Biochem. 2014, 78, 874–877. [Google Scholar] [CrossRef]
- Lee, B.-D.; Eun, J.-B. Optimum extraction conditions for arbutin from Asian pear peel by supercritical fluid extraction (SFE) using Box-Behnken design. J. Med. Plants Res. 2012, 6, 2348–2364. [Google Scholar]
- Council of Europe. European Pharmacopoeia, 8.1 Supplement, 8th ed.; Council of Europe: Strasbourg, France, 2014. [Google Scholar]
- Parejo, I.; Viladomat, F.; Bastida, J.; Codina, C. Variation of the arbutin content in different wild populations of Arctostaphylos uva-ursi in Catalonia, Spain. J. Herbs Spices Med. Plants 2002, 9, 329–333. [Google Scholar] [CrossRef]
- Matsuda, H.; Higashino, M.; Nakai, Y.; Iinuma, M.; Kubo, M.; Lang, F.A. Studies of cuticle drugs from natural sources. IV. Inhibitory effects of some Arctostaphylos plants on melanin biosynthesis. Biol. Pharm. Bull. 1996, 19, 153–156. [Google Scholar] [CrossRef] [Green Version]
- Bang, S.H.; Han, S.J.; Kim, D.H. Hydrolysis of arbutin to hydroquinone by human skin bacteria and its effect on antioxidant activity. J. Cosmet. Dermatol. 2008, 7, 189–193. [Google Scholar] [CrossRef] [PubMed]
- Chang, N.F.; Chen, Y.S.; Lin, Y.J.; Tai, T.H.; Chen, A.N.; Huang, C.H.; Lin, C.C. Study of hydroquinone mediated cytotoxicity and hypopigmentation effects from UVB-irradiated arbutin and deoxyarbutin. Int. J. Mol. Sci. 2017, 18, 969. [Google Scholar] [CrossRef] [PubMed] [Green Version]
- Zhang, F.; Luo, S.Y.; Ye, Y.B.; Zhao, W.H.; Sun, X.G.; Wang, Z.Q.; Li, R.; Sun, Y.H.; Tian, W.X.; Zhang, Y.X. The antibacterial efficacy of an aceraceous plant [Shantung maple (Acer truncatum Bunge)] may be related to inhibition of bacterial beta-oxoacyl-acyl carrier protein reductase (FabG). Biotechnol. Appl. Biochem. 2008, 51, 73–78. [Google Scholar] [CrossRef] [PubMed]
- Kim, D.H.; Kim, M.J.; Kim, D.W.; Kim, G.Y.; Kim, J.K.; Gebru, Y.A.; Choi, H.S.; Kim, Y.H.; Kim, M.K. Changes of phytochemical components (urushiols, polyphenols, gallotannins) and antioxidant capacity during Fomitella fraxinea-mediated fermentation of Toxicodendron vernicifluum bark. Molecules 2019, 24, 683. [Google Scholar] [CrossRef] [PubMed] [Green Version]
- Oh, G.S.; Pae, H.O.; Oh, H.; Hong, S.G.; Kim, I.K.; Chai, K.Y.; Yun, Y.G.; Kwon, T.O.; Chung, H.T. In vitro anti-proliferative effect of 1,2,3,4,6-penta-O-galloyl-beta-D-glucose on human hepatocellular carcinoma cell line, SK-HEP-1 cells. Cancer Lett. 2001, 174, 17–24. [Google Scholar] [CrossRef]
- Cavalher-Machado, S.C.; Rosas, E.C.; de Brito, F.A.; Heringe, A.P.; de Oliveira, R.R.; Kaplan, M.A.; Figueiredo, M.R.; de Oliveira, M.D. The anti-allergic activity of the acetate fraction of Schinus terebinthifolius leaves in IgE induced mice paw edema and pleurisy. Int. Immunopharmacol. 2008, 8, 1552–1560. [Google Scholar] [CrossRef]
- Huh, J.E.; Lee, E.O.; Kim, M.S.; Kang, K.S.; Kim, C.H.; Cha, B.C.; Surh, Y.J.; Kim, S.H. Penta-O-galloyl-beta-D-glucose suppresses tumor growth via inhibition of angiogenesis and stimulation of apoptosis: Roles of cyclooxygenase-2 and mitogen-activated protein kinase pathways. Carcinogenesis 2005, 26, 1436–1445. [Google Scholar] [CrossRef]
- Kim, J.-A.; Lee, J.-E.; Kim, J.H.; Lee, H.-J.; Kang, N.J. Penta-1,2,3,4,6-O-galloyl-β-d-glucose inhibits UVB-induced photoaging by targeting PAK1 and JNK1. Antioxidants 2019, 8, 561. [Google Scholar] [CrossRef] [Green Version]
- Zhang, J.; Li, L.; Kim, S.H.; Hagerman, A.E.; Lü, J. Anti-cancer, anti-diabetic and other pharmacologic and biological activities of penta-galloyl-glucose. Pharm. Res. 2009, 26, 2066–2080. [Google Scholar] [CrossRef] [Green Version]
- Lee, H.J.; Seo, N.J.; Jeong, S.J.; Park, Y.; Jung, D.B.; Koh, W.; Lee, H.J.; Lee, E.O.; Ahn, K.S.; Ahn, K.S.; et al. Oral administration of penta-O-galloyl-beta-D-glucose suppresses triple-negative breast cancer xenograft growth and metastasis in strong association with JAK1-STAT3 inhibition. Carcinogenesis 2011, 32, 804–811. [Google Scholar] [CrossRef]
- Kesari, K.K.; Dhasmana, A.; Shandilya, S.; Prabhakar, N.; Shaukat, A.; Dou, J.; Rosenholm, J.M.; Vuorinen, T.; Ruokolainen, J. Plant-derived natural biomolecule picein attenuates menadione induced oxidative stress on neuroblastoma cell mitochondria. Antioxidants 2020, 9, 552. [Google Scholar] [CrossRef] [PubMed]
- Dong, X.R.; Luo, M.; Fan, L.; Zhang, T.; Liu, L.; Dong, J.H.; Wu, G. Corilagin inhibits the double strand break-triggered NF-kappaB pathway in irradiated microglial cells. Int. J. Mol. Med. 2010, 25, 531–536. [Google Scholar] [PubMed]
- Pham, A.T.; Malterud, K.E.; Paulsen, B.S.; Diallo, D.; Wangensteen, H. DPPH radical scavenging and xanthine oxidase inhibitory activity of Terminalia macroptera leaves. Nat. Prod. Commun. 2011, 6, 1125–1128. [Google Scholar] [CrossRef] [PubMed] [Green Version]
- Yang, F.; Wang, Y.; Xue, J.; Ma, Q.; Zhang, J.; Chen, Y.F.; Shang, Z.Z.; Li, Q.Q.; Zhang, S.L.; Zhao, L. Effect of corilagin on the miR-21/smad7/ERK signaling pathway in a schistosomiasis-induced hepatic fibrosis mouse model. Parasitol. Int. 2016, 65, 308–315. [Google Scholar] [CrossRef] [PubMed]
- Hao, X.L.; Kang, Y.; Li, J.K.; Li, Q.S.; Liu, E.L.; Liu, X.X. Protective effects of hyperoside against H2O2-induced apoptosis in human umbilical vein endothelial cells. Mol. Med. Rep. 2016, 14, 399–405. [Google Scholar] [CrossRef] [Green Version]
- Wu, W.; Xie, Z.; Zhang, Q.; Ma, Y.; Bi, X.; Yang, X.; Li, B.; Chen, J. Hyperoside ameliorates diabetic retinopathy via anti-oxidation, inhibiting cell damage and apoptosis induced by high glucose. Front. Pharmacol. 2020, 11, 797. [Google Scholar] [CrossRef]
- Wang, L.; Yue, Z.; Guo, M.; Fang, L.; Bai, L.; Li, X.; Tao, Y.; Wang, S.; Liu, Q.; Zhi, D.; et al. Dietary flavonoid hyperoside induces apoptosis of activated human LX-2 hepatic stellate cell by suppressing canonical NF-κB signaling. BioMed Res. Int. 2016, 2016, 1068528. [Google Scholar] [CrossRef] [Green Version]
- Romagnolo, D.F.; Selmin, O.I. Flavonoids and cancer prevention: A review of the evidence. J. Nutr. Gerontol. Geriatr. 2012, 31, 206–238. [Google Scholar] [CrossRef]
- Testa, R.; Bonfigli, A.R.; Genovese, S.; De Nigris, V.; Ceriello, A. The possible role of flavonoids in the prevention of diabetic complications. Nutrients 2016, 8, 310. [Google Scholar] [CrossRef] [Green Version]
- Agostini-Costa, T.S.; Teodoro, A.F.P.; Alves, R.B.N.; Braga, L.R.; Ribeiro, I.F.; Silva, J.P.; Quintana, L.G.; Burle, M.L. Total phenolics, flavonoids, tannins and antioxidant activity of Lima beans conserved in a Brazilian Genebank. Cienc. Rural 2015, 45, 335–341. [Google Scholar] [CrossRef] [Green Version]
- Orak, H.H.; Karamac, M.; Orak, A.; Amarowicz, R. Antioxidant potential and phenolic compounds of some widely consumed Turkish white bean (Phaseolus vulgaris L.) varieties. Pol. J. Food Nutr. Sci. 2016, 66, 253–260. [Google Scholar] [CrossRef]
- Singleton, V.L.; Rossi, J.A. Colorimetry of total phenolics with phosphomolybdic-phosphotungstic acid reagents. Am. J. Enol. Vitic. 1965, 16, 144–158. [Google Scholar]
- Lamaison, J.L.; Carnart, A. Teneurs en principaux flavonoïdes des fleurs et feuilles de Crataegeus monogyna Jacq. et de Crataegeus laevigata (Poiret) DC. Pharm. Acta Helv. 1990, 65, 315–320. [Google Scholar]
- Re, R.; Pellegrini, N.; Proteggente, A.; Pannala, A.; Yang, M.; Rice-Evans, C. Antioxidant activity applying an improved ABTS radical cation decolorization assay. Free Radic. Biol. Med. 1999, 26, 1231–1237. [Google Scholar] [CrossRef]
- Brand-Williams, W.; Cuvelier, M.E.; Berset, C. Use of a free radical method to evaluate antioxidant activity. LWT Food Sci. Technol. 1995, 28, 25–30. [Google Scholar] [CrossRef]
- Benzie, I.F.F.; Strain, J.J. The ferric reducing ability of plasma (FRAP) as a measure of “antioxidant power”: The FRAP assay. Anal. Biochem. 1996, 239, 70–76. [Google Scholar] [CrossRef] [Green Version]
- Guo, R.; Lee, H.-I.; Chiang, S.-H.; Lin, F.-I.; Chang, Y. Antioxidant properties of the extracts from different parts of broccoli in Taiwan. J. Food Drug Anal. 2001, 9, 96–101. [Google Scholar] [CrossRef]
- Kovach, W. MVSP—A Multivariate Statistical Package for Windows, version 3.1; Kovach Computing Services: Wales, UK, 1999. [Google Scholar]


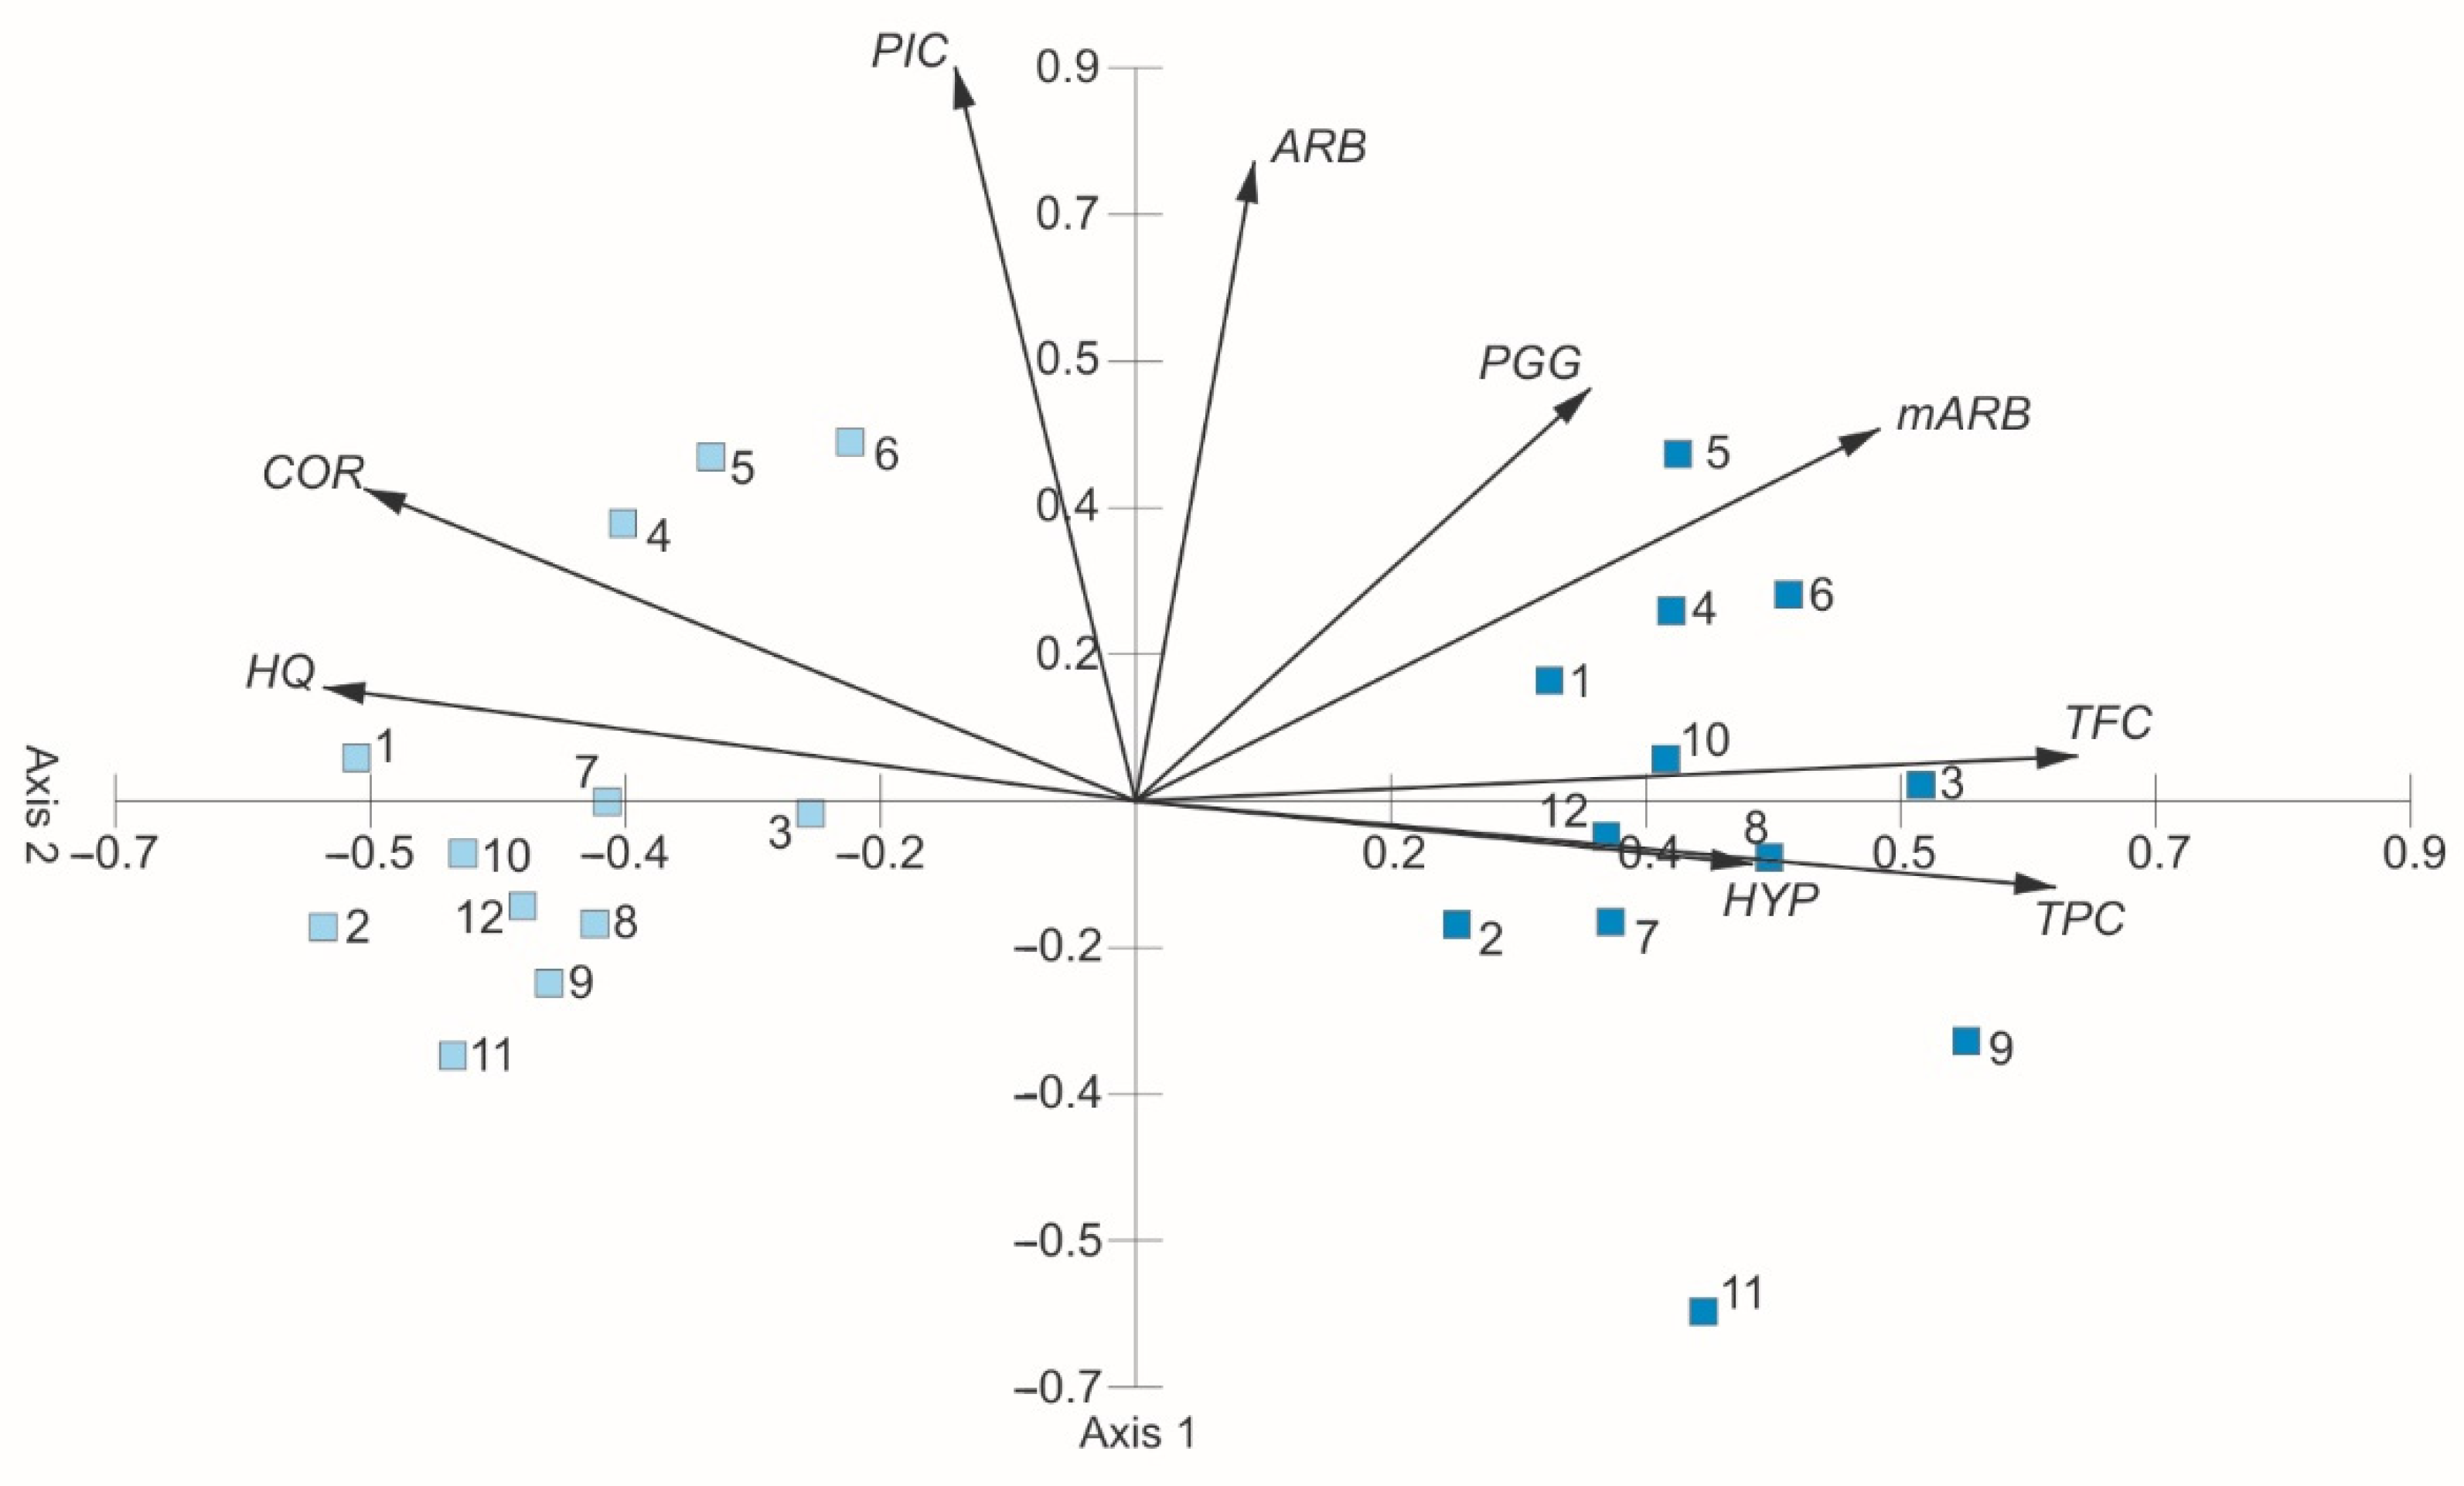
| Axis 1 | Axis 2 | |
|---|---|---|
| Eigenvalues | 4.08 | 1.58 |
| Percentage | 45.38 | 17.50 |
| TPC | 0.450 | −0.073 |
| TFC | 0.461 | 0.038 |
| ARB | 0.058 | 0.544 |
| HQ | −0.397 | 0.096 |
| mARB | 0.364 | 0.317 |
| PGG | 0.222 | 0.351 |
| PIC | −0.088 | 0.625 |
| COR | −0.377 | 0.266 |
| HYP | 0.302 | −0.054 |
| ABTS | DPPH | RP | CHEL | |||||
|---|---|---|---|---|---|---|---|---|
| No | Mean | SD | Mean | SD | Mean | SD | Mean | SD |
| 1 WE | 201.16 ab | 15.96 | 683.86 h | 16.84 | 251.42 a | 3.48 | 4.49 cde | 0.15 |
| 1 EE | 511.65 f | 17.26 | 387.71 ab | 25.22 | 359.70 ef | 3.72 | 5.60 hi | 0.14 |
| 2 WE | 243.57 cd | 17.16 | 787.67 ij | 37.84 | 270.66 bc | 7.62 | 4.23 bc | 0.18 |
| 2 EE | 548.77 g | 16.86 | 423.62 ab | 10.25 | 401.23 i | 5.51 | 3.56 a | 0.16 |
| 3 WE | 173.48 a | 13.44 | 723.18 hi | 28.23 | 245.37 a | 5.47 | 4.17 bc | 0.13 |
| 3 EE | 503.52 f | 15.25 | 361.82 a | 2.57 | 374.29 fgh | 5.00 | 5.85 i | 0.15 |
| 4 WE | 211.48 bc | 19.10 | 701.66 h | 22.39 | 259.05 abc | 6.72 | 4.31 bc | 0.10 |
| 4 EE | 560.28 g | 18.58 | 401.97 ab | 12.74 | 375.60 gh | 8.82 | 4.19 bc | 0.13 |
| 5 WE | 226.39 bc | 13.83 | 519.62 de | 15.96 | 257.10 ab | 5.94 | 3.74 a | 0.09 |
| 5 EE | 566.53 gh | 14.88 | 381.75 a | 25.89 | 377.82 gh | 7.94 | 4.90 gh | 0.14 |
| 6 WE | 201.16 ab | 13.75 | 821.78 j | 20.06 | 257.23 ab | 4.51 | 4.46 cde | 0.11 |
| 6 EE | 543.71 g | 19.05 | 372.18 ab | 13.52 | 376.51 gh | 7.64 | 4.78 ef | 0.16 |
| 7 WE | 194.45 ab | 13.95 | 665.70 gh | 27.64 | 247.20 a | 4.72 | 3.83 ab | 0.11 |
| 7 EE | 547.18 g | 13.94 | 377.33 ab | 11.12 | 353.26 e | 3.05 | 4.60 def | 0.09 |
| 8 WE | 191.80 ab | 15.87 | 677.25 h | 15.40 | 246.86 a | 6.01 | 4.53 cdef | 0.15 |
| 8 EE | 537.54 g | 11.98 | 385.79 ab | 13.48 | 361.20 efg | 5.93 | 4.17 bc | 0.14 |
| 9 WE | 195.43 ab | 17.65 | 605.27 fg | 28.95 | 261.21 abc | 2.07 | 4.33 cd | 0.16 |
| 9 EE | 561.95 g | 17.90 | 412.02 ab | 13.52 | 377.75 gh | 7.83 | 5.34 gh | 0.15 |
| 10 WE | 260.24 d | 13.96 | 572.98 ef | 29.56 | 275.74 b | 5.04 | 4.53 cdef | 0.08 |
| 10 EE | 596.31 h | 18.66 | 447.16 bc | 21.97 | 383.76 h | 5.58 | 4.61 cdef | 0.14 |
| 11 WE | 245.62 cd | 19.09 | 490.59 cd | 16.02 | 259.95 abc | 5.76 | 3.71 a | 0.09 |
| 11 EE | 556.75 g | 10.32 | 415.57 ab | 27.18 | 365.13 efg | 6.00 | 4.82 ef | 0.15 |
| 12 WE | 319.22 e | 15.25 | 723.90 hi | 13.59 | 296.20 d | 3.89 | 4.96 fg | 0.11 |
| 12 EE | 643.71 i | 19.91 | 516.28 de | 13.32 | 404.89 i | 5.77 | 4.89 ef | 0.14 |
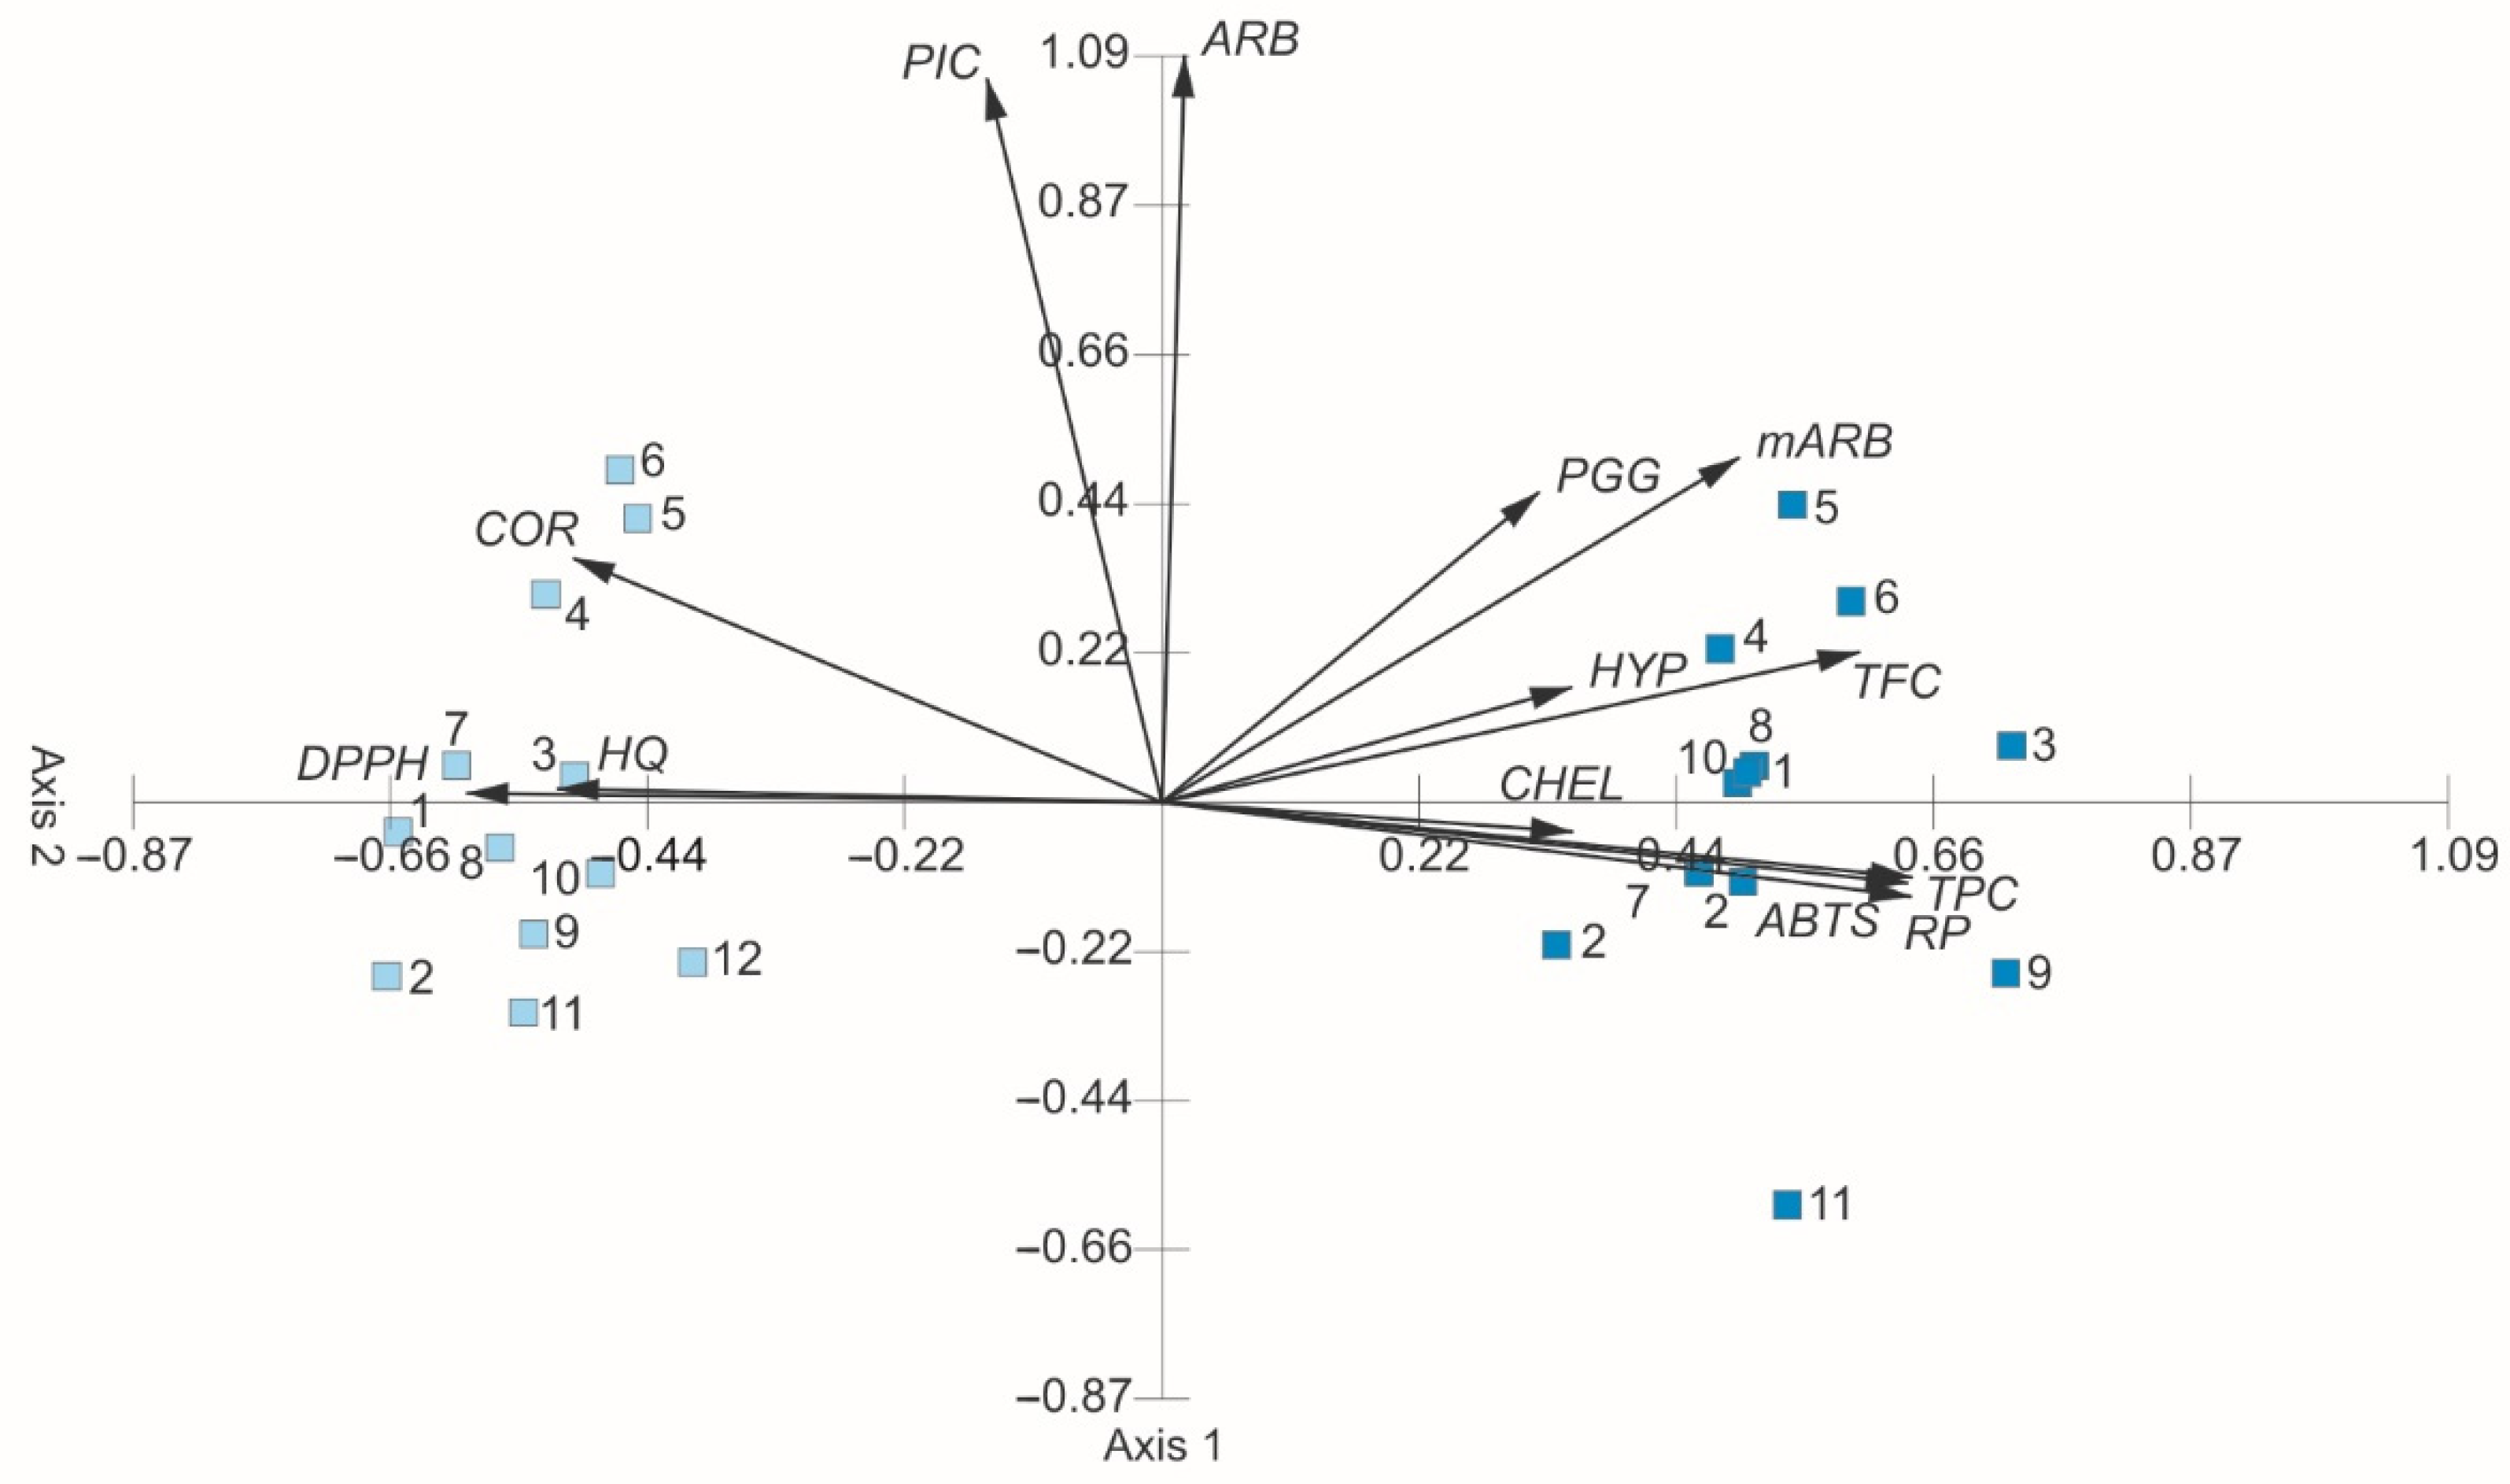
| Axis 1 | Axis 2 | |
|---|---|---|
| Eigenvalues | 6.90 | 1.59 |
| Percentage | 53.09 | 12.26 |
| TPC | 0.364 | −0.068 |
| TFC | 0.340 | 0.126 |
| ARB | 0.011 | 0.628 |
| HQ | −0.295 | 0.011 |
| mARB | 0.282 | 0.290 |
| PGG | 0.184 | 0.261 |
| PIC | −0.085 | 0.609 |
| COR | −0.287 | 0.205 |
| HYP | 0.200 | 0.097 |
| ABTS | 0.365 | −0.080 |
| DPPH | −0.339 | 0.008 |
| RP | 0.366 | −0.063 |
| CHEL | 0.200 | −0.025 |
| ABTS | DPPH | RP | CHEL | |
|---|---|---|---|---|
| TPC | 0.937 *** | −0.362 | 0.855 *** | 0.191 |
| TFC | −0.523 | 0.199 | −0.402 | 0.156 |
| ARB | −0.401 | −0.218 | −0.407 | −0.415 |
| HQ | 0.580 * | 0.378 | 0.592 * | 0.721 ** |
| mARB | 0.087 | 0.496 | 0.100 | −0.047 |
| PGG | 0.055 | 0.238 | 0.153 | 0.316 |
| PIC | −0.298 | 0.370 | −0.345 | 0.002 |
| COR | 0.218 | −0.061 | 0.369 | 0.064 |
| HYP | −0.492 | 0.233 | −0.430 | 0.067 |
| ABTS | DPPH | RP | CHEL | |
|---|---|---|---|---|
| TPC | 0.781 ** | 0.786 ** | 0.896 *** | −0.338 |
| TFC | −0.262 | −0.353 | −0.213 | 0.378 |
| ARB | −0.152 | −0.539 | −0.284 | 0.195 |
| HQ | 0.352 | 0.501 | 0.308 | −0.114 |
| mARB | −0.335 | −0.194 | 0.221 | 0.276 |
| PGG | 0.250 | 0.301 | 0.239 | 0.423 |
| PIC | 0.041 | −0.089 | 0.073 | −0.376 |
| COR | −0.347 | −0.387 | 0.199 | 0.222 |
| HYP | −0.230 | −0.316 | −0.235 | 0.171 |
Publisher’s Note: MDPI stays neutral with regard to jurisdictional claims in published maps and institutional affiliations. |
© 2022 by the authors. Licensee MDPI, Basel, Switzerland. This article is an open access article distributed under the terms and conditions of the Creative Commons Attribution (CC BY) license (https://creativecommons.org/licenses/by/4.0/).
Share and Cite
Sugier, P.; Sęczyk, Ł.; Sugier, D. Variation in Population and Solvents as Factors Determining the Chemical Composition and Antioxidant Potential of Arctostaphylos uva-ursi (L.) Spreng. Leaf Extracts. Molecules 2022, 27, 2247. https://0-doi-org.brum.beds.ac.uk/10.3390/molecules27072247
Sugier P, Sęczyk Ł, Sugier D. Variation in Population and Solvents as Factors Determining the Chemical Composition and Antioxidant Potential of Arctostaphylos uva-ursi (L.) Spreng. Leaf Extracts. Molecules. 2022; 27(7):2247. https://0-doi-org.brum.beds.ac.uk/10.3390/molecules27072247
Chicago/Turabian StyleSugier, Piotr, Łukasz Sęczyk, and Danuta Sugier. 2022. "Variation in Population and Solvents as Factors Determining the Chemical Composition and Antioxidant Potential of Arctostaphylos uva-ursi (L.) Spreng. Leaf Extracts" Molecules 27, no. 7: 2247. https://0-doi-org.brum.beds.ac.uk/10.3390/molecules27072247