Article

QSAR Studies on Andrographolide Derivatives as α-Glucosidase Inhibitors

1
Pharmacy College, Jinan University, Guangzhou, 510632, China
2
School of Pharmaceutical Sciences, Sun Yat-sen University, Guangzhou, 510275, China
*
Authors to whom correspondence should be addressed.
Int. J. Mol. Sci. 2010, 11(3), 880-895; https://0-doi-org.brum.beds.ac.uk/10.3390/ijms11030880
Submission received: 22 January 2010 / Revised: 2 February 2010 / Accepted: 3 February 2010 / Published: 2 March 2010
(This article belongs to the Special Issue Recent Advances in QSAR/QSPR Theory)

Abstract

:
Andrographolide derivatives were shown to inhibit α-glucosidase. To investigate the relationship between activities and structures of andrographolide derivatives, a training set was chosen from 25 andrographolide derivatives by the principal component analysis (PCA) method, and a quantitative structure-activity relationship (QSAR) was established by 2D and 3D QSAR methods. The cross-validation r2 (0.731) and standard error (0.225) illustrated that the 2D-QSAR model was able to identify the important molecular fragments and the cross-validation r2 (0.794) and standard error (0.127) demonstrated that the 3D-QSAR model was capable of exploring the spatial distribution of important fragments. The obtained results suggested that proposed combination of 2D and 3D QSAR models could be useful in predicting the α-glucosidase inhibiting activity of andrographolide derivatives.

1. Introduction

Andrographis paniculate is a plant widely used as a traditional Chinese medicine in China, India, and other Asian countries [1,2]. Extracts and constituents of Andrographis paniculate exhibit broad pharmacological activities, such as anti-bacterial, ant-malarial, anti-inflammatory, anti-tumor, immunological regulation, and hepatoprotective effects [312]. Lately, some andrographolide derivatives were reported to decrease blood glucose level by inhibiting α-glucosidase [13,14]. It has been well known that α-glucosidase is a key enzyme in the absorption of sugar in the small intestine mucous membrane, and its activity is closely related to blood glucose levels. Studies also indicated that α-glucosidase might be involved in diabetes [1520]. Accordingly, α-glucosidase is considered an important target for the design of antidiabetic drugs. Recently, efforts had been made in modification and synthesis of novel andrographolide derivatives to find more potent and safer α-glucosidase inhibitors. Knowledge about the relationships between structures of andrographolide derivatives and their inhibitory activities on α-glucosidase could greatly facilitate the drug discovery process.
QSAR [21] has been widely used for years to provide quantitative analysis of structure and activity relationships of compounds. Statistical methods are applied in QSAR modeling to establish correlations between chemical structures and their biological activities. Once validated, the findings can be used to predict activities of untested compounds. Recently, computer-assisted drug design based on QSAR has been successfully employed to develop new drugs for the treatment of cancer, AIDS, SARS, and other diseases [2229]. With the availability of large commercial databases and highly efficient programs including Sybyl, Discovery studio, MOE and so on, it is estimated that QSAR modeling as a tool could remarkably reduces the cost of drug discovery [30].
In this study, 2D QSAR models were constructed to describe the important fragments in andrographolide derivatives and 3D QSAR models were established to explore the spatial distribution of important groups. The combination of 2D and 3D QSAR models could better summarize the QSAR of andrographolide derivatives in inhibiting α-glucosidase.

2. Computational Methods

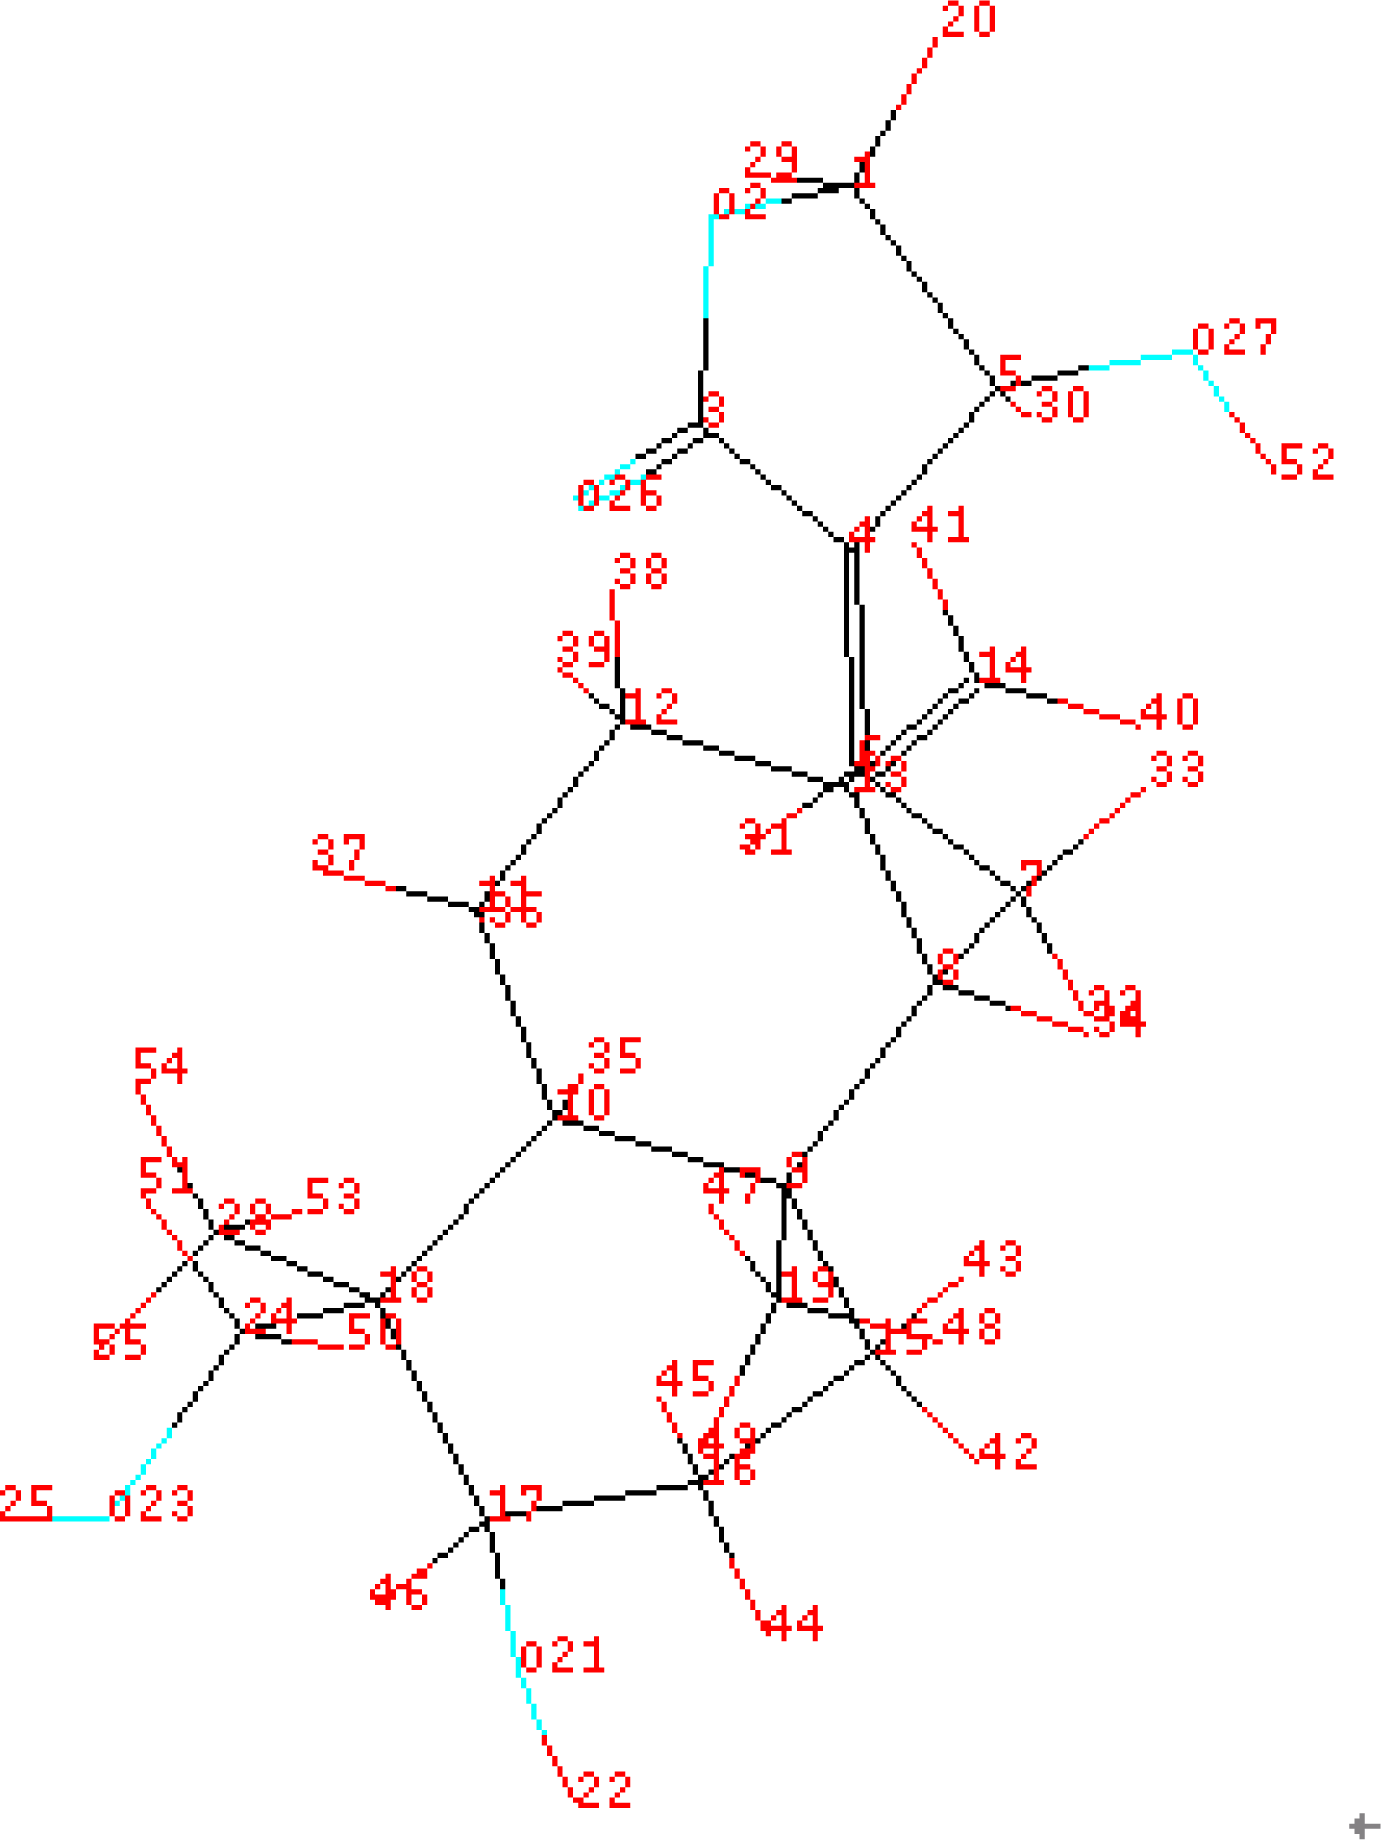
2.1. Database and Software

The structures and inhibitory activities (IC50) of 25 andrographolide derivatives (Figure 1) were collected from the literature, and served as the database to build QSAR models [13,14,31]. PLogIC50 was used as the dependent variable of QSAR model. PCA, HQSAR, CoMFA, CoMSIA were performed by Sybyl7.03 (Tripos Co., LTD) program.

2.2. Training Set Selection

Principle Component Analysis (PCA), employed to select the training set, could be applied to explain the differences among the 25 andrographolide derivatives through diversities of the structures’ parameters and to exhibit their distribution on a 2D plot [32]. Furthermore, the most descriptive compounds (MDC) or the largest minimum distance (LMD) methods were applied to select the training set according to the distribution of these compounds.

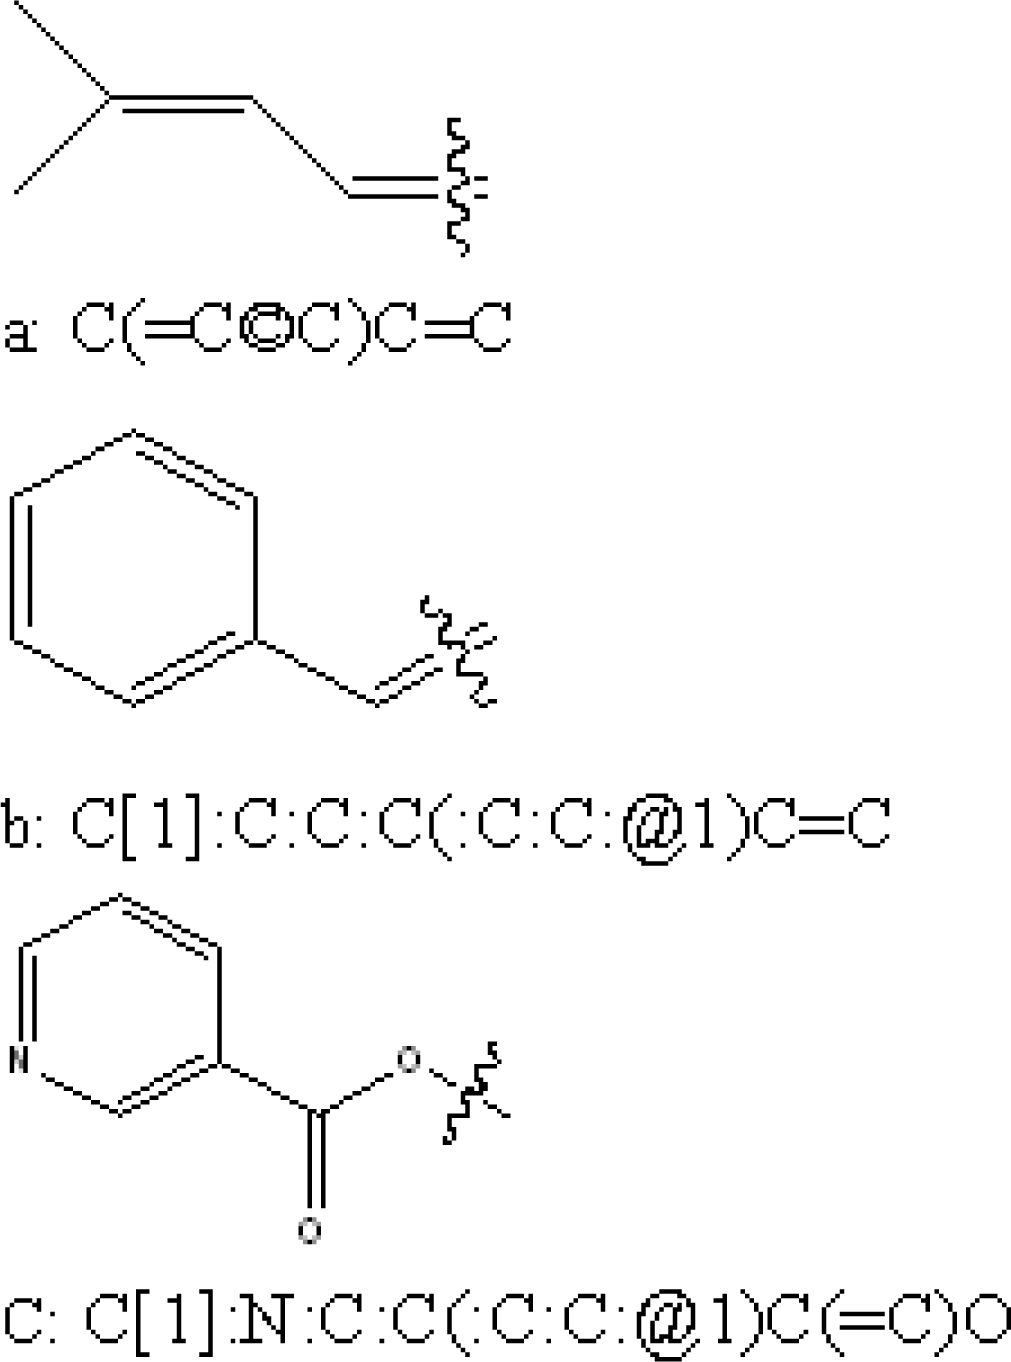
2.3. Generation and Validation of the 2D QSAR Model

Hologram QSAR (HQSAR) offers the ability to rapidly generate QSAR models of high statistical quality and predicted value by SYBYL line notation (SLN), cyclic redundancy check (CRC) and partial least squares (PLS) [3335]. The premise of HQSAR is that since the structure of a molecule is encoded within its 2D fingerprint and that structure is the key determinant of all molecular properties (including biological activity), it should be possible to predict the activity of a molecule from its fingerprint.
The training set was used to establish 2D-QSAR model by HQSAR, and the best 2D-QSAR model was applied by the criterion of cross-validation R2. The test set’s biological activity was predicted by the best 2D-QSAR model, whose predictability was validated by correlation coefficient between the predicted and experimental values. The most common structure (MCS) could be calculated by HQSAR. Based on the MCS of andrographolide derivatives, the contributions of molecules’ fragments to biological activity should be analyzed for describing the QSAR of andrographolide derivatives as α-glucosidase inhibitors.

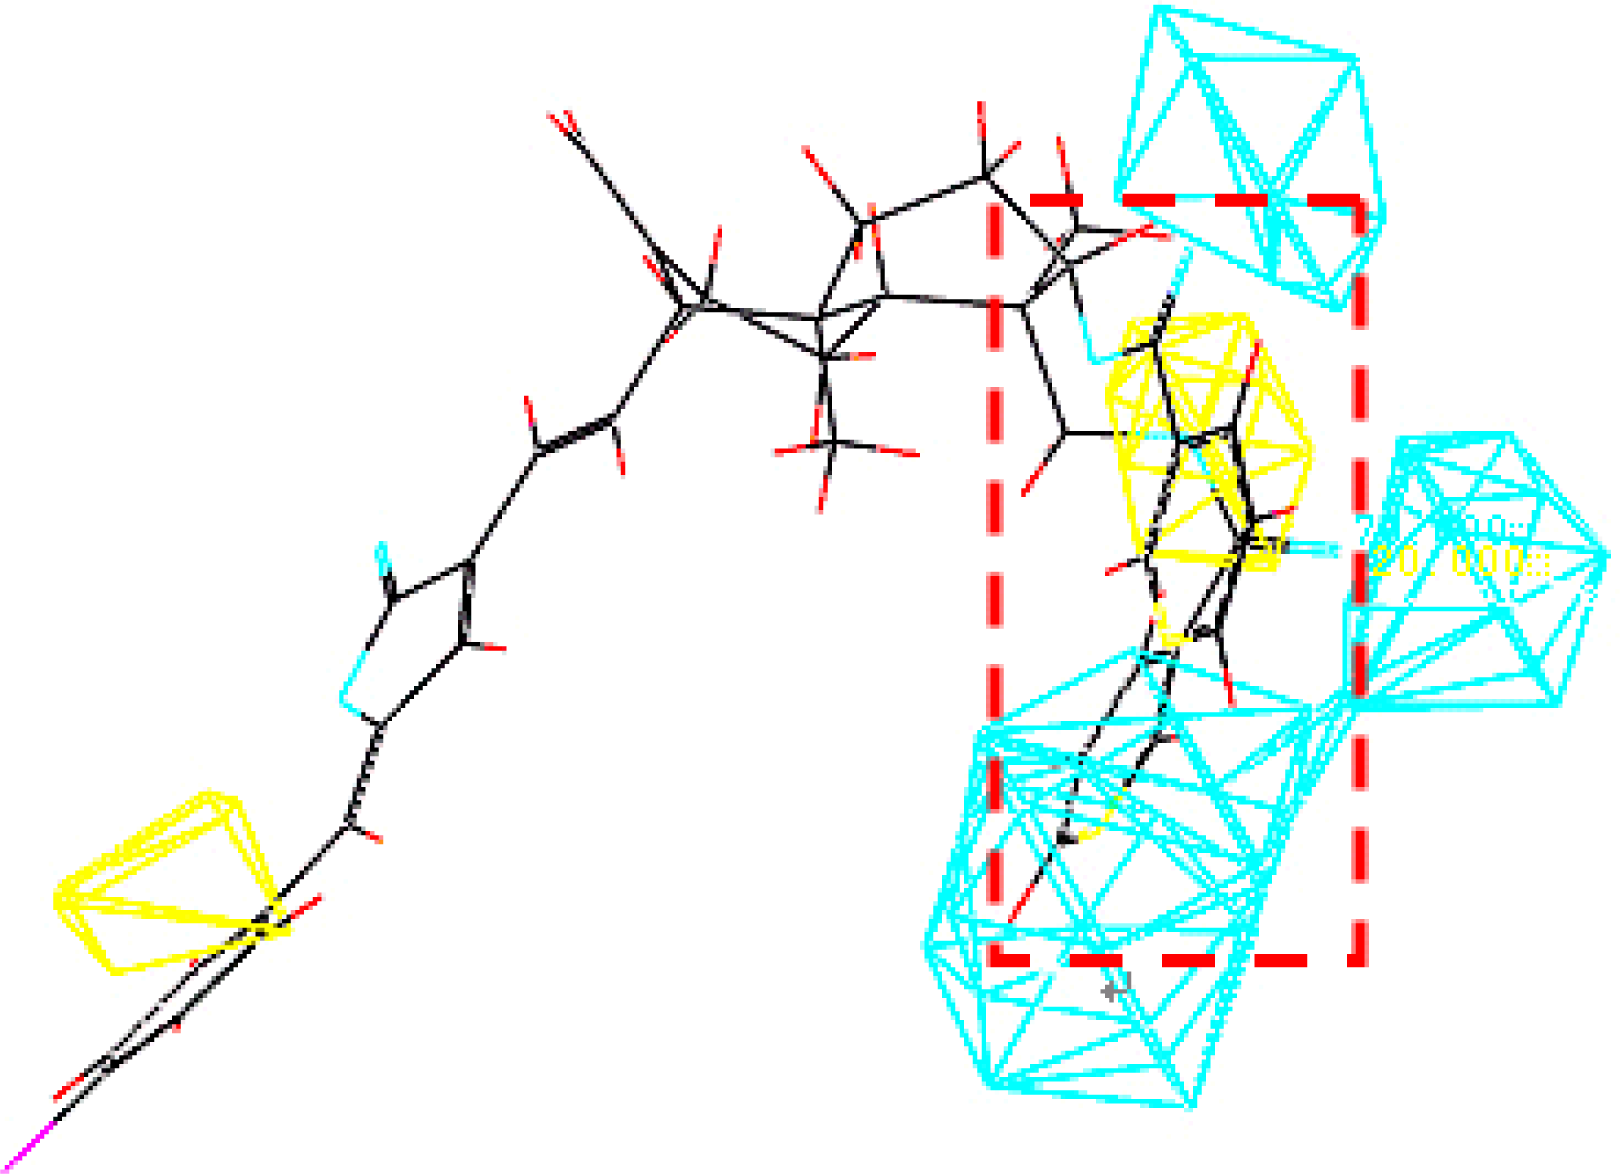
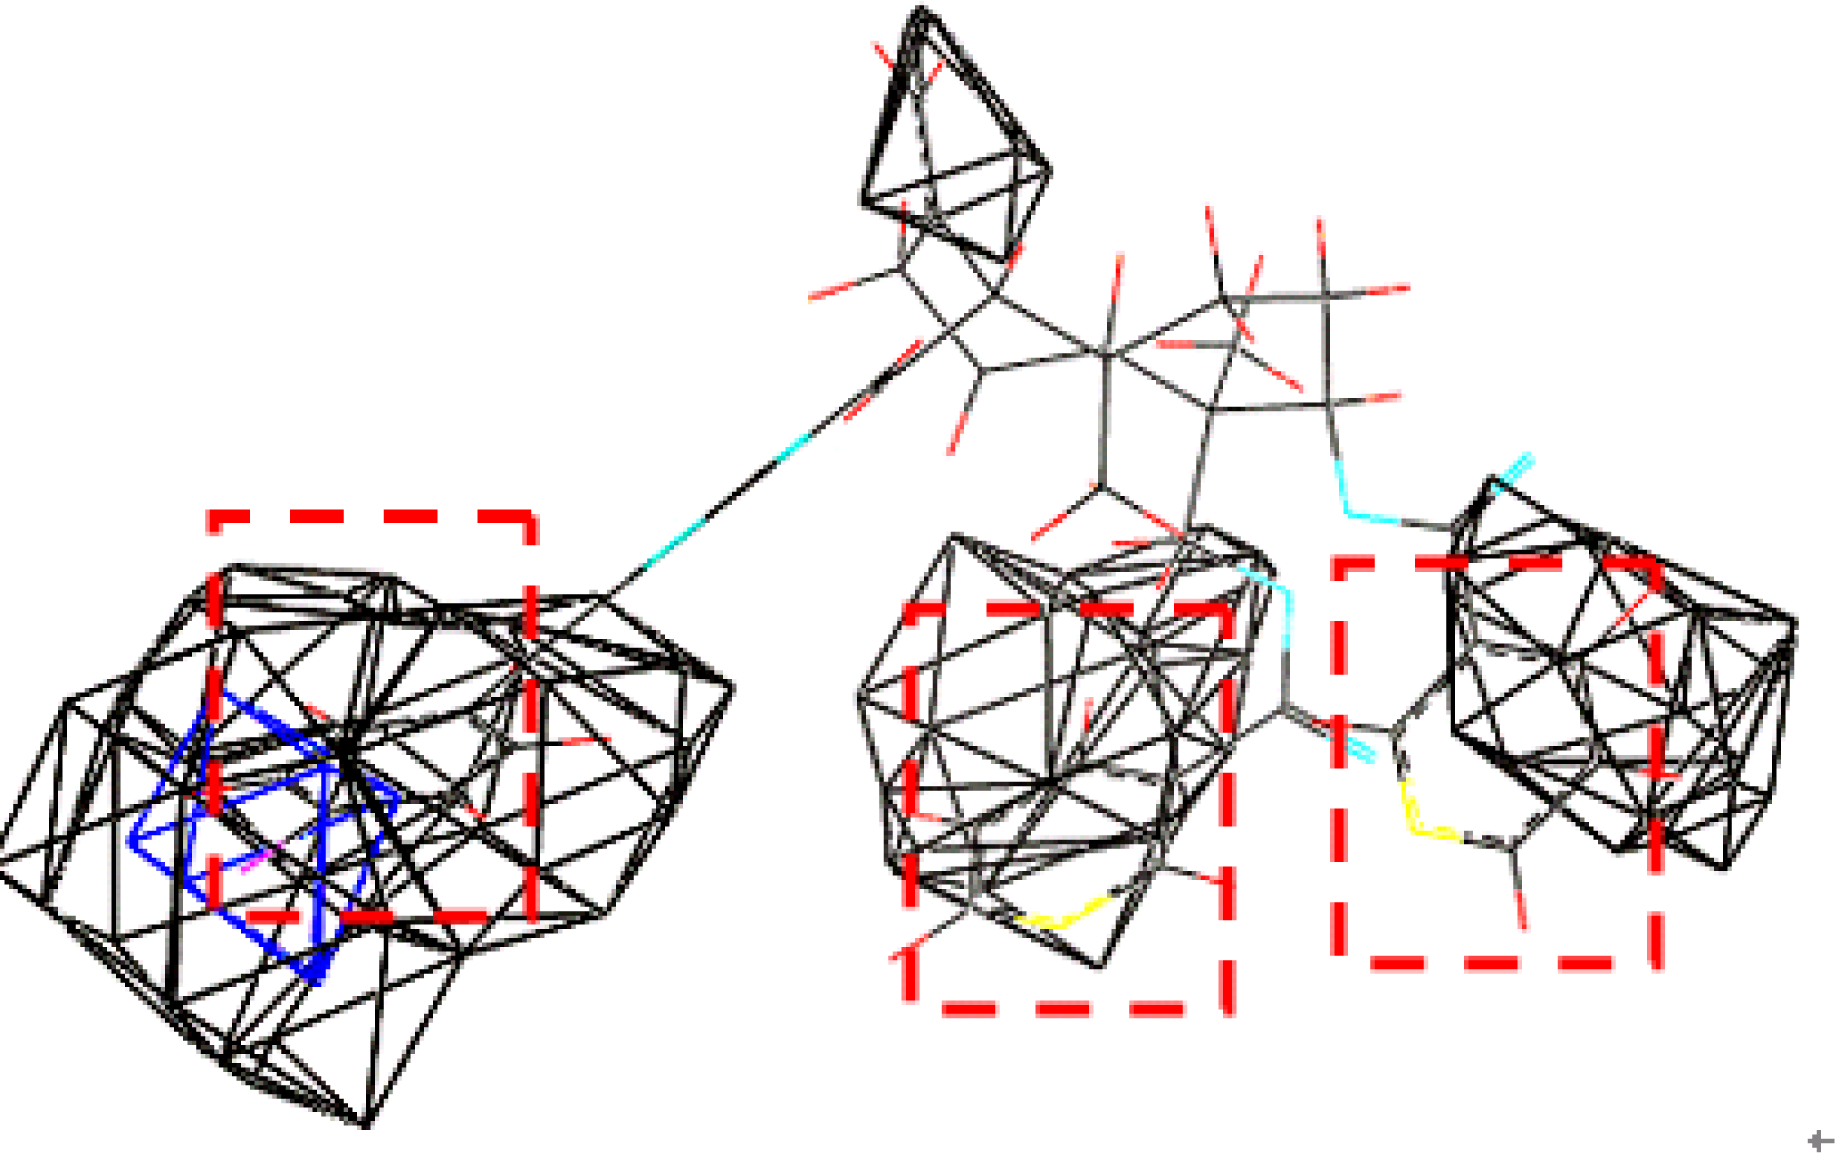
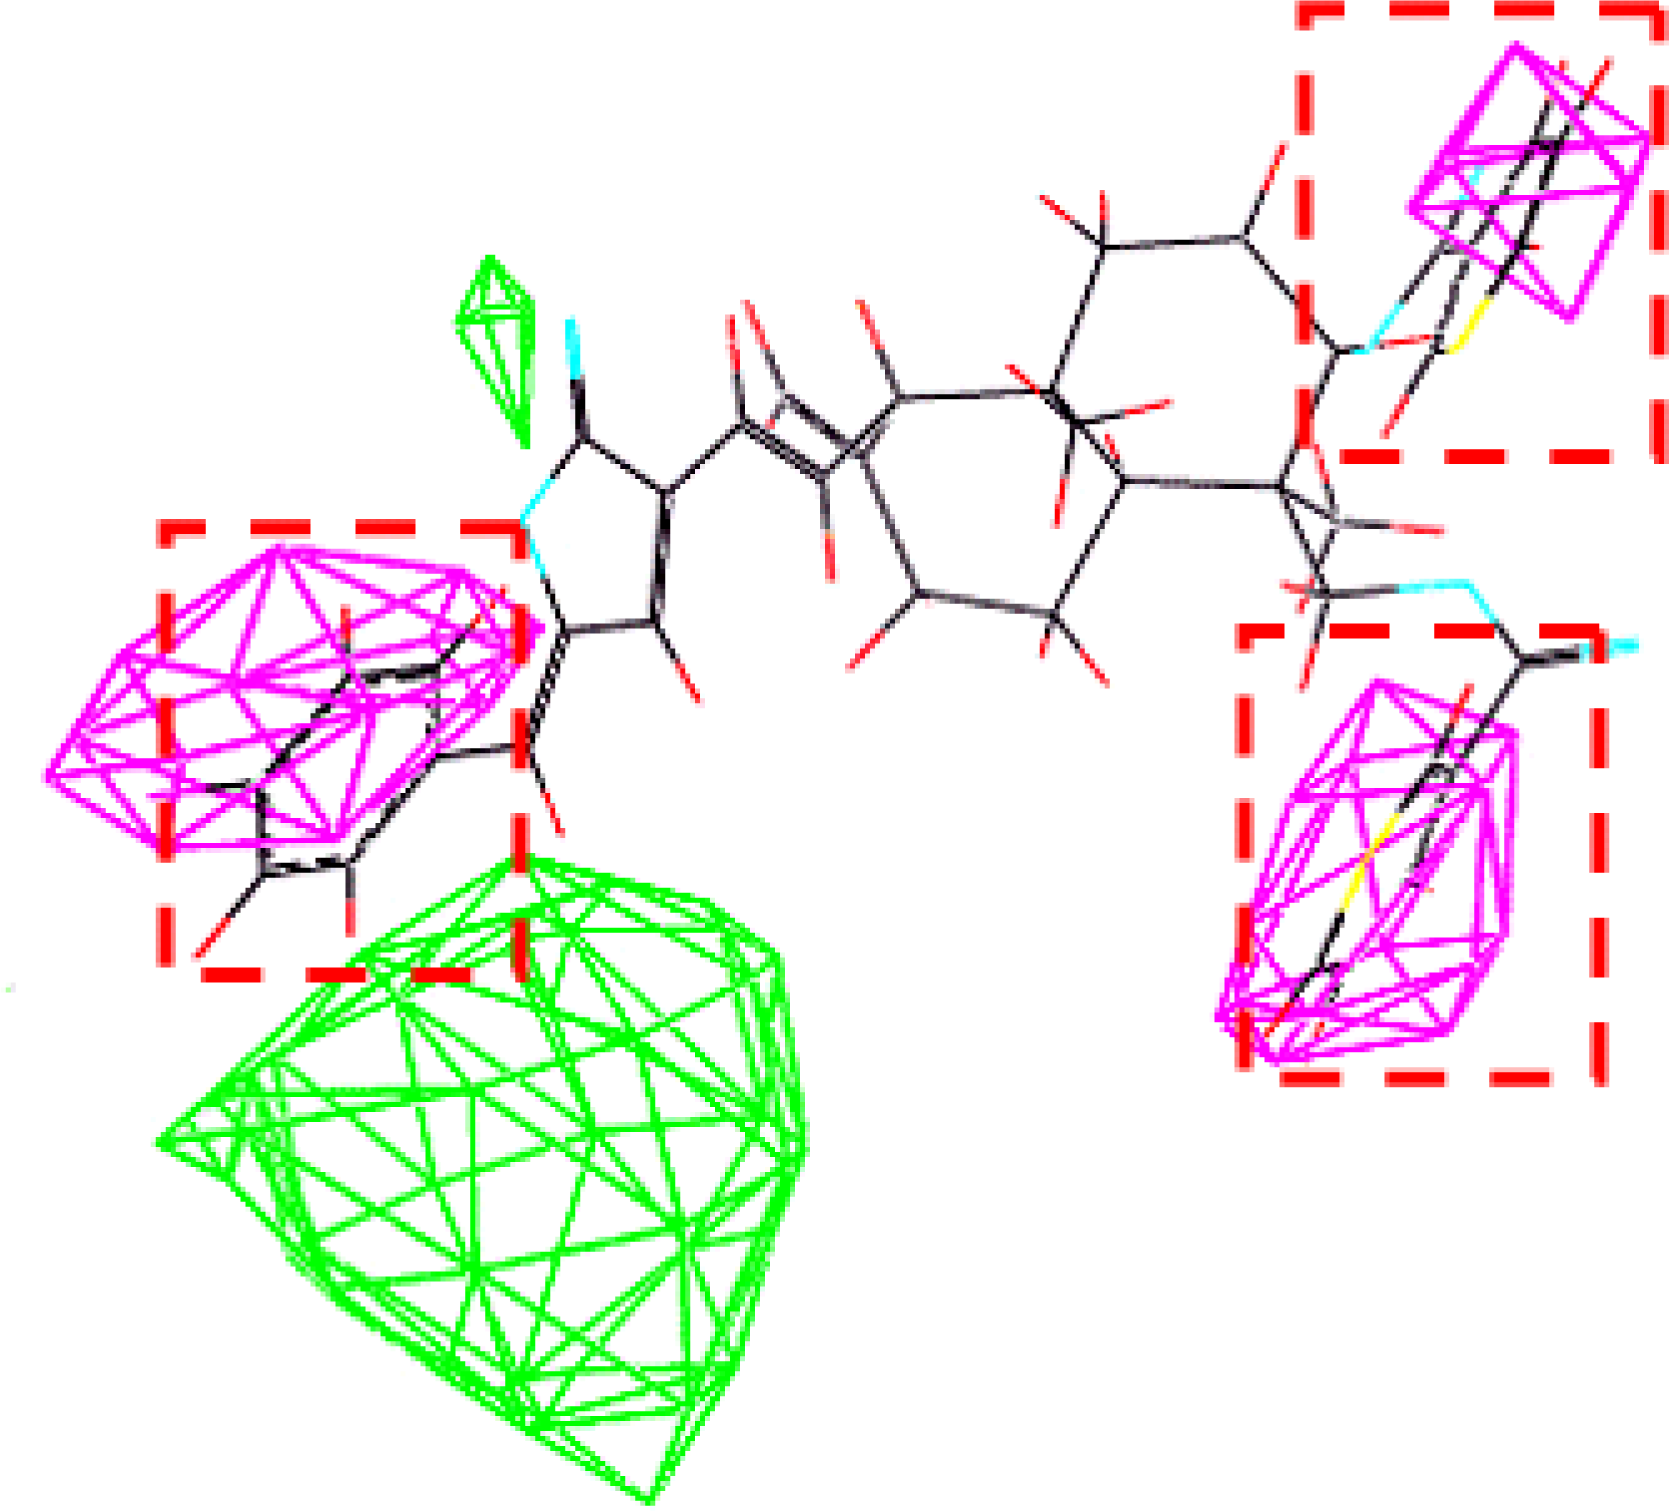
2.4. Generation and Validation of the 3D QSAR Model

The three-D QSAR model applies PLS to explore the relationships between the physicochemical variables and biological activity. Cross-validation is used to estimate the QSAR model’s predictability. In general, a LOO cross-validated coefficient Q2 (higher than 0.5) can be considered as statistically high predictive ability [36]. CoMFA, which is widely utilized in 3D-QSAR research, claims that if a group of similar compounds are ligands of the same receptor, their bioactivities depend on the differences of the molecules’ fields surrounding them [37]. CoMFA can exhibit a contour map in a 3D graph, which makes it easier to distinguish differences between compounds with strong and weak activities. CoMSIA is another 3D-QSAR method that adopts a Gaussian function instead of traditional Coulomb and Lennard-Jones’ function used in CoMFA [38]. Therefore, CoMSIA efficiently avoids the shortcomings of CoMFA in which only the steric and electrostatic fields are used. The leave-one-out (LOO) method is employed to validate the predictability of the models and Y-Randomization test is used to validate the robustness of the models [39].
In this study, CoMFA and CoMSIA were both utilized to generate 3D-QSAR models, and then the relative higher predictive 3D-QSAR models were selected by comparison. Subsequently, the selected models were further optimized by the Focusing method [40]. This method describes the different contributions of different grids in CoMFA and CoMSIA to the bioactivities of the compounds by weighting, which was expected to selectively enhance or impair the contributions of different grids and improve the resolution. Moreover, the biological activities of test set were predicted by the optimized QSAR model. The best QSAR model was determined by comparing the parameters of the model and correlation between the predicted and experimental values of the test sets.

3. Result and Discussion

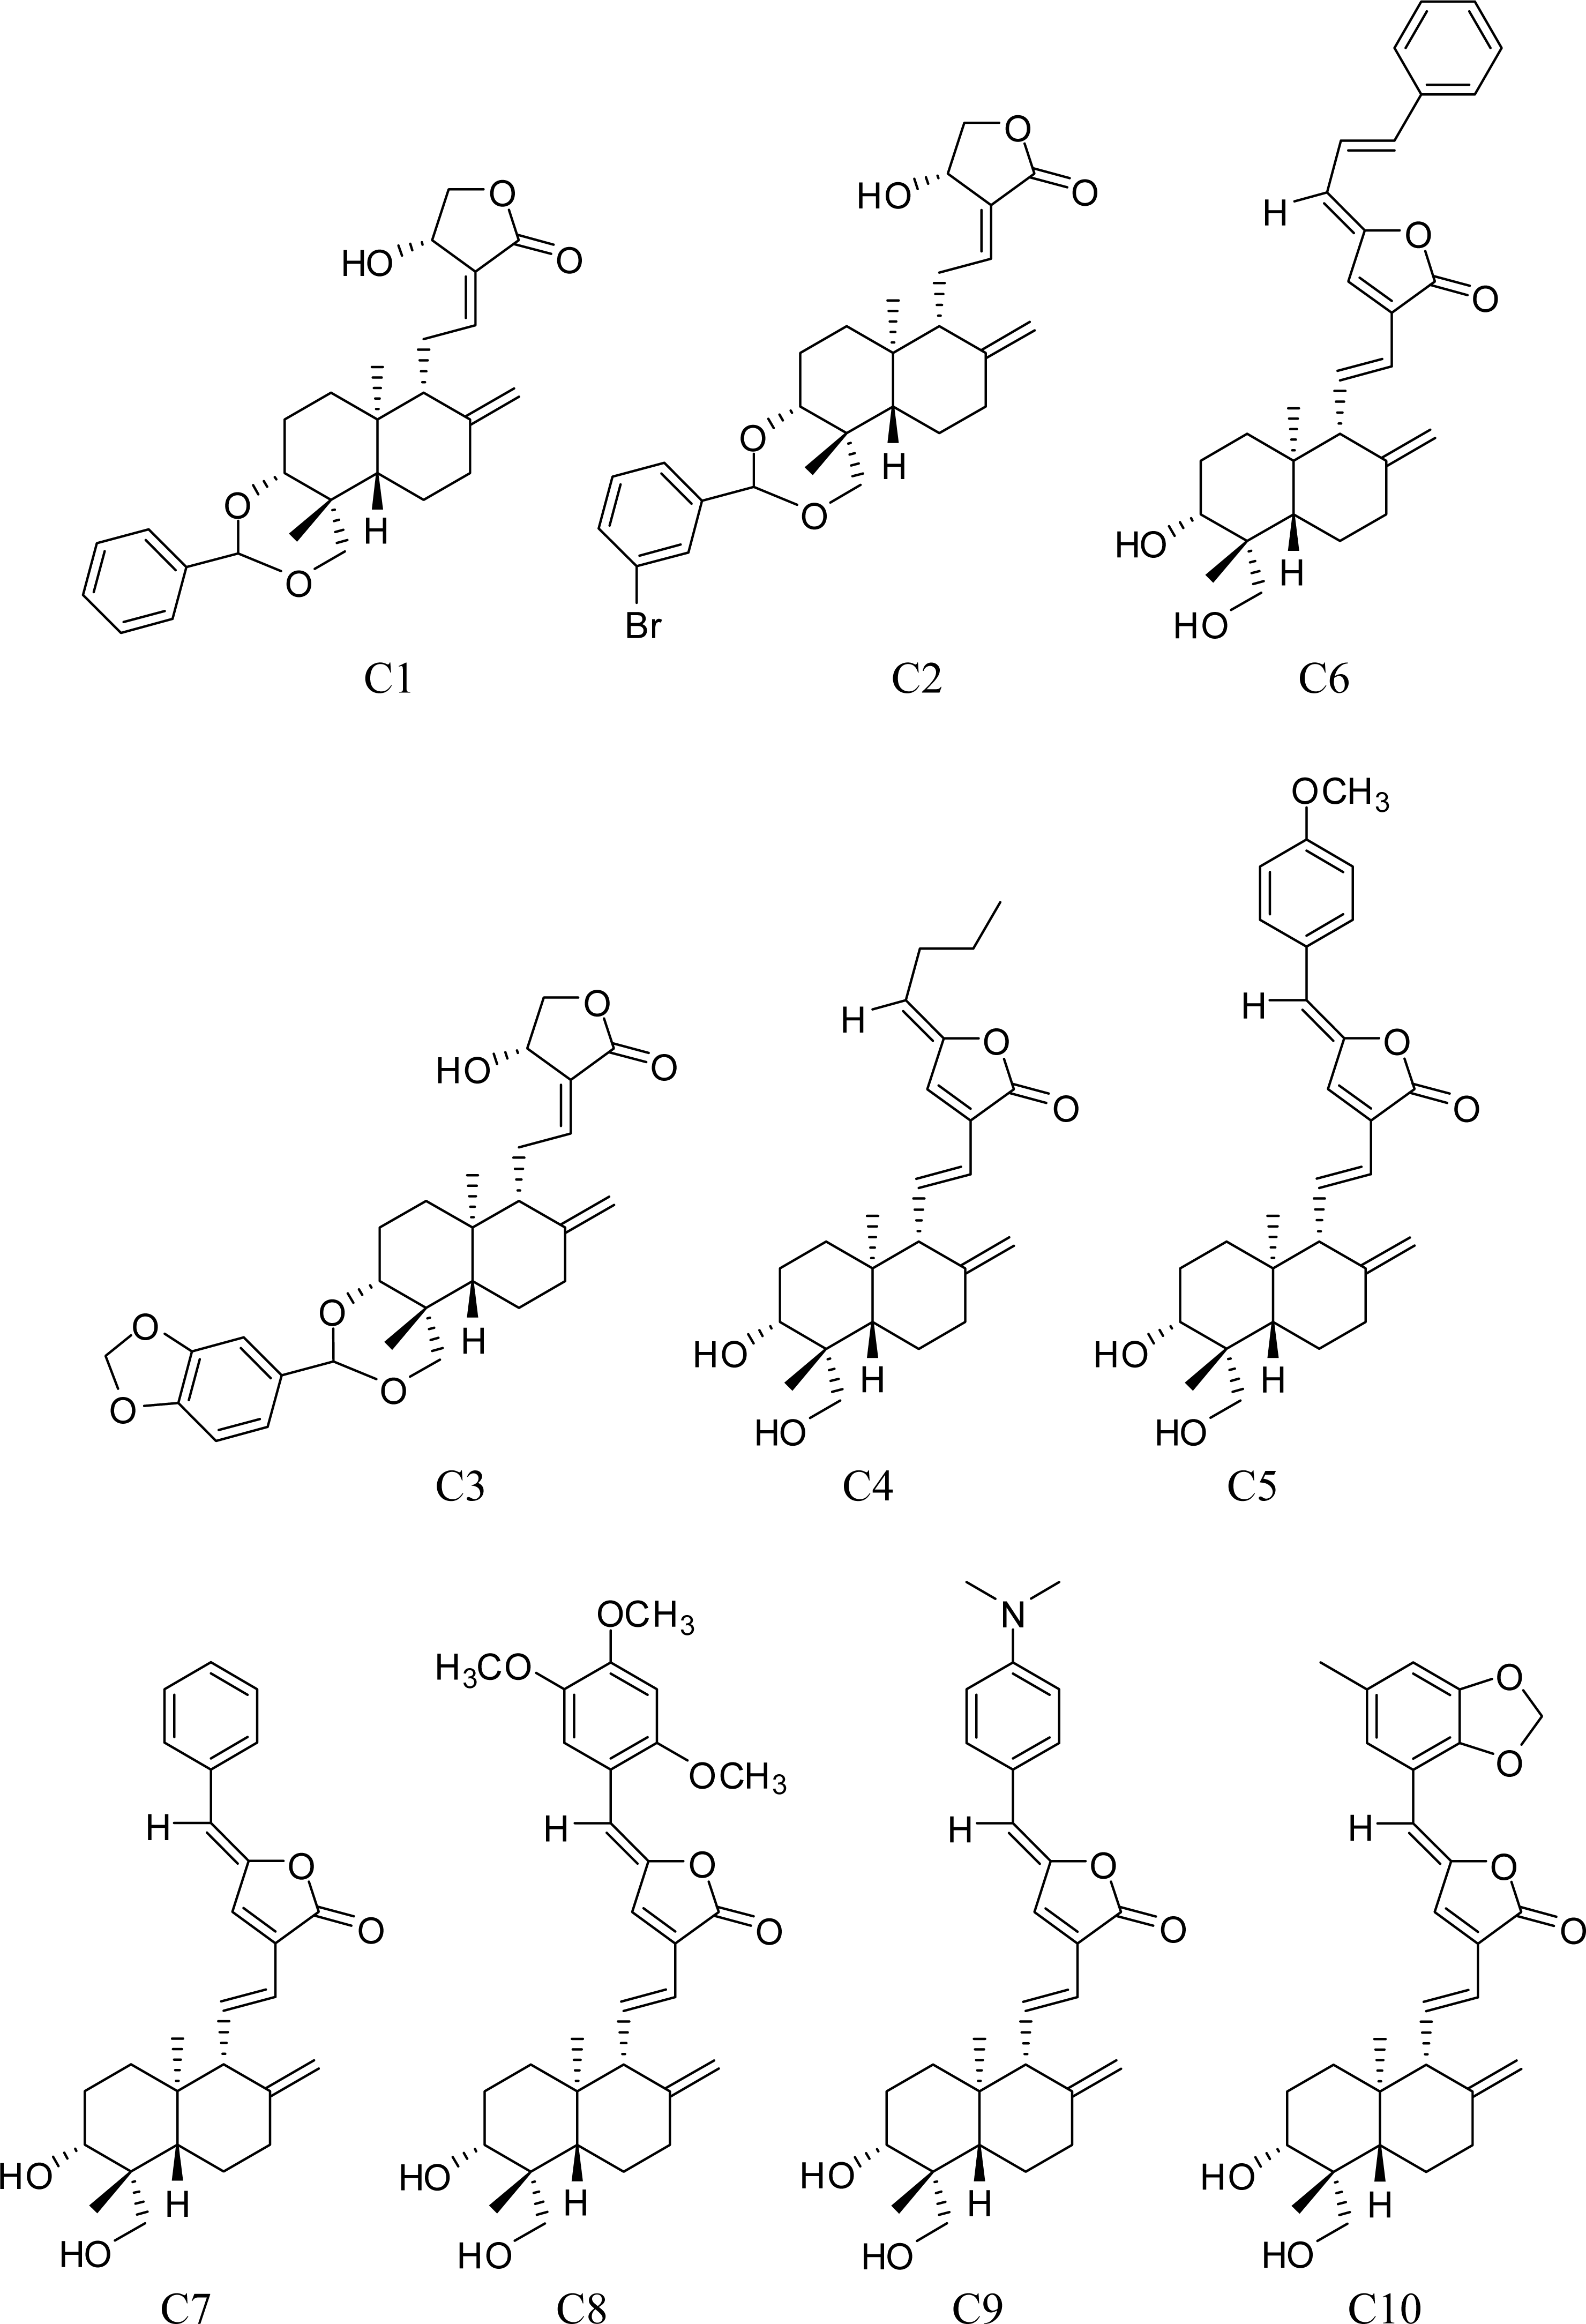
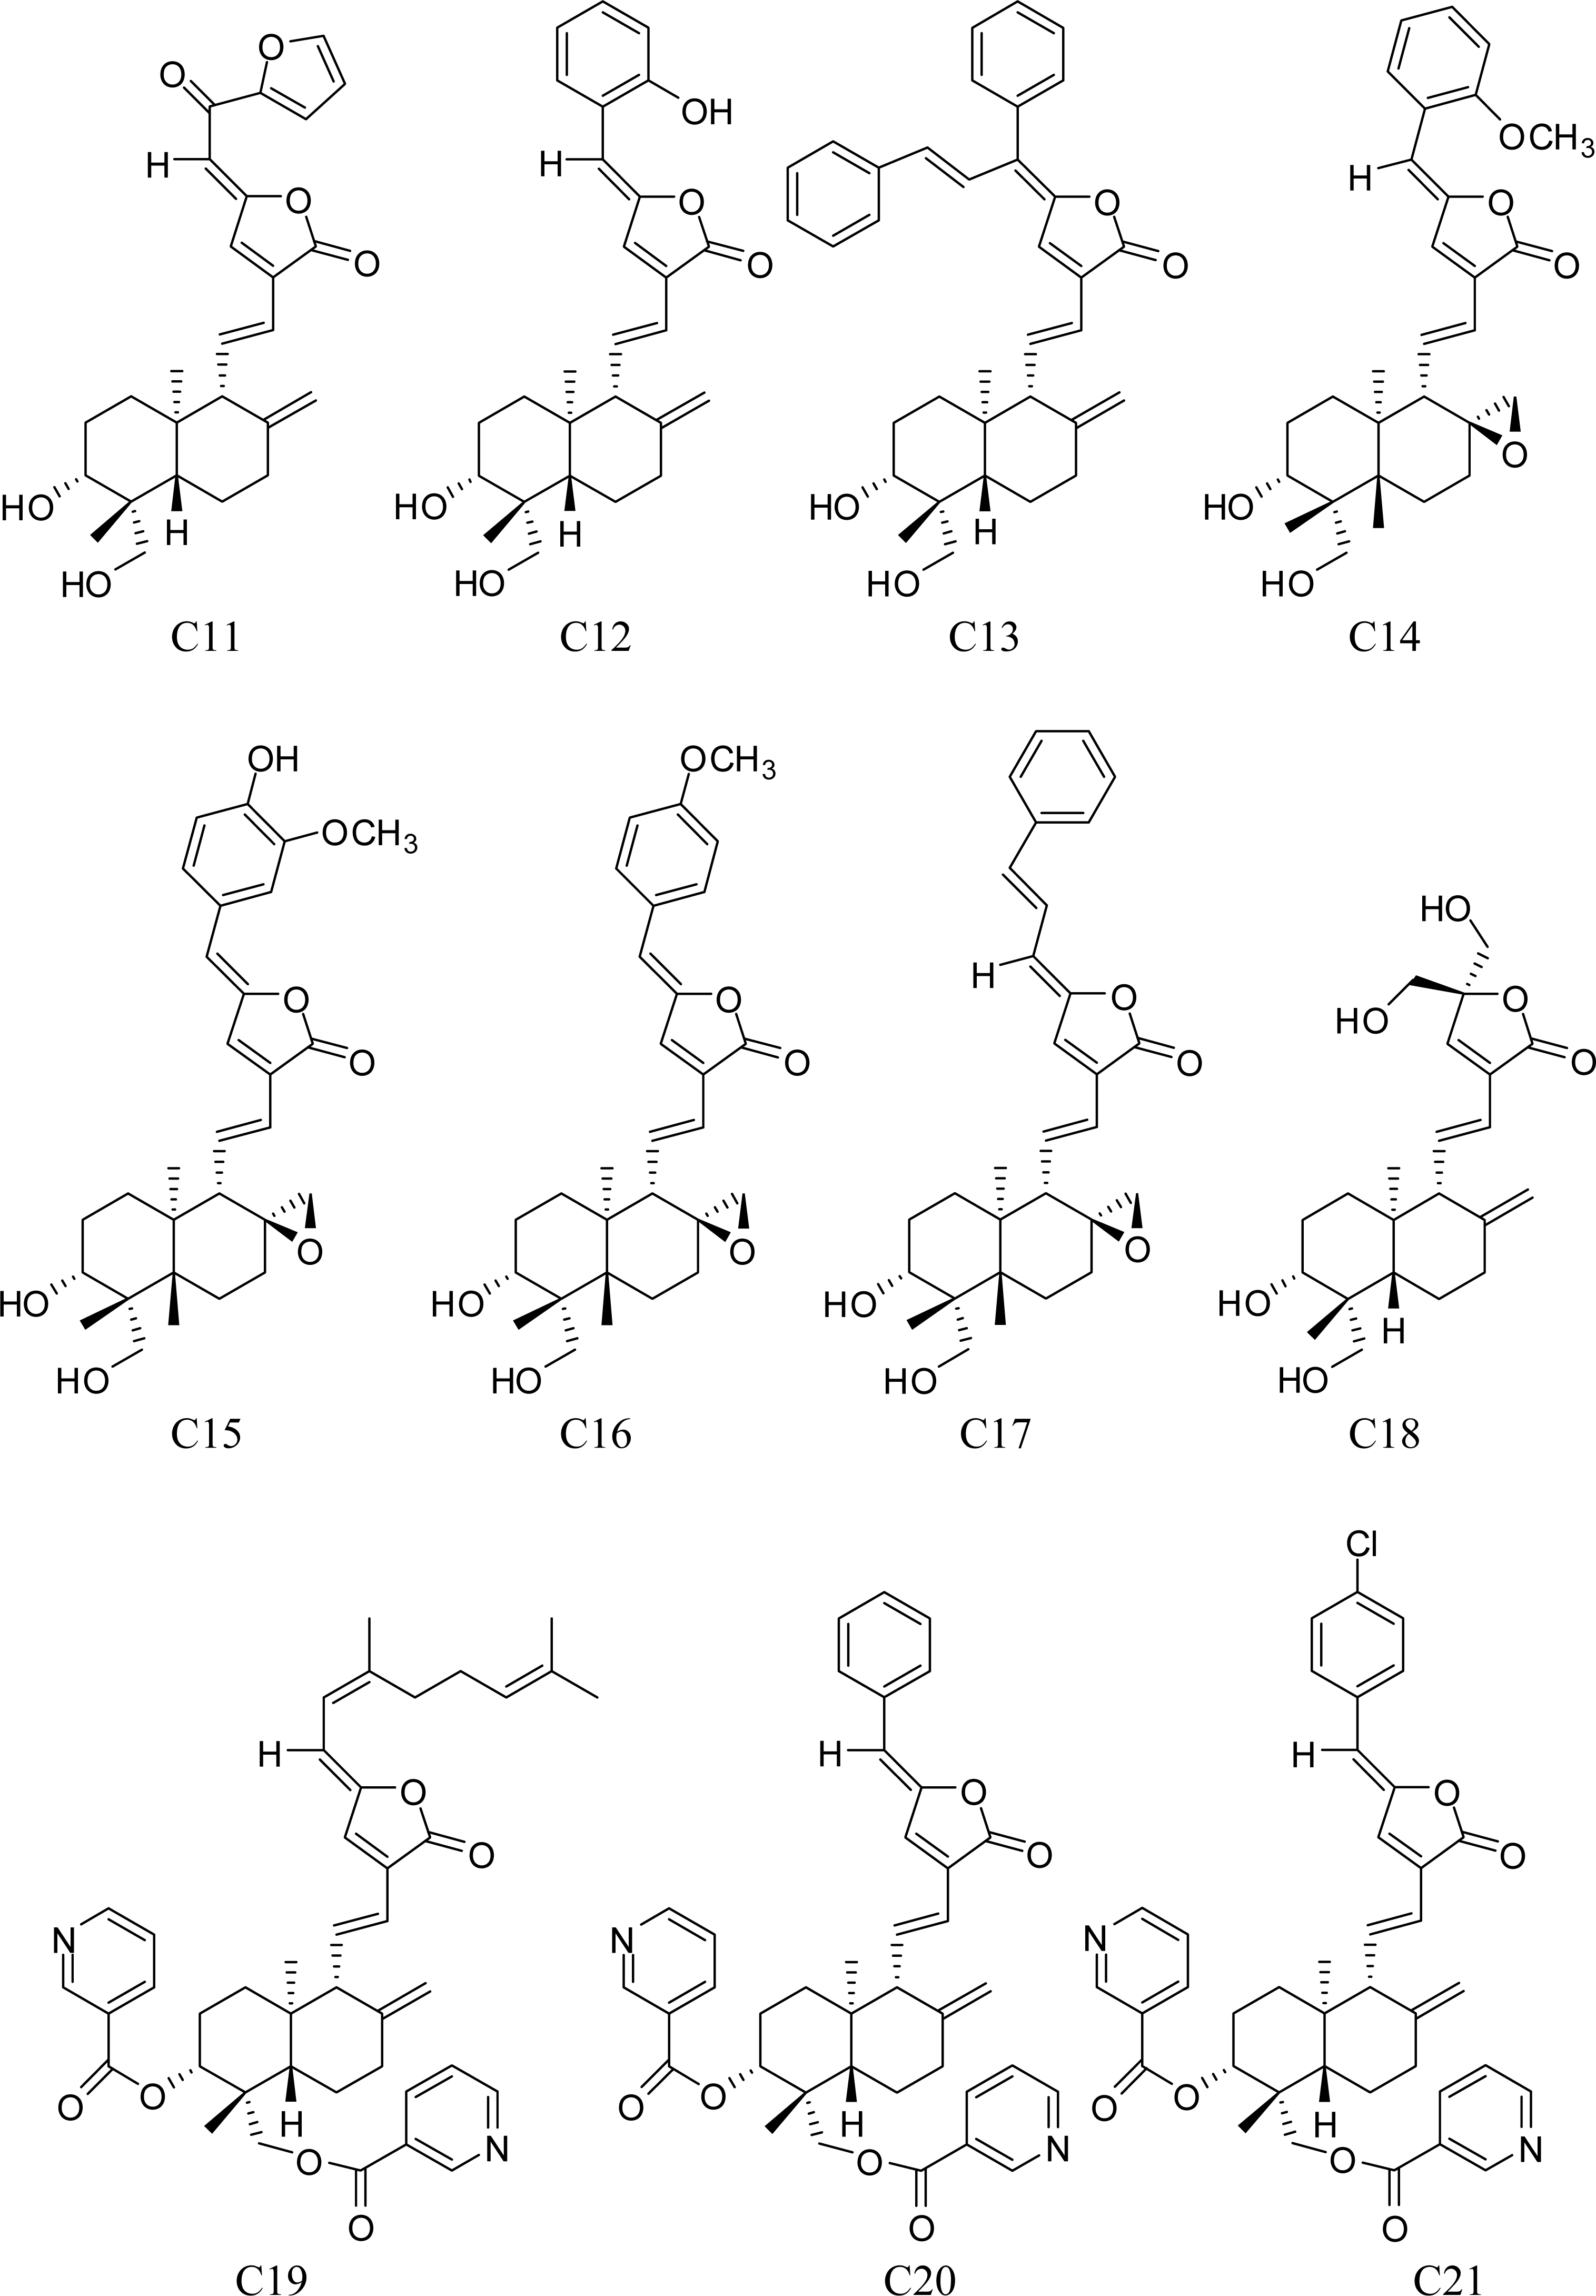
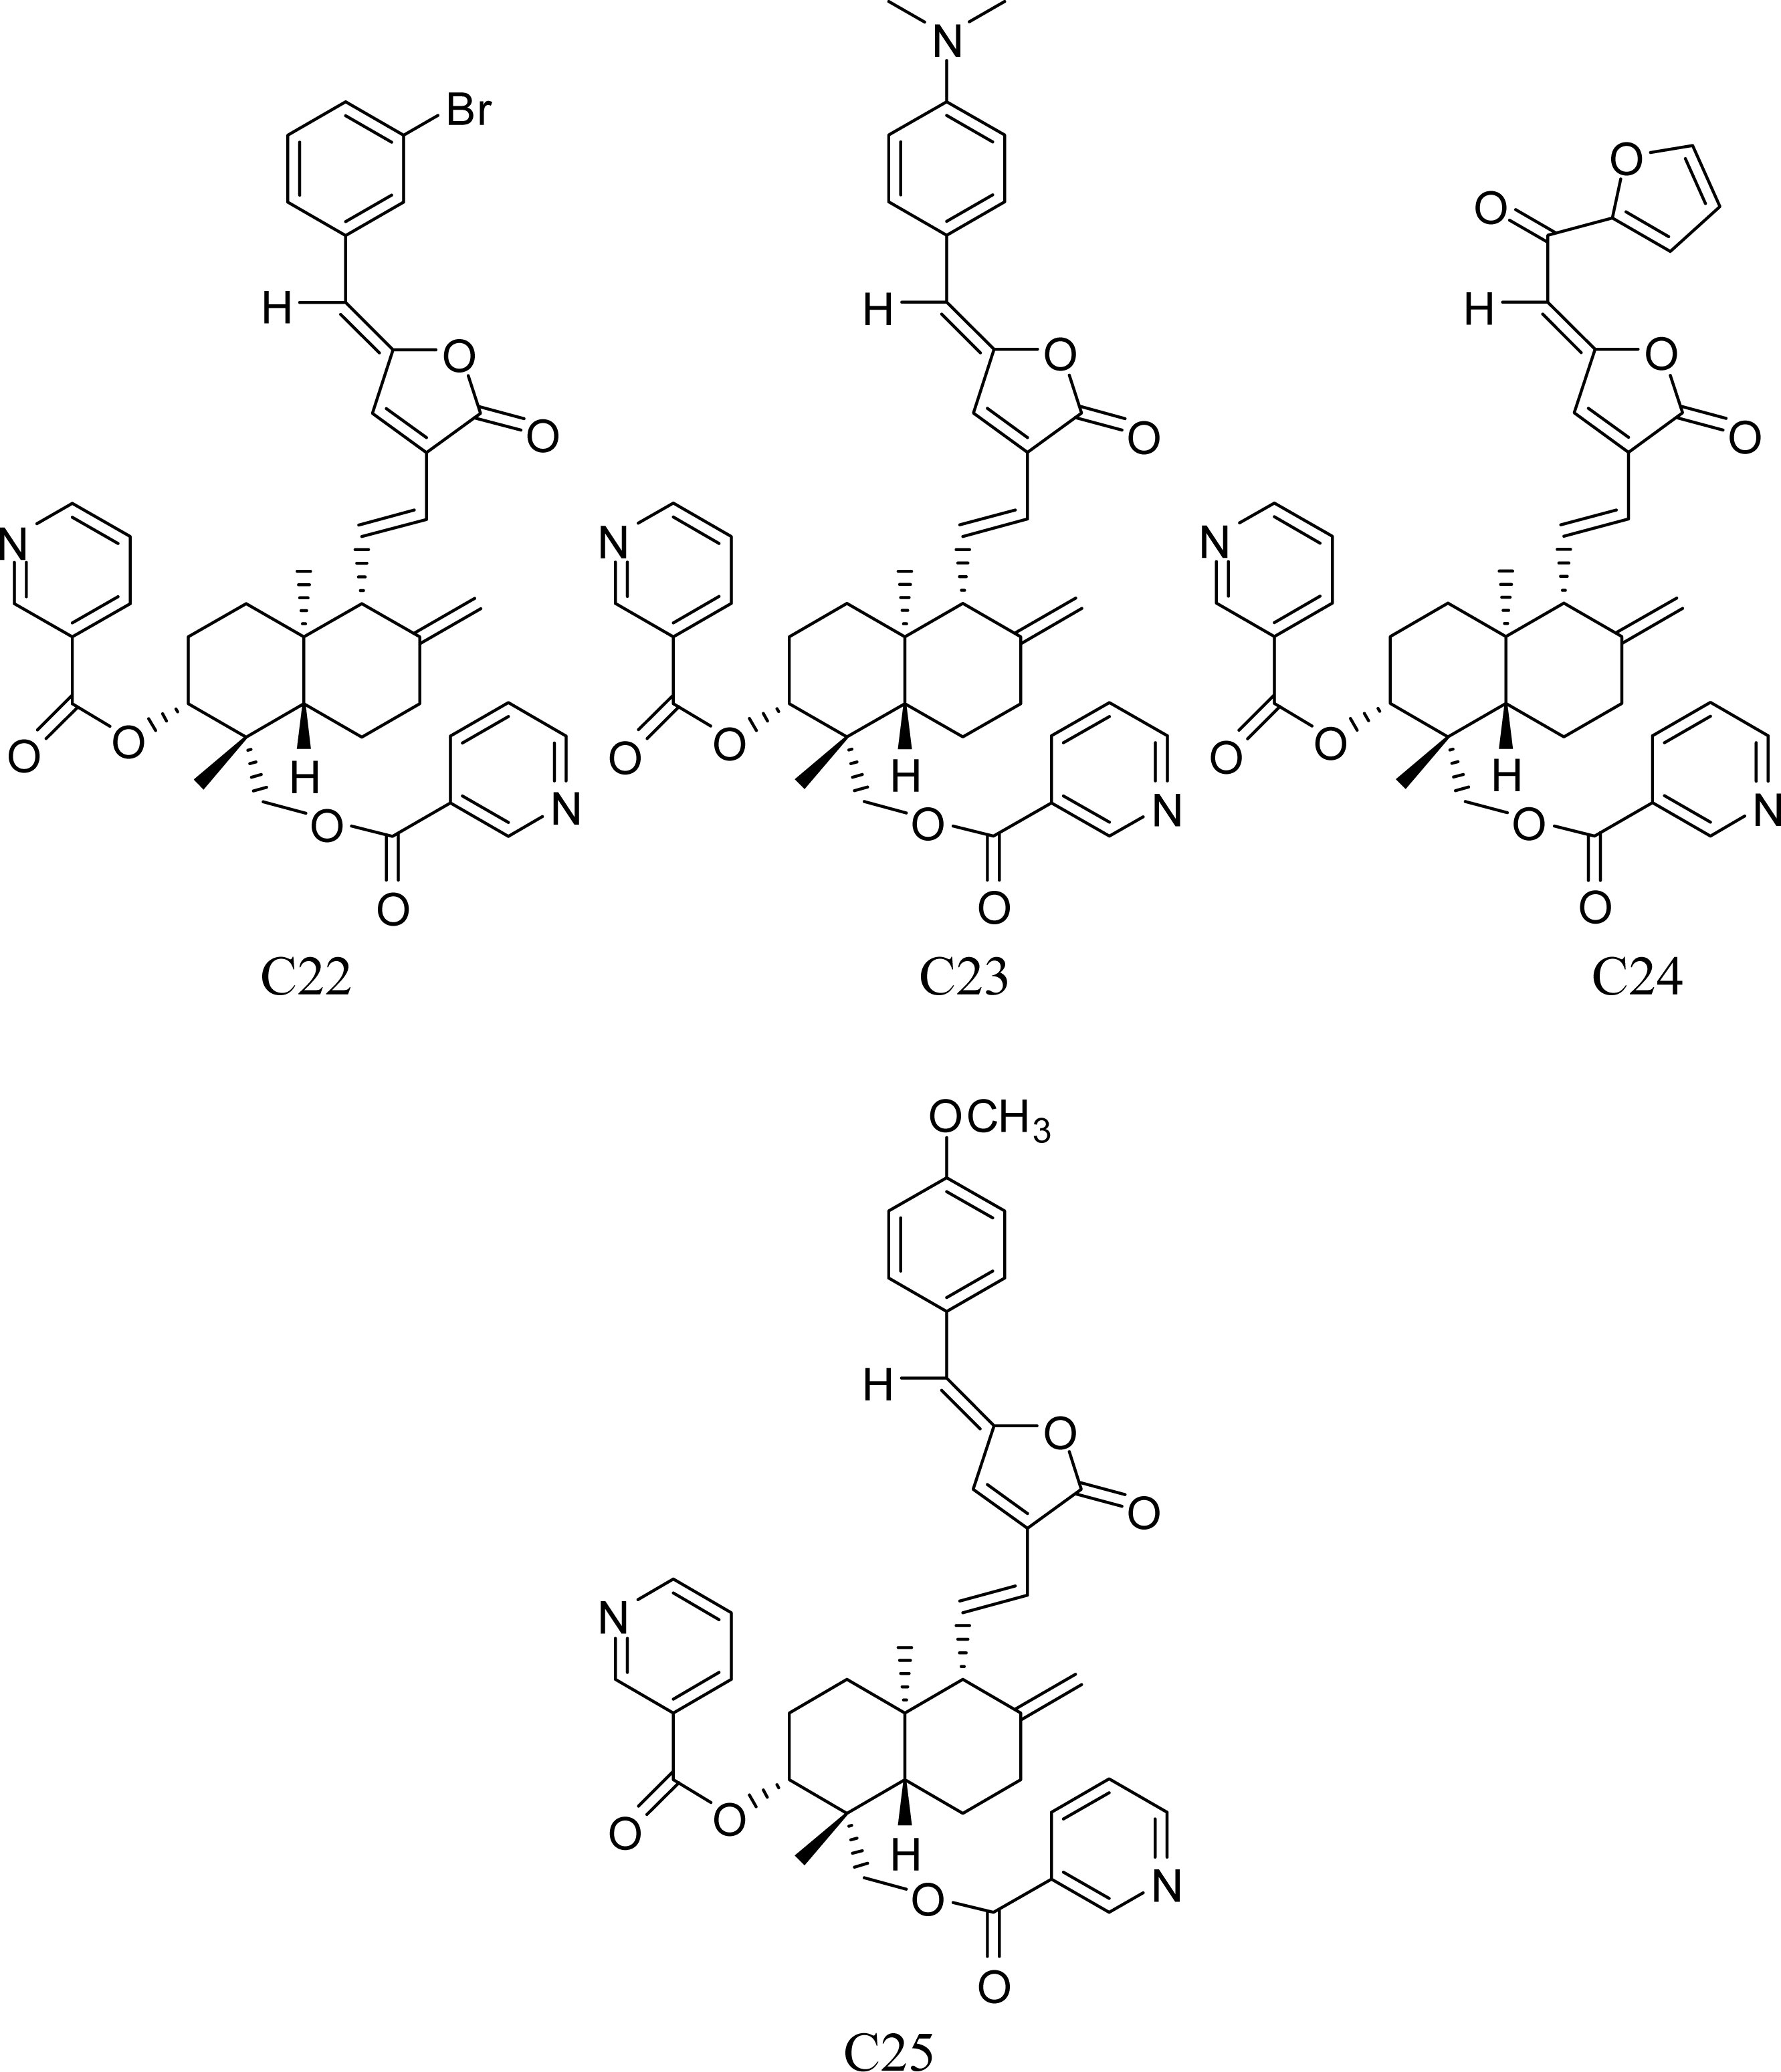
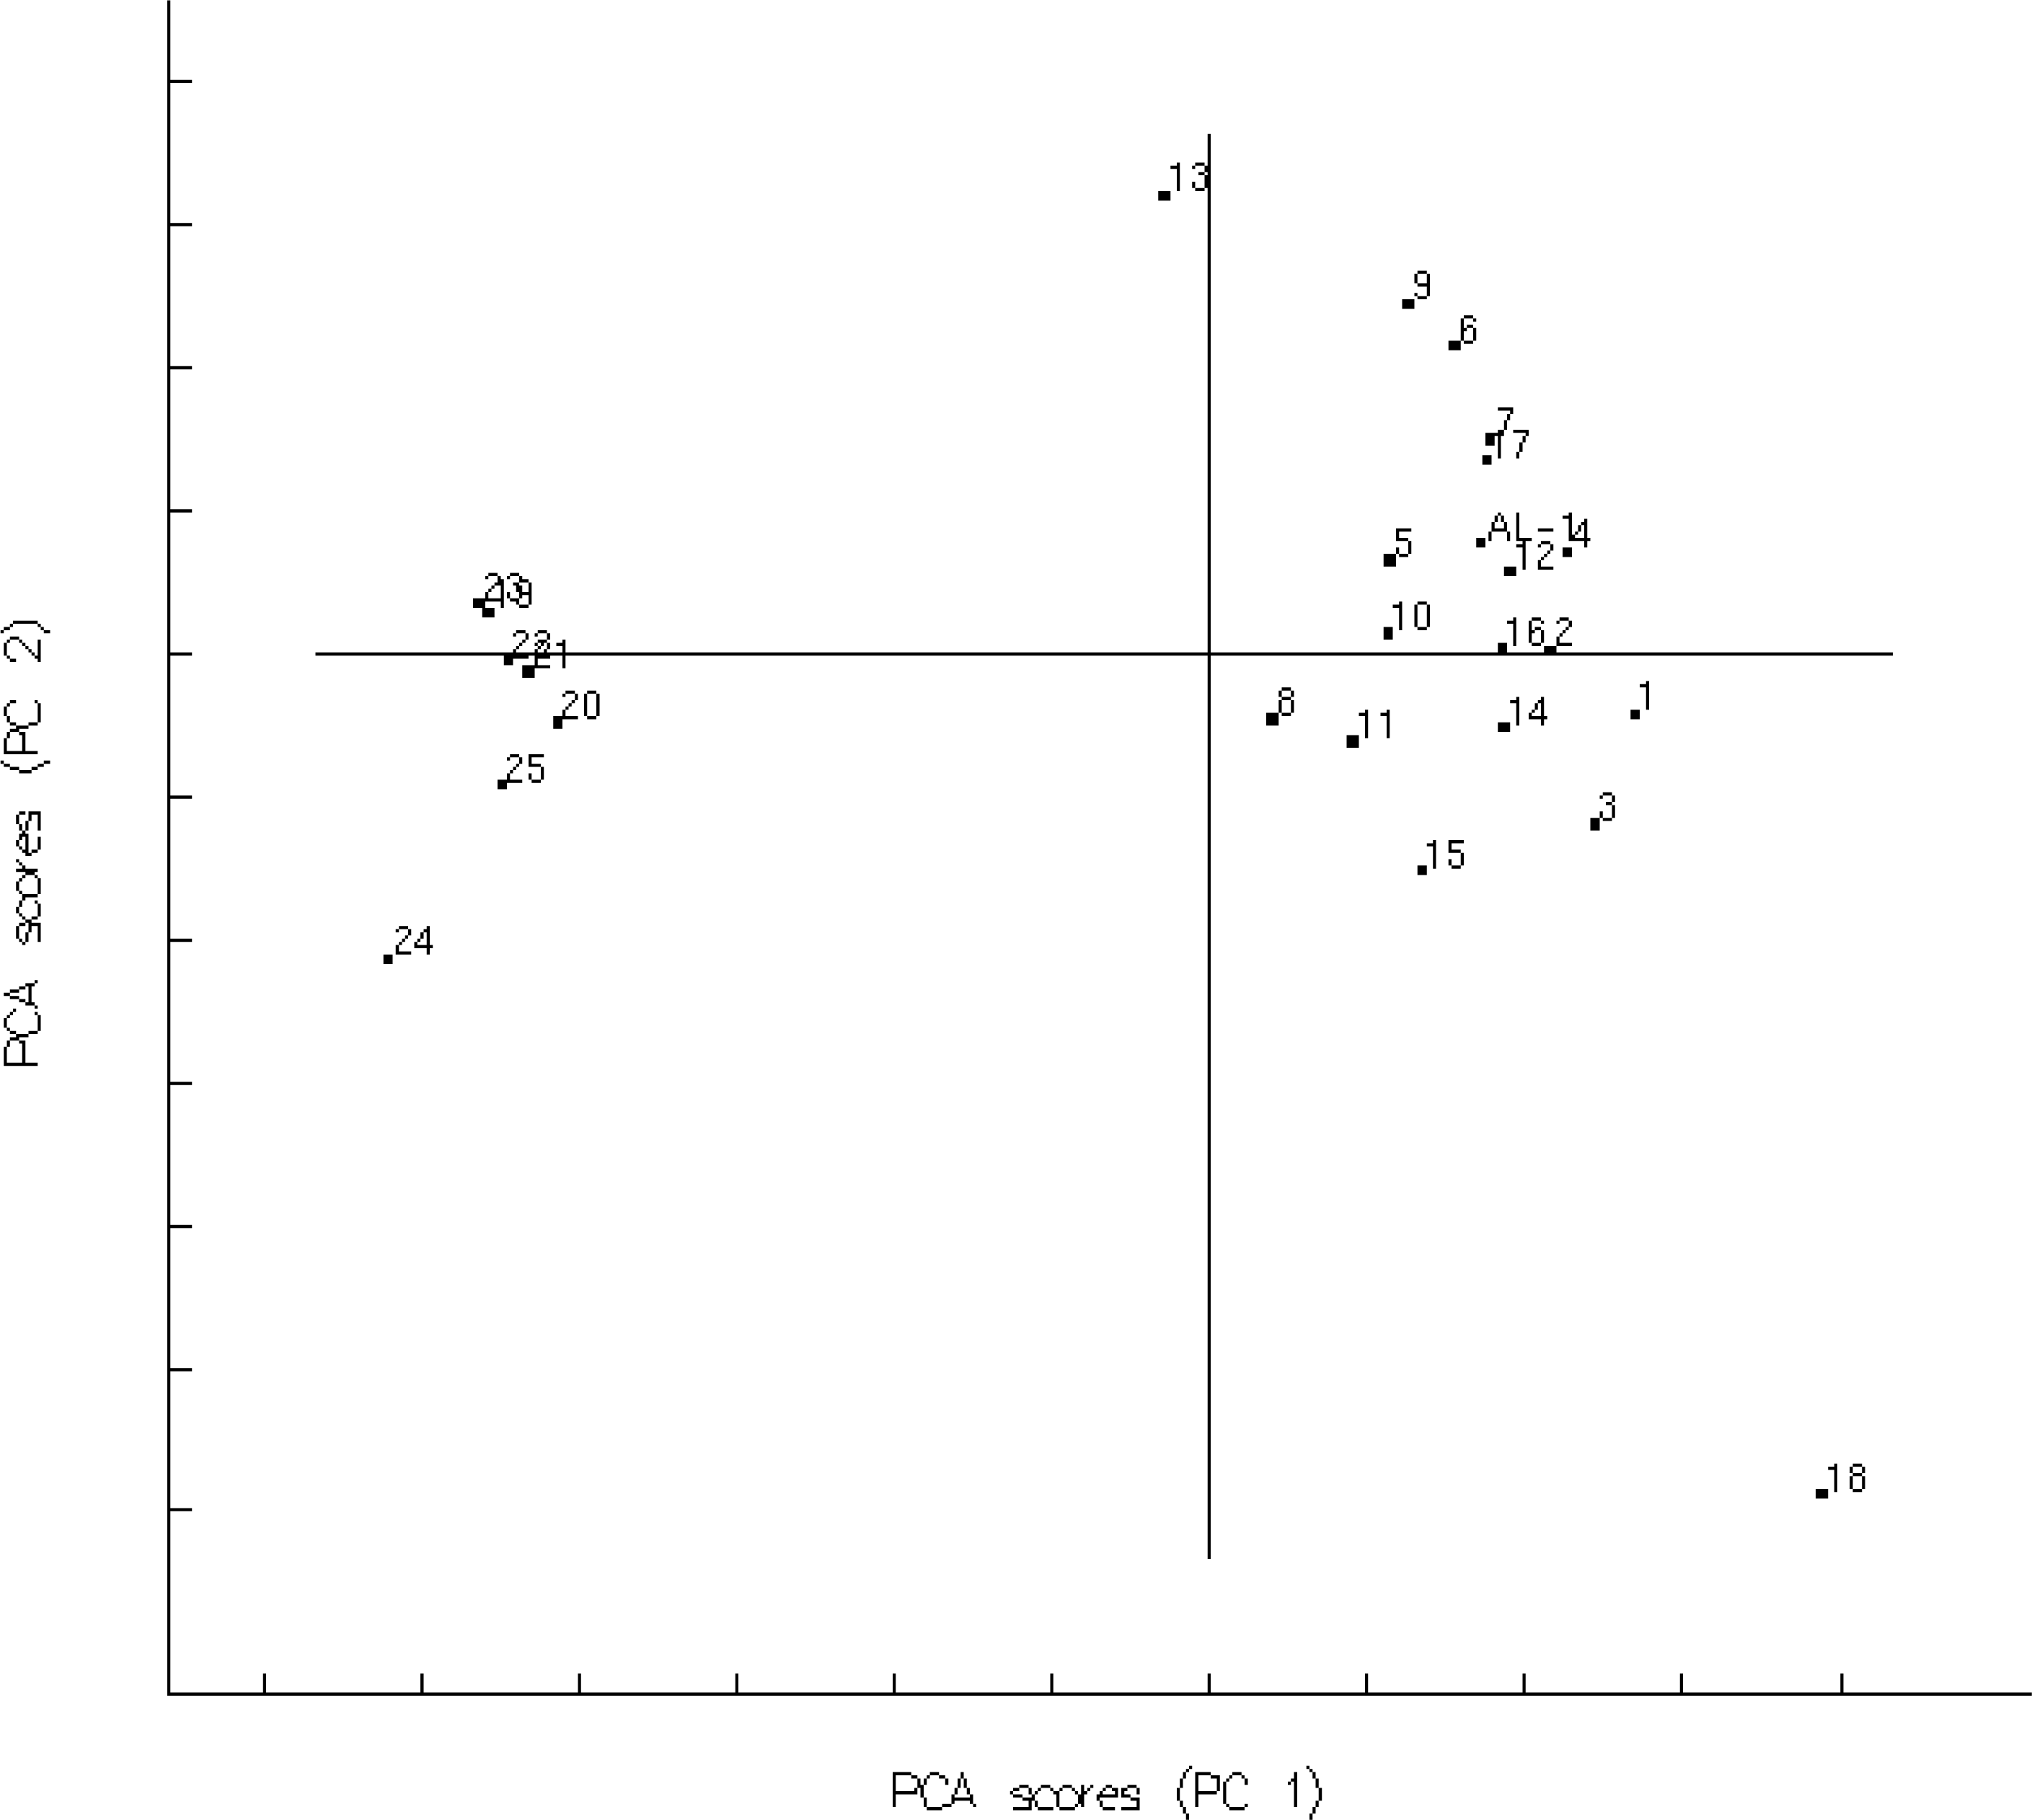
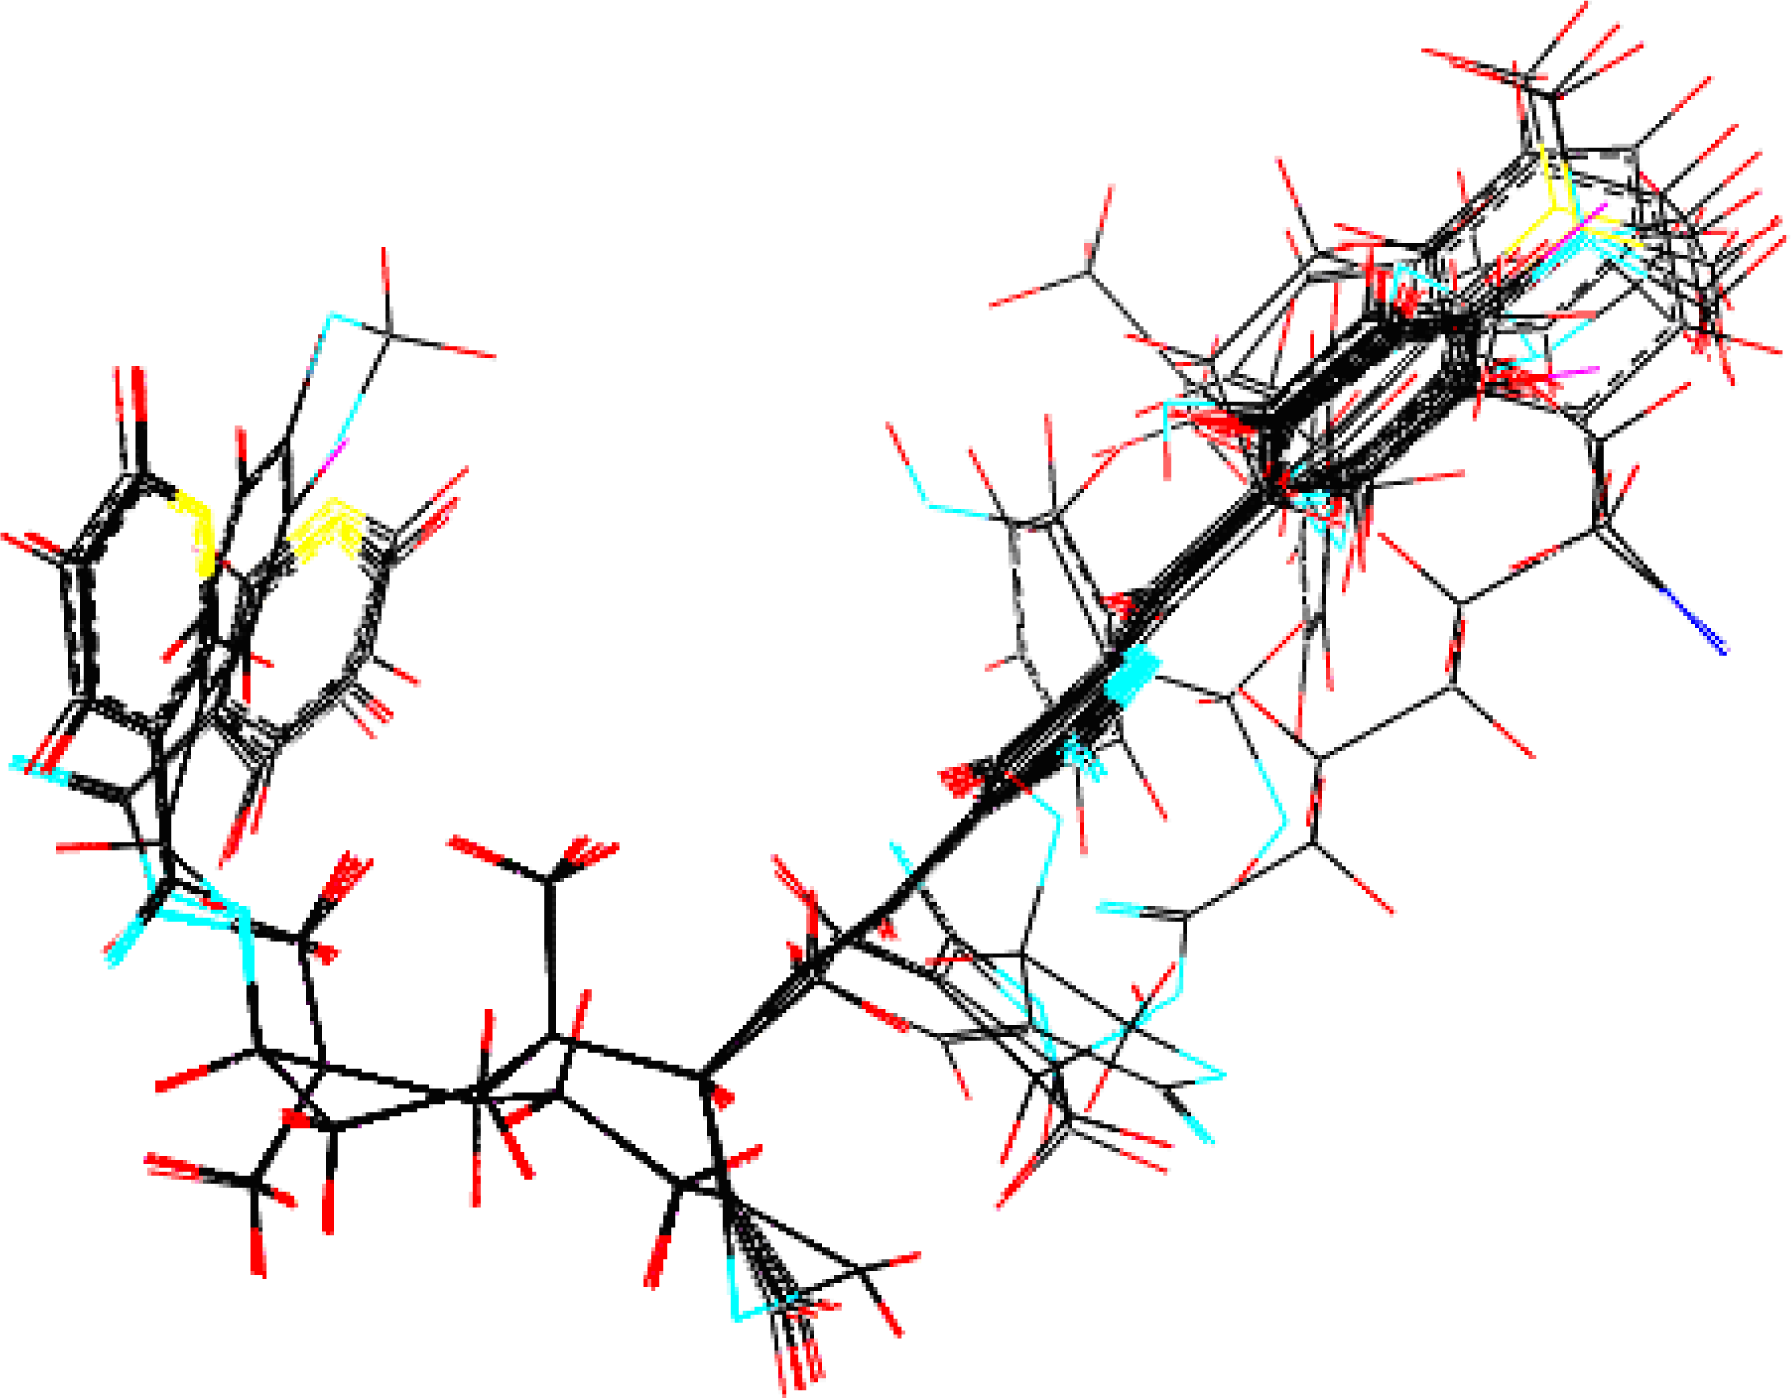
3.1. Training Set Selection

The selection of the training set is one of the most important steps in QSAR modeling, since the establishment and optimization of a QSAR model are based on this training set. Predictability and applicability of a QSAR model also depend on the training set selection [41,42]. Usually, the compounds serving as the training set should have three characteristics: (1) maximum structural diversity; (2) maximum activity diversity; (3) similarity of interactions [43]. Besides, both molecular structures and biological activities of the test set should be covered by the ranges of the training set. In this research, PCA was applied to select a training set from among 25 andrographolide derivatives. PCA is a statistical technique useful for summarizing all the information encoded in the structures of compounds. It is also very helpful for understanding the distribution of the compounds.
The distribution pattern of the 25 andrographolide derivatives is shown in Figure 2. There were different population densities in the Figure. Eighteen compounds (1, 38, 11, 13, 1621 and 2325) were selected as the raining set by the MDC method. The rest of them (compounds 2, 9, 10, 14, 15 and 22) were used as the test set whose biological activities were covered by the training set.

3.2. Establishment and Validation of 2D-QSAR Model

The best cross-validation r2 (0.731) and standard error (0.225) illustrated that the 2D-QSAR model could be applied to predict the biological activity of andrographolide derivatives as α-glucosidase inhibitors. The predicted and experimental biological activities of andrographolide derivatives are shown in Table 1. The results of the correlation coefficient R2, standard error of the training set (0.840, 0.174) and test set (0.949, 0.104) suggested that the 2D-QSAR model could be used to explain the QSAR of andrographolide derivatives as α-glucosidase inhibitors.
Furthermore, three key fragments (Figure 3) were selected according to PLS coefficient. The predicted activity = C 0 + i ( C i × b i ) where C0 = the offset, Ci = the PLS coefficient associated with bin I in the hologram, bi= the number of fragments hashed into bin i.
The PLS coefficient was the standardization for judging which fragment was the key fragment. The larger the PLS coefficient, the more important the fragment was for andrographolide derivatives’ biological activity. According to the criterion, C (=C©C)C=C or C[1]:C:C:C(:C:C:@1)C=C attached to C3 of andrographolide (Figure 4) and C[1]:N:C:C(:C:C:@1)C(=C)O attached to C17 of andrographolide were suggested as the key fragments.

3.3. Establishment and Validation of the 3D-QSAR Model

The 18 compounds were energy minimized, added charges and aligned (Figure 5). CoMFA and CoMSIA were used to develop a number of QSAR models based on the properties of compounds belonging to different fields (steric, electrostatic, hydrophobic, H-donor and acceptor, Table 2). Since the QSAR model was employed to predict unknown compounds’ activity, the model’s predictability was the criterion to judge which QSAR model was the best. Predictability of a QSAR model was not only expressed by cross-validation (q2) but also by validation of the test set. The results illustrated that four models (4, 8, 10 and 11) had the top four predictabilities, so the Focus method was then applied to optimize these models, and further improved predictability for model 4, 10 and 11, but not for model 8. Among these models (model 8, 13, 15 and 16), model 16 exhibited the best predictability as indicated by the highest Q2 value. Predictability of these models (8, 13, 15 and 16) was further evaluated using a test set. Model 16 also provided the best prediction with a correlation coefficient R2 (0.941) (Table 3). Overall, this model represented the best QSAR model (q2 = 0.794, R2cv = 0.915, SEcv = 0.127, R2test set = 0.941, SEtest set = 0.104). Y-Randomization test (q2 = 0.199) suggested that the model also had a good robustness. Table 4 showed Comparison between predicted PLogIC50 of database and experimental values by using Model 16.
Model 16 used steric field, hydrophobic field and H-acceptor field together to describe the relationship between activities and structures of andrographolide derivatives. H-bond receptive atoms and groups in the region marked by blue lines (Figure 6) were favorable for the activities of the compounds, while the atoms and groups in the region marked by yellow lines impaired the activities. Hydrophobic groups were desirable in the region marked with blue lines but not the region marked by dark lines (Figure 7). In addition, the activities of the andrographolide derivatives were enhanced by the presence of steric groups in the region marked by purple lines instead of the region marked by green lines (Figure 8). The compounds with structures fitting well into the 3D contour maps derived from the model 16 usually exhibited potent inhibitory activity (e.g., compounds 20, 21, 22 and 23). In contrast, weak inhibitors such as compounds 3, 4, 13 and 16 did not have a good fit to the 3D contour maps.
Compound 21 (potent α-glucosidase inhibitor PLogIC50 = 5.222) was layed in the 3D contour maps of model 16 to illustrate the key groups (marked by red dashed lines in Figures 5, 6, and 7) correlating with biological activity. C[1]:N:C:C(:C:C:@1)C(=C)O was a key group in all the 3D contour maps (steric, H-accept, hydrophobic) and C[1]:C:C:C(:C:C:@1)C=C was a key group in both steric and hydrophobic 3D contour maps. Both the groups were also calculated as key groups in HQSAR. Combining the results of HQSAR and CoMSIA, the two groups were considered as the key groups associated with biological activity and the result can also be used to screen potent α-glucosidase inhibitors from various databases by virtual screening.

4. Conclusions

In our research, 2D QSAR and 3D QSAR models have been successfully established to quantitatively describe the relationship between structures and activities of andrographolide derivatives as α-glucosidase inhibitors. The 2D QSAR model was based on the atomic connection of molecules and suggested that there might be three key groups associated with biological activity. Furthermore, the 3D QSAR model was based on molecular properties belonging to steric, hydrophobic and H-acceptor fields and indicated that compounds with structures fitting better into the 3D contour maps of model 16 had more potent activities. Combining 2D and 3D QSAR models, the key fragments and their spatial distribution could be efficiently identified. The convinced predictability of the model was demonstrated not only by internal validation but also by external validation using a test set. Overall, these results suggested that the developed QSAR model could be used to predict the inhibitory activities of unknown andrographolide derivatives on α-glucosidase. Application of this model would greatly facilitate the discovery of better α-glucosidase inhibitors.

Acknowledgments

This study was supported in part by grants from the China Natural Science Fund (30772642 and 30973618 to Y. W, and 30572209 and 30973565 to S. C) and the 211 project of Jinan University.

References and Notes

  1. Zhang, CY; Tan, BK. Effects of 14-deoxyandrographolide and 14-deoxy-11,12-didehydroandrographolide on nitric oxide production in cultured human endothelial cells. Phytother. Res 1999, 13, 157–159. [Google Scholar]
  2. Sabu, KK; Padmesh, P; Seeni, SJ. Intraspecific variation in active principle content and isozymes of Andrographis paniculata (kalmegh): A traditional hepatoprotective medicinal herb of India. Med. Aromat. Plant Sci 2001, 23, 637–647. [Google Scholar]
  3. Bernacki, RJ; Niedbala, MJ; Korytnyk, W. Glycosidases in cancer and invasion. Cancer Metastasis Rev 1985, 4, 81–101. [Google Scholar]
  4. Pili, R; Chang, J; Partis, RA; Mueller, RA; Chrest, FJ; Passaniti, A. The alpha-glucosidase I inhibitor castanospermine alters endothelial cell glycosylation, prevents angiogenesis, and inhibits tumor growth. Cancer Res 1995, 55, 2920–2926. [Google Scholar]
  5. Humphries, MJ; Matsumoto, K; White, SL; Olden, K. Inhibition of experimental metastasis by castanospermine in mice: Blockage of two distinct stages of tumor colonization by oligosaccharide processing inhibitors. Cancer Res 1986, 46, 5215–5222. [Google Scholar]
  6. Papandreou, MJ; Barbouche, R; Guieu, R; Kieny, MP; Fenouillet, E. The alpha-glucosidase inhibitor 1-deoxynojirimycin blocks human immunodeficiency virus envelope glycoprotein-mediated membrane fusion at the CXCR4 binding step. Mol. Pharmacol 2002, 61, 186–193. [Google Scholar]
  7. Ouzounov, S; Mehta, A; Dwek, RA; Block, TM; Jordan, R. The combination of interferon alpha-2b and n-butyl deoxynojirimycin has a greater than additive antiviral effect upon production of infectious bovine viral diarrhea virus (BVDV) in vitro: Implications for hepatitis C virus (HCV) therapy. Antiviral Res 2002, 55, 425–435. [Google Scholar]
  8. Schmidt, DD; Frommer, W; Junge, B; Muller, L; Wingender, W; Truschei, E; Schafer, D. Alpha-Glucosidase inhibitors. New complex oligosaccharides of microbial origin. Naturwissenschaften 1977, 64, 535–536. [Google Scholar]
  9. Kameda, Y; Asano, N; Yoshikawa, M; Takeucki, M; Yamaguchi, T; Matsui, K; Horii, S; Fukase, HJ. Valiolamine, a new alpha-glucosidase inhibiting aminocyclitol produced by Streptomyces hygroscopicus. J.Antibiot 1984, 37, 1301–1307. [Google Scholar]
  10. Robinson, KM; Begovic, ME; Rhinehart, BL; Heineke, EW; Ducep, JB; Kastner, PR; Marshall, FN; Danzin, C. New potent alpha-glucohydrolase inhibitor MDL 73945 with long duration of action in rats. Diabetes 1991, 40, 825–830. [Google Scholar]
  11. Fujisawa, T; Ikegami, H; Inoue, K; Kawabata, Y; Ogihara, T. Effect of two alpha-glucosidase inhibitors, voglibose and acarbose, on postprandial hyperglycemia correlates with subjective abdominal symptoms. Metabolism 2005, 54, 387–390. [Google Scholar]
  12. van den Broek, LAGM; Kat-van den Nieuwenhof, MW; Butters, TD; van Boeckel, CA. Synthesis of alpha-glucosidase I inhibitors showing antiviral (HIV-1) and immunosuppressive activity. J. Pharm. Pharmacol 1996, 48, 172–178. [Google Scholar]
  13. Dai, GF; Xu, HW; Wang, JF; Liu, FW; Liu, HM. Studies on the novel alpha-glucosidase inhibitory activity and structure-activity relationships for andrographolide analogues. Bioorgan. Med. Chem 2006, 16, 2710–2713. [Google Scholar]
  14. Xu, HW; Dai, GF; Liu, GZ; Wang, JF; Liu, HM. Synthesis of andrographolide derivatives: A new family of alpha-glucosidase inhibitors. Bioorgan. Med. Chem 2007, 15, 4247–4255. [Google Scholar]
  15. Truscheit, E; Frommer, W; Junge, B; Muller, L; Schmidt, DD; Wingender, W. Chemistry and biochemistry of microbial alpha-glucosidase inhibitors. Angew. Chem 1981, 93, 738–755. [Google Scholar]
  16. Madariaga, H; Lee, PC; Heitlinger, LA; Lenenthal, M. Effects of graded alpha-glucosidase inhibition on sugar absorption in vivo. Dig. Dis. Sci 1988, 33, 1020–1024. [Google Scholar]
  17. Lee, D-S; Lee, S-H. Genistein, a soy isoflavone, is a potent alpha-glucosidase inhibitor. FEBS Lett 2001, 501, 84–86. [Google Scholar]
  18. McCulloch, DK; Kurtz, AB; Tattersall, RB. A new approach to the treatment of nocturnal hypoglycemia using alpha-glucosidase inhibition. Diabetes Care 1983, 6, 483–487. [Google Scholar]
  19. Sou, S; Takahashi, H; Yamasaki, R; Kagechika, H; Endo, Y; Hashimoto, Y. Alpha-glucosidase inhibitors with a 4,5,6,7-tetrachlorophthalimide skeleton pendanted with a cycloalkyl or dicarba-closo-dodecaborane group. Chem. Pharm. Bull 2001, 49, 791–793. [Google Scholar]
  20. Node, K. Alpha-glucosidase inhibitors: New therapeutic agents for chronic heart failure. Hypertens. Res 2006, 29, 741–42. [Google Scholar]
  21. Hansch, C; Mahoney, PP; Fujita, T; Muir, RM. Correlation of biological activity of phenoxyacetic acids with Hammett substituent constants and partition coefficients. Nature 1962, 194, 178–180. [Google Scholar]
  22. Itzstein, VM; Wu, WY; Kok, GB. Rational design of potent sialidase-based inhibitors of influenza virus replication. Nature 1993, 363, 418–423. [Google Scholar]
  23. Melnick, M; Reich, SH; Lewis, KK. Bis tertiary amide inhibitors of the HIV-1 protease generated via protein structure-based iterative design. J. Med. Chem 1996, 39, 2795–2811. [Google Scholar]
  24. Ring, CS; Sun, E; McKerrow, JH. Structure-based inhibitor design by using protein models for the development of antiparasitic agents. Proc.Natl. Acad. Sci. USA 1993, 90, 3583–3587. [Google Scholar]
  25. Hibert, MF; Hoffmann, R; Miller, RC. Conformation-activity relationship study of 5-HT3 receptor antagonists and a definition of a model for this receptor site. J. Med. Chem 1990, 33, 1594–1600. [Google Scholar]
  26. Motoc, I; Sit, SY; Harte, WE. 3-Hydroxy-3-methylglutaryl-coenzyme. A reductase: Molecular modeling, three-dimensional structure-activity relationships, inhibitor design. Quant. Struct-Act. Relat 1991, 10, 30–35. [Google Scholar]
  27. Xiong, B; Gui, CS; Xu, XY. Acta. A 3D model of SARS_CoV 3CL proteinase and its inhibitors design by virtual screening. Pharmacol. Sin 2003, 24, 497–504. [Google Scholar]
  28. Pastor, M; Cruciani, G. A novel strategy for improving ligand selectivity in receptor-based drug design. J. Med. Chem 1995, 38, 4637–4647. [Google Scholar]
  29. Anand, K; Ziebuhr, J; Wadhwani, P; Mesters, JR; Hilgenfeld, R. Coronavirus main proteinase (3CLpro) Structure: Basis for design of anti-SARS drugs. Science (Sciencexpress) 2003, 300, 1763–1767. [Google Scholar]
  30. Carlton, AT; Vinicius, BDS; Carlos, HTD. Current topics in computer-aided drug design. J. Pharm. Sci 2008, 97, 1089–1098. [Google Scholar]
  31. Xu, S. . The 3D-QSAR Studies on Andrographolide Derivatives Inhibiting α-Glucosidase. Ph.D. Dissertation. Zhengzhou University: Zhengzhou, China, 2006.
  32. Wolfgang, H; Léopold, S. Applied Multivariate Statistical Analysis, 2nd ed; Springer Press: Berlin, Heidelberg, Germany, 2007; pp. 233–272. [Google Scholar]
  33. Ash, S; Cline, MA; Homer, RW; Hurst, T; Smith, GB. SYBYL line notation (SLN): A versatile language for chemical structure representation. J Chem Inf Comput Sci 1997, 37, 71–79. [Google Scholar]
  34. Timothy, EL. VAX Architecture Reference Manual; Digital Press: Newton, MA, USA, 1987; pp. 288–326. [Google Scholar]
  35. Frank, IE; Feikama, J; Constantine, N; Kowalski, BR. Prediction of Product Quality from Spectral Data Using the Partial Least-Squares Method. J. Chem. Inf. Comput. Sci 1984, 24, 20–24. [Google Scholar]
  36. Golbraikh, A; Tropsha, A. Beware of q2! J. Mol. Graph. Model 2002, 20, 269–276. [Google Scholar]
  37. Cramer, RD; Patterson, DE; Bunce, JD. Comparative molecular field analysis (CoMFA). 1. Effect of shape on binding of steroids to carrier proteins. J. Am. Chem. Soc 1988, 110, 5959–5967. [Google Scholar]
  38. Klebe, G; Abraham, U. Comparative Molecular Similarity Index Analysis (CoMSIA) to study hydrogen-bonding properties and to score combinatorial libraries. J. Comput. Aided Mol. Design 1999, 13, 1–10. [Google Scholar]
  39. van de Waterbeemd, H. Chemometric Methods in Molecular Design (Methods and Principles in Medicinal Chemistry); Wiley-VCH Press: Weinheim, Germany, 1995; pp. 309–318. [Google Scholar]
  40. Dixit, A; Kashaw, SK; Gaur, S; Saxena, AK. Development of CoMFA, advance CoMFA and CoMSIA models in pyrroloquinazolines as thrombin receptor antagonist. Bioorgan. Med. Chem 2004, 12, 3591–3598. [Google Scholar]
  41. Narayanan, R; Gunturi, SB. In silico ADME modelling: Prediction models for blood-brain barrier permeation using a systematic variable selection method. Bioorgan. Med. Chem 2005, 13, 3017–3028. [Google Scholar]
  42. Gunturi, SB; Narayanan, R; Khandelwal, A. In silico ADME modelling: Computational models to predict human serum albumin binding affinity using ant colony systems. Bioorgan. Med. Chem 2006, 14, 4118–4129. [Google Scholar]
  43. Gunturi, SB; Narayanan, R. In silico ADME modeling 3: Computational models to predict human intestinal absorption using sphere exclusion and kNN QSAR methods. QSAR Comb. Sci 2007, 26, 653–668. [Google Scholar]
Figure 1. Formulae of the studied andrographolide derivatives.
Ijms 11 00880f1aIjms 11 00880f1bIjms 11 00880f1c
Figure 2. PCA plot for studied compounds 125.
Ijms 11 00880f2
Figure 3. Key fragments of 2D-QSAR Model.
Ijms 11 00880f3
Figure 4. Structure of andrographolide.
Ijms 11 00880f4
Figure 5. Alignment of the database.
Ijms 11 00880f5
Figure 6. Compound 21 placed in the H-accept contour map.
Ijms 11 00880f6
Figure 7. Compound 21 placed in the hydrophobic contour map.
Ijms 11 00880f7
Figure 8. Compound 21 was placed in the steric contour map.
Ijms 11 00880f8
Table 1. Comparison of the predicted PLogIC50 of database with the experimental values by using 2D-QSAR Model.
CompoundACTaPREb|Δ|cCompoundACTPRE|Δ|
14.0003.9330.06724.0003.9950.05
33.9593.8760.10943.9594.0540.095
5---d64.2374.1390.098
74.2374.1590.07884.0764.0870.011
94.1554.0610.094104.0004.0990.099
114.0004.0890.08912---d
133.9594.1760.217144.0003.9460.054
153.9833.9240.059163.9213.9610.040
173.9963.9540.042183.9713.9020.069
194.5534.6860.133204.7964.8130.017
215.2224.8060.416224.8544.7980.056
234.6024.7150.113244.4444.7450.301
254.9594.6980.261
a:Experimental data (PLogIC50)
b:Predicted data (PLogIC50)
c:|a–b|
d:Outline compounds.
Table 2. Comparison of different 3D-QSAR models.
No.MethodFieldaOCb(q2)cSEd(R2)eF
1CoMFAS+E10.7410.1780.81967.905

2S20.7480.1590.86645.280
3E10.7100.1870.80260.592
4H20.7710.1320.90768.505
5D10.3130.2970.49814.876
6A10.7240.1840.80762.902
7S+E10.7320.1820.81264.778
8CoMSIAS+H10.7740.1480.875105.050
9S+A20.7380.1590.86645.251
10S+E+H10.7550.1690.83877.788
11S+H+A20.7590.1300.91070.509
12S+E+H+A10.7470.1740.82972.588
13fH(Focus)10.7760.1440.882112.028
14fS+H(Focus)20.7720.1.430.89157.188
15fS+E+H(Focus)20.7630.1480.88453.422
16fS+H+A(Focus)20.7940.1270.91575.093
Y-RandomS+H+A(Focus)10.199---
a:S: Steric field, E: Electrostatic field, H: Hydrophobic field.
D: H-donor field, A: H-acceptor field.
b:Optimum of component.
c:The models’ cross-validation r2.
d:Standard Error.
e:Correlation coefficient between predicted and experimental PLogIC50 of 18 compounds.
f:The model was optimized by Focus Method.
Table 3. Correlation coefficient between predicted and experimental PLogIC50 of the test set by model 13, 8, 15, and 16.
No.ModelsR2SlopeSE
13H(Focus)0.9061.0070.143
8S+H0.9270.9740.121
15S+E+H(Focus)0.8950.9370.142
16S+H+A(Focus)0.9410.9330.104
Table 4. Comparison between predicted PLogIC50 of database and experimental values by using Model 16.
CompoundACTaPREb|Δ|cCompoundACTPRE|Δ|
13.9963.9600.0424.0003.9600.04
33.9593.9700.01143.9593.9990.04
5---d64.2374.2380.001
74.2374.2040.03384.0764.0160.06
94.1554.1790.029104.0004.1190.119
114.0003.9350.06512---
133.9594.1110.152144.0004.1500.150
153.9834.1120.129163.9214.0750.154
173.9963.9160.08183.9713.9030.068
194.5534.6210.068204.7964.8630.068
215.2225.0670.155224.8544.8860.032
234.6024.8310.229244.4444.4810.037
254.9594.6980.261
a:Experimental data (PLogIC50)
b:Predicted data (PLogIC50)
c:|a–b|
d:Outline compounds

