1. Introduction
Insomnia, defined as the subjective perception of difficulty with sleep initiation, is a prevalent health complaint [
1]. The characteristics of insomnia are difficulty falling or maintaining asleep at night and increased fatigue in the daytime. Multiple researchers have found that the risk to develop insomnia increases with aging [
2]. An astounding 20%–33% of the adult population is affected by insomnia symptoms, with an estimated 10% to 15% meeting the criteria of diagnosing insomnia disorder [
3]. In addition, insomnia in later life can result in negative consequences, including decreased quality of life, impairment in function in general, increased risk for falls and nursing home placement [
4]. However, many things about this highly prevalent insomnia, including its function mechanism, clinical course, causes,
etc., still remain unknown [
5]. Consequently, pharmacologic agents are becoming increasingly desirable for a convenient option for the treatment of insomnia.
Histamine predominates in a series of physiological processes, like in the functions of immune cells, gastrointestinal tract and CNS (central nervous system). For instance, histamine in CNS is closely connected with a wide spectrum of functions, like the regulation of arousal and the sleep-wake cycle, appetite control, satiation, nociception and cognition [
6]. Antihistamines were first introduced in the 1940s and represent one of the most commonly-used medications today [
7]. This is just due to the specific histamine-blocking capability and marked sedative effects; H
1-antihistamines are often used for sleep promotion nowadays [
8]. Meanwhile, in quite a few medications, anti-histamines are also applied for the treatment of allergies, cold symptoms, nausea, itching and insomnia. However, after bedtime use of anti-histamines, the long plasma half-lives and protracted CNS exposure always are assumed to cause the frequently-occurring next-day impairment, which in turn suggests the importance of an improved pharmacokinetic profile in the selection of new insomnia-aimed H
1-antihistamines [
9]. As a result, for the treatment of insomnia, the use of novel and selective H
1-antihistamines with appropriate exposure is promising as an alternative to current medications, especially for sleeping improvements during the latter third of the night and overall sleep efficiency [
10]. Such agents increase sleep time and improve sleep efficiency [
10].
By combining with and stabilizing the inactive conformation of H
1-receptors, H
1-antihistamines act as inverse agonists and, thus, in this way, interfere with the actions of histamine at H
1-receptors [
11]. As a matter of fact, the development of H
1-antihistamines has undergone three generations. The first-generation antihistamines, which are also known as sedative antihistamines, contain brompheniramine, chlorphenamine and mepyramine (an ethylenediamine), hydroxyzine (a piperazine), diphenhydramine (an ethanolamine), promethazine (a phenothiazine) and triprolidine (alkylamine derivative) [
12]. Despite the wide application of these medications for insomnia therapy, publications about placebo-controlled trials concerning the agents’ safety and efficacy properties are still hard to find [
12]. However, the side effects are obvious for the first-generation H
1-antihistamines: (1) because of their poor receptor selectivity and high penetration rate of the blood-brain barrier, a depression of the CNS appears, which always leads to many symptoms, like not only drowsiness, fatigue, somnolence and dizziness, but also impairments of cognitive function, memory and psychomotor performance; (2) cardiac problems also appear due to anti-muscarinic effects, blockade of cardiac ion currents and α-adrenergic-receptor blockade; and (3) other problems occur owing to the ability to block α-adrenergic, muscarinic and serotoninergic receptors, which in turn bring about dry eyes, dry mouth, mydriasis, urinary retention, constipation, erectile dysfunction, gastrointestinal motility and memory deficits [
13]. On the contrary, hundreds of clinical trials lasting weeks/months (with proper randomized, double-masked, placebo-controlled properties) supported the second-generation H
1-antihistamines for the treatment of seasonal/intermittent and perennial/persistent allergic rhinoconjunctivitis and chronic urticaria. In these trials, both the inclusion and exclusion criteria were clearly stated, with an adequate number of participants enrolled and attrition and adherence appropriately documented [
14]. As for the third-generation, this was usually applied to describe some new antihistamines that are selective isomers or active metabolites of the older second-generation antihistamines. The similarity of the second and third generations is that they are both devoid of the first generation’s side effects, while exhibiting remarkable anti-histamine activity at the same time [
15]. Nevertheless, some second- and third-generation antihistamines can result in serious and often fatal cardiac arrhythmias, although they are potent inhibitors of the human ether-a-go-go (hERG) channel, which is associated with the prolongation of cardiac QTc [
16,
17]. Accordingly, for treating insomnia, an alternative to current medications, like selective H
1-antihistamines with an appropriate duration of CNS exposure, is a matter of choice, and investigating novel antihistamine antagonists is therefore very important.
In the process of finding rational small-molecule inhibitors, computational (rational) drug design has made significant contributions to the discovery of new and more efficacious therapeutics [
18]. Computational drug discovery and optimization approaches, based on quantitative structure-activity relationship (QSAR) principles, offer an efficient, as well as an economical alternative for drug development when employed in conjunction with synthetic medicinal chemistry and experimental testing of lead compounds [
19,
20,
21,
22]. Series of 3D-QSAR methods, including especially comparative molecular field analysis (CoMFA) and comparative molecular similarity indices analysis (CoMSIA), have proven their efficiency in aiding drug design over the last few years [
23,
24,
25]. In this work, in order to investigate the interactions of 129 novel H
1-antihistamines synthesized by Graham
et al. [
26,
27,
28,
29,
30,
31,
32,
33], we jointly used 3D-QSAR, docking and molecular dynamics (MD) simulation approaches, to perform a deep exploration for those physical-chemical factors impacting the H
1-antihistamines’ bioactivity and a detailed investigation for understanding the binding mode of the histamine H
1 receptor. The established results are expected to provide valuable insights into potential structural modifications for developing more potent and selective H
1-antihistamines, as well as understanding their interaction mechanisms.
2. Results
2.1. 3D-QSAR Analysis
The predictive capability of the models relies on the alignment rules. Thus, various alignment strategies can lead to different statistical values in the constructed QSAR models [
34]. Among the three alignment methods (Alignment-I, -II and -III) described in our study, the atom-based alignment (Alignment-I) has the best predictive ability (with the largest
Q2,
R2ncv,
R2pred and the lowest standard error of estimate (SEE), standard error of prediction (SEP) values). Therefore, the Alignment-I method was finally chosen for the 3D-QSAR analysis. In addition, the PLS method with LOO analysis can illustrate the reliability of a 3D-QSAR model and, thus, was used for the prediction and design of new molecules. Furthermore, several statistical parameters, including
Q2,
R2ncv,
R2pred, SEE, SEP, F-statistic and the optimal number of principal components (
N), were also analyzed. In order to evaluate the
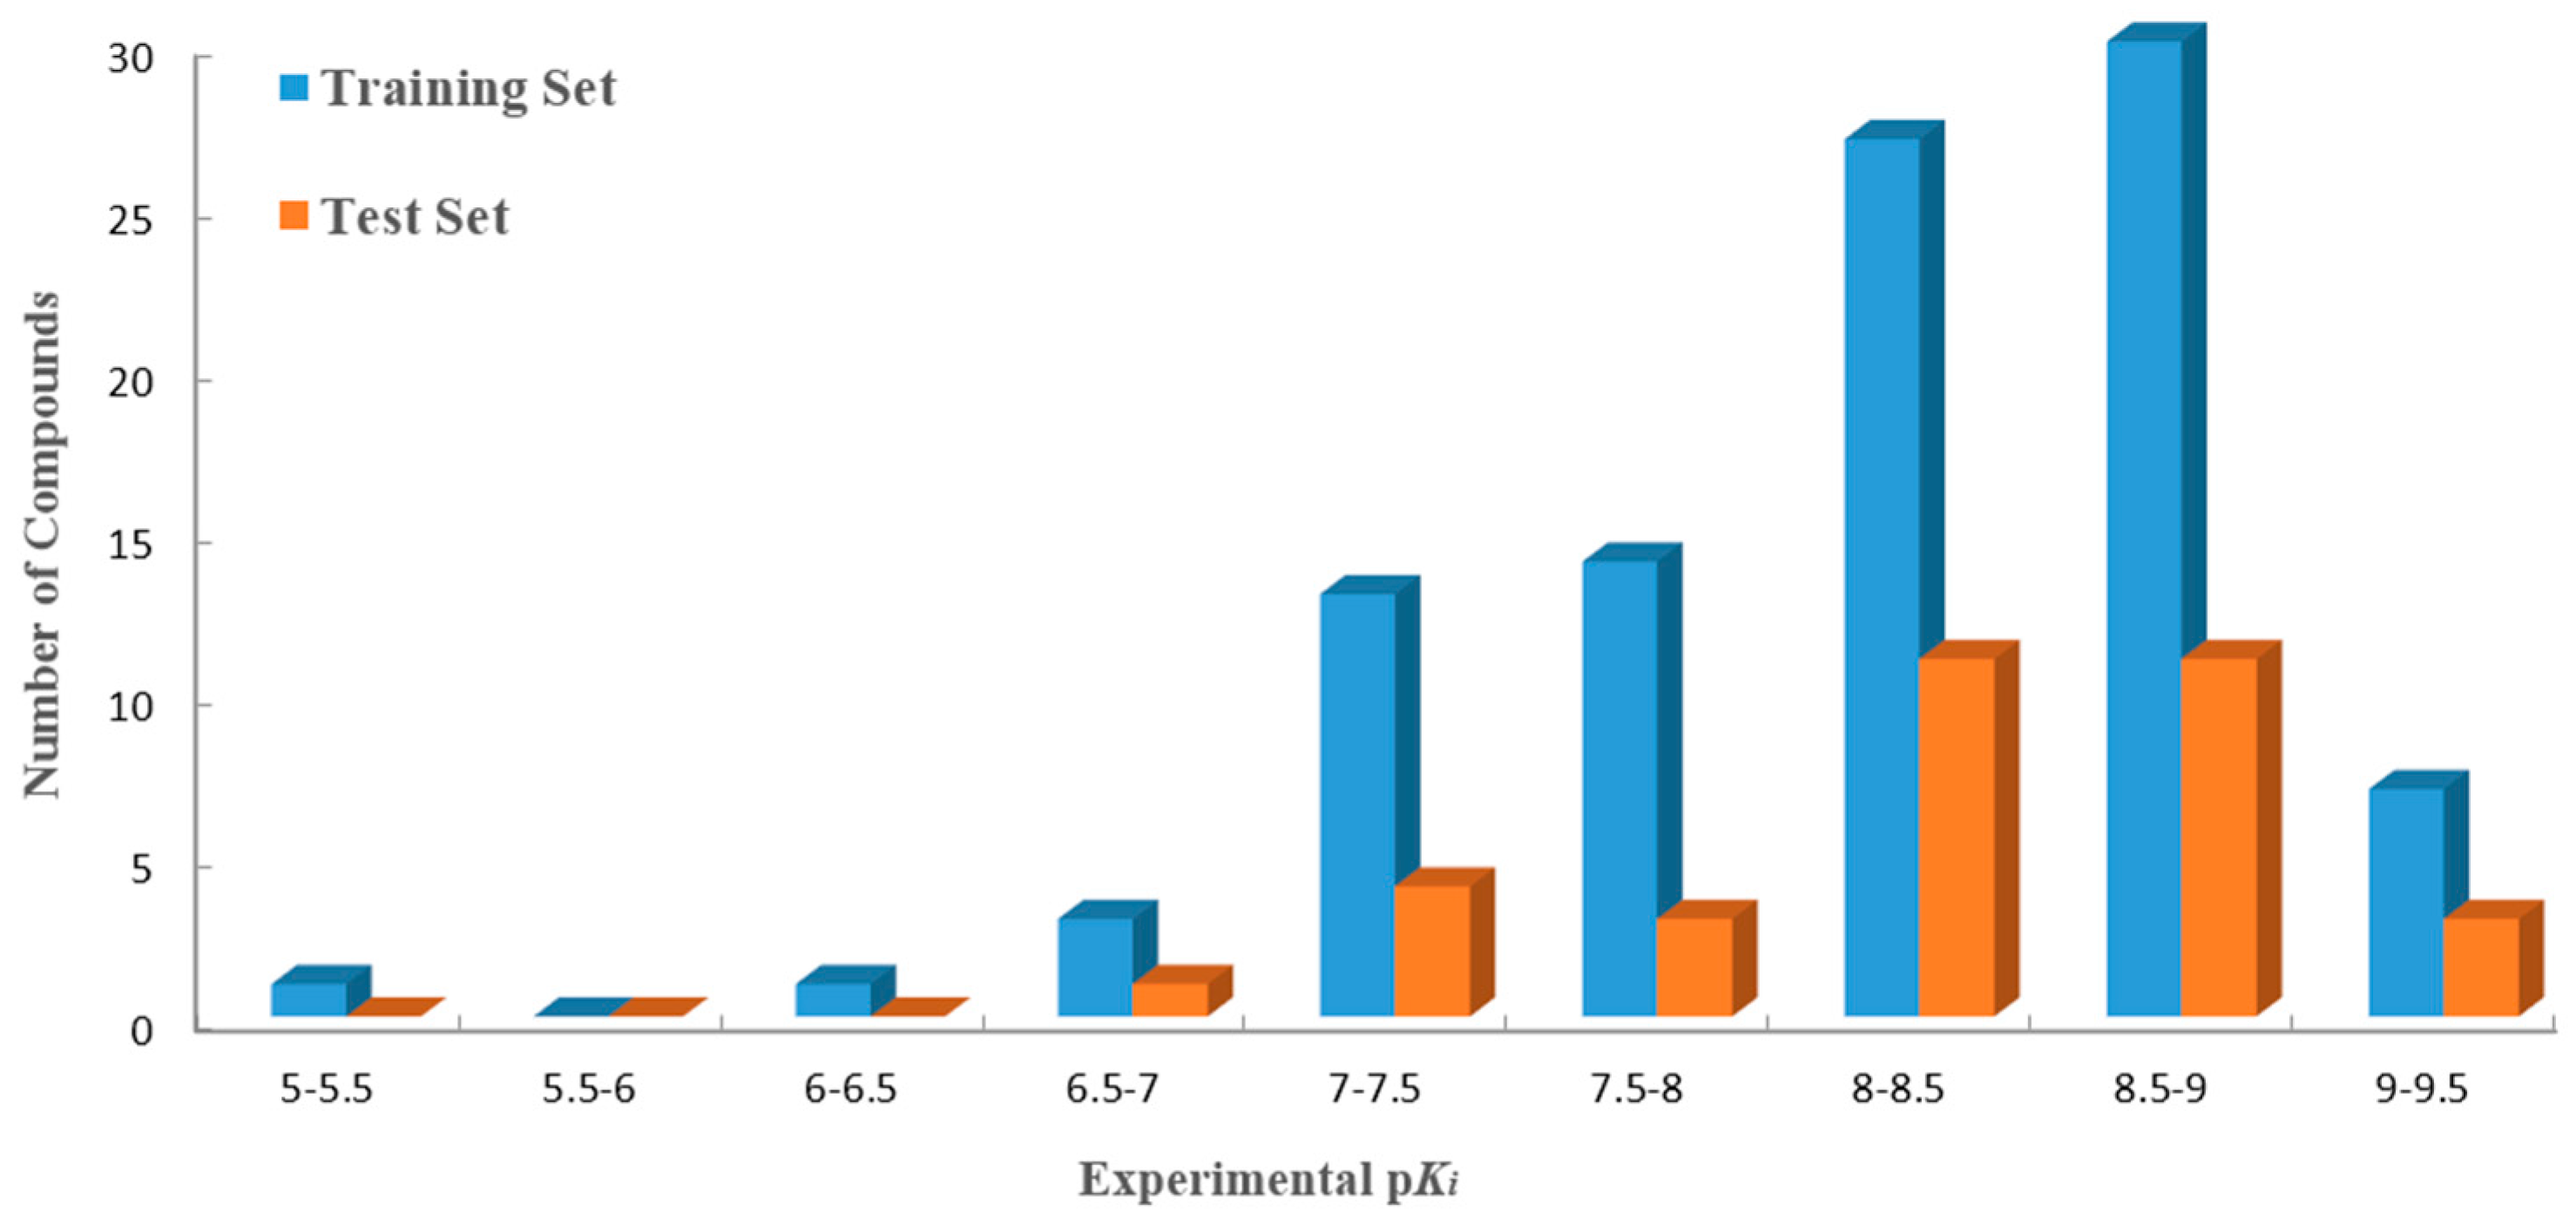
R2pred value, the whole dataset was divided into training (96 compounds) and test sets (33 ones). The distribution of the activity data of all 129 compounds with their numbers is shown in
Figure 1.
Figure 1.
Distribution of activities (pKi) for the training and the test sets versus the numbers of compounds. The training and the test sets are colored blue and orange, respectively.
Figure 1.
Distribution of activities (pKi) for the training and the test sets versus the numbers of compounds. The training and the test sets are colored blue and orange, respectively.
By the analysis of the obtained QSAR models, the CoMFA model combined with steric and electrostatic fields was obtained. As we know,
Q2 (>0.5) is one of the best parameters for evaluating whether a good 3D-QSAR model is acceptable. However, as depicted in
Table 1, two descriptor fields in CoMFA form all three possible combination models,
i.e., steric (S), electrostatic (E) and SE models. The
Q2 values of these models are 0.013, −0.081 and 0.044, respectively, which do not meet the criterion (
Q2 > 0.5), indicating an unacceptable 3D-QSAR model. Thus, the CoMSIA models with a combination of five descriptor fields, including S, E, hydrophobic (H), H-bond donor (HB-donor) and acceptor (HB-acceptor), were developed to generate the optimal 3D-QSAR model.
Table 1.
Summary of comparative molecular field analysis (CoMFA) and comparative molecular similarity indices analysis (CoMSIA) results. S, steric; E, electrostatic; H, hydrophobic.
Table 1.
Summary of comparative molecular field analysis (CoMFA) and comparative molecular similarity indices analysis (CoMSIA) results. S, steric; E, electrostatic; H, hydrophobic.
| PLS Statistics | N | Q2 | SEP | R2ncv | SEE | F | R2pred | Contribution (%) |
|---|
| S | E | H | D | A |
|---|
| CoMFA |
| S | 1 | 0.013 | 0.730 | 0.214 | 0.652 | 25.618 | 0.020 | 100 | – | – | – | – |
| E | 1 | −0.081 | 0.764 | 0.088 | 0.702 | 9.052 | 0.204 | – | 100 | – | – | – |
| SE | 4 | 0.044 | 0.730 | 0.563 | 0.494 | 29.325 | 0.064 | 50.2 | 49.8 | – | – | – |
| CoMSIA |
| S | 1 | −0.223 | 0.628 | 0.213 | 0.504 | 8.365 | 0.272 | 100 | – | – | – | – |
| E | 4 | 0.224 | 0.659 | 0.601 | 0.472 | 34.296 | 0.450 | – | 100 | – | – | – |
| H | 5 | 0.132 | 0.700 | 0.581 | 0.487 | 24.921 | 0.177 | – | – | 100 | – | – |
| D | 4 | 0.126 | 0.698 | 0.164 | 0.683 | 4.450 | 0.075 | – | – | – | 100 | – |
| A | 3 | −0.011 | 0.747 | 0.271 | 0.634 | 11.389 | 0.005 | – | – | – | – | 100 |
| SE | 5 | 0.196 | 0.680 | 0.661 | 0.437 | 35.113 | 0.503 | 20.5 | 79.5 | – | – | – |
| SH | 7 | 0.116 | 0.714 | 0.734 | 0.392 | 34.635 | – | 27.5 | – | 72.5 | – | – |
| SD | 4 | 0.212 | 0.663 | 0.366 | 0.595 | 13.116 | −0.07 | 36.8 | – | – | 63.2 | – |
| SA | 3 | −0.01 | 0.743 | 0.329 | 0.608 | 15.057 | −0.022 | 27.4 | – | – | – | 72.6 |
| EH | 4 | 0.297 | 0.501 | 0.913 | 0.177 | 73.179 | 0.920 | – | 66.7 | 33.3 | – | – |
| ED | 2 | 0.197 | 0.518 | 0.583 | 0.373 | 21.010 | – | – | 75.2 | – | 24.8 | – |
| EA | 5 | 0.255 | 0.525 | 0.906 | 0.187 | 51.889 | 0.913 | – | 56.8 | – | – | 43.2 |
| HD | 6 | 0.044 | 0.606 | 0.771 | 0.297 | 14.615 | 0.789 | – | – | 89.6 | 10.4 | – |
| HA | 3 | 0.226 | 0.517 | 0.802 | 0.261 | 39.174 | – | – | – | 33.6 | – | 66.4 |
| DA | 2 | 0.186 | 0.521 | 0.642 | 0.346 | 26.847 | 0.670 | – | – | – | 27.5 | 72.5 |
| SEH | 5 | 0.260 | 0.524 | 0.936 | 0.154 | 78.990 | 0.940 | 10.8 | 60.0 | 29.2 | – | – |
| SED | 2 | 0.143 | 0.535 | 0.597 | 0.366 | 22.240 | 0.628 | 11.2 | 65.6 | – | 23.2 | – |
| SEA | 5 | 0.261 | 0.523 | 0.908 | 0.185 | 53.165 | 0.915 | 11.3 | 50.5 | – | – | 38.2 |
| SHD | 6 | −0.115 | 0.655 | 0.819 | 0.264 | 19.552 | 0.832 | 28.2 | – | 59.9 | 11.9 | – |
| SHA | 2 | 0.169 | 0.526 | 0.675 | 0.329 | 31.120 | 0.699 | 11.1 | – | 23.8 | – | 65.1 |
| SDA | 2 | 0.149 | 0.533 | 0.655 | 0.339 | 28.530 | 0.682 | 10.5 | – | – | 25.1 | 64.4 |
| EHD | 6 | 0.223 | 0.547 | 0.939 | 0.154 | 66.188 | 0.943 | – | 60.0 | 30.5 | 9.4 | – |
| EHA | 4 | 0.284 | 0.506 | 0.905 | 0.184 | 66.697 | 0.913 | – | 43.3 | 21.8 | – | 35.0 |
| EDA | 3 | 0.206 | 0.523 | 0.831 | 0.242 | 47.381 | 0.844 | – | 41.3 | – | 14.3 | 44.3 |
| HDA | 4 | 0.262 | 0.642 | 0.557 | 0.497 | 28.630 | 0.268 | – | – | 31.2 | 37.9 | 30.9 |
| SEHD | 9 | 0.525 | 0.529 | 0.891 | 0.253 | 78.468 | 0.807 | 9.6 | 43.7 | 24.5 | 22.2 | – |
| SEHA | 6 | 0.287 | 0.642 | 0.788 | 0.348 | 55.196 | 0.483 | 9.0 | 42.7 | 23.5 | – | 24.8 |
| SEDA | 9 | 0.324 | 0.632 | 0.854 | 0.293 | 55.962 | 0.600 | 10.4 | 44.7 | – | 20.5 | 24.4 |
| SHDA | 4 | 0.238 | 0.652 | 0.554 | 0.499 | 28.202 | 0.241 | 9.7 | – | 25.8 | 37.3 | 27.3 |
| EHDA | 9 | 0.433 | 0.579 | 0.893 | 0.251 | 79.732 | 0.709 | – | 36.5 | 21.3 | 19.8 | 22.4 |
| SEHDA | 9 | 0.445 | 0.572 | 0.898 | 0.246 | 83.748 | 0.720 | 6.7 | 34.8 | 18.6 | 19.3 | 20.6 |
Five descriptor fields (S, E, H, HB-donor and-acceptor) with all 31 possible combinations were calculated to build the optimal 3D-QSAR model in the CoMSIA analysis. The obtained
Q2,
R2ncv and
R2pred values and other statistical results from the CoMSIA analysis for all combinations of the fields are depicted in
Table 1. From
Table 1, we can see that the CoMSIA model based on S, E, H and HB-donor fields was the best model, yielding the best
Q2,
R2ncv, SEE,
F and
R2pred values, and, thus, was chosen for further study. This model gives good statistical parameters and has the optimal number of components (
N = 9) with a
Q2 of 0.525, which is better than the other value from the previous CoMFA model. In addition, the high
R2ncv and
F-value of 0.891 and 78.468 along with the low SEE value of 0.253 indicate that the CoMSIA model with the S, E, H and HB-donor is statistically satisfactory. The contributions of the relative S, E, H and HB-donor fields were 9.6%, 43.7%, 24.5% and 22.2%, respectively. The results indicate that the E field plays an important role of impacting the activity of H
1-antihistamines. The H and HB-donor fields contribute equally to the majority of the activity.
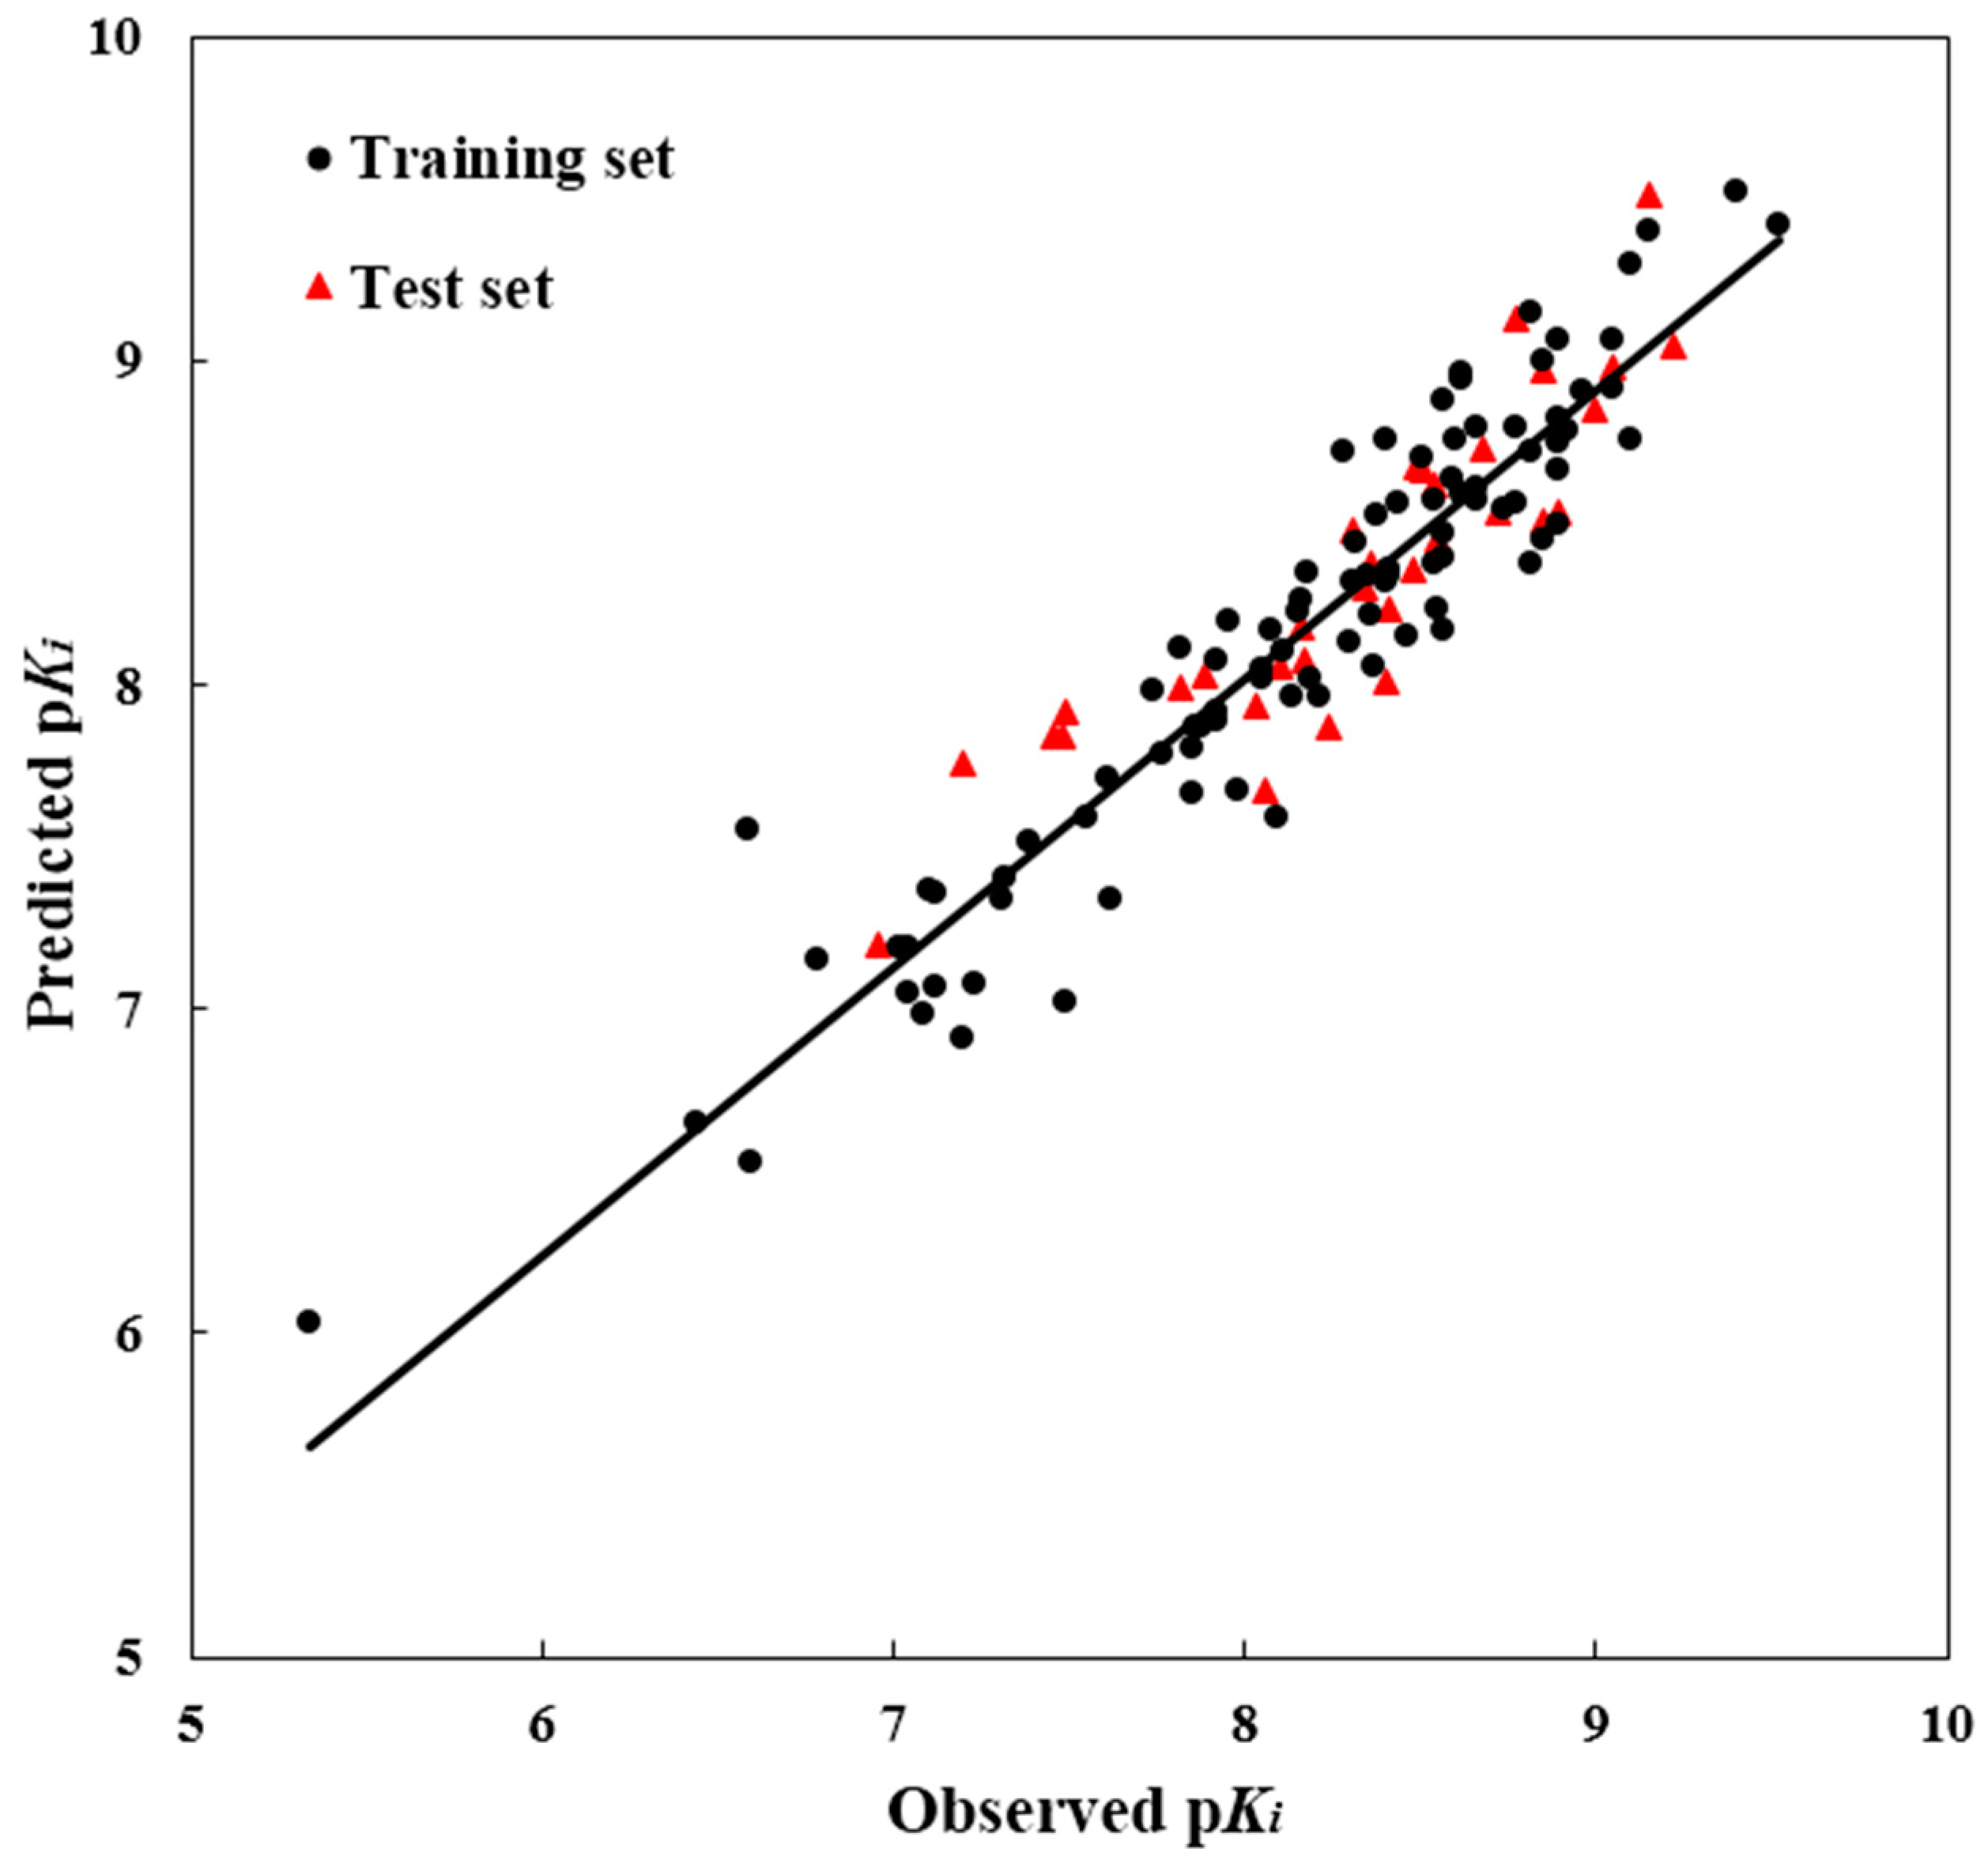
To test the predictability of a 3D-QSAR model, a crucial step is to examine the quality of a model for the prediction of the biological activity of the compounds. Therefore, for the purpose of assuring the predictive power of the model built from the training set, the test set modeling was constructed to predict the bioactivities values of the 39 compounds in the test set. For the test molecules, their predicted and actual bioactivity values were in good accordance within a tolerable error range. Additionally, the
R2pred value was computed as 0.807, showing good external prediction performance of the obtained model. The good correlation between the predicted and observed activities p
Ki values for all molecules is shown in
Figure 2, indicating the strong predictive ability of the obtained optimal CoMSIA models. To sum up, the comprehensive assessment gives satisfactory results, showing a high precision of prediction from the built 3D-QSAR model with actual biological validation values.
Figure 2.
The ligand-based correlation plots of the predicted versus the actual pKi values using the training (filled red triangles) and the test (filled black dots) set compounds based on the optimal CoMSIA model.
Figure 2.
The ligand-based correlation plots of the predicted versus the actual pKi values using the training (filled red triangles) and the test (filled black dots) set compounds based on the optimal CoMSIA model.
2.2. Graphical Interpretation of CoMSIA Model
In order to reveal the crucial characteristics of the ligands, four contour maps were generated from the optimal ligand-based CoMSIA model. Generally speaking, the painted contours around the lattice points where the 3D-QSAR model strongly correlated changes in the ligands’ region values with changes in biological efficiency. This is especially important to increase or decrease the activity of the ligand by changing the molecular structure traits leading to the interaction between the binding sites of the receptor and the ligand [
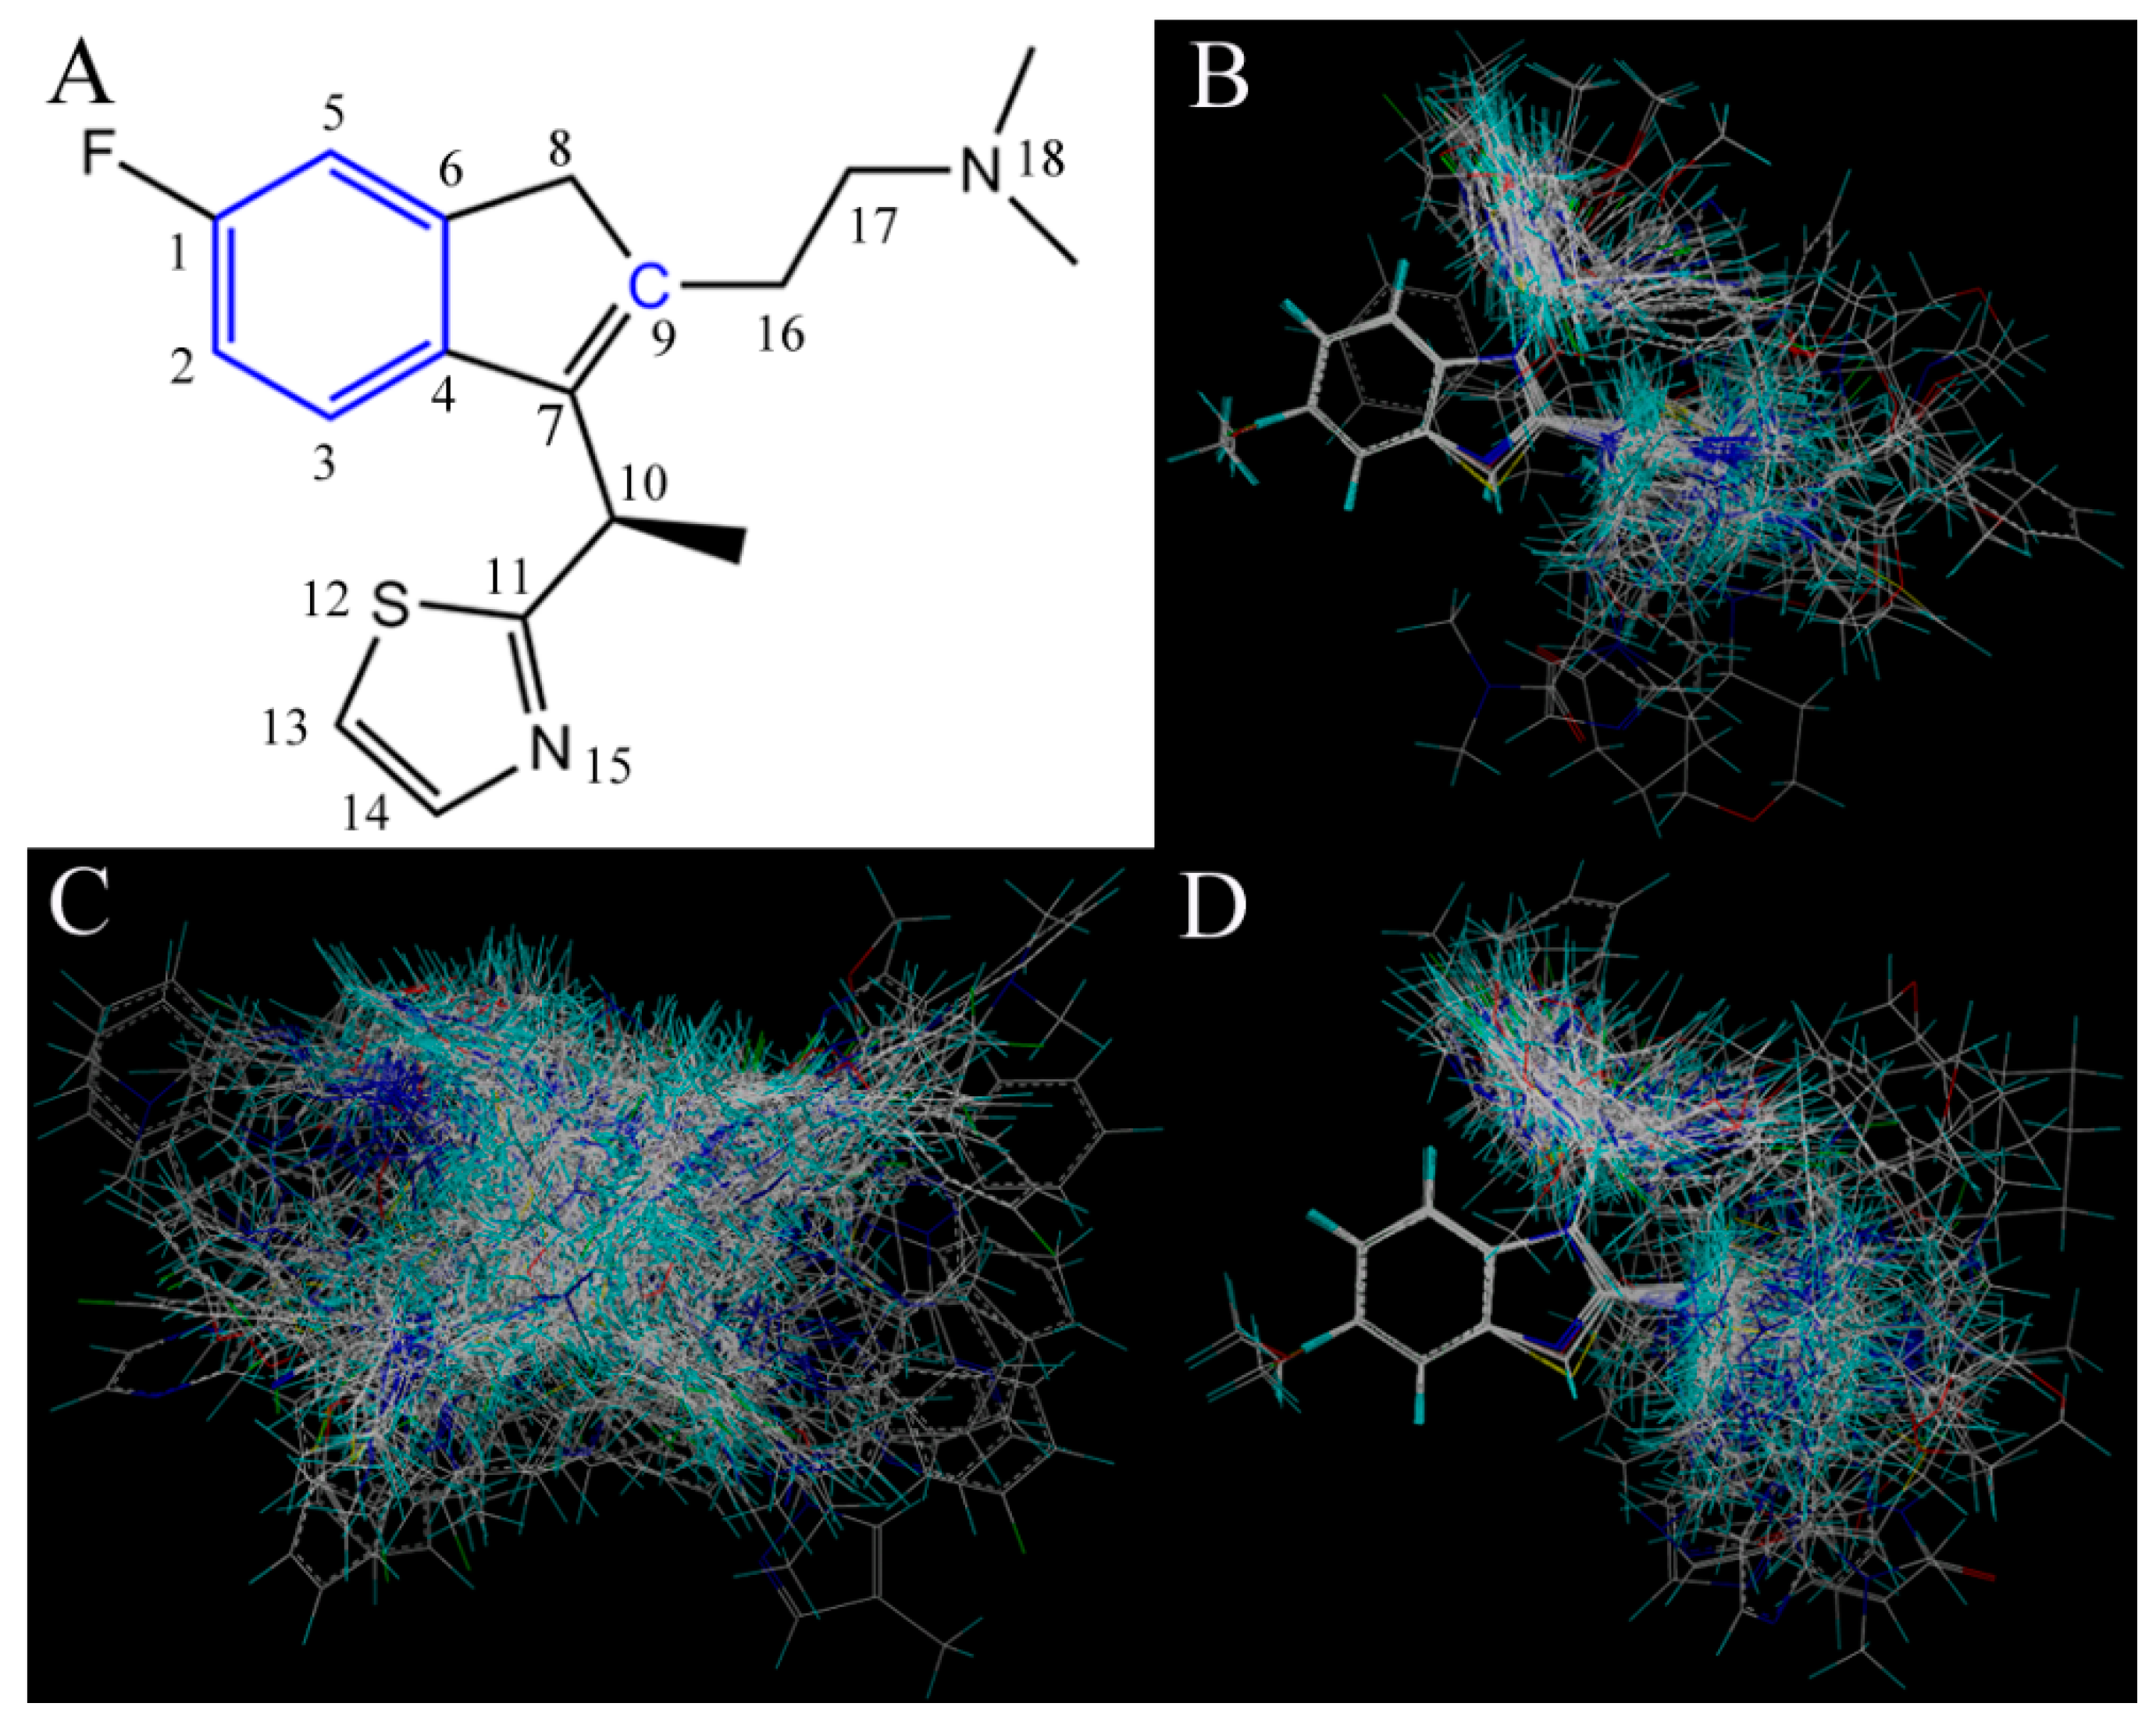
35]. To visualize the results of the CoMSIA model, the most potent compound 49 in the whole dataset was overlapped on the CoMSIA contour maps.
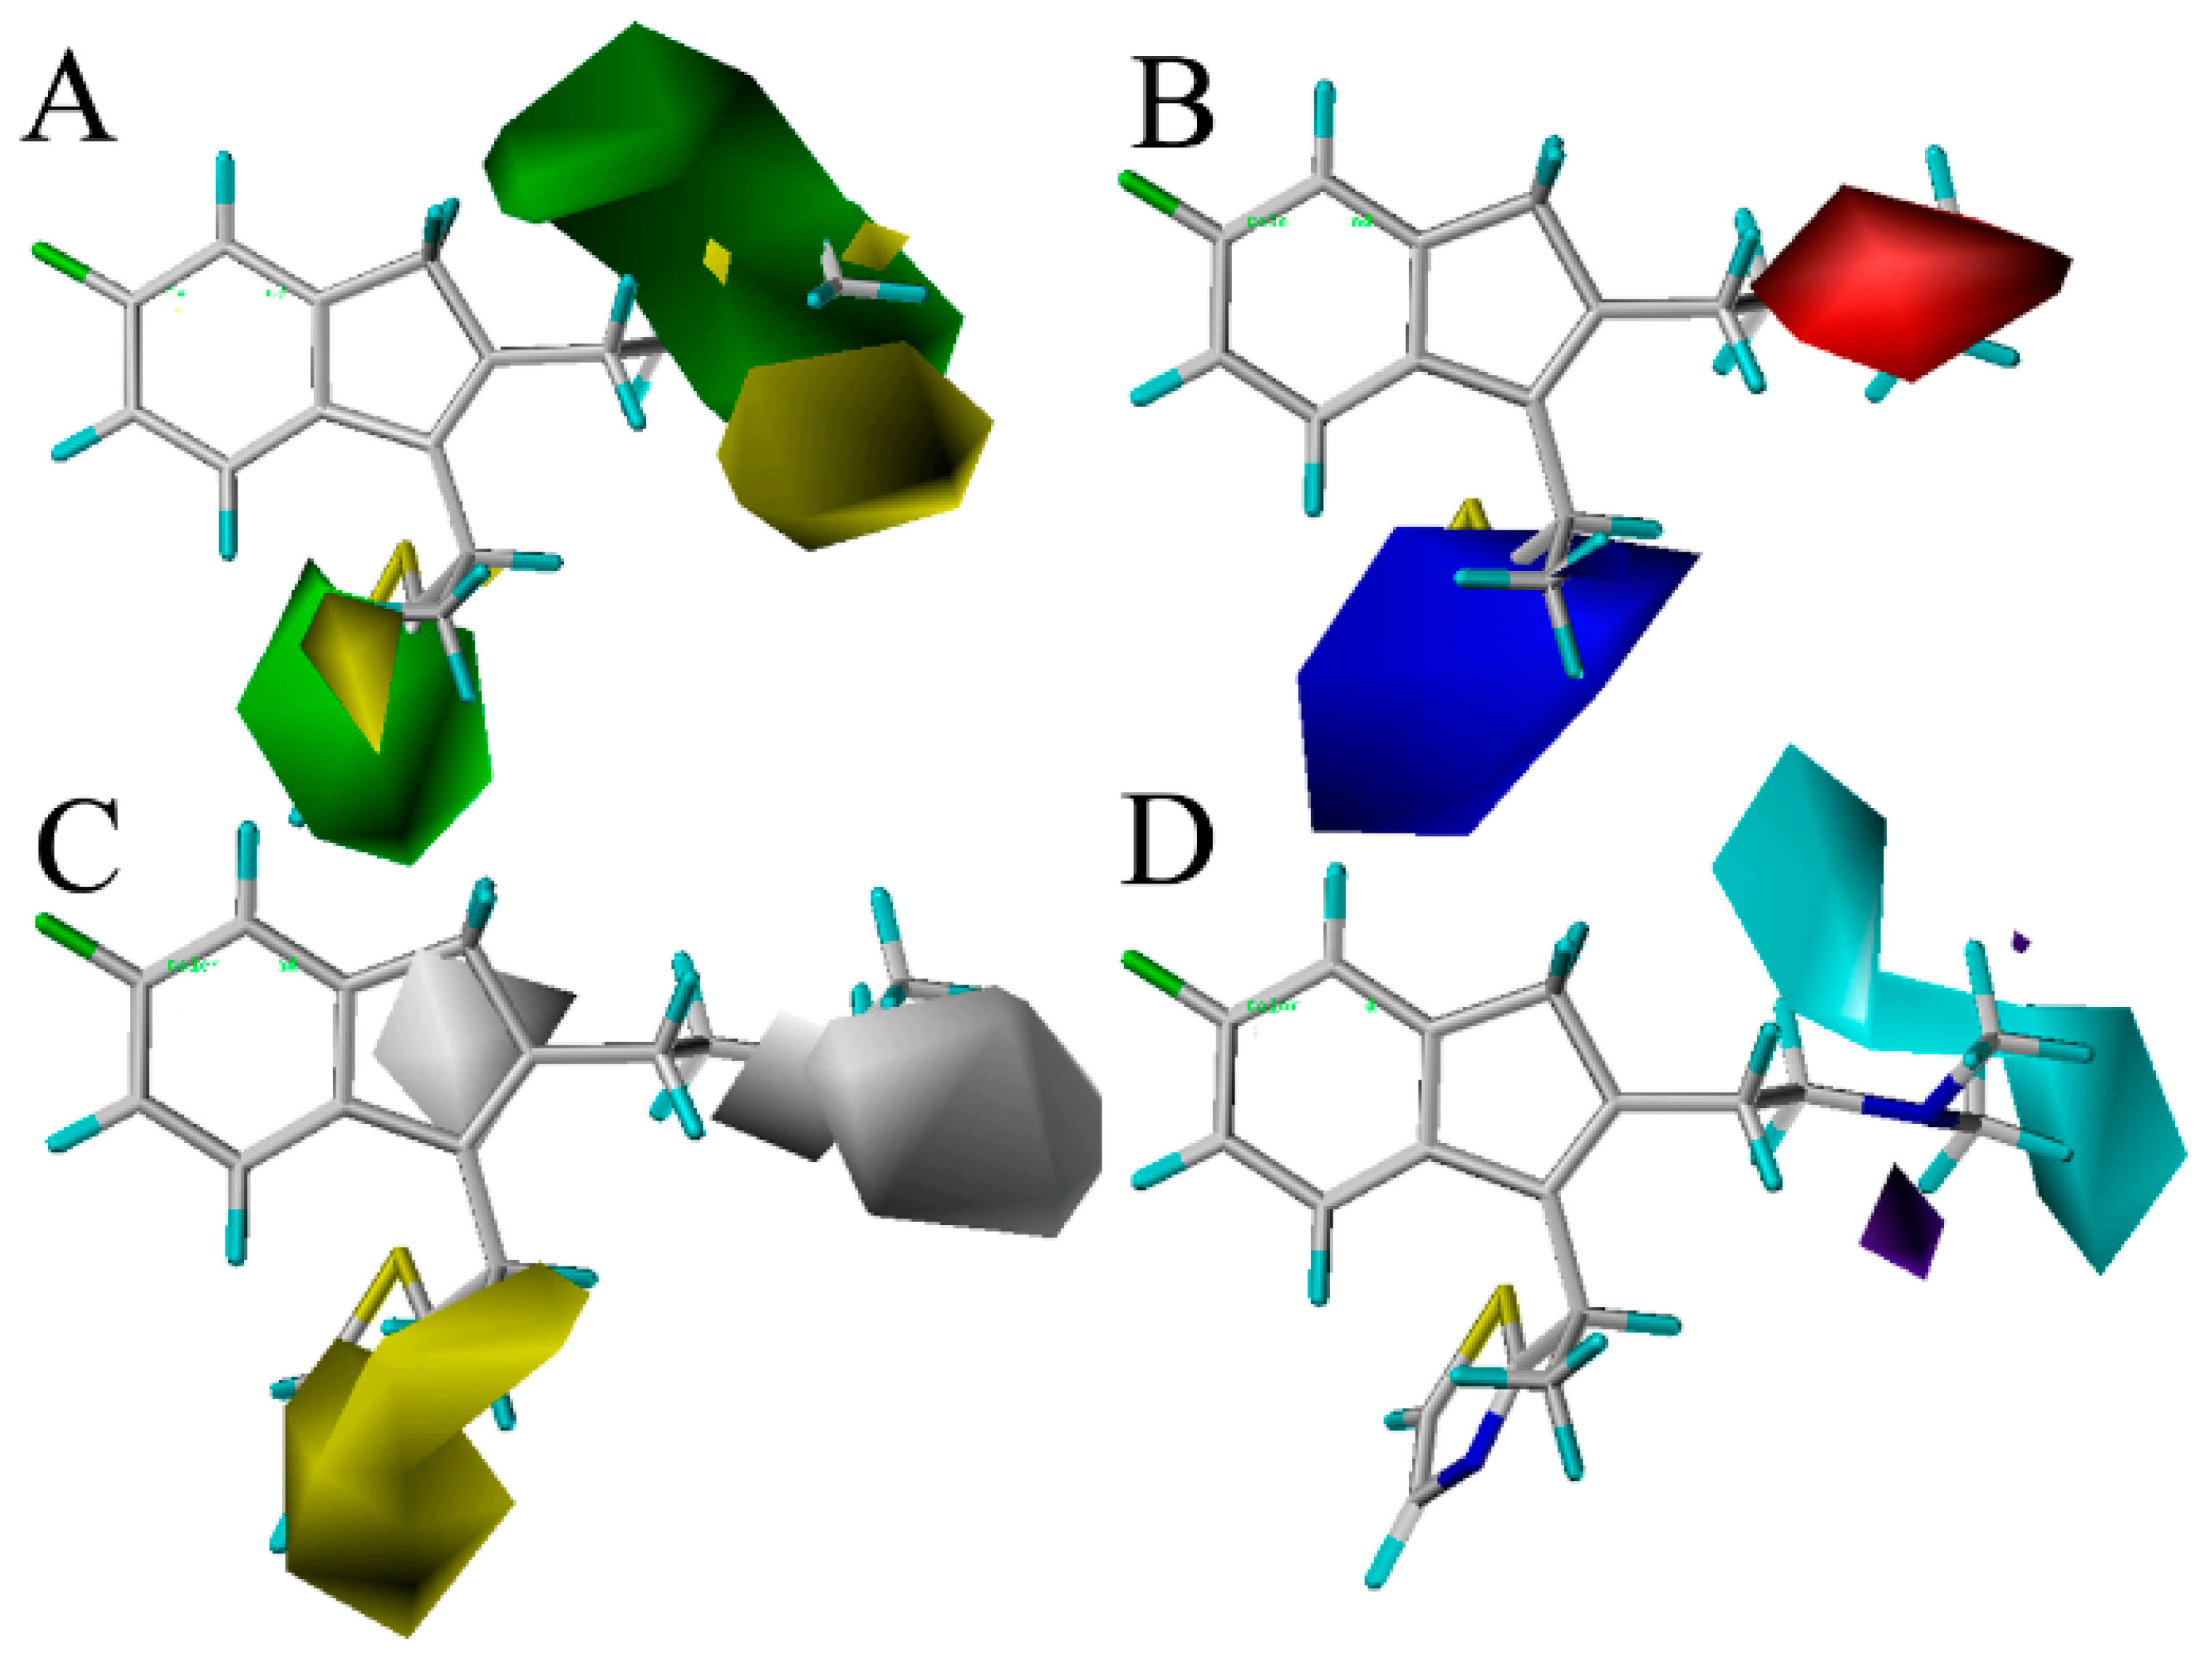
Figure 3 shows the CoMSIA contour maps of the four description fields, including S, E, H and HB-donor. The contribution of the positive and negative standards was kept at the default values of 20% and 80%, respectively.
Figure 3.
Contour maps of CoMSIA combined with compound 49. (A) Contour maps in steric (green/yellow) fields. Green and yellow contours represent regions where bulky groups will increase and decrease the activity, respectively; (B) Contour maps in electrostatic (red/blue) fields. Red and blue contours represent regions where negative- and positive-charged substituents will decrease and increase the activity, respectively; (C) Contour maps in hydrophobic (yellow/gray) fields. Yellow and gray contours represent regions where the hydrophobic and hydrophilic groups will increase their activity; (D) Contour maps in H-bond (HB) donor (cyan/purple) fields. Cyan and purple contours represent regions where HB donor substituents will enhance and decrease the activity, respectively.
Figure 3A displays the CoMSIA steric contour maps in which yellow and green contours indicate that the bulky groups are disfavored and favored regions for the activity, respectively. From the figure, we can see that the position-16 of the molecule 49 is surrounded by a green isopleth, indicating that the compounds with a big substituent at this position would be more active than the other compounds with a smaller or without a group at the same position. The fact that the compound 79 (p
Ki = 8.620) with –(CH
2)
2Ph is more active than the compound 77 with –Ph (p
Ki = 7.094) at this position is a good instance. The higher activity of compound 96 with the thiazole substituent (p
Ki = 8.886) when compared to compound 87 with –CH
3 (p
Ki = 8.620) is also such a case. As a result, in order to enhance the antagonism effect of the ligand, new analogs with bulk substituents in these positions should be explored. In the second place, the position-18 is covered by a big yellow contour, revealing that the bulky group at this position has an unfavorable effect on the ligand’s histamine H
1 receptor antagonism activity. Indeed, this is in good agreement with the reported experimental results that compound 16 (p
Ki = 6.592) has a –CH
3 substituent at this position and has less antagonism activity than compound 17 (p
Ki = 7.495) with –H.
The CoMSIA electrostatic contours are shown in
Figure 3B, where the red and blue regions indicate the electronegative and positively-charged favorable region, respectively. In the positive electrostatic field, a blue contour near position-11 of the thiazole substituent indicates that the electropositive moiety at this position might enhance the biological activity for new compounds. Take compounds 33, 40, 41, 87 and 99 for examples; the strong and electropositive –OCH
3 substituent at the position-3 of the thiazole ring results in significantly increased biological activity. In addition, when compared to compound 65 (p
Ki = 8.092), which has a positively-charged favorable for the corresponding oxygen near the position-14 of thiazole, it is obvious that the compound 66 (p
Ki = 8.174) has a higher activity with an electropositive charge favorable for the corresponding sulfur. At the same time, red contours in the surroundings of the NCH
3CH
3 substituents near the position-17 denote that electronegative substituents are favorable in this zone for an increase of the antagonism of the histamine H
1 receptor. Due to this phenomenon, which may have something to do with the atoms N and O (electronegative charged atoms) of compounds 5, 19, 29, 32 to 35, 116 to 117 and 119 at the position-17, it can explain why a small red contour is depicted here.
Figure 3C depicts the CoMSIA hydrophobic contour maps, where the yellow and gray regions are favorably hydrophobic and hydrophilic for the activity, respectively. A yellow contour is found near the thiazole ring in the position-14, showing that the hydrophobic substituents (like –OMe, –F, –Cl) at this position will increase the activity. Compounds 7, 8, 9, 10, 13 and 14 with higher potency are observed to follow this mode closely for the presence of a hydrophobic group –OMe, –F and –Cl at the position. Moreover, a big gray isopleth near the NCH
3CH
3 substituent of the position-17 and a small contour located at position-16 indicate that the hydrophilic substituents at these positions will increase the activity.
The CoMSIA HB-donor contour maps are represented in
Figure 3D. In the HB-donor field, the cyan and purple isopleths indicate the regions where the HB-donor substituents would enhance and decrease the activity, respectively. As shown in
Figure 3D, a larger cyan isopleth around the NCH
3CH
3 group in the position-18 reveal that HB-donor groups at the position may benefit from the activity. Compound 60 (p
Ki = 8.553) has a higher activity than compound 52 (p
Ki = 8.143), and compound 75 (p
Ki = 8.569) is more potent than compound 76 (p
Ki = 7.124), which validate these results. Additionally, a small-sized purple contour is observed near the position-16 of the benzene group, which reveals that the HB-acceptor substituents at these positions will be unfavorable for the activity. This is in agreement with the observations that 88 (p
Ki = 7.851) is less potent than 119 (p
Ki = 8.310), because 88 has nitrogen as an HB-acceptor substituent, which is far from the purple region, while 119 with nitrogen is lightly close to this area, favorable for potency.
Taken together, the results described above reveal the requisite structure for improving the bioactivities of the antagonists of this class.
2.3. Molecule Docking
Docking is a crucial method for probing the relationships between the ligand of the receptor target. In order to explore the interactions between a compound and a histamine H1 receptor, useful information about the structural features of binding sites of proteins can be provided by the molecular docking procedure, which is of help for developing new high potency antagonists. Currently, all of the ligands in the dataset were docked into the active site of the histamine H1 receptor for the purpose of investigating the action mechanism of the H1-antihistamines with their target.
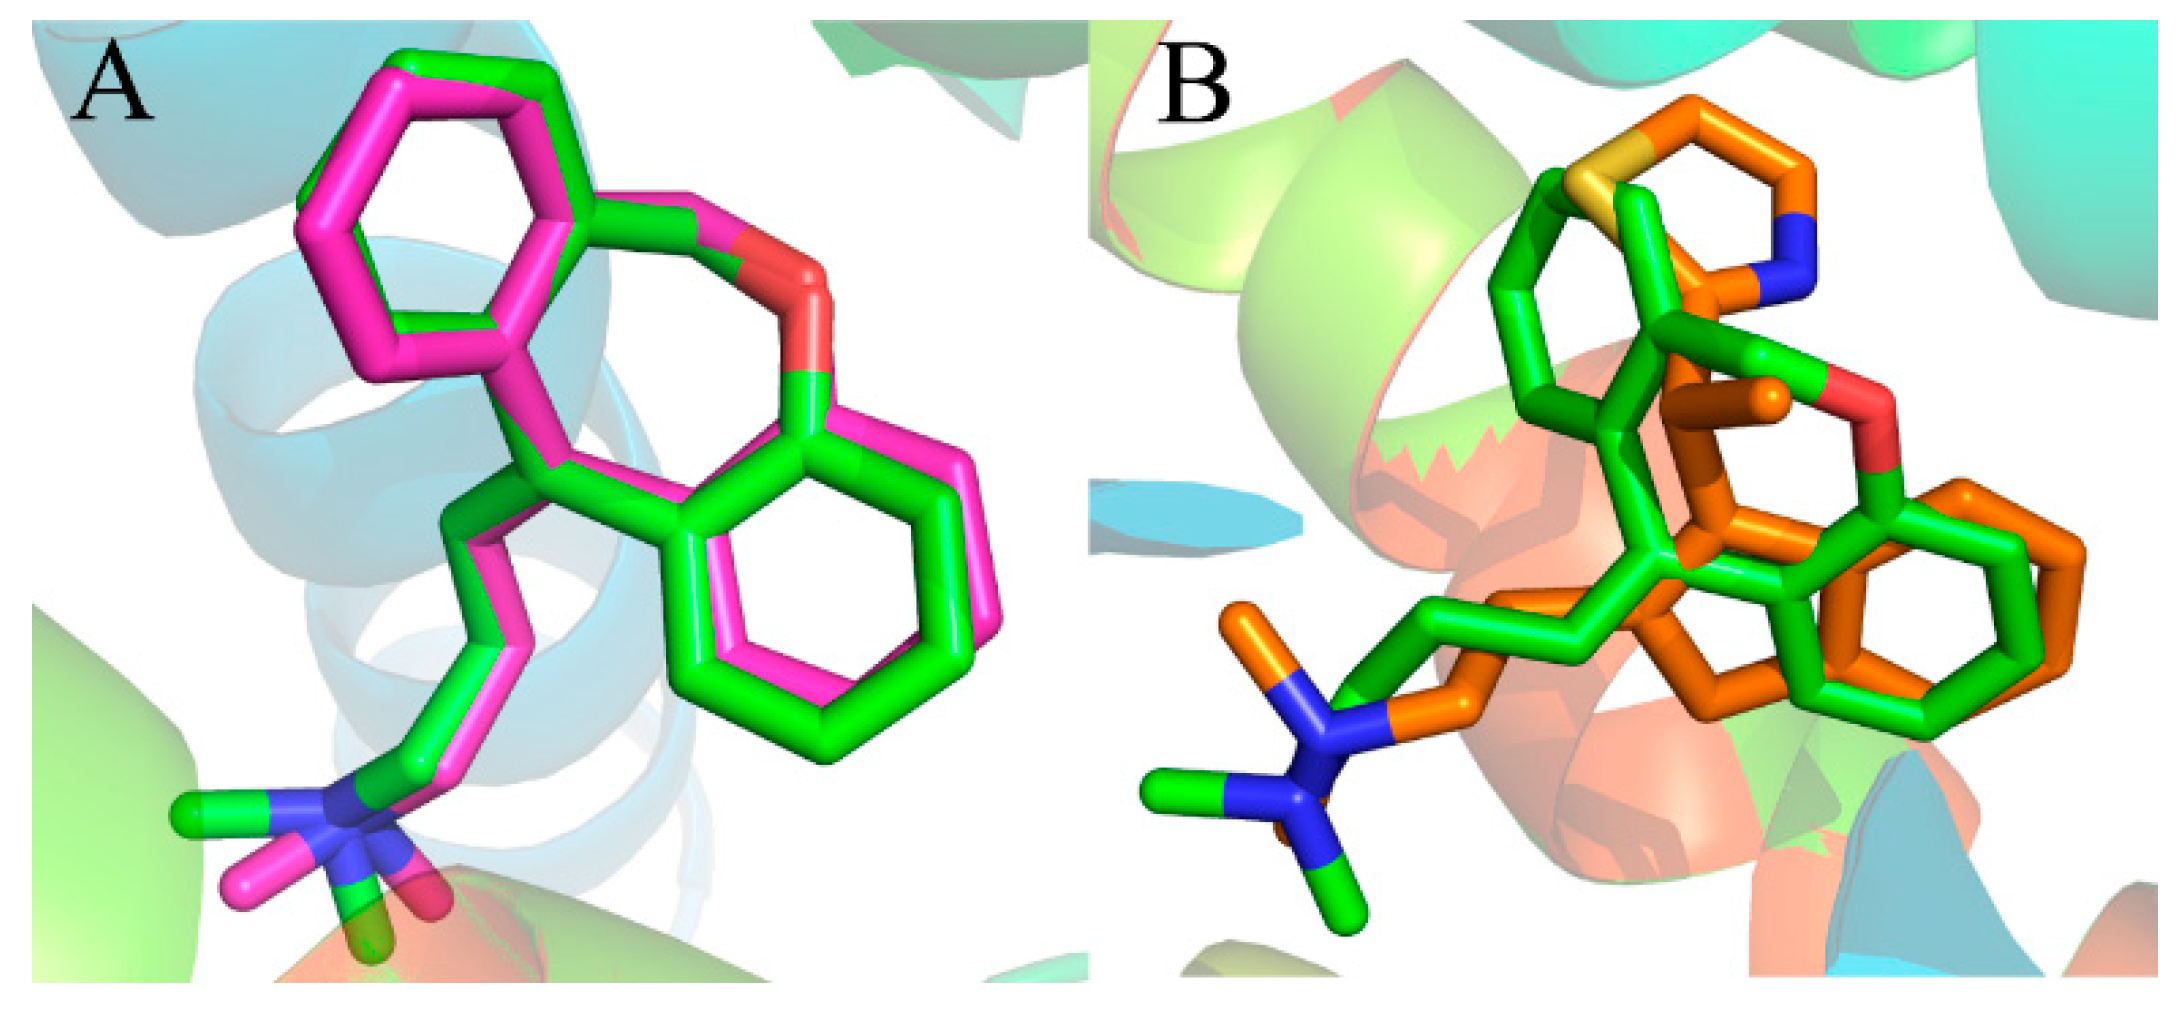
2.3.1. Docking Validation
Prior to the docking project, the reliability of the docking method is determined by the resemblance of docked conformation with the corresponding co-crystallized ligand. Presently, the X-ray crystal structure of the histamine H
1 receptor complex was used to support the reliability of the docking study. The known co-crystallized doxepin [
36] was removed from the complex of the crystalline structure and re-docked into the active site of the histamine H
1 receptor. The most possible binding conformation is the docked pose with the highest total score value.
Figure 4A shows the good superimposition of the original co-crystallized conformation with the re-docked doxepin, indicating that the reliability of the docking procedure is acceptable. Meanwhile, the simulated compound 49 was superimposed with experimental poses of doxepin in the binding site (
Figure 4B). From the superimposition, only a slight difference can be observed between the two compounds, validating the fact that the docking procedure is a reliable method.
Figure 4.
(A) Binding poses of co-crystallized (magenta) and re-docked (green) compound doxepin; (B) overlap of the compound 49 (orange) and experimental doxepin (green; PDB code: 3RZE) conformation.
Figure 4.
(A) Binding poses of co-crystallized (magenta) and re-docked (green) compound doxepin; (B) overlap of the compound 49 (orange) and experimental doxepin (green; PDB code: 3RZE) conformation.
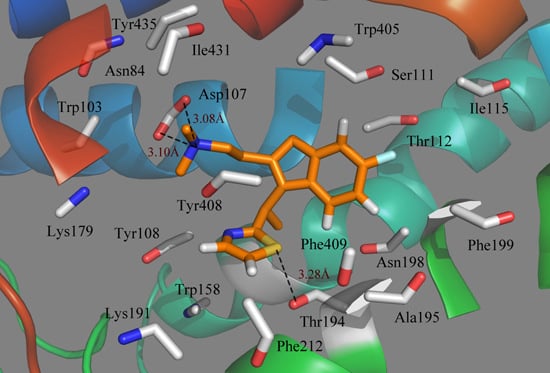
2.3.2. Ligand-Binding Pocket
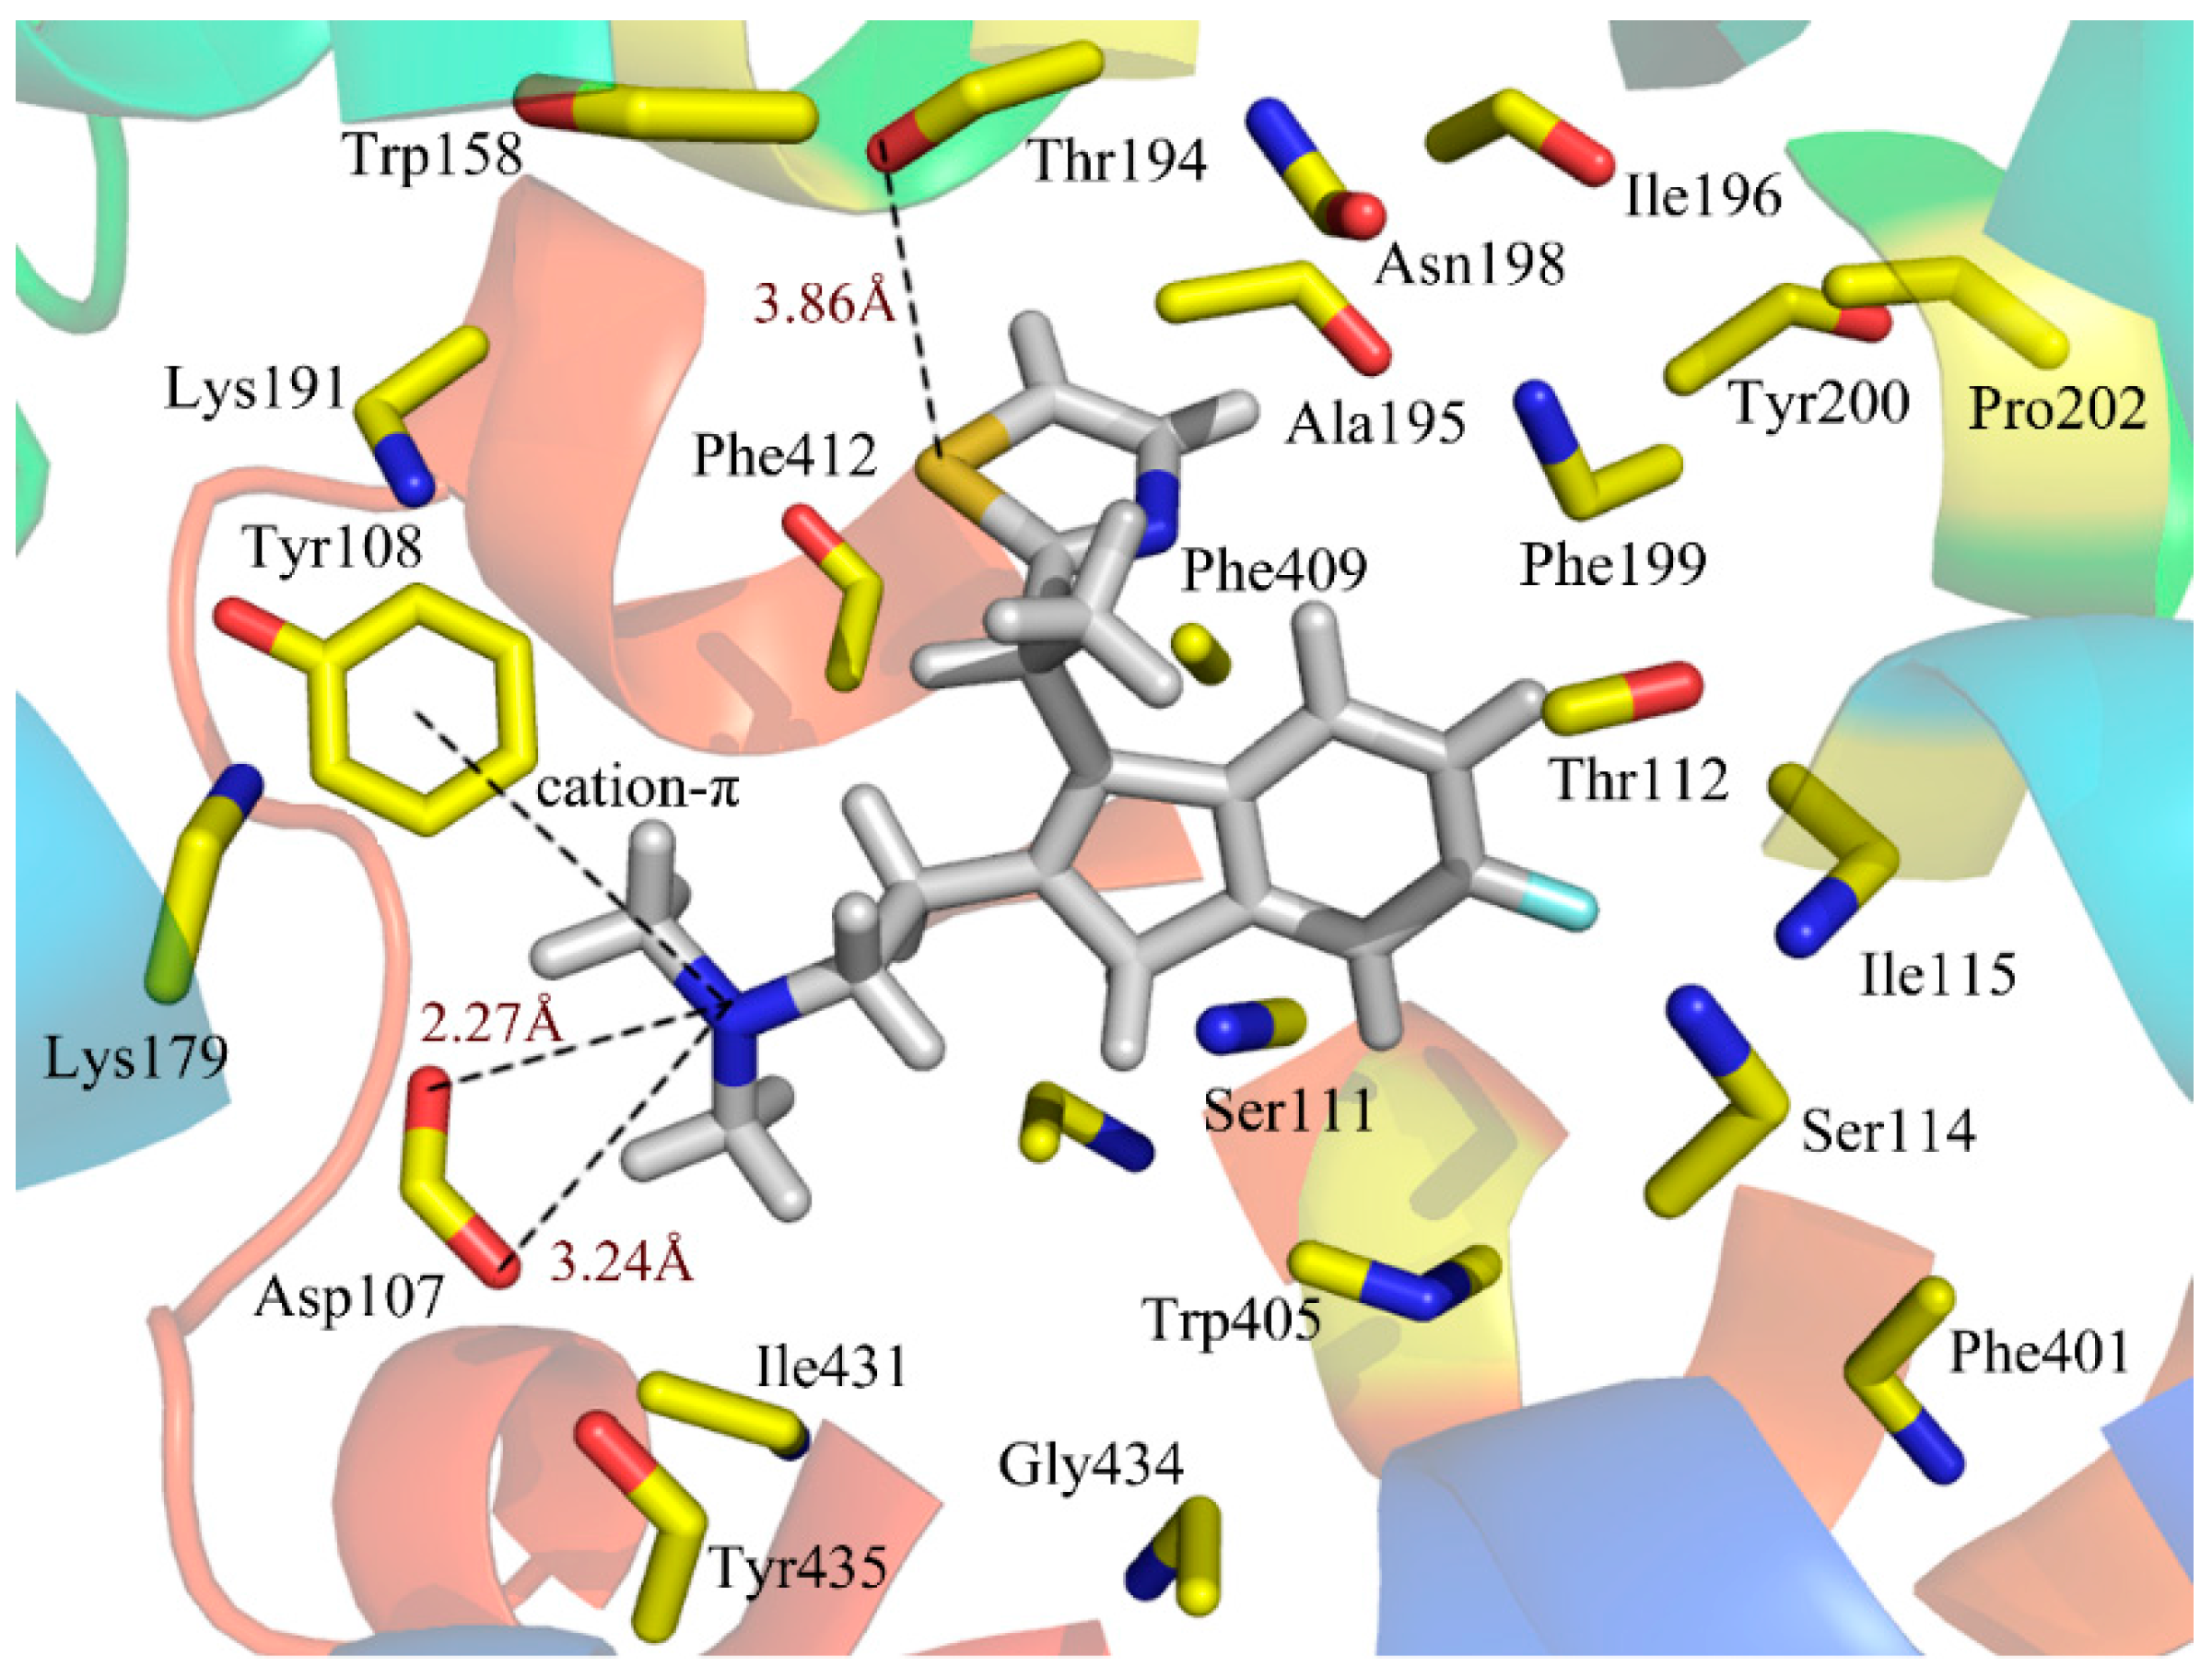
To see how an antagonist can anchor at the histamine H
1 receptor, we tried to dock antagonist into the binding cavity assigned by the compounds that affect histamine binding. We mainly concentrated on the relationships between the receptor and the ligand for the key structures of the most active compound 49.
Figure 5 illustrates the binding mode of compound 49 docked into the histamine H
1 receptor. The obtained binding conformation shows the main interactions with the receptor binding site. Obviously, it is observed that the lipophilic and hydrophobic interaction play important roles in the binding of the ligands to their target histamine H
1 receptor. As shown in
Figure 5, the thiazole ring can be seen among the lipophilic reciprocity scope of Trp158 and was away from Lys191 in the entrance of the active site [
37]. A lipophilic region with the Phe412, Tyr435 and Trp158 is distributed in favorable stations and participates in the ligand-receptor binding [
38]. In addition, the aromatic of compound 49 is surrounded by a hydrophobic region, including Phe409, Phe199, Phe401, Ala195, Tyr200, Pro202, Ile196 and Trp405, as well as a blend of hydrophilic amino acids Thr112 and Ser114. The mainly conserved residues were surrounded with compound 49 contain Ile115, Tyr435 and Gly434. The non-conserved residues Trp158 and Asn198 make little hydrophobic contribution to the ligand. All of these results match well with the docking results from the studies of Tatsuro
et al. [
37].
Figure 5.
Docked conformation of compound 49 into histamine H1 receptor. The projection highlights the structure of the active site with compound 49, which is displayed in sticks.
Figure 5.
Docked conformation of compound 49 into histamine H1 receptor. The projection highlights the structure of the active site with compound 49, which is displayed in sticks.
In addition to the interactions described above, H-bond interactions were also calculated in the docking study. Generally speaking, an H-acceptor distance less than 3.5 Å with a donor-H-acceptor angle larger than 120° is the geometric criterion for forming the H-bonds [
39]. An H-bond with a distance in the scope of 3.2 and 4.0 Å is considered a weak H-bond [
39]. According to
Figure 5, Asp107, a strictly-conserved residue in the histamine H
1-receptor, forms a salt bridge with the compound 49 (cationic nitrogen). It is also reported that this interaction plays an important role in forming the binding conformation [
40,
41,
42]. Moreover, this cationic nitrogen is engaged in the π-stacking with Tyr108, which is consistent with the studies of Wang
et al. [
43]. In addition, a strong H-bond was formed between the S atom of the thiazole and the Thr194 (–S···HO, 3.86Å), which firmly stabilizes the ligand-receptor binding interaction and makes the thiazole ring perfectly clamped with the ligand in the binding conformation. As a result, the conclusion can be safely drawn that the ligands adjusted to the lipophilic, hydrophobic, salt bridge and H-bond interactions would act as potential antagonists.
2.4. Comparing the Results of 3D Contour Maps with Docking
Figure 5 shows that the NCH
3CH
3 group and thiazole ring near the position-17 of compound 49 are located at the bottom, and the entry of this pocket is formed by the target protein interface, respectively. Especially, the thiazole ring occupies the most opened area of the entry. As seen from
Figure 3A, the bulky groups introduced into the field surrounding the NCH
3CH
3 group and the thiazole ring are favorable for improving the binding affinity with the protein, which coincide with this docking result. Moreover, the cavity seems deep enough to accommodate bulkier groups at the thiazole ring position, which would be conducive to the interactions with the protein. It is worth noting that electropositive residues Lys179 and Lys191 surrounding the position-15 suggest that electropositive substituents introduced into the antagonists are favorable for the ligand activity, the conclusion of which is in agreement with the CoMSIA electrostatic blue contour results (
Figure 3B). As shown in
Figure 3C, introduction of suitable electronegative groups into the NCH
3CH
3 group region would capture an additional interaction with Asp107, which is corroborated by the fact that this electronegative favorable area is surrounded by the red contour of the CoMSIA model. Therefore, the conclusion of the crucial interactions’ formation with the negatively-charged moieties of ligands is also inferred from the blue contour results by CoMSIA analysis.
The active site of the histamine H
1-receptor also reaches good agreement with the above hydrophobic contour maps of the CoMSIA model. The thiazole ring is tightly located next to a relatively large hydrophobic groove consisting of the hydrophobic residues Phe412, Phe409, Phe199, Trp158, Ala195 and Ile196. Remarkably, in this position, the space is large and open enough to hold a large hydrophobic group in the surface-exposed hydrophobic pocket, which coincides with the large hydrophobic contour map depicted in (
Figure 3C). Meanwhile, residues Gly434 and Ser111, hydrophilic in nature, around the NCH
3CH
3 moiety indicate that antagonists with hydrophilic substituents in this position may cause the reduction of the activity. These results are also explained by the previous hydrophilic contour maps of the CoMSIA model.
Consequently, according to the docking results, the steric, electrostatic and hydrophobic fields in the binding pocket of the histamine H1-receptor are without a doubt interrelated with the contour maps, revealing that the QSAR model is reliable and can provide better suggestions to help with potent H1 antagonists’ design.
2.5. MD Simulations
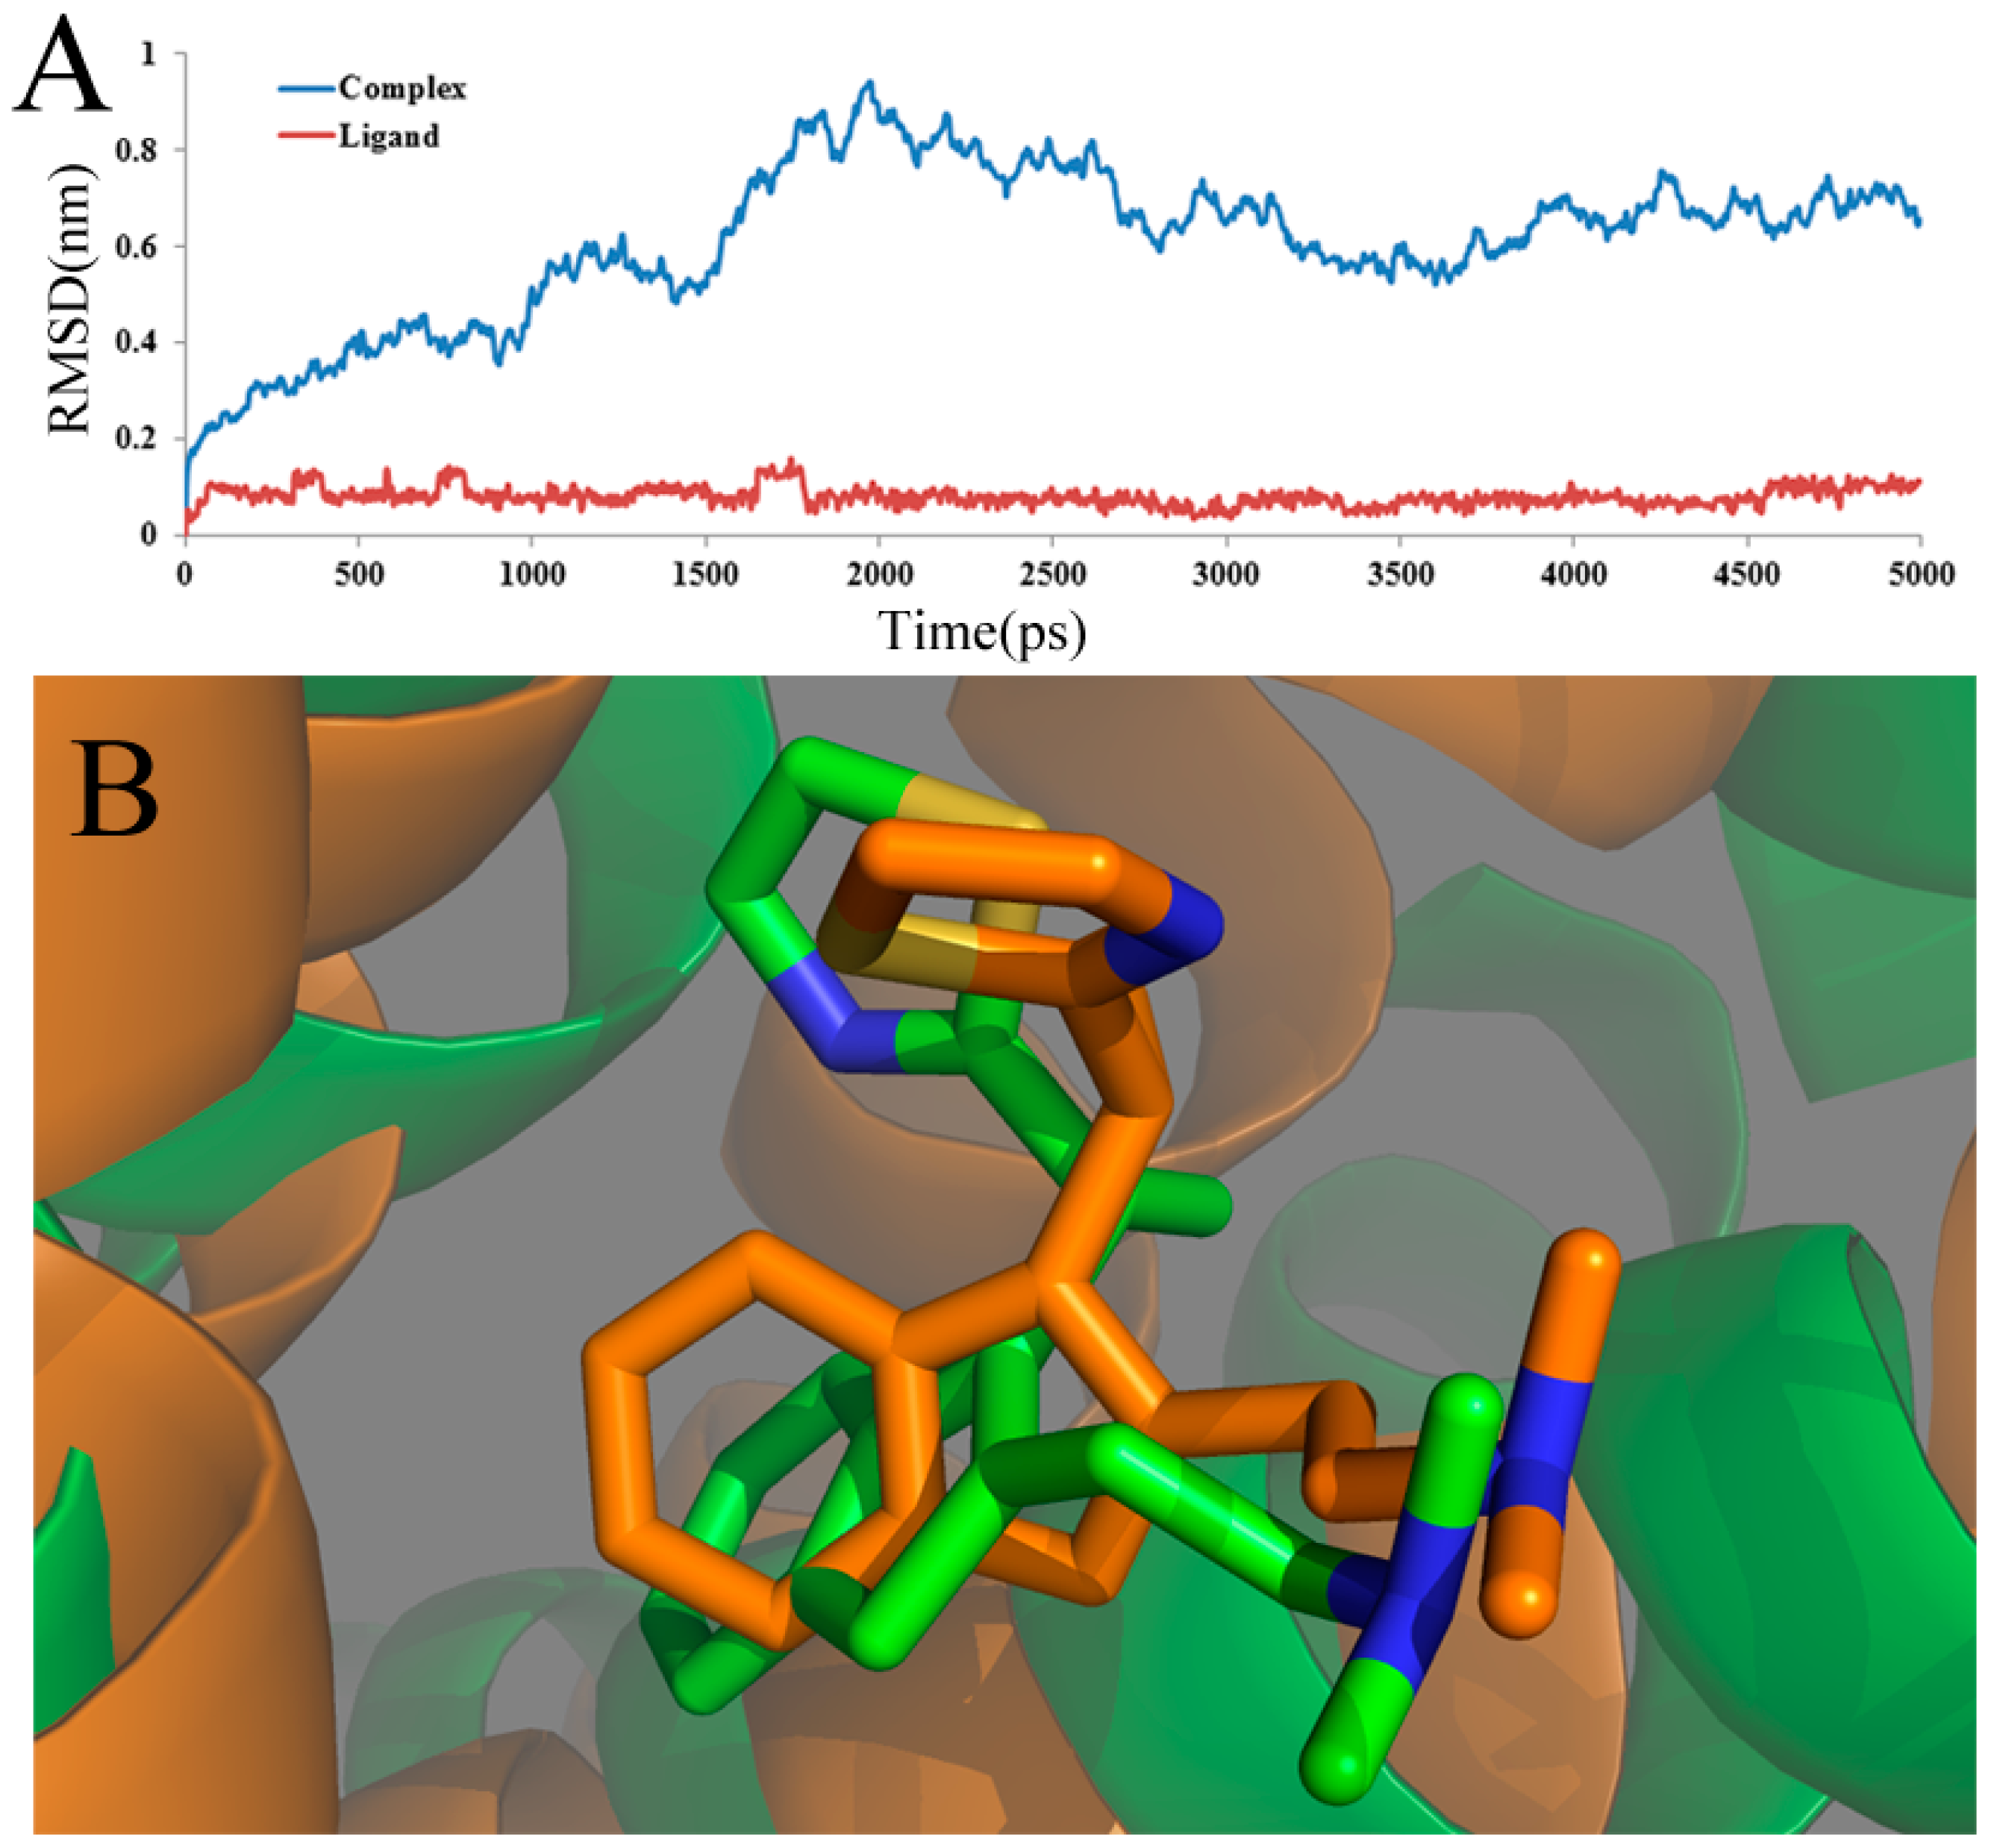
In a molecular docking simulation, the compound, the small molecule ligand, is considered to be the flexible body, while the receptor protein is taken as the rigid or partially-flexible one. Nevertheless, molecular dynamics analysis treats both the ligand and protein as elastic to provide an attractive alternative by structural refinement, in which the conformation is adjusted upon the ligand binding for the whole system. Generally, in an MD simulation, compared to using a single crystal structure, an average structure of the last 1 ns employed in the simulation is considered more reliable. In the present work, to further discover a dynamic plot of the conformation changes that happen in aqueous solution and both the ligand and receptor, a 5000-ps MD simulation was performed according to the docked complex, including the histamine H1-receptor and the most potent compound 49.
To ensure the dynamic stability and rationality of the chosen conformations, the root-mean-square deviation (RMSD) values of the atoms of the protein backbone were calculated. The structural drift from the initial coordinates, as well as the atomic fluctuation throughout the whole MD simulation process are measured directly by RMSD. The RMSD backbone atoms of the complex and ligand about the starting systems are summarized and shown in
Figure 6A. In this figure, until 1.2 ns, the ligand-receptor complex (blue line) shows a backbone RMSD of ∼0.2 to ∼0.6 nm during this part of the simulations. After 1.2 ns, the complex structure exhibits minimum deviation until the end of simulation, that is 3 ns with its backbone RMSD ranging from ∼0.6 to∼0.9 nm, whereas the ligand-receptor complex shows maximum deviation. After 3 ns, it is shown that the three-dimensional structures of the protein have no significant change, and the RMSD of the complex, reaching about 0.32 nm, remains stable over the simulation process. This stability clearly suggests that the docked complex structure is in a metastable conformation starting from 3 ns of simulation. What is more, after 3 ns, the RMSD of the ligand, shown as a red line, reaches a stable value (about 0.13 Å), revealing that the structure of the ligand is in a stable conformation after 3 ns of simulation. Overall, low RMSD values over time for the complex and ligand imply the stability of the structure over time and, thus, the overall accuracy of the topology.
Figure 6.
(A) Plot of the root-mean-square deviation (RMSD) of docked complex/ligand versus the MD simulation time in the MD-simulated structures; (B) view of the superimposed backbone atoms of the average structure for the MD simulations and the initial structure of the docking for the complex. Compound 49 is represented as a carbon-chain in green for the initial complex and a carbon-chain in orange for the average structure, respectively.
Furthermore, the superimposed result of the initial docked structure and the last 1 ns average MD simulated structure are shown in
Figure 6B, where the initial docked complex structure is displayed as a green line, and the average structure of simulation is displayed as an orange line. Additionally, the green and orange sticks represent the original and the final average structures of the ligand, respectively. Clearly, it is found that that docked complex of the most active compound 49 shows more consistency in conformation as deduced from the low deviation in the RMSD after a certain time during the MD simulation study.
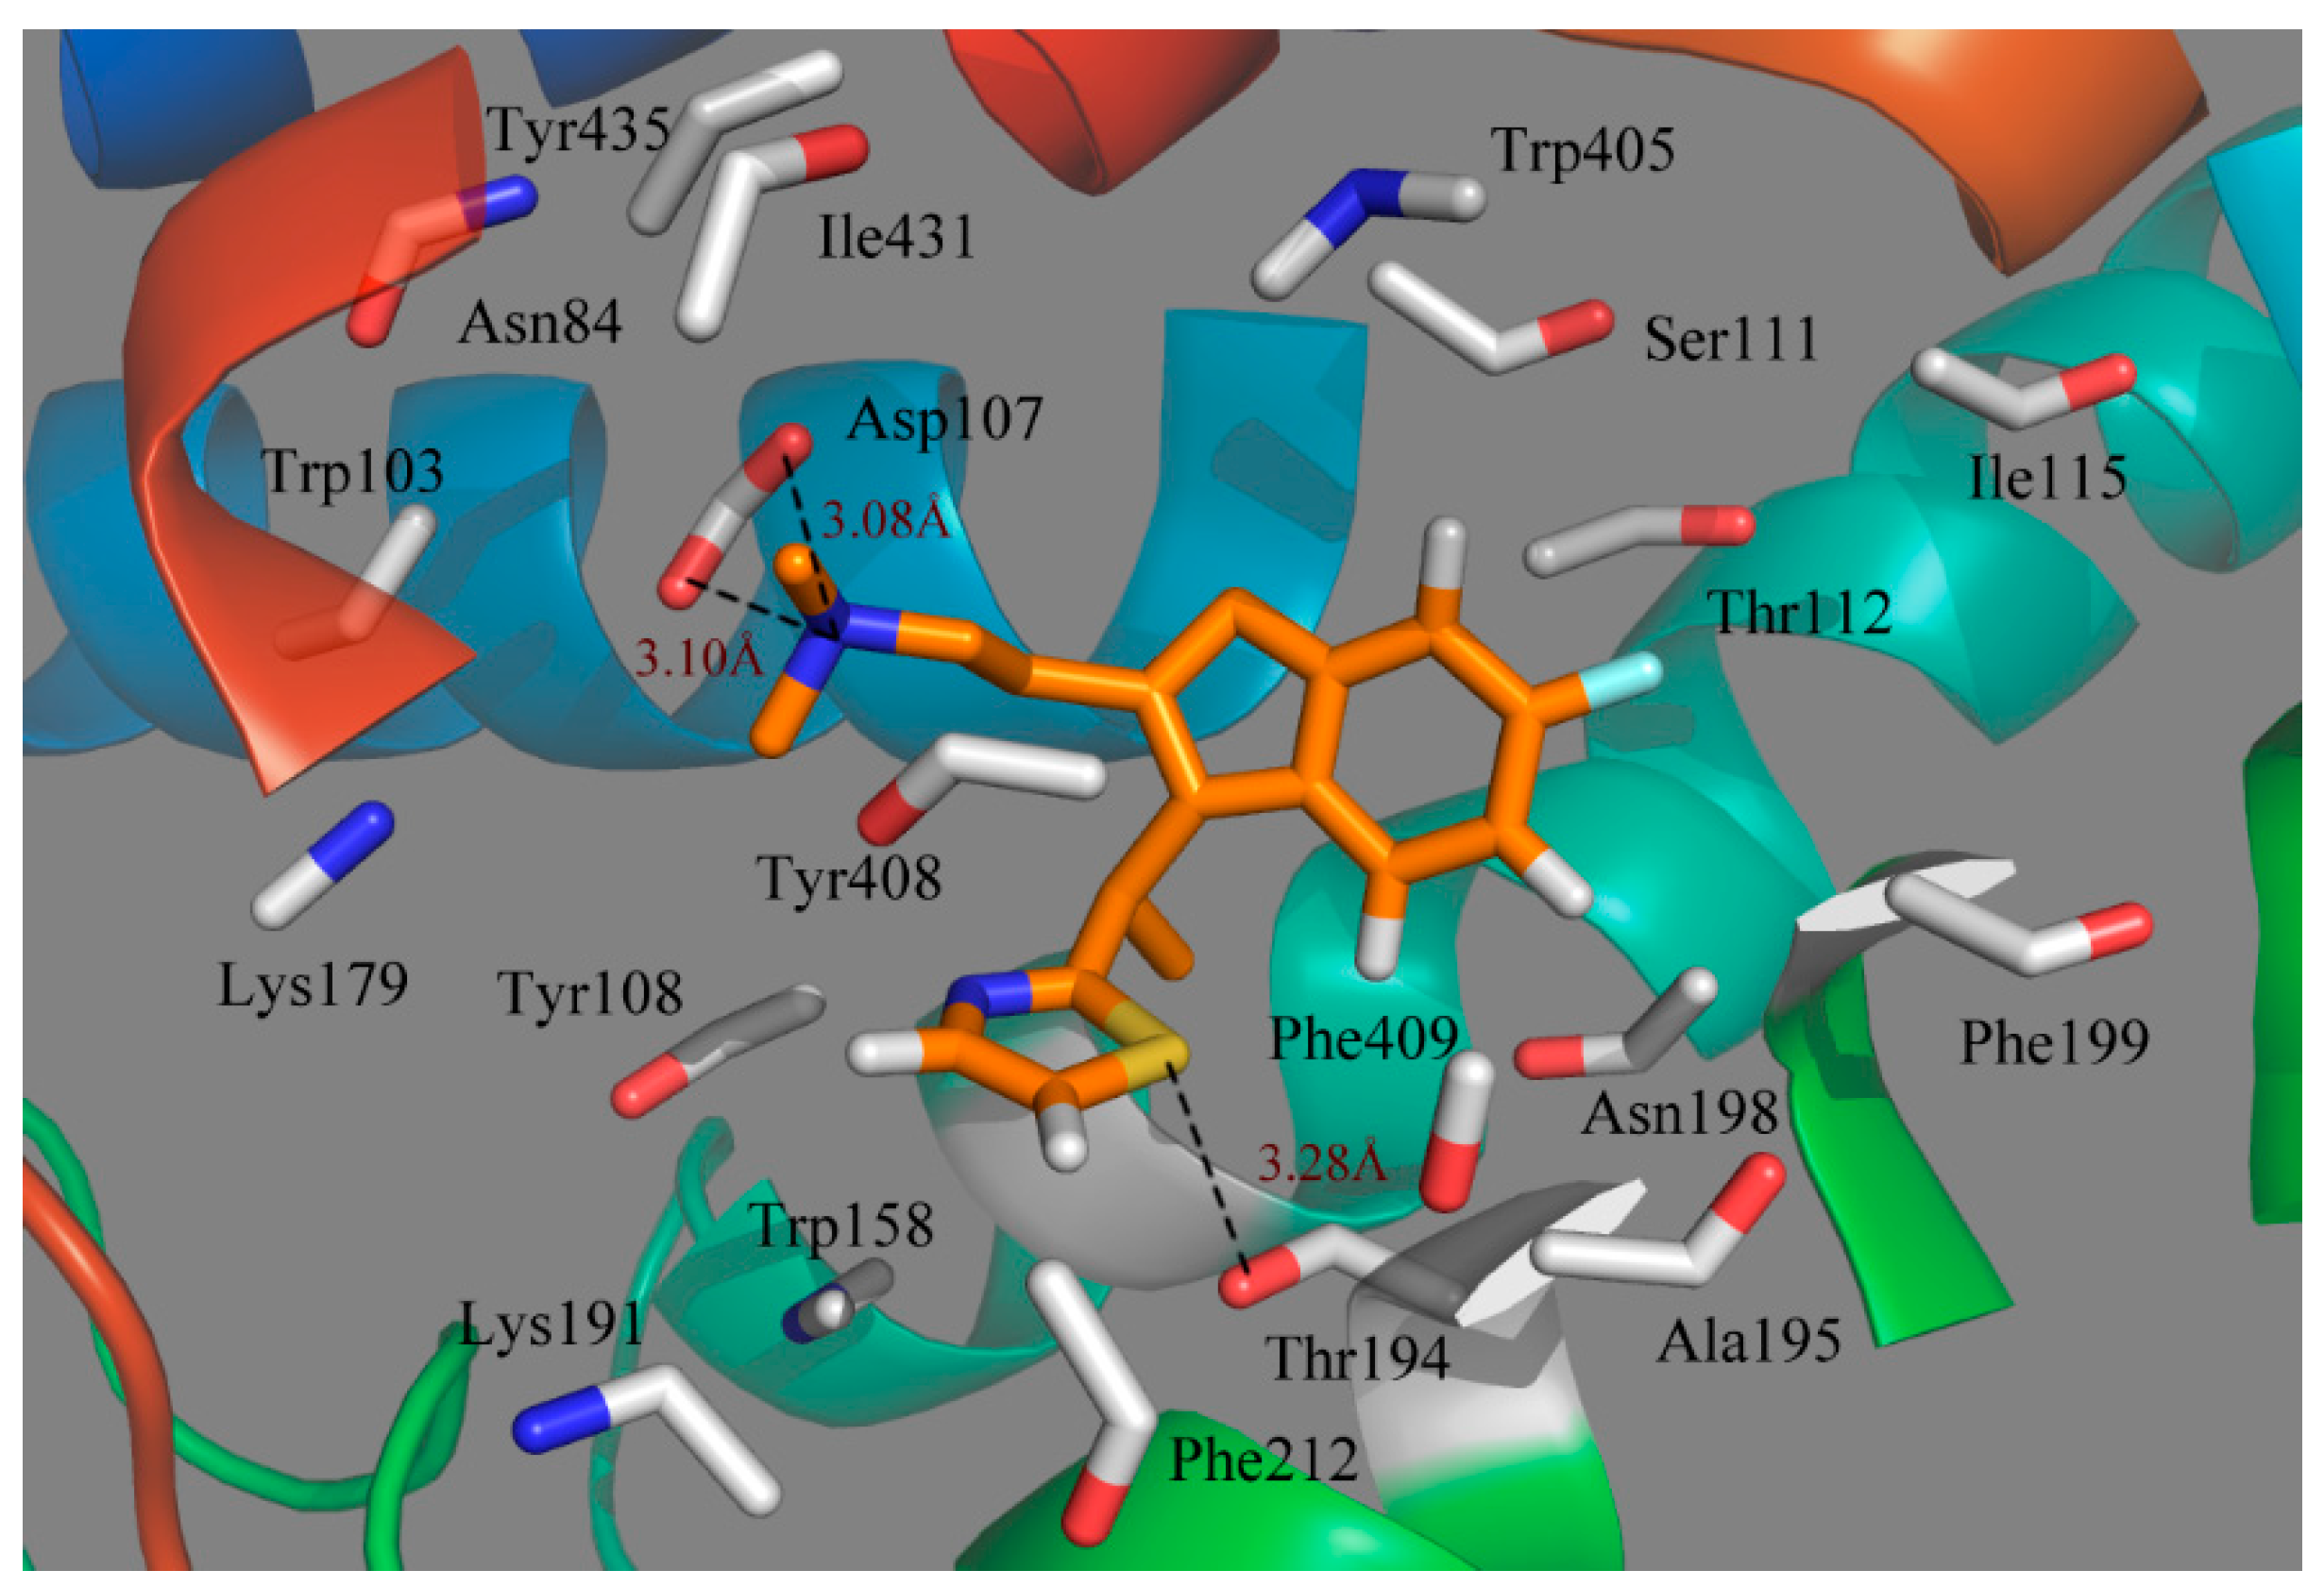
Obviously, it is seen from the MD simulations with docked compound 49 in the histamine H
1-receptor that the binding pocket interacting with the ligand is straight through the entire receptor (
Figure 7). It is clearly observed that the most active compound 49 interacts with the active site of histamine H
1 through an extensive hydrophobic region, including mainly the following residues: Tyr108, Tyr408, Trp158, Phe212, Phe409, Ala195, Phe199, Ile115, Ile431 and Trp405; while a mixture of hydrophilic amino acids Thr194, Thr112, Ser111 and Asn84 form the other side; thus, hydrophobic groups would benefit from the potency. In addition, Trp158 and Tyr435 are also located at a favorable region to form a lipophilic cavity and contribute to the binding between the antagonist and protein [
38]. As seen from
Figure 7, most of the key amino acids in the range of a 4.5 Å distance from the ligand on the basis of the average MD simulated complex structure are very similar to those obtained from the docking results.
Figure 7.
Plot of the MD-simulated structures of the binding site with compound 49. H-bonds are shown as dotted black lines; amino acid residues in the active site are represented as sticks.
Figure 7.
Plot of the MD-simulated structures of the binding site with compound 49. H-bonds are shown as dotted black lines; amino acid residues in the active site are represented as sticks.
Due to the molecular dynamics in the binding process, some atoms of the ligand and the protein move closer to each other, revealing the hydrogen bindings during the MD simulation course. As seen from
Figure 7, the strictly conserved residue Asp107 forms an ionic interaction,
i.e., the so-called salt bridge, with the cationic nitrogen on the side chain of the ligand in both the docking and MD simulations, which contributed much to the ligand–receptor binding. Compound 49 also exhibits a strong binding affinity through H-bond interaction with the residue of Thr194, stabilizing the ligand at the binding pocket. Due to the rotations of the NCH
3CH
3 group of the ligand, the π-stacking interaction with Tyr108 is broken after MD simulations. However, at the end of the MD simulation, the observed residues suggest that the ligand moves much closer in toward the residues in the active pocket and then extends deeper into the cavity.
Actually, it is found that the MD simulation could also remedy the deficiencies from molecular docking through investigating some differences between the molecular docking and the MD simulation results.
4. Conclusions
In the present work, using a combined computational method containing molecular docking, MD simulations and 3D-QSAR techniques, an attempt has been made to profile the structural determinants of H1-antihistamines for the treatment of insomnia. The combined analysis has generated a satisfactory CoMSIA model (Q2 = 0.525, R2ncv = 0.891, R2pred = 0.807), presenting both significant internal and external predictive capability. The contour maps generated may show a good guide for designing novel compounds with high antagonism activity. Moreover, the results derived from molecular docking and MD simulation give a detailed understanding of the binding mode of the ligands to the receptors and confirmed the key interaction features, key residues in the binding pockets.
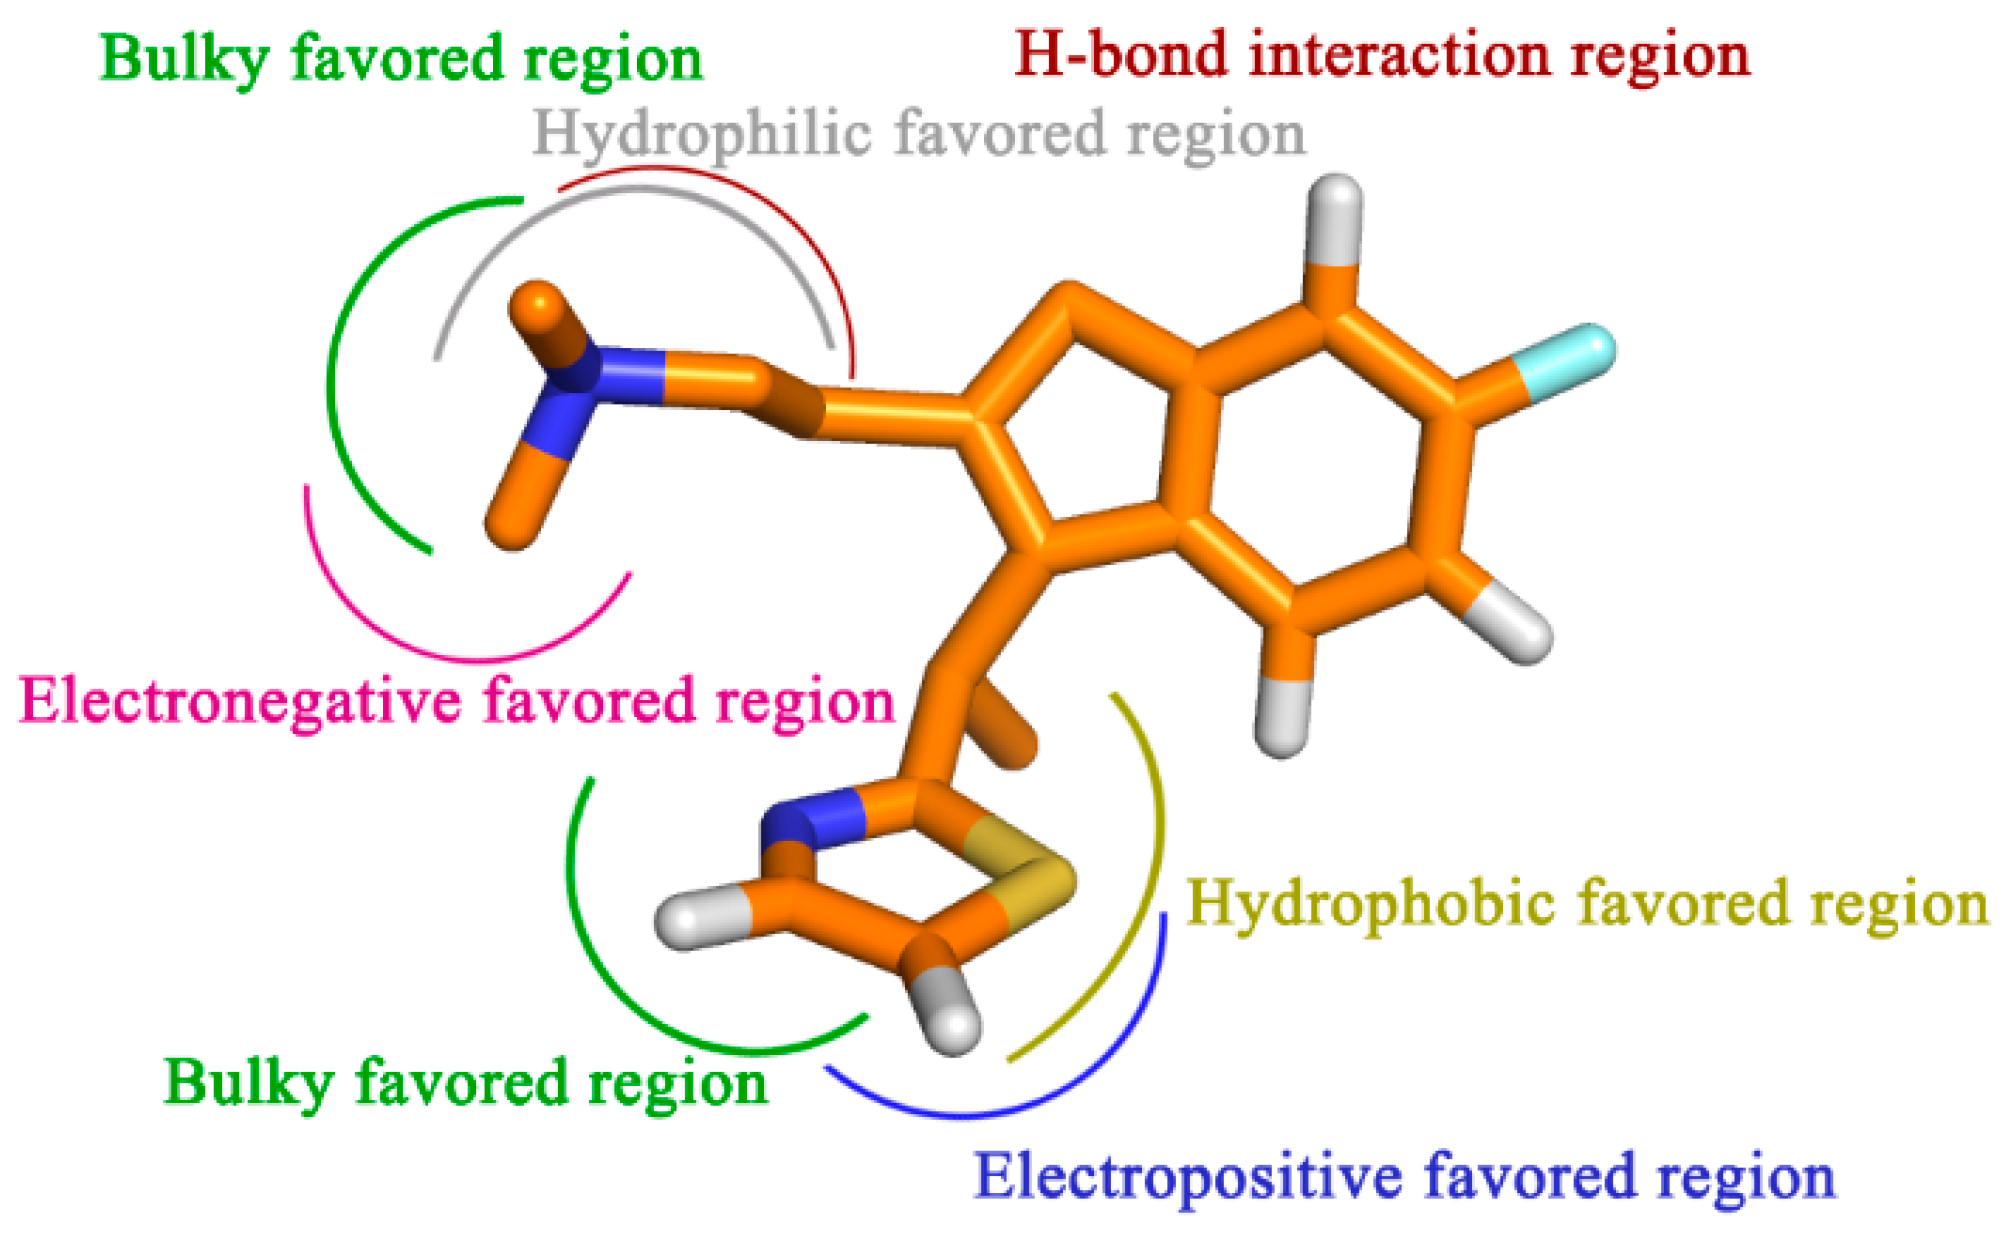
To sum up, by the incorporation of steric, electrostatic and hydrophobic together with HB donor groups, the information obtained from this study displays the key structural features that impact the bioactivity (
Figure 9). All of the results are expected to help us to better interpret the structure-activity relationship of the H
1-antihistamines and to give important information for aid in the design of novel potent compounds in the future.
Figure 9.
Proposed hypothetical histamine H1-receptor active site models. The structure-activity relationship is taken from the results of 3D-QSAR, docking and MD simulation studies for compound 49.
Figure 9.
Proposed hypothetical histamine H1-receptor active site models. The structure-activity relationship is taken from the results of 3D-QSAR, docking and MD simulation studies for compound 49.


