Article

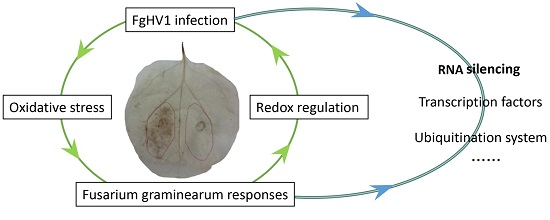
Transcriptome-Based Discovery of Fusarium graminearum Stress Responses to FgHV1 Infection

1
State Key Laboratory for Biology of Plant Disease and Insect Pests, Institute of Plant Protection, Chinese Academy of Agricultural Science, Beijing 100081, China
2
Walloon Centre of Industrial Biology, Gembloux Agro-Bio Tech, University of Liège, Passage des Déportés, 2, Gembloux 5030, Belgium
*
Author to whom correspondence should be addressed.
These authors contributed equally to this work.
Int. J. Mol. Sci. 2016, 17(11), 1922; https://0-doi-org.brum.beds.ac.uk/10.3390/ijms17111922
Submission received: 12 September 2016 / Revised: 25 October 2016 / Accepted: 11 November 2016 / Published: 17 November 2016
(This article belongs to the Special Issue Host-Microbe Interaction)

Abstract

:
Fusarium graminearum hypovirus 1 (FgHV1), which is phylogenetically related to Cryphonectria hypovirus 1 (CHV1), is a virus in the family Hypoviridae that infects the plant pathogenic fungus F. graminearum. Although hypovirus FgHV1 infection does not attenuate the virulence of the host (hypovirulence), it results in defects in mycelial growth and spore production. We now report that the vertical transmission rate of FgHV1 through asexual spores reached 100%. Using RNA deep sequencing, we performed genome-wide expression analysis to reveal phenotype-related genes with expression changes in response to FgHV1 infection. A total of 378 genes were differentially expressed, suggesting that hypovirus infection causes a significant alteration of fungal gene expression. Nearly two times as many genes were up-regulated as were down-regulated. A differentially expressed gene enrichment analysis identified a number of important pathways. Metabolic processes, the ubiquitination system, and especially cellular redox regulation were the most affected categories in F. graminearum challenged with FgHV1. The p20, encoded by FgHV1 could induce H2O2 accumulation and hypersensitive response in Nicotiana benthamiana leaves. Moreover, hypovirus FgHV1 may regulate transcription factors and trigger the RNA silencing pathway in F. graminearum.

Graphical Abstract

1. Introduction

Fungal viruses, which are referred to as mycoviruses, have been discovered throughout the kingdom of fungi. Most mycoviruses develop a co-existent relationship with their host. In many cases, mycovirus infection is not associated with host phenotypic changes (asymptomatic infections). Interestingly, the capacity of the fungus Curvularia protuberata to confer heat tolerance to its host plant, Dichanthelium lanuginosum, is related to the presence of the mycovirus Curvularia thermal tolerance virus (CThTV) in a three-way symbiosis that is required for thermal tolerance [1]. However, some mycoviruses, such as Cryphonectria parasitica hypovirus 1 (CHV1) and Fusarium graminearum virus 1 (FgV1), cause severe phenotypic alterations, including inhibition of sexual development, defects in pigment production, and reductions in growth rates and virulence [2,3]. Mycoviruses are attracting attention in the study of fundamental fungal cellular processes due to their critical effects and the interactions between pathogenic fungi and viruses.
F. graminearum causes a destructive disease called Fusarium head blight in wheat and other cereal grains. In addition to reduced grain yield, Fusarium species-infected crops are contaminated with mycotoxins, such as trichothecenes and zearalenone, which make the infected grain toxic to human and animal consumers [4]. In addition, the genome of the F. graminearum strain PH-1 was sequenced and published in 2003 by the Whitehead Institute, Center for Genome Research (Cambridge, MA, USA). It contains a total of 13,322 genes with a length of 17,842,161 bp and will provide the fundamental genetic information necessary for pathogenicity studies [5]. Several mycoviruses, including FgV1, F. graminearum virus 2 (FgV2), F. graminearum virus 3 (FgV3), F. graminearum virus 4 (FgV4), F. graminearum hypovirus 1 (FgHV1), F. graminearum hypovirus 2 (FgHV2), Fusarium graminearum mycotymovirus 1 (FgMTV1), Fusarium poae dsRNA virus 2 (FpV2), Fusarium poae dsRNA virus 3 (FpV3), and Fusarium graminearum deltaflexivirus 1 (FgDFV1) have been identified from isolates of F. graminearum [3,6,7,8,9,10,11].
Infection with some hypoviruses affects fungal virulence or other phenotypes, including colony morphology, sporulation, and growth rates [12]. Previous studies have demonstrated that host fungal virulence is dramatically reduced during hypovirus CHV1-EP713 and CHV2-NB58 infections [2,13]. FgHV1 is a member of the Hypoviridae family, a group of positive-strand RNA viruses. Although FgHV1 is closely related to CHV1 and CHV2, the virulence of F. graminearum is not impacted by FgHV1 infection. But FgHV1 infection caused reduction of growth rates and spore production [7]. These joint effects of FgHV1 must be important for its co-existent relationship with F. graminearum.
Hypovirus-infected C. parasitica serves as a good model for exploring changes in transcript accumulation during fungi-virus interactions. Gene expression differences between hypovirus-infected C. parasitica and an isogenic virus-free strain have been examined using mRNA differential display technology [14]. With a robust microarray platform for C. parasitica, comparisons of transcript accumulation in hosts infected with the severe hypovirus CHV1-EP713 and the mild CHV1-Euro7, both of which belong to the family Hypoviridae, were also performed [15]. Although CHV1-Euro7 shares a high level of sequence identity at both the nucleotide (87% to 93%) and the amino acid (90% to 98%) levels with CHV1-EP713, significant differences in the C. parasitica transcriptome were observed. Based on the application of next-generation sequencing technology, Lee et al. recently reported transcriptional changes following the infection of F. graminearum with four mycoviruses from four different families [16]. There has been extensive research on the gene expression changes that occur in C. parasitica infected with hypoviruses such as CHV1/EP713 and CHV1-Euro7 compared with the wild-type strain. However, there are no reports on the changes in transcript accumulation in hypovirus-infected F. graminearum. To address this deficiency, we performed a genome-wide transcriptome analysis of F. graminearum in response to FgHV1 infection using RNA-seq to identify differentially expressed genes. The transcriptome analysis of virus-infected fungi will help elucidate the genes regulated by hypovirus infection that are involved in growth, development, and stress responses and direct further studies into the interactions between pathogenic fungi and viruses.

2. Results

2.1. FgHV1 Was Transmitted to All F. graminearum Asexual Spores

Mycoviruses are transmitted in two ways, horizontal and vertical transmission. Vertical transmission by sporulation is a primary means of mycovirus spread. As we described previously, there was about a 28% reduction in conidia production resulting from the FgHV1-infection. Asexual spores are produced from modified fungi hyphae whose growth rate was slightly reduced by FgHV1. Based on the above-mentioned factors, we are quite curious about whether FgHV1 can be transmitted to the asexual spores through the cytoplasm as the spores develop. To assay vertical transmission of the virus through the conidia, we tested more than 96 conidia for the presence of virus using northern dot blots with FgHV1 genome-specific digoxigenin (DIG)-labeled probes as we described. As Figure 1 showed, dot blot hybridization indicated that all conidia tested were infected with FgHV1. Although FgHV1 caused asexual spore production reduction, asexual spores still acted as a primary means for FgHV1 transmission in F. graminearum.

2.2. Illumina RNA-Seq and Overall Transcriptional Profiles in F. graminearum in the Presence of FgHV1

To elucidatee the molecular networks that caused the phenotypic alterations in F. graminearum, the transcriptional response of F. graminearum to hypovirus FgHV1 infection was examined using RNA-seq. We harvested mycelia from two isogenic strains after four days of culture and extracted total RNA. cDNA libraries were constructed and sequenced using the Illumina HiSeq™ 2000 platform (BGI, Shenzhen, China), as described in the Materials and Methods. On average, 53,577,329 Illumina raw reads were generated for each sample (Table 1). After removing adaptor sequences, ambiguous nucleotides, and low-quality sequences, an average of 49,940,923 clean reads were obtained for every sample. The obtained reads were mapped to the reference sequence of the F. graminearum strain PH-1 using SOAPaligner/SOAP2. The genome mapping rates for reads from the virus-infected and virus-free libraries were 84% and 83%, respectively, on average. We also aligned the reads to the FgHV1 genome and assembled the reads into transcripts using TopHat and Cufflinks. Differentially expressed genes (DEGs) were identified using Cuffdiff implemented in Cufflinks. The Fragments Per Kilobase of exon per Million reads mapped (FPKMs) were used to calculate the expression level of each gene. The resulting Pearson’s correlation coefficients (R = 0.97) between the replicates for virus-infected and virus-free samples were significant (Figure S1). Differential expression analysis was first performed based on a two-fold change threshold for expression relative to the virus-free sample and a false discovery rate (FDR) < 0.05 or a p-value < 0.05. A total of 378 genes were differentially expressed (Table S1). In this study, DEGs showing higher expression levels in virus-infected samples (Group 1) than in virus-free samples (Group 2) were considered ‘up-regulated’, while those with lower expression levels in Group 1 were considered ‘down-regulated’. As shown in Figure 2, among these DEGs, 248 genes were up-regulated, and 130 genes were down-regulated. In addition, the FgHV1-encoded ORF A and ORF B transcripts were highly expressed in the FgHV1-infected F. graminearum strain, whereas no mRNAs from either ORF A or ORF B were detected in the virus-free strain. This result also confirmed the absence of FgHV1 in the virus-free strain HN10-11F.

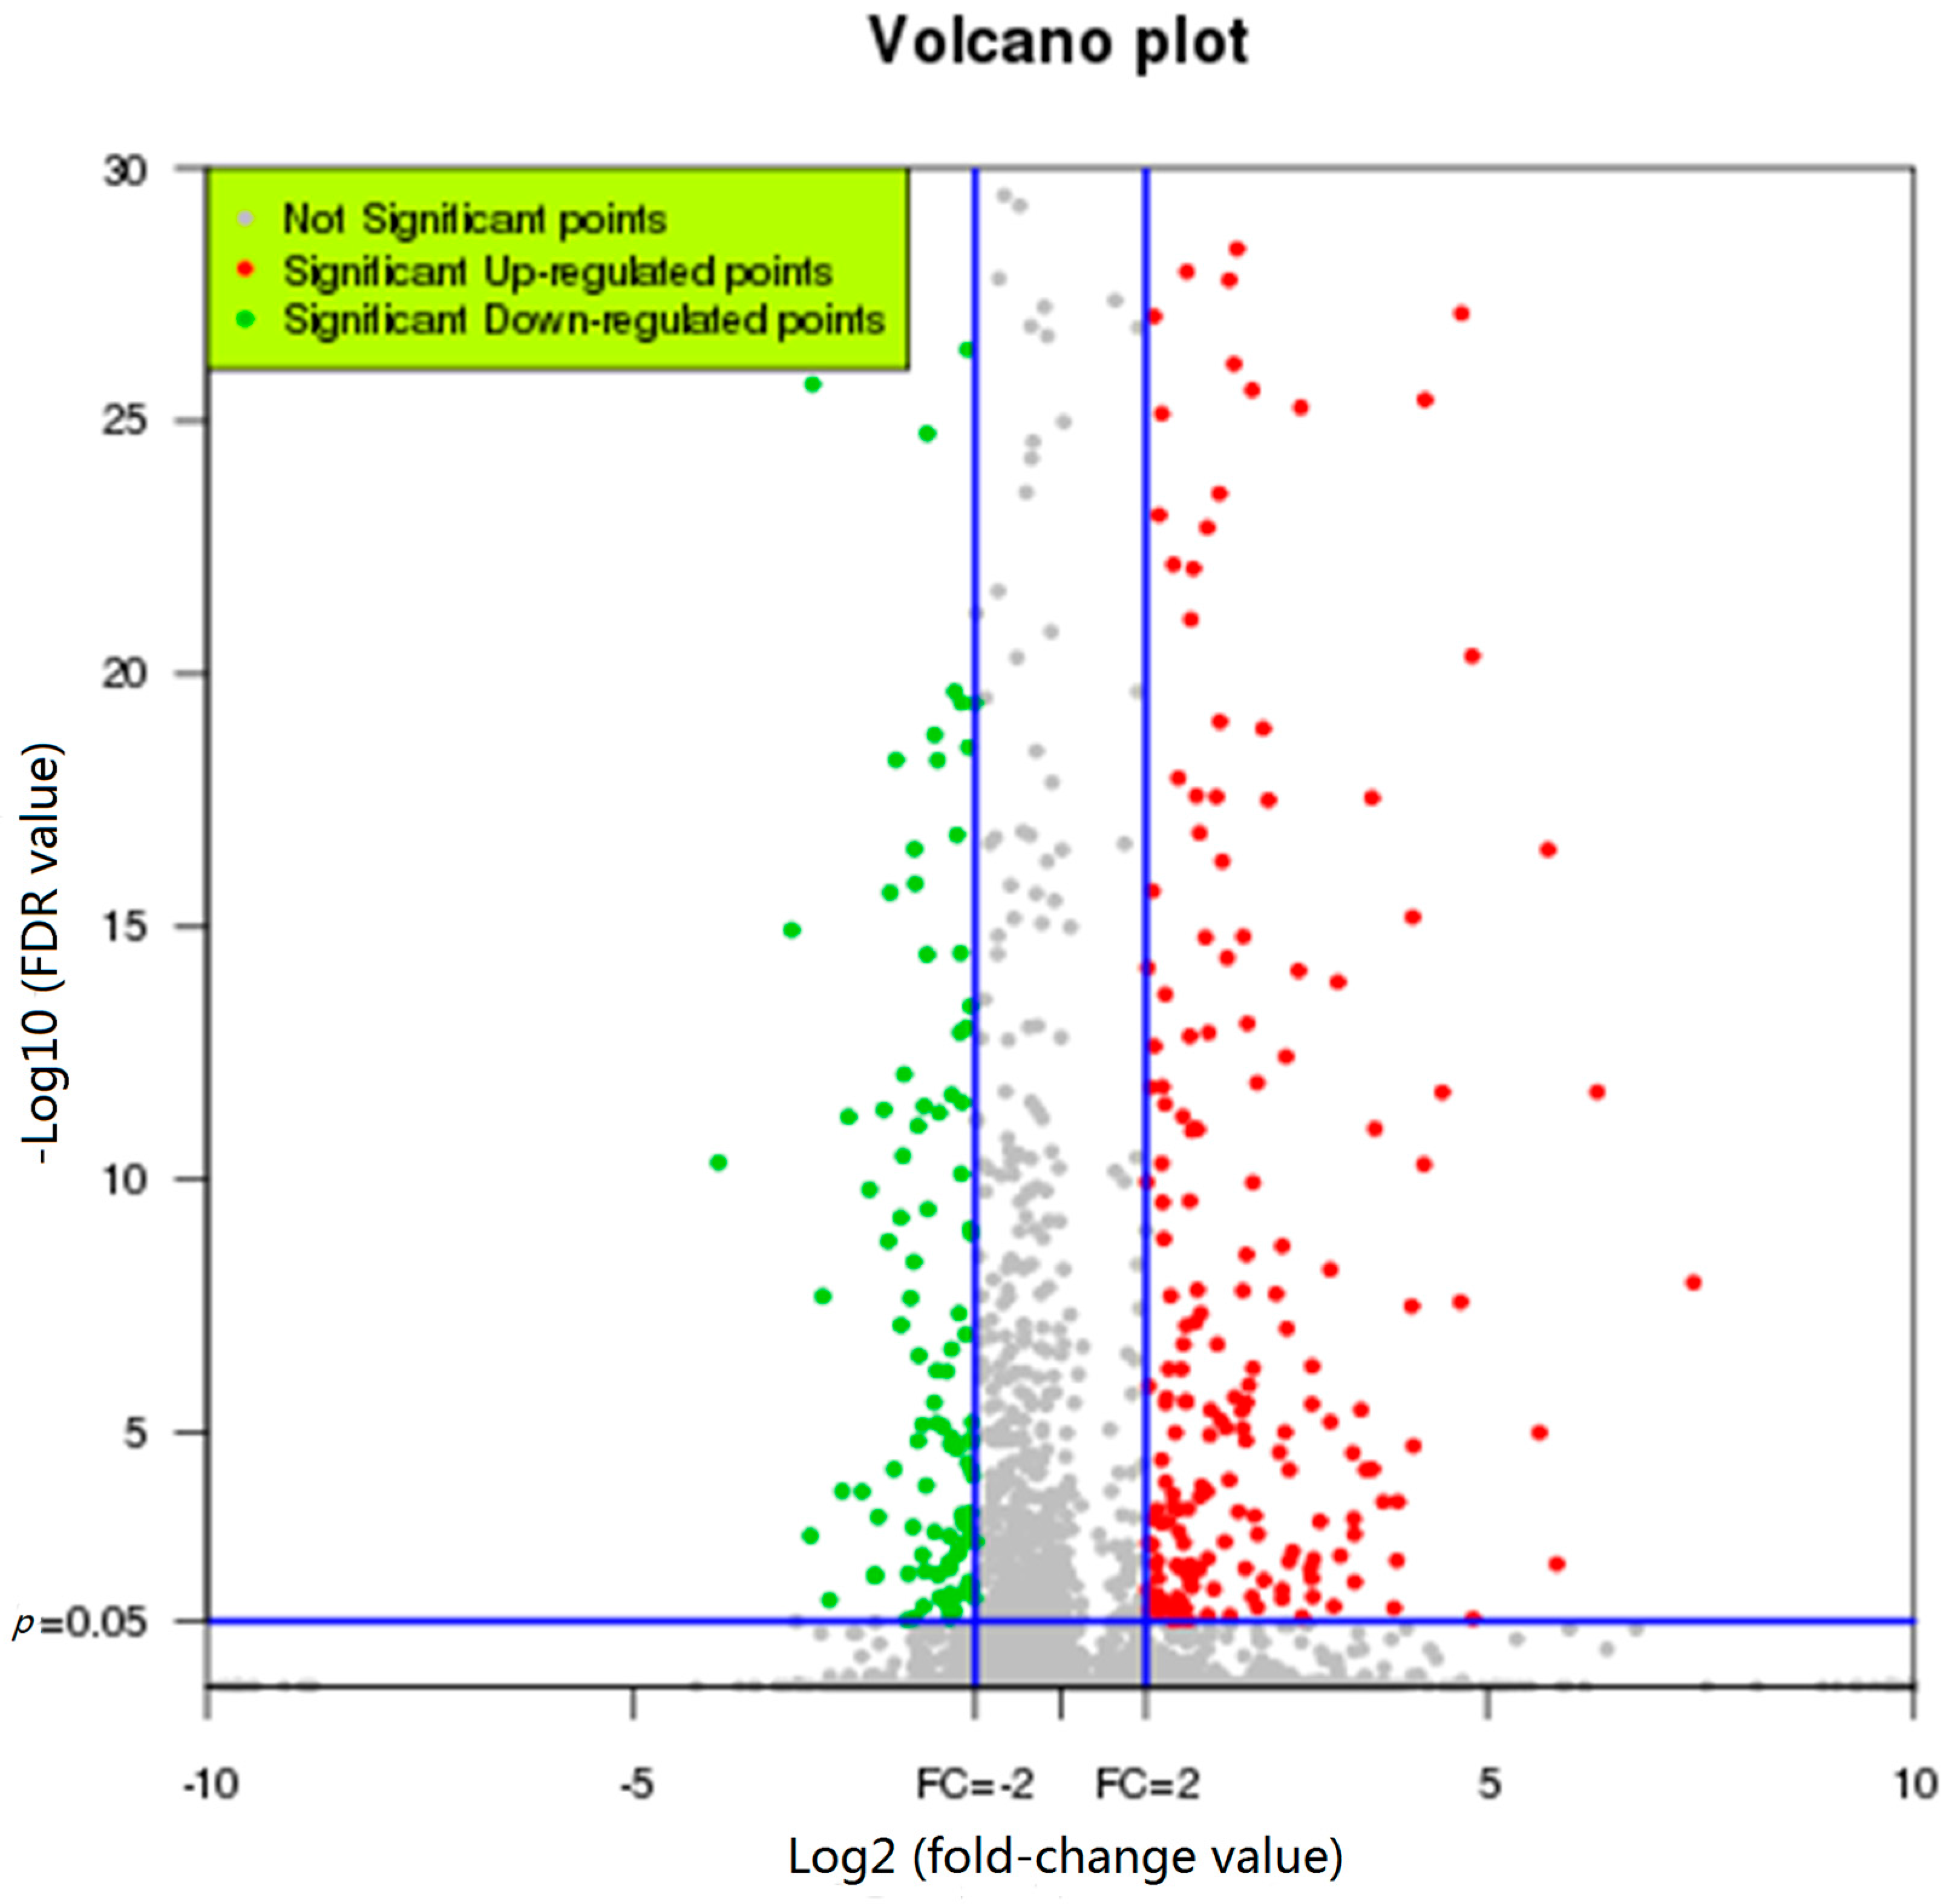
2.3. Representative Transcripts with Significant Changes in Expression in Response to FgHV1 Infection

To determine the mostly highly affected transcripts, the top 20 downre-gulated and up-regulated genes with the highest fold changes were analyzed (Table 2). We searched the Fusarium comparative database and the NCBI database for these genes. Unfortunately, not all of these genes were annotated, and most of them encoded hypothetical proteins with conserved domains. Among these genes, several associated with the fungal trichothecene efflux pump (TRI12), alcohol dehydrogenase, cytochrome P450 oxidoreductase, the major facilitator superfamily (MFS) transporter, and the ATP-binding cassette (ABC) transporters were strongly down-regulated. Genes encoding glutathione-dependent formaldehyde-activating enzyme, endoribonuclease L-PSP, and an SRR1 family member were strongly activated. Lee et al. identified 12 common DEGs in F. graminearum following infection with four mycoviruses, FgV1, FgV2, FgV3 and FgV4 [16]. Among these genes, FGSG_00878 and FGSG_07582 were also differentially expressed in the presence of FgHV1, showing down-regulation. FGSG_00878 encodes a hypothetical protein of unknown function, while FGSG_07582 belongs to the MFS. The MFS transporters are single-polypeptide secondary carriers capable of transporting small solutes and might be involved in mycovirus recognition and the stress response in F. graminearum.

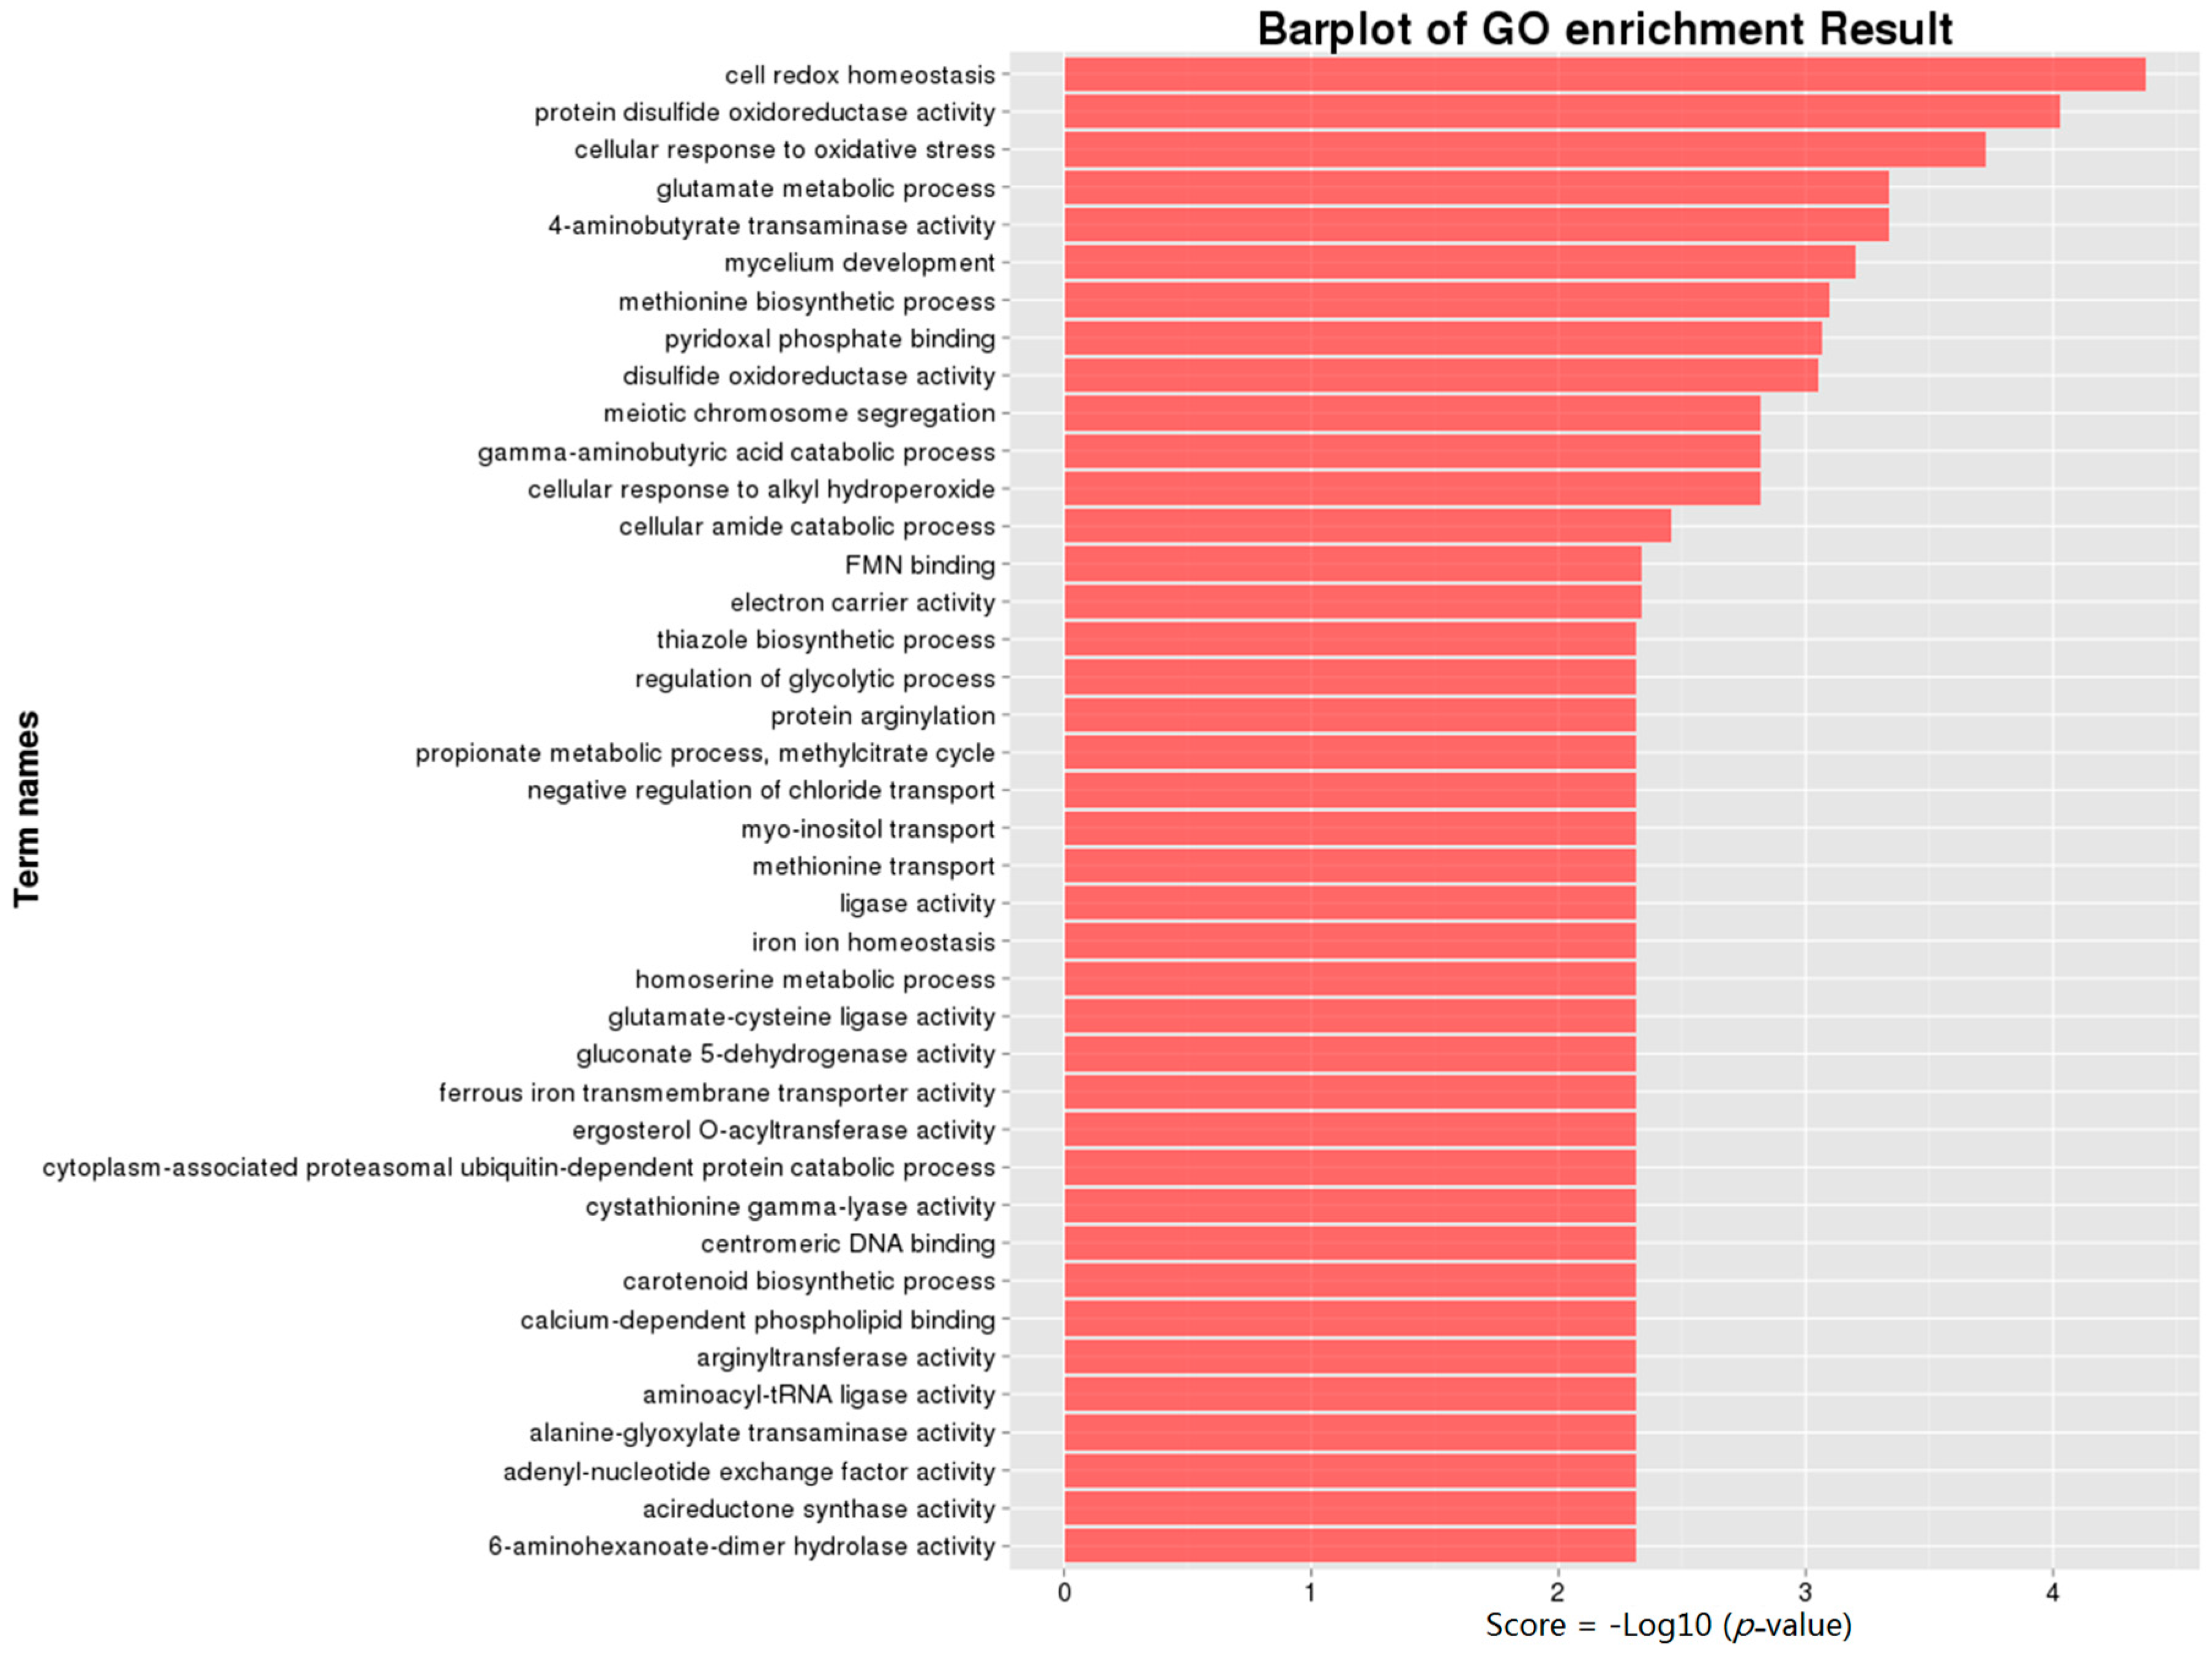
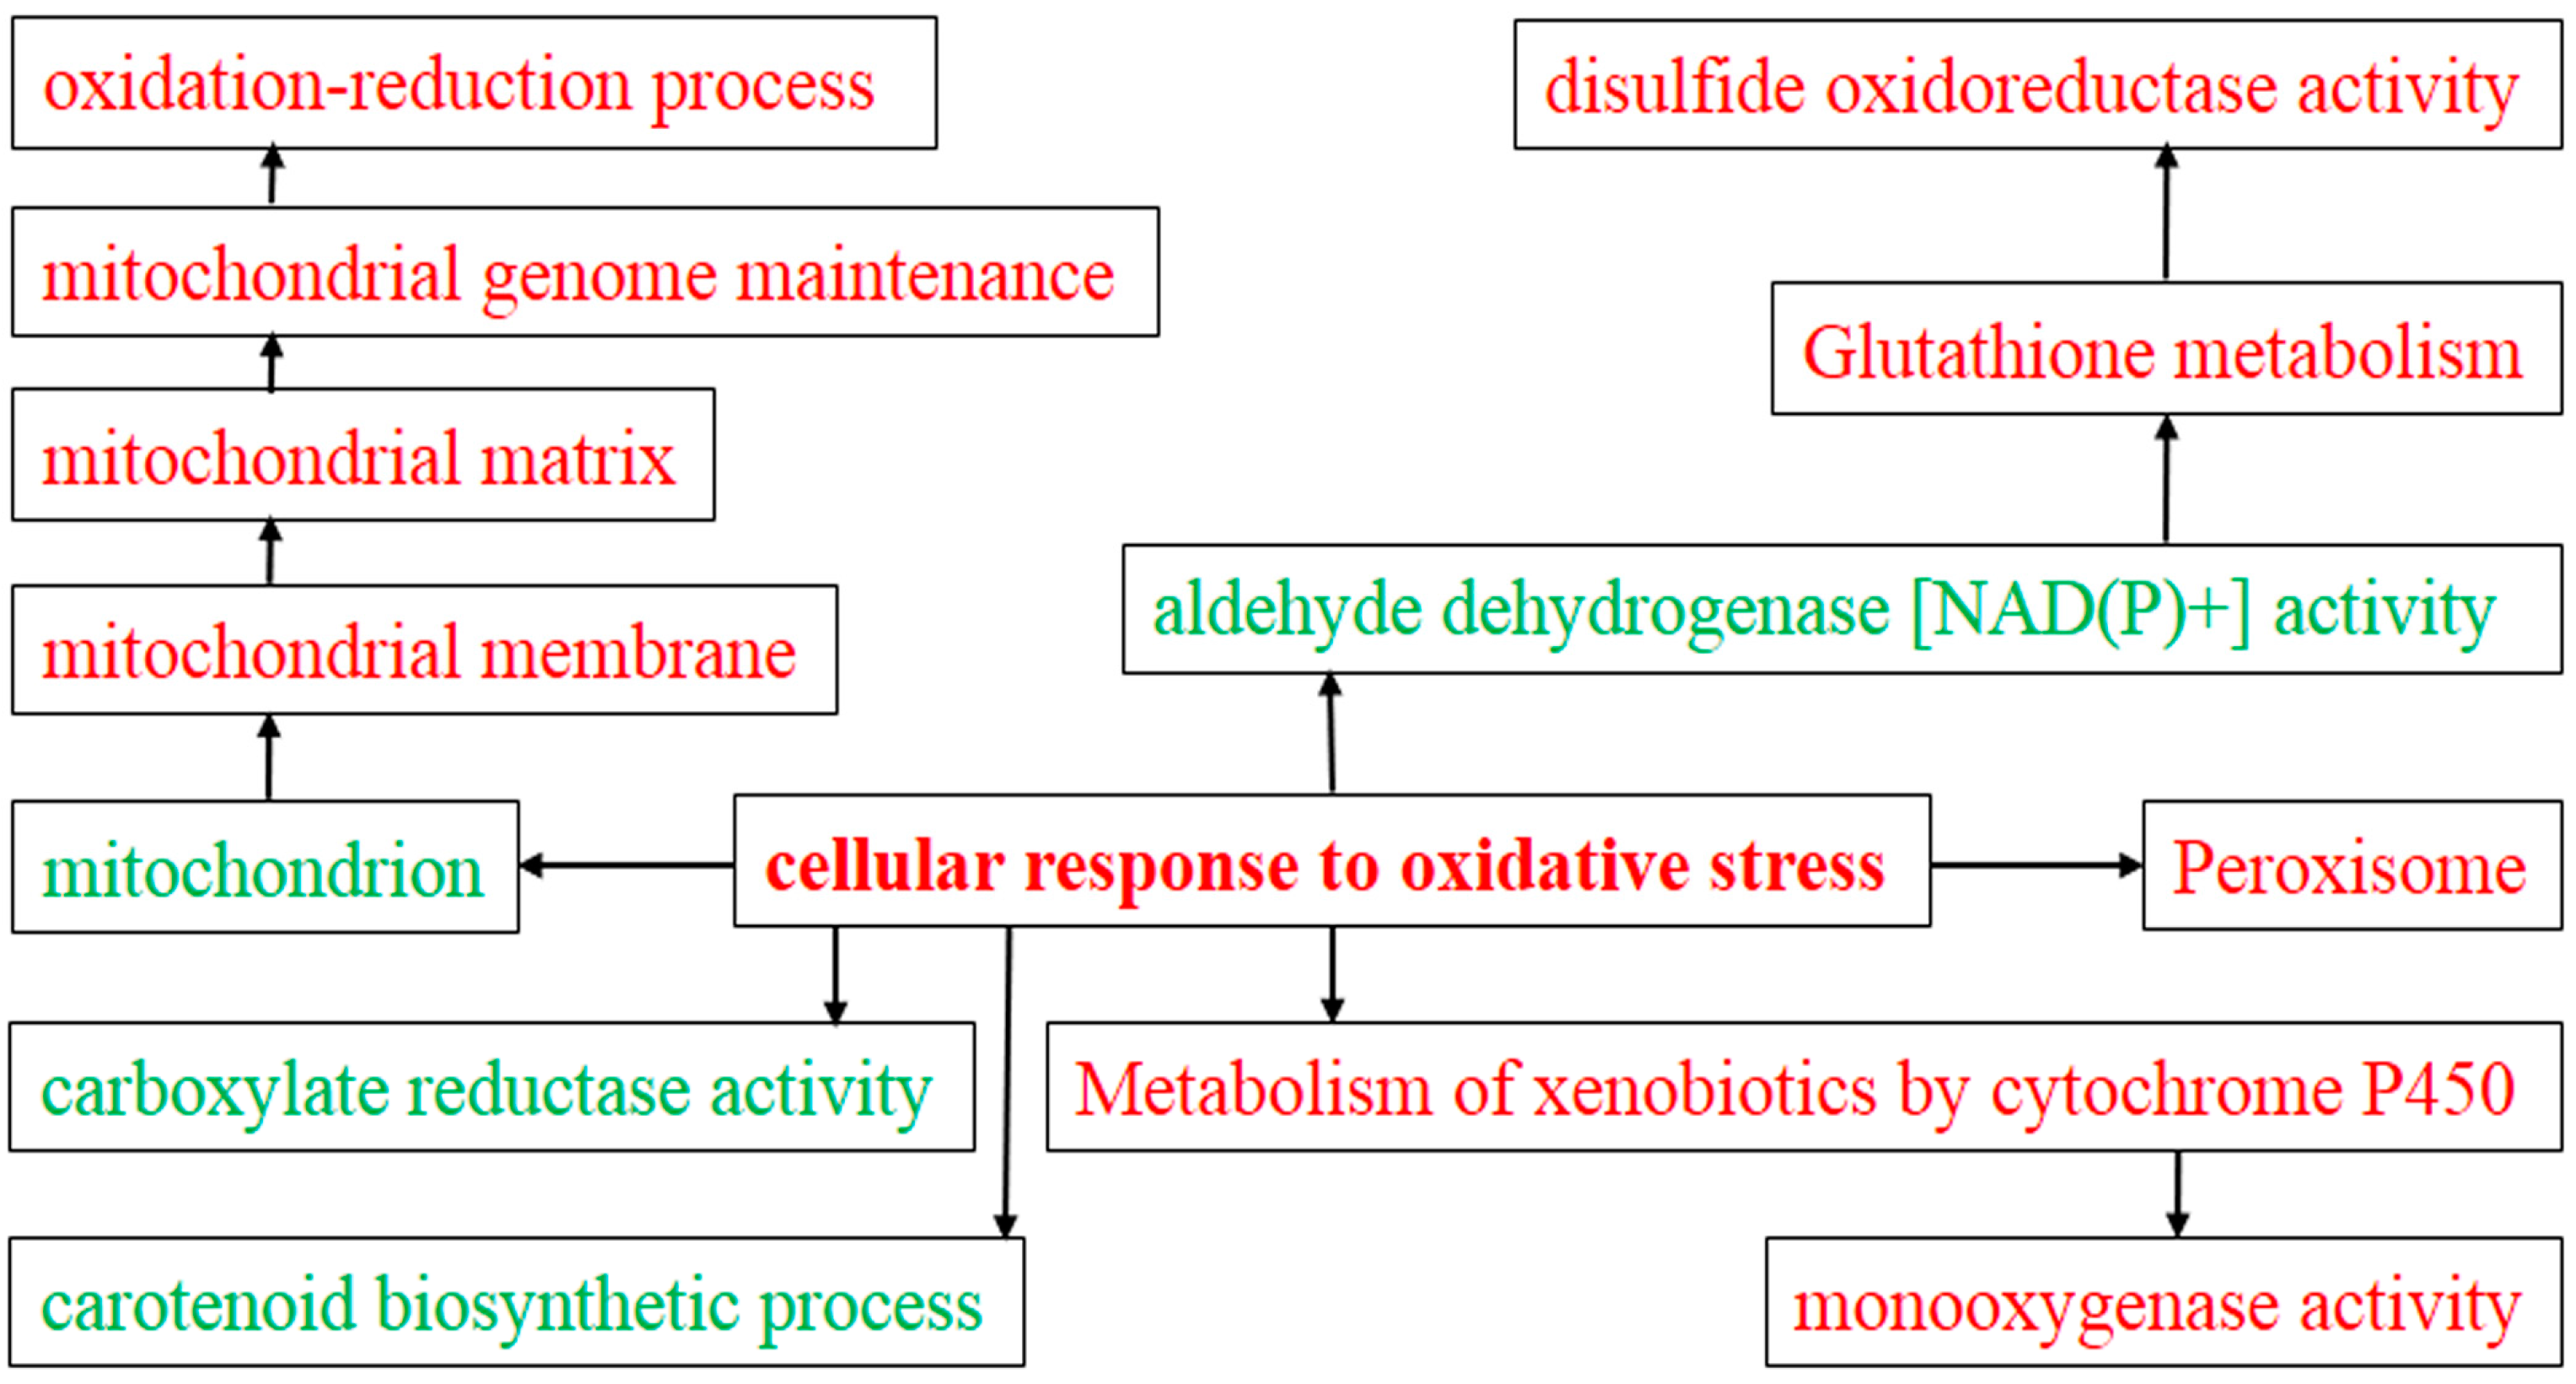
2.4. Gene Ontology (GO) Analysis of DEGs

GO analysis is a strictly defined concept that is used widely in functional annotation and enrichment analysis in all types of organisms. To gain insights into the functions of the genes regulated by FgHV1 infection, we analyzed the DEGs for enriched GO terms. The identified GO terms were classified into three major functional ontologies (biological process, cellular component, and molecular function) and are all listed in the additional file Table S2. As shown in Figure 3, cell redox homeostasis (GO:0045454), protein disulfide oxidoreductase activity (GO:0015035), and the cellular response to oxidative stress (GO:0034599) were the mostly highly enriched GO terms. All three of these GO terms are involved in the oxidative stress response. In addition, terms such as disulfide oxidoreductase activity (GO:0015036), oxidoreductase activity acting on the CH-NH2 group of donors (GO:0016638), monophenol monooxygenase activity (GO:0004503), glutathione peroxidase activity (GO:0004602), and glutathione transferase activity (GO:0004364) were enriched. Transcripts involved in the carotenoid biosynthetic process (GO:0016117) were down-regulated. A set of GO terms associated with mycelial growth and development was also enriched, including mycelium development (GO:0043581), glutamate metabolic process (GO:0006536), regulation of glycolytic process (GO:0006110), negative regulation of gluconeogenesis (GO:0045721), glycerol metabolic process (GO:0006071), and filamentous growth (GO:0030447). In particular, the conidiophore development (GO:0070787) was enriched. Moreover, transcripts involved in transportation were enriched in GO terms such as FMN binding (GO:0010181) and negative regulation of chloride transport (GO:2001226).

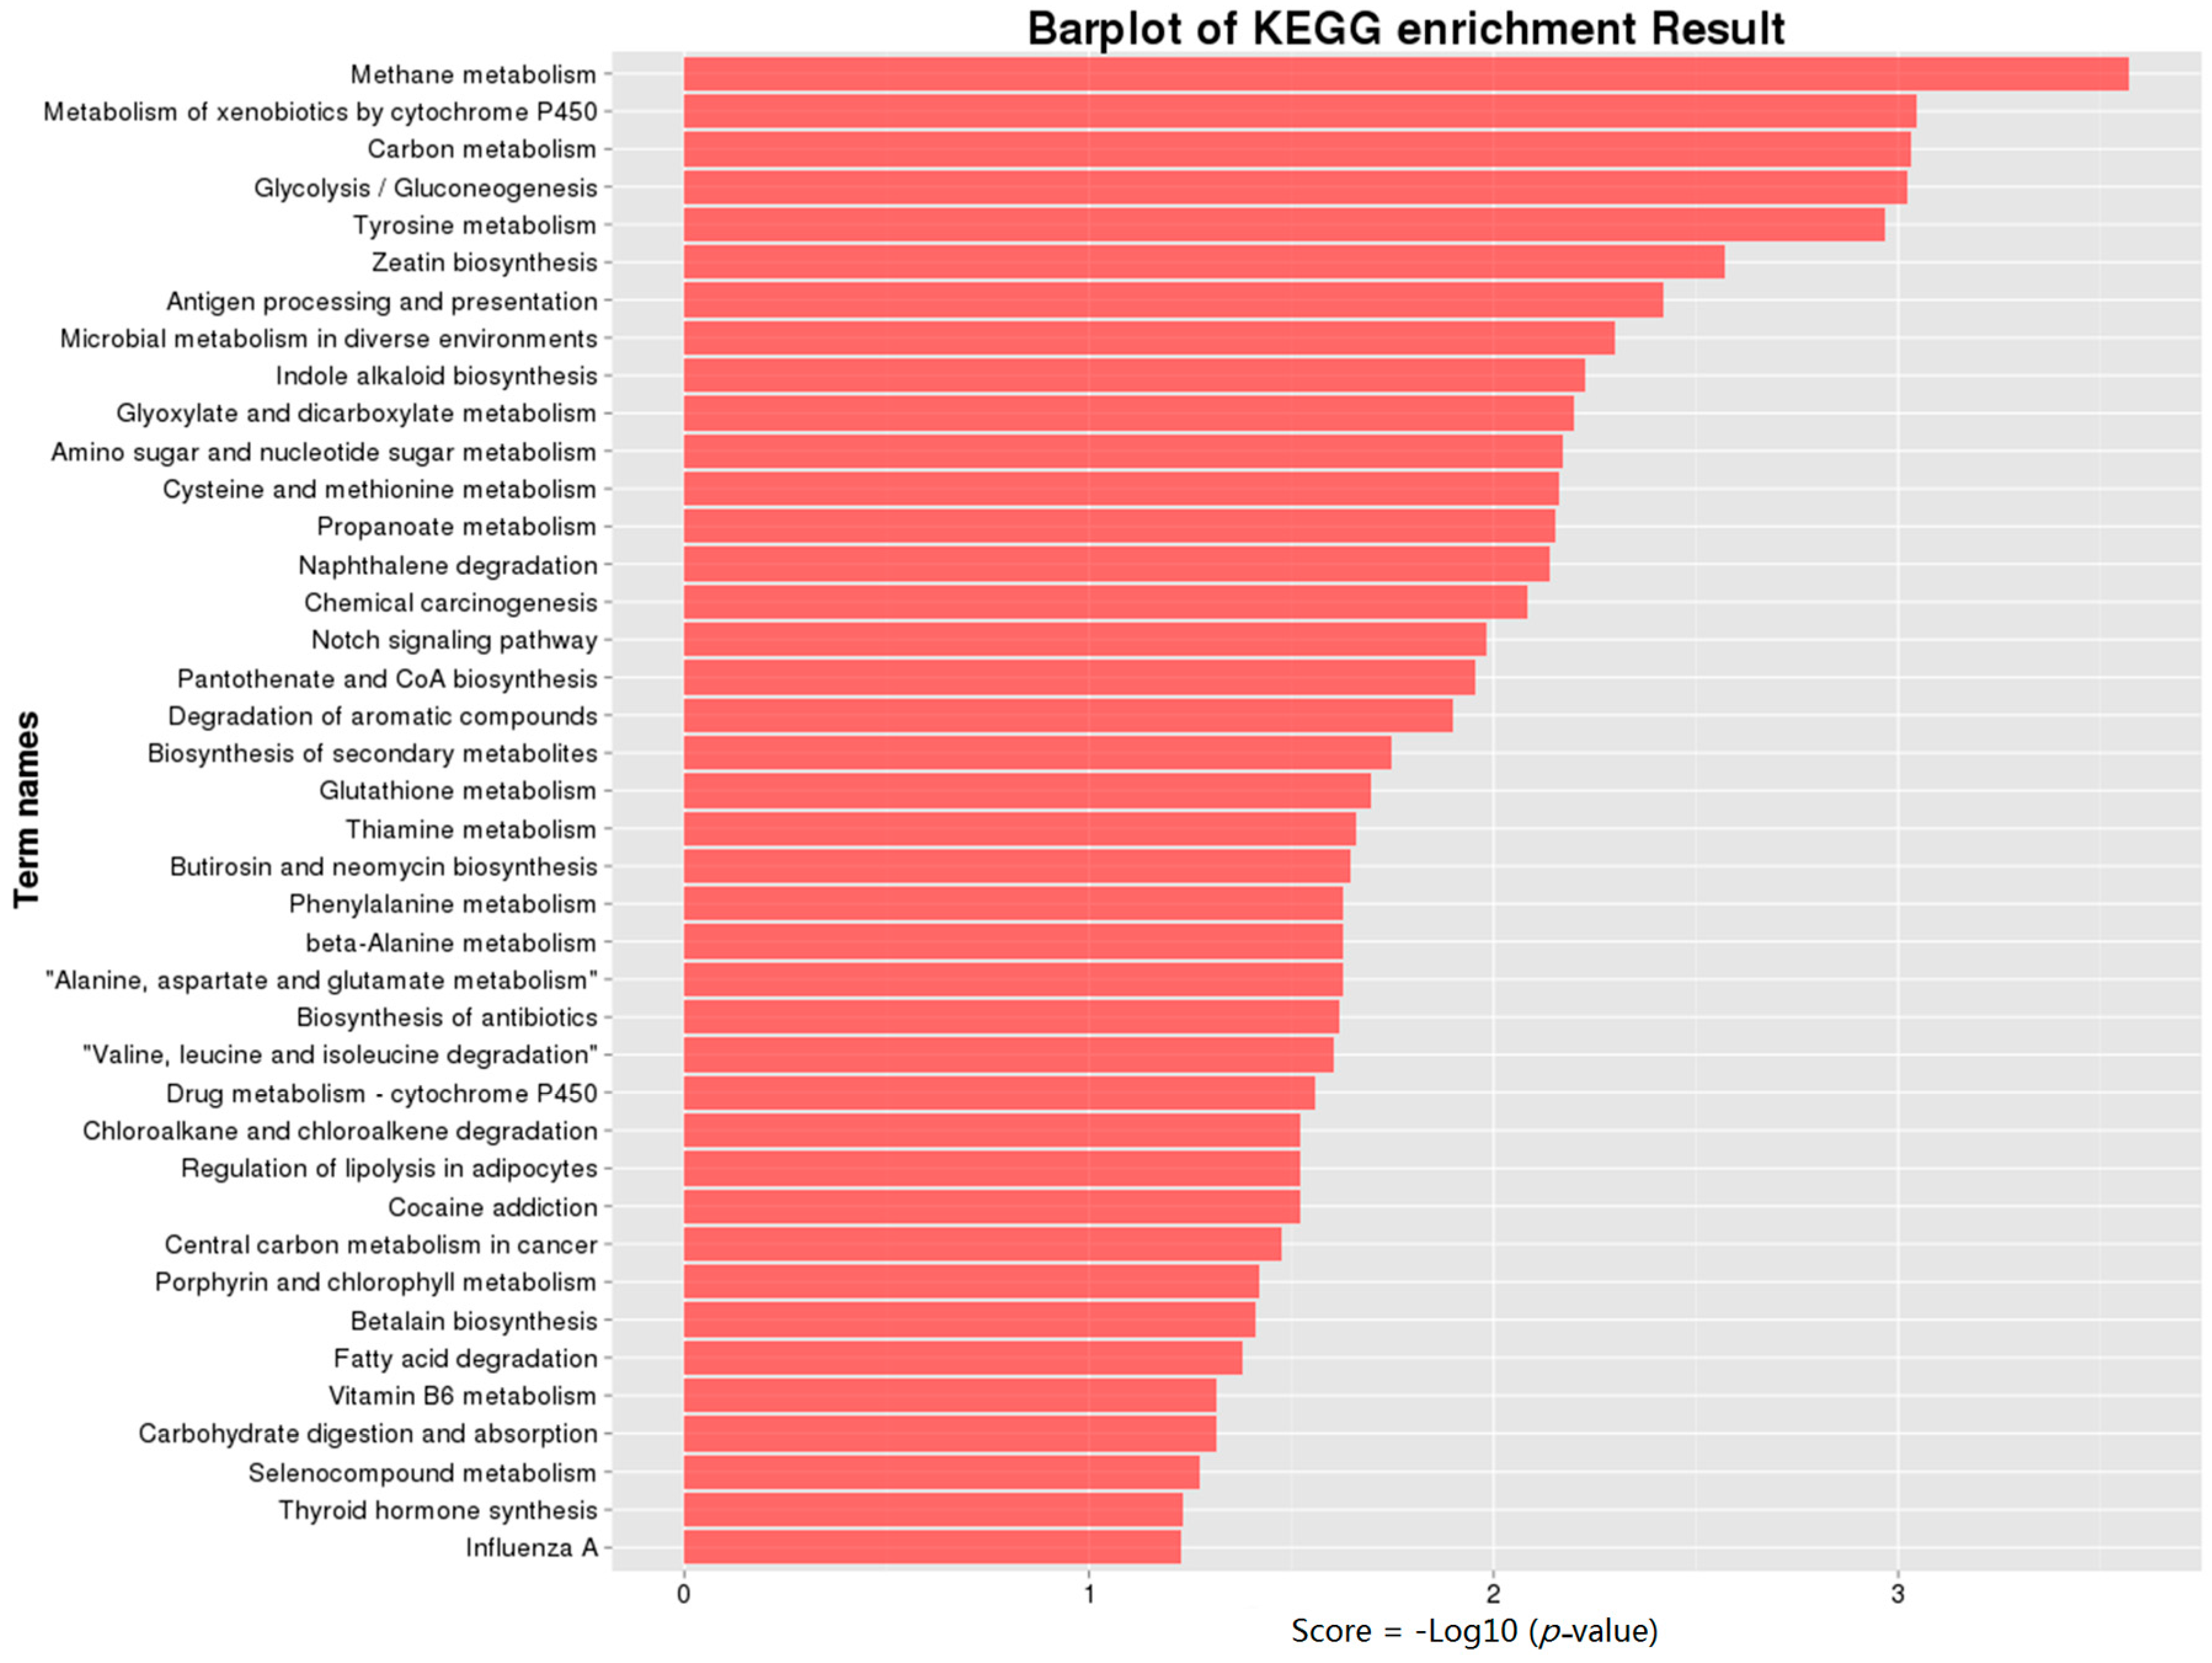
2.5. Kyoto Encyclopedia of Genes and Genomes Pathway (KEGG) Annotation of DEGs

KEGG pathway analysis can reveal specific pathways that are induced or suppressed by virus infection. To understand the interactions of genes with various biological functions, we conducted searches against the KEGG using BLASTx. The search results indicated that 117 KEGG pathways were mapped (Table S3). As shown in Figure 4, Methane metabolism (ko00680), Metabolism of xenobiotics by cytochrome P450 (ko00980) and Carbon metabolism (ko01200) were the top three enriched pathways. Pathways, including glycolysis/gluconeogenesis (ko00010), alanine, aspartate and glutamate metabolism (ko00250), regulation of lipolysis in adipocytes (ko04923), and fatty acid degradation (ko00071) that may influence the mycelial growth rate were enriched. Although the red Fusarium pigment was not affected by FgHV1 infection, FGSG_03181, categorized into the Betalain biosynthesis (ko00965) pathway, was up-regulated in the FgHV1-infected F. graminearum HN10-11F strain. It is worth noting that pathways including the metabolism of xenobiotics by cytochrome P450 (ko00980), drug metabolism-cytochrome P450 (ko00982), and glutathione metabolism (ko00480) pathways were consistent with the results of the GO analysis related to the biological process of cellular redox regulation, as discussed above.
Viruses require the host translational machinery to produce viral proteins for proliferation. In our GO and KEGG analysis, many items associated with protein synthesis and processing were identified. tRNA aminoacylation for protein translation (GO:0006418), regulation of ribosome biogenesis (GO:0090069), and protein processing in the endoplasmic reticulum (ko04141) were enriched. Through the addition of one ubiquitin molecule (monoubiquitination) or a chain of ubiquitin molecules (polyubiquitination) to a substrate protein, the ubiquitination system functions in a wide variety of cellular processes [17]. Many ubiquitin-related GO terms and pathways were identified, including cytoplasm-associated proteasomal ubiquitin-dependent protein catabolic processes, protein denaturation involved in proteasomal ubiquitin-dependent protein catabolism, and negative regulation of ubiquitin-specific protease activity.

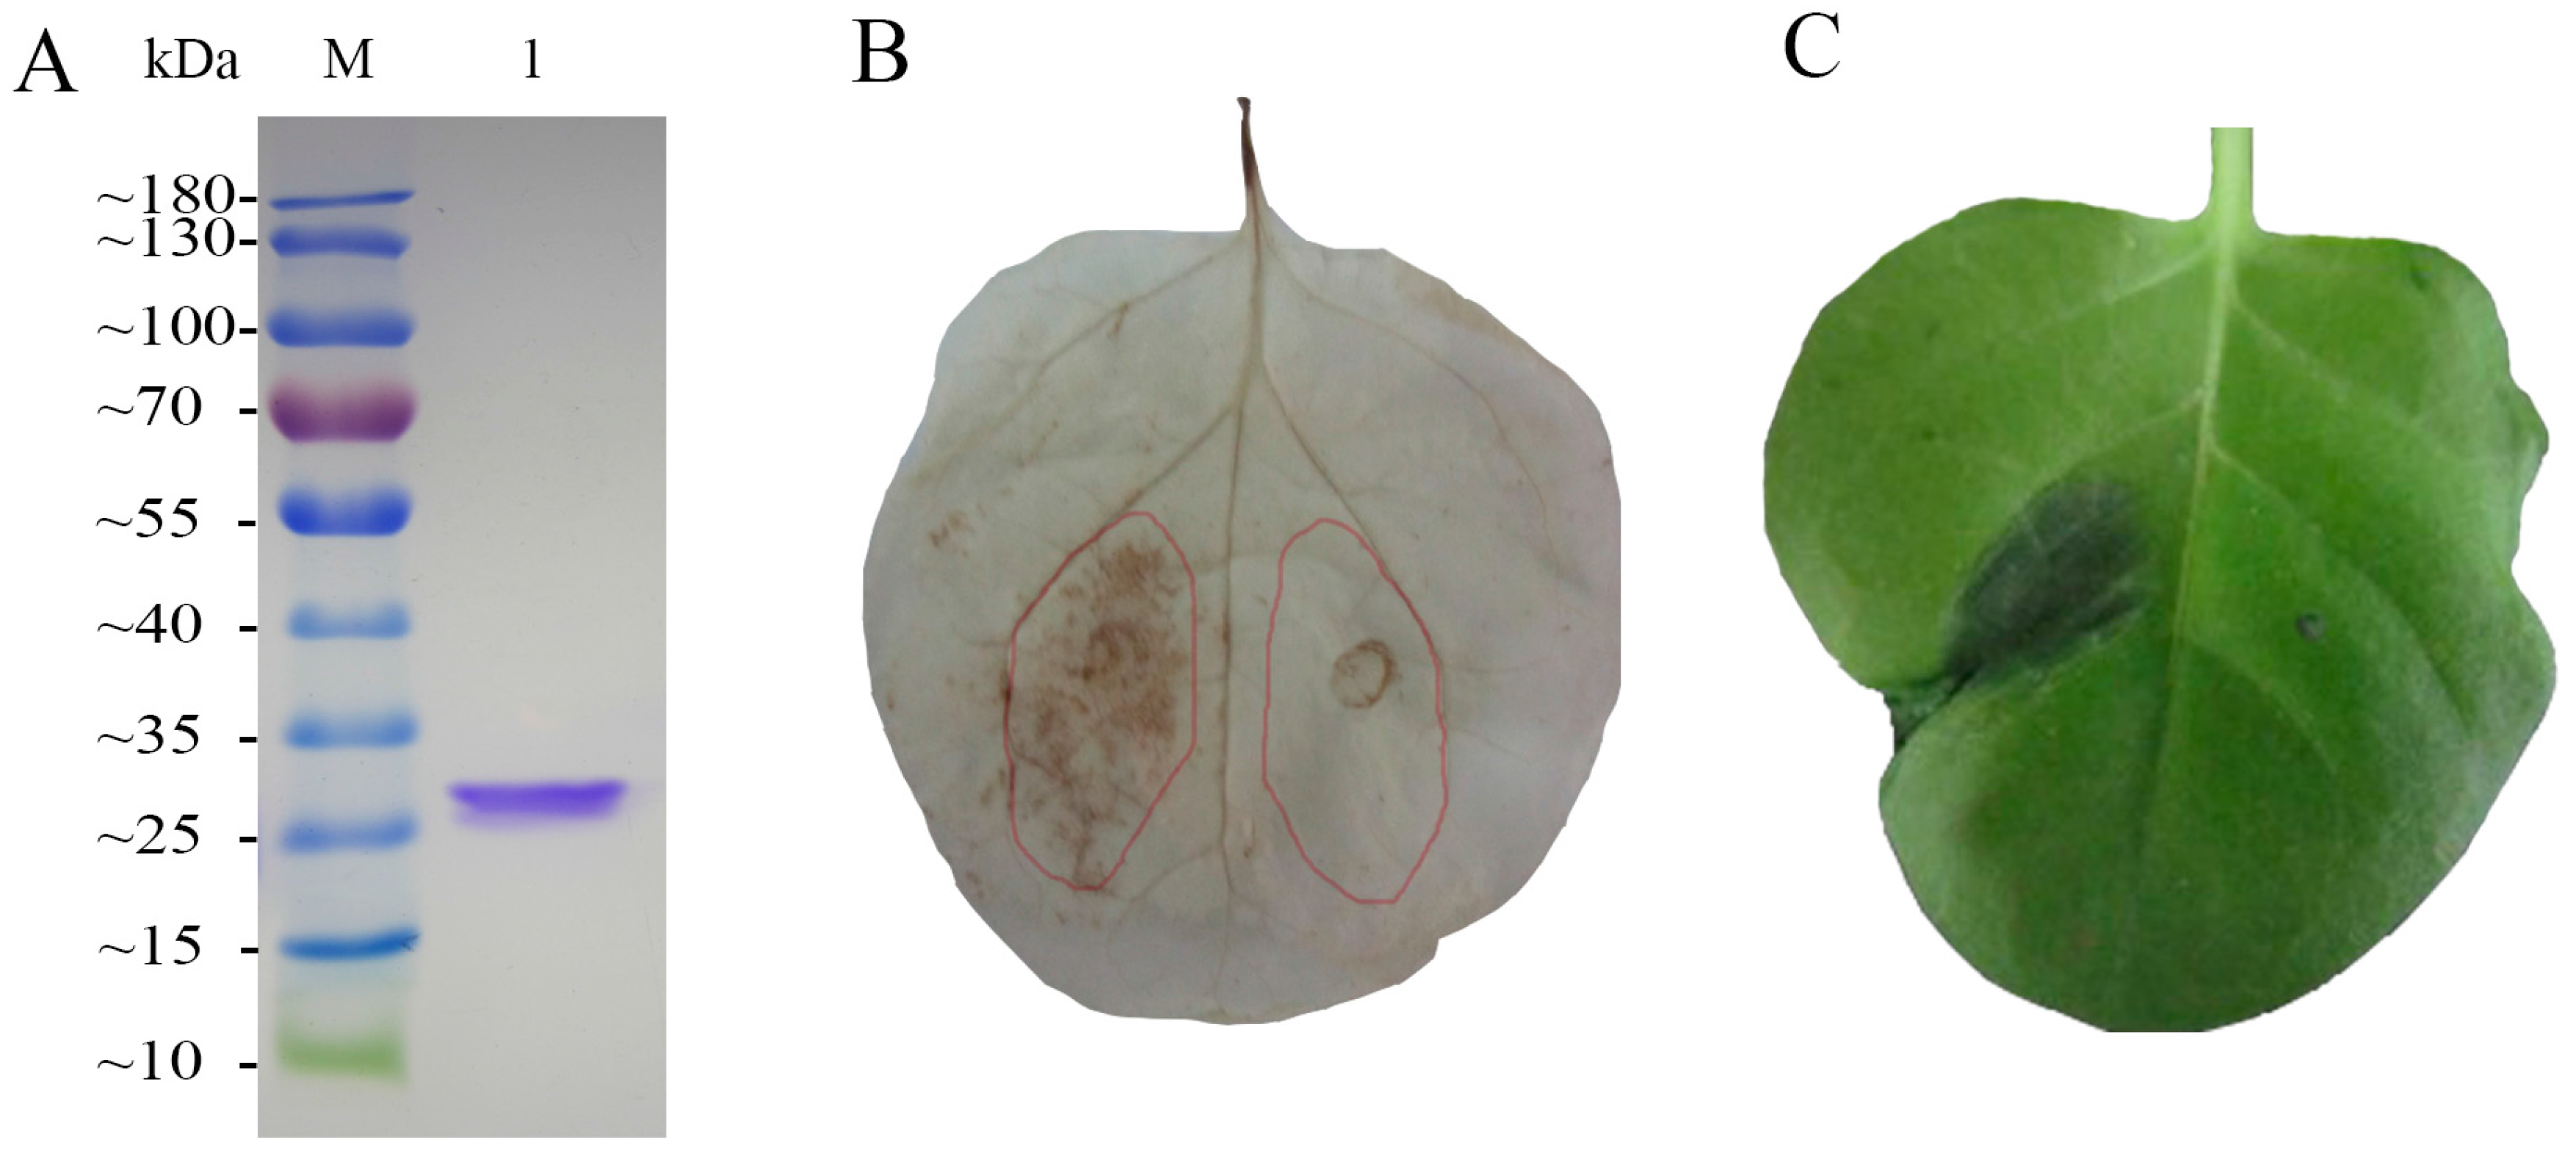
2.6. Induction of H2O2 Accumulation and Hypersensitive Response by FgHV1

Through our analysis of DEGs enrichment, it was found that oxidative stress reaction may be a primary cellular response during the FgHV1 infection. Many DEGs, GO terms, and KEGG pathways at the top were related to redox status regulation. Reactive oxygen species, especially H2O2 serve as critical oxidative stress signaling molecules and are important in plant defense reaction. The p20, encoded by FgHV1 was a papain-like proteinase which caught our attention and was purified (Figure 5A). As shown in Figure 5B, hydrogen peroxide polymerized by diaminobenzidine (DAB), which forms a dark red-brown precipitate, was detected in p20 treated N. benthamiana leaves. This phenomenon indicated that the recombinant p20 could induce H2O2 accumulation. As we know, H2O2 may lead to hypersensitive response. Therefore, we also examined whether p20 could induce hypersensitive response in N. benthamiana leaves. After 24 h, the purified recombinant p20 can also induce a typical hypersensitive response in N. benthamiana (Figure 5C).

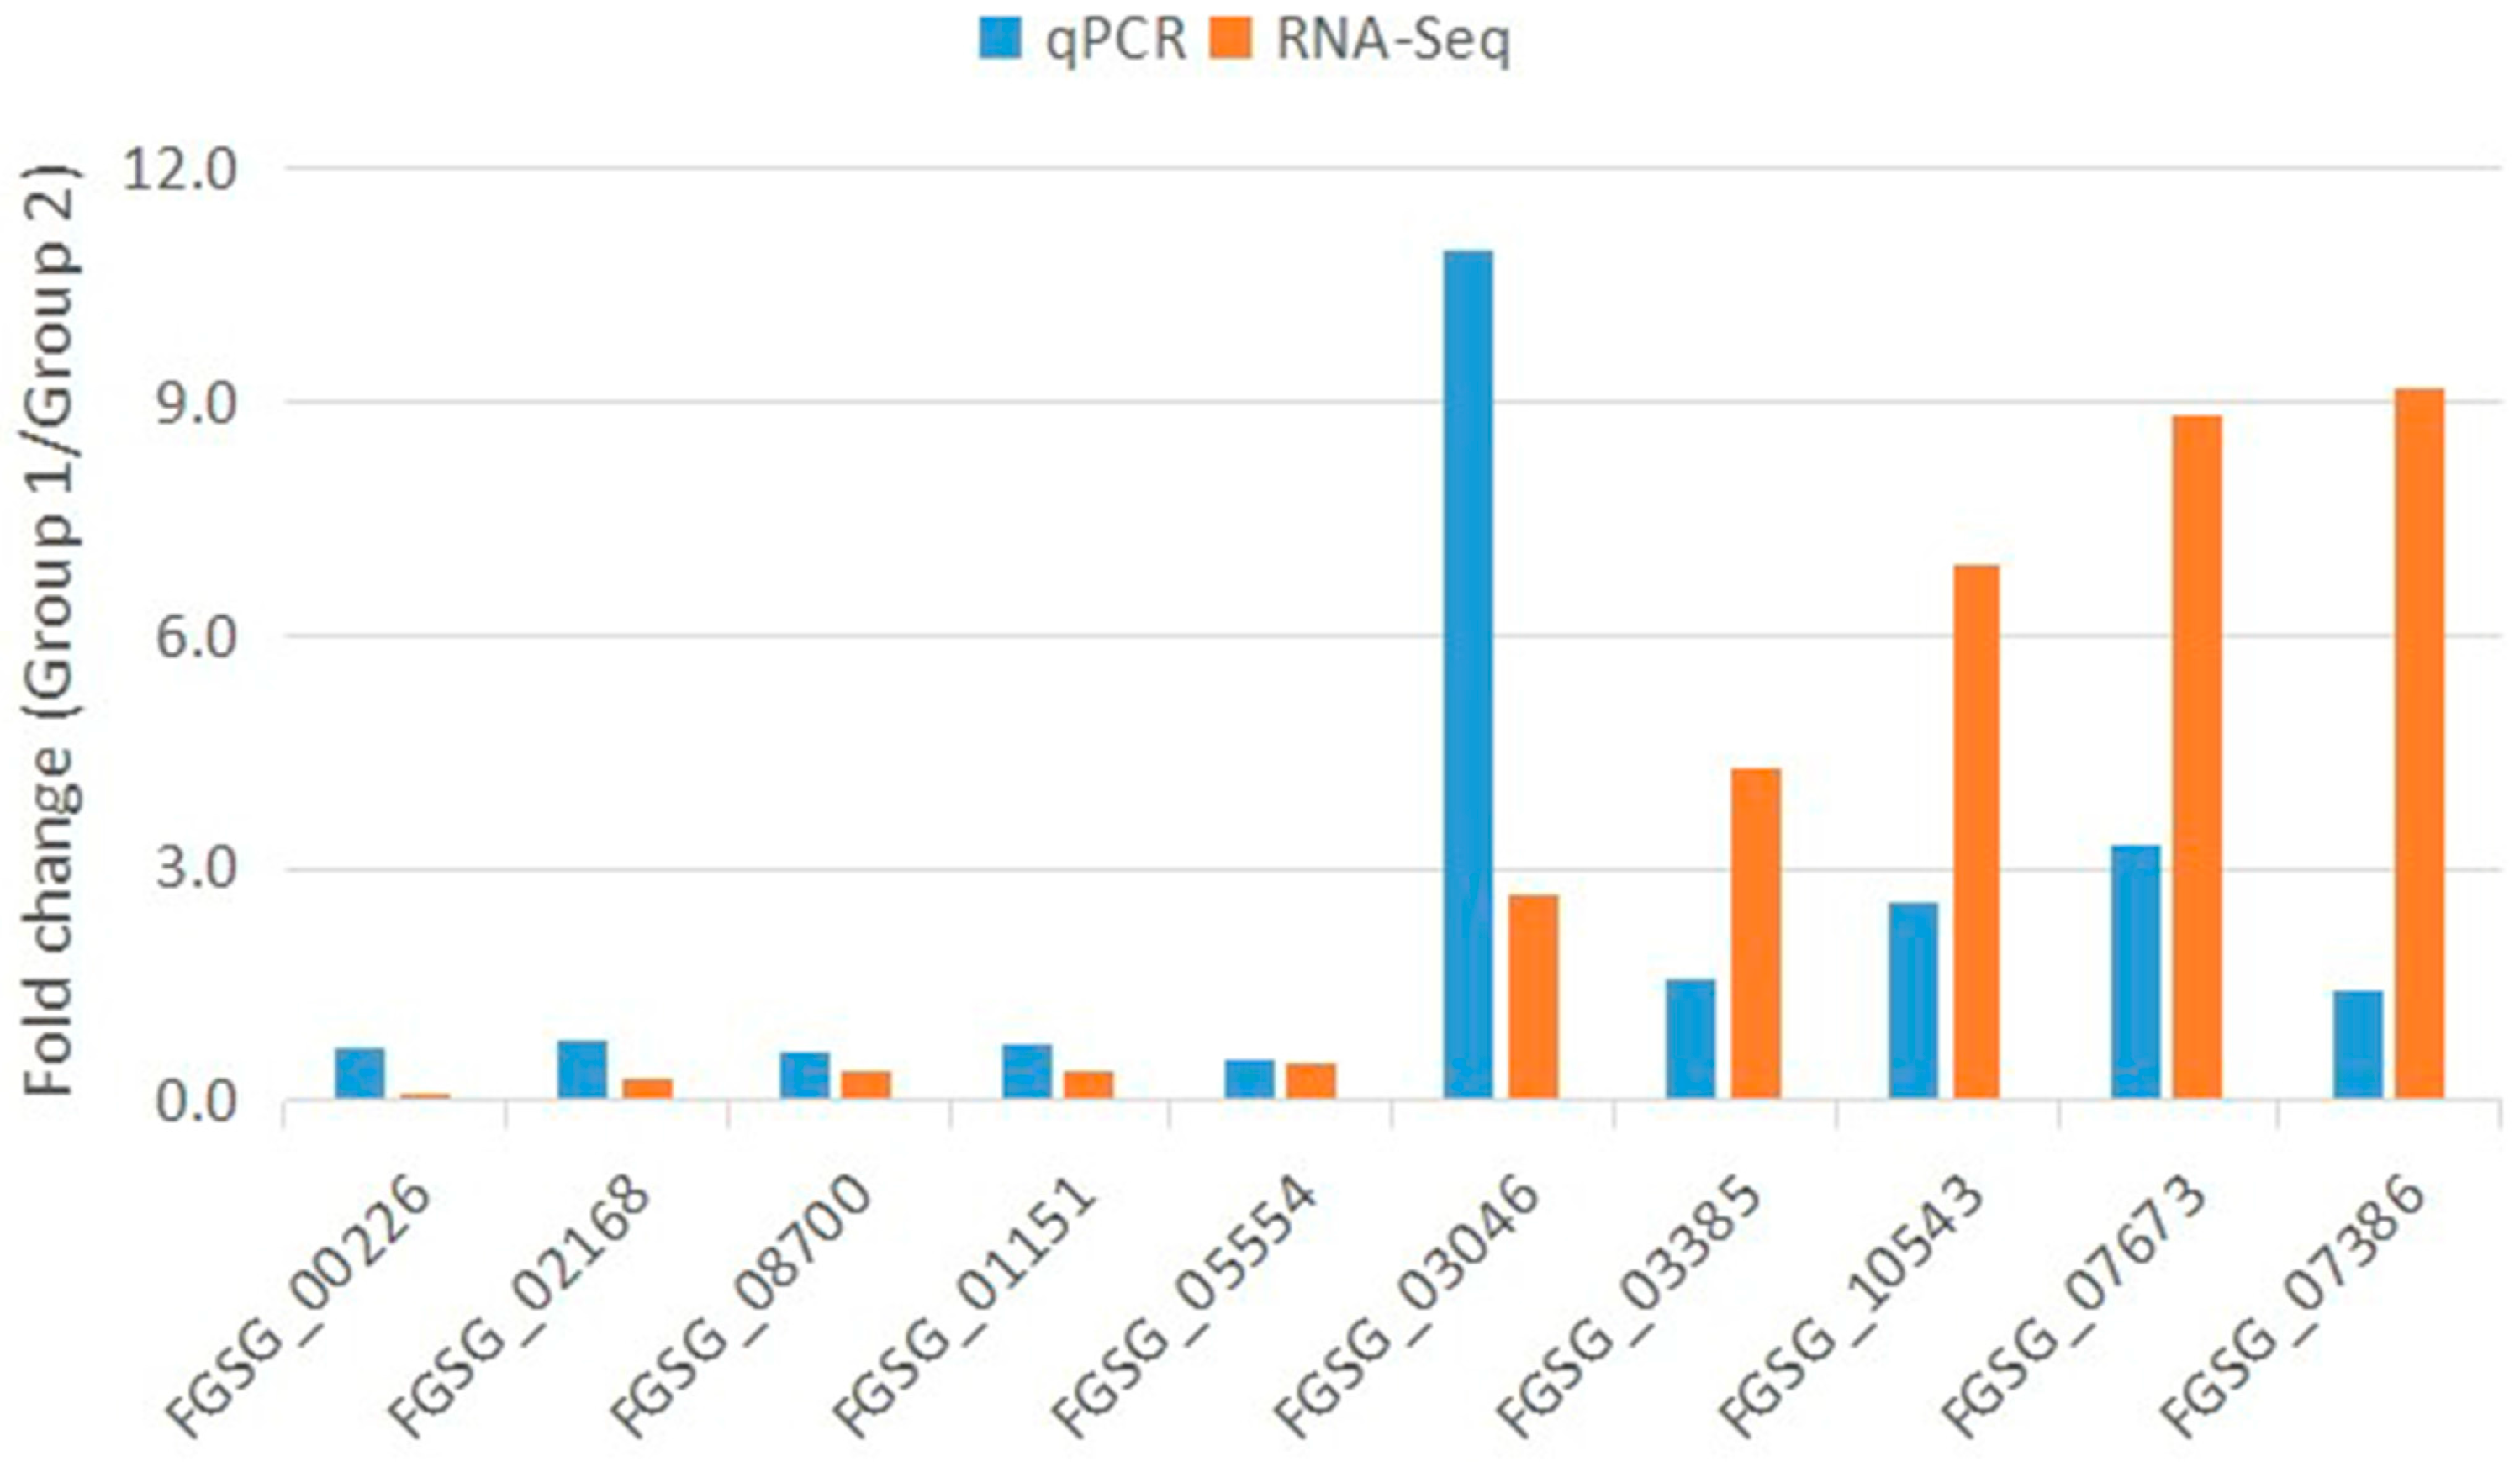
2.7. Quantitative Real-Time Reverse Transcription PCR Validation of the RNA-Seq Data

As a highly sensitive technique, qRT-PCR provides a reliable method to detect transcripts of genes of interest, especially when gene expression is very low. To confirm the RNA-seq results, we picked 10 representative genes to perform qRT-PCR. The β-tubulin gene (FGSG_09530) was used as an endogenous control for normalization. All of the primers designed using Beacon designer V8.12 (Premier Biosoft, Palo Alto, CA, USA), are listed in additional file Table S4. The qRT-PCR results were mostly consistent with those from the RNA-seq. Although the detected fold changes did not exactly match, most of the genes showed the same trends according to these two methods. For example, the up-regulation of FGSG_03046 and FGSG_07673 was confirmed by both RNA-seq and qRT-PCR. As shown in Figure 6, genes that were down-regulated, such as FGSG_08700 and FGSG_05554, also showed decreased levels in the qRT-PCR analysis. However, opposite results were returned for a few genes using the two different methods when we checked some other genes of interest. In addition, while critical RNA silencing-related components were not differentially expressed according to RNA-seq data, we detected changes in these components via the qPCR method (data not published). It is highly likely that qRT-PCR results will not correlate with RNA-seq data when changes in gene expression are very small or when gene expression levels are too low.

3. Discussion

Hypovirus infection, which results in a number of distinguishing phenotypic traits, plays an important role in elucidating the interaction between virus and host. Virulence and mycotoxin production of the host F. graminearum were not significantly affected [7]. However, FgHV1 infection caused reduced hyphal growth and conidia production. Moreover, the high vertical transmission rate (100%) of FgHV1 through conidia indicated that FgHV1 is well adapted to the host. Phenotypic changes are linked to differential gene expression. In this study, we performed genome-wide expression analysis in response to hypovirus FgHV1 infection. A total of 378 genes were differentially expressed after FgHV1 infection in F. graminearum. These data are quite remarkable, as FgHV1 caused fewer phenotypic alterations than other hypoviruses. This study will provide another good example for elucidating host-virus interactions.
Although the hypovirus FgHV1 is simple, it was clear that DEGs resulting from infection with this virus were associated with many biological processes, cellular components, and molecular functions. Metabolic pathways play fundamental roles in hyphal growth and the pathogenic process. Changes in energy metabolism can lead to pleiotropic phenotypic effects, such as alterations in the growth, virulence, and reproduction of the virus-infected host. Among the identified DEGs, a large number of genes were enriched in various metabolic pathways (Figure 3 and Figure 4). The metabolism of carbohydrates, amino acids, and lipids was influenced by FgHV1 infection. Propionate metabolic processes, the methylcitrate cycle and alcohol metabolic processes were up-regulated, while cellular aldehyde metabolic processes and lactate metabolic processes were down-regulated. Additionally, glutamate metabolic processes and homoserine metabolic processes were suppressed, while glycine metabolic process was activated. Down-regulation of these metabolic genes may result in slower mycelial growth and other related phenotypic changes. As we described previously, FgHV1 infection can reduce the growth rate of F. graminearum hyphae [7]. These results suggest that down-regulation of transcripts related to metabolism may correlate with reduced mycelial growth in F. graminearum.
Ascospores and conidia are Fusarium head blight inocula. In the viral transmission assay, the vertical transmission rate via conidia reached 100%. Genes associated with sexual and asexual reproduction in F. graminearum were identified as DEGs. GO enrichment analysis showed that genes associated with conidiophore development (GO:0070787) and cell wall polysaccharide biosynthetic process (GO:0070592), were significantly down-regulated. This result was consistent with our previous study reporting a reduced spore production rate. It was worthy to note that sex-related GO terms and pathways, including meiotic chromosome segregation, centromeric DNA binding, chromosome segregation, syncytium formation by plasma membrane fusion, chromatin remodeling, mitotic sister chromatid segregation, and the spindle pole body, were enriched. All of these results suggest that FgHV1 infection caused specific transcriptome alterations and that this virus is well adapted to F. graminearum transmitting from generation to generation.
By binding to specific DNA sequences, transcription factors (TFs) control the rate of transcription of genetic information from DNA to mRNA [18]. There are at least 718 TFs encoded in the F. graminearum genome, which can be classified into 44 families [19]. Thus, differentially expressed TFs are of great interest when exploring the interaction between hypoviruses and fungi. Members of 7 of 44 TF families were found to be differentially expressed during hypovirus FgHV1 infection (Table 3). The Zn2Cys6 family (5 TFs) and C2H2 zinc fingers (5 TFs) were the most dominant TF families. Moreover, genes encoding TFs such as the bHLH, negative transcriptional regulator, nucleic acid-binding (OB-fold), bZIP, and GATA-type zinc finger TFs also showed significant changes at the transcript level. In Fusarium species, although the function and regulation of most TFs remain unknown, some transcription factors involved in pigmentation, mycotoxins biosynthesis, sexual development, virulence, and stress responses were investigated. For example, GIP2, a Zn2Cys6 transcription factor, regulates the expression of genes involved in the biosynthesis of the toxin aurofusarin [20]. Another type of Zn2Cys6 transcription factor present in F. graminearum, EBR1, is involved in the regulation of radial growth, virulence, the germination rate, and conidiation [21]. In the present study, most of the DEGs encoding Zn2Cys6 and GATA-type zinc finger TFs were observed to be down-regulated, while DEGs encoding C2H2 zinc finger and bHLH TFs were up-regulated. These differentially expressed TFs may play important roles in host-virus interactions.
Many strategies are used to constrain viral replication, including regulating the cellular redox state. In the host cell, viral RNA is recognized as nonself by the cytosolic pathogen recognition receptor, resulting in a signaling cascade relayed through the mitochondrial antiviral signaling, which is localized to both the mitochondria and peroxisomes [22]. Targeting peroxisomes is a key strategy used by viruses to subvert early antiviral defenses. Virus-induced oxidative stress can cause disruptions in normal mechanisms of cellular signaling. Whether host cells infected with hypovirus show a decrease in antioxidants has yet to be reported. In the present study, a striking number of terms involved in cellular response to oxidative stress were enriched in FgHV1-infected F. graminearum (Figure 7). Among the top three items identified in the GO term and pathway enrichment analyses, cell redox homeostasis (GO:0045454), protein disulfide oxidoreductase activity (GO:0015035), the cellular response to oxidative stress (GO:0034599), and metabolism of xenobiotics by cytochrome P450 (ko00980) were related to biological redox reactions. Many oxidoreductase- and glutathione-related items were also enriched. Tests confirmed that FgHV1 encoded p20 could induce H2O2 accumulation and hypersensitive response in N. benthamiana leaves. The F. graminearum host may attempt to maintain the redox balance and defend against oxidative stress under FgHV1 infection. Further research on cellular redox regulation in F. graminearum faced with FgHV1 infection is of great interest.
Eukaryotes can protect themselves from viral infections through RNA silencing. Viral infection can strongly induce the expression of genes involved in host RNA silencing. It has been demonstrated that the DCL2-dependent pathway is responsible for vsiRNA production and that Ago2 is required for the induction of the RNA silencing antiviral defense in the C. parasitica/CHV1 system [23,24]. In F. graminearum, FgDicer2 is critical for sRNA transcription and micro-like RNA generation [25]. FgDicer and FgArgos transcripts were differently expressed in F. graminearum with and without FgHV1-infection, indicating that F. graminearum/FgHV1 can serve as a system for studying RNA silencing mechanisms. GO term, regulation of DNA methylation (GO:0044030), also had drawn much attention. Our previously published article showed that 24-nt small RNAs were reduced by half in FgHV1-infected F. graminearum, which were required to direct methylation [26]. Plant and animal viruses encode a wide variety of RNA silencing suppressors (RSSs) to resist RNA silencing [27,28]. To our knowledge, the only two RSSs identified in mycoviruses are the CHV1-encoded papain-like protease p29 and the Rosellinia necatrix mycoreovirus 3-encoded S10 [29,30]. Encouragingly, P20, a papain-like proteinase encoded by FgHV1, is closely related to the CHV1-encoded RSS p29, which may serve as a potential RSS and requires further investigation.

4. Materials and Methods

4.1. Fungal Strains and Culture Conditions

The F. graminearum strain HN10 infected with hypovirus FgHV1 and the isogenic virus-free strain HN10-11F were cultured on potato dextrose agar (PDA) (Difco, Detroit, MI, USA) at 25 °C in the dark. Liquid potato dextrose broth (PDB) cultures (50 mL) were inoculated with a plug of freshly grown mycelia (0.7 cm in diameter) and cultured for four days at 25 °C with stirring at 180 rpm in a shaker. After filtering through Miracloth (Calbiochem, San Diego, CA, USA), the hyphae were harvested, washed with distilled water twice, dried with pressure between paper towels, flash-frozen in liquid nitrogen and stored in a −80 °C freezer. To increase the accuracy of the project, three biological replicates were included for each sample.

4.2. Vertical Transmission Rate via Asexual Spores

Asexual spores were produced following a previously described procedure [7]. To determine the efficiency of transmission to asexual spores, the harvested spores were transferred into tubes, serially diluted and laid onto PDA plates. After 36 h, single spore cultures were removed to a new plate. Northern dot blots were conducted using RNA samples extracted from mycelia after six days of growth as described [7]. The existence or absence of viral RNA was confirmed through northern dot blotting as described above.

4.3. RNA Extraction and cDNA Library Construction and Sequencing

The collected hyphae were ground into powder with a grinding mill. RNA was extracted using TRIzol (Invitrogen, Carlsbad, CA, USA) according to the manufacturer’s instructions. The extracted total RNA was treated with DNase I to remove DNA contamination. The quality and concentration of extracted RNA were examined using an Agilent 2100 Bioanalyzer (Agilent Technologies, Palo Alto, CA, USA) and mRNA was isolated from the prepared RNA using Oligo (dT) magnetic beads. The isolated mRNA was mixed with fragmentation buffer and fragmented into short fragments. Then, cDNA was synthesized using the mRNA fragments as templates. Short fragments were purified and resolved with EB buffer to be used for end reparation and single-nucleotide A (adenine) addition. The short fragments were then connected with adapters. After agarose gel electrophoresis, the suitable fragments were selected as templates for PCR amplification. During the quality control (QC) steps, the Agilent 2100 Bioanalyzer and ABI StepOnePlus Real-Time PCR System (Applied Biosystems, Foster, CA, USA) were used to quantify and test the quality of the sample library. Finally, the libraries were sequenced using the Illumina HiSeq™ 2000 at BGI-Shenzhen (BGI, Shenzhen, China). For each transcriptome sample, three biological replicates were used for cDNA library construction and sequencing. The raw sequencing data have been deposited in the National Center for Biotechnology Information (NCBI) Sequence Read Archive (SRA) under accession numbers: SRA189434.

4.4. Identification of Differentially Expressed Genes

Raw reads produced from the Illumina HiSeq™ 2000 were filtered into clean reads and aligned to the reference sequences of F. graminearum PH-1 using SOAPaligner/SOAP2 [31]. The genome of the F. graminearum strain PH-1 (FGSC 9075, NRRL 31084) is available in the Fusarium comparative database (http://www.broadinstitute.org/). No more than five mismatches were allowed in the alignment. The FPKMs (Fragments per Kilobase of transcript per Million mapped reads) were calculated to determine the expression level of each gene. The differential expression analysis was performed using edgeR mRNA-seq datasets. We used a strict algorithm to identify the DEGs between two samples. DEGs were identified based on a two-fold change threshold and a false discovery rate (FDR) ≤ 0.05.

4.5. GO Enrichment and KEGG Analysis

According to functional categories and predefined pathways, all DEGs were analyzed. A strict algorithm based on GO-Term Finder was used to perform the GO enrichment (http://smd.stanford.edu/help/GO-TermFinder/GO_TermFinder_help.shtml/). The threshold for evaluating the significance of GO terms was obtained by applying a p value of 0.05. The Kyoto Encyclopedia of Genes and Genomes pathway analysis was performed in the KEGG database (http://www.genome.jp/kegg).

4.6. Detection of FgHV1 Induced H2O2 Accumulation and Hypersensitive Response

H2O2 and hypersensitive response induction were determined as follows. Firstly, The p20 protein of FgHV1 was purified. The p20 gene was inserted into the pET30-TEV/LIC vector (Novagen, Darmstadt, Germany). Then, the recombinant plasmid was transformed into Escherichia coli BL21 (DE3) (TransGen Biotech, Beijing, China). Under the optimized expression condition, overall bacterium protein was purified with a His-Trap HP column (GE Healthcare, Waukesha, WI, USA). After desalination, the concentration of purified protein was measured with the BCA kit (Pierce, Rockford, IL, USA). Purified p20 protein (5 µM) or Tris-HCL (Negative control) was injected into the N. benthamiana leaves using a syringe to cover areas of 1 to 2 cm2. The treated leaves were cut from plants after 4 h of treatment and soaked in 3,3′-diaminobenzidine (DAB)-HCl (1 mg/mL, pH 3.8) solution. After incubation for 8 h in the dark, the leaves were placed in 95% ethanol at 65 °C to remove chlorophyll and photographed. The hypersensitive response symptoms were examined during 24 h after p20 injection.

4.7. Real-Time RT-PCR

Reactivated mycelial plugs were placed onto a PDA plate overlaid with cellophane membranes and cultured for four days at 25 °C. Subsequently, the mycelial mass was collected from the cellophane membranes and frozen in liquid nitrogen. Total RNA was isolated using an RNA extraction kit for fungi (Transgen Biotech, Beijing, China). cDNA was synthesized with an oligo d(T) primer using a reverse transcription reagent for qPCR and diluted 1:50. Primers for the gene targets of interest were designed using Beacon Designer V8.12 and are listed in Table S4. Quantitative real-time RT-PCR (qPCR) was performed using qPCR SYBR Green mix on a CFX manager system (Bio-Rad, Hercules, CA, USA) according to the manufacturer’s instructions. The β-tubulin gene (FGSG_09530) was used as a reference gene to normalize the qRT-PCR results. Three independent experiments were performed.

Supplementary Materials

Supplementary materials can be found at www.mdpi.com/1422-0067/17/11/1922/s1.

Acknowledgments

This work was supported by the Science and Technology Plan Project of Beijing (No. D151100003915003) and the National Natural Science Foundation of China (31171818). We thank the University of Liège-Gembloux Agro-Bio Tech and more specifically the research platform AgricultureIsLife for the funding of the scientific stay in Belgium that made this paper possible.

Author Contributions

Lihua Guo and Dewen Qiu conceived and designed the experiments; Shuangchao Wang and Pengfei Li performed the experiments; Shuangchao Wang and Lihua Guo analyzed the data; Shuangchao Wang and Jingze Zhang wrote the paper.

Conflicts of Interest

The authors declare no conflict of interest.

References

  1. Márquez, L.M.; Redman, R.S.; Rodriguez, R.J.; Roossinck, M.J. A virus in a fungus in a plant: Three-way symbiosis required for thermal tolerance. Science 2007, 315, 513–515. [Google Scholar] [CrossRef] [PubMed]
  2. Shapira, R.; Choi, G.H.; Nuss, D.L. Virus-like genetic organization and expression strategy for a double-stranded RNA genetic element associated with biological control of chestnut blight. EMBO J. 1991, 10, 731. [Google Scholar] [PubMed]
  3. Chu, Y.-M.; Jeon, J.-J.; Yea, S.-J.; Kim, Y.-H.; Yun, S.-H.; Lee, Y.-W.; Kim, K.-H. Double-stranded RNA mycovirus from Fusarium graminearum. Appl. Environ. Microbiol. 2002, 68, 2529–2534. [Google Scholar] [CrossRef] [PubMed]
  4. Desjardins, A.; Proctor, R. Molecular biology of Fusarium mycotoxins. Int. J. Food Microbiol. 2007, 119, 47–50. [Google Scholar] [CrossRef] [PubMed]
  5. Cuomo, C.A.; Güldener, U.; Xu, J.-R.; Trail, F.; Turgeon, B.G.; di Pietro, A.; Walton, J.D.; Ma, L.-J.; Baker, S.E.; Rep, M. The Fusarium graminearum genome reveals a link between localized polymorphism and pathogen specialization. Science 2007, 317, 1400–1402. [Google Scholar] [CrossRef] [PubMed]
  6. Yu, J.; Kwon, S.-J.; Lee, K.-M.; Son, M.; Kim, K.-H. Complete nucleotide sequence of double-stranded RNA viruses from Fusarium graminearum strain DK3. Arch. Virol. 2009, 154, 1855–1858. [Google Scholar] [CrossRef] [PubMed]
  7. Wang, S.; Kondo, H.; Liu, L.; Guo, L.; Qiu, D. A novel virus in the family Hypoviridae from the plant pathogenic fungus Fusarium graminearum. Virus Res. 2013, 174, 69–77. [Google Scholar] [CrossRef] [PubMed]
  8. Li, P.; Zhang, H.; Chen, X.; Qiu, D.; Guo, L. Molecular characterization of a novel hypovirus from the plant pathogenic fungus Fusarium graminearum. Virology 2015, 481, 151–160. [Google Scholar] [CrossRef] [PubMed]
  9. Li, P.; Lin, Y.; Zhang, H.; Wang, S.; Qiu, D.; Guo, L. Molecular characterization of a novel mycovirus of the family Tymoviridae isolated from the plant pathogenic fungus Fusarium graminearum. Virology 2016, 489, 86–94. [Google Scholar] [CrossRef] [PubMed]
  10. Wang, L.; Zhang, J.; Zhang, H.; Qiu, D.; Guo, L. Two novel relative double-stranded RNA mycoviruses infecting Fusarium poae strain SX63. Int. J. Mol. Sci. 2016, 17, 641. [Google Scholar] [CrossRef] [PubMed]
  11. Chen, X.; He, H.; Yang, X.; Zeng, H.; Qiu, D.; Guo, L. The complete genome sequence of a novel Fusarium graminearum. Arch. Virol. 2016, 161, 1–5. [Google Scholar]
  12. Xie, J.; Jiang, D. New insights into mycoviruses and exploration for the biological control of crop fungal diseases. Annu. Rev. Phytopathol. 2014, 52, 45–68. [Google Scholar] [CrossRef] [PubMed]
  13. Hillman, B.I.; Halpern, B.T.; Brown, M.P. A viral dsRNA element of the chestnut blight fungus with a distinct genetic organization. Virology 1994, 201, 241–250. [Google Scholar] [CrossRef] [PubMed]
  14. Chen, B.; Gao, S.; Choi, G.H.; Nuss, D.L. Extensive alteration of fungal gene transcript accumulation and elevation of G-protein-regulated cAMP levels by a virulence-attenuating hypovirus. Proc. Natl. Acad. Sci. USA 1996, 93, 7996–8000. [Google Scholar] [CrossRef] [PubMed]
  15. Allen, T.D.; Nuss, D.L. Specific and common alterations in host gene transcript accumulation following infection of the chestnut blight fungus by mild and severe hypoviruses. J. Virol. 2004, 78, 4145–4155. [Google Scholar] [CrossRef] [PubMed]
  16. Lee, K.-M.; Cho, W.K.; Yu, J.; Son, M.; Choi, H.; Min, K.; Lee, Y.-W.; Kim, K.-H. A comparison of transcriptional patterns and mycological phenotypes following infection of Fusarium graminearum by four mycoviruses. PLoS ONE 2014, 9, e100989. [Google Scholar] [CrossRef] [PubMed]
  17. Turcu, F.E.R.; Ventii, K.H.; Wilkinson, K.D. Regulation and cellular roles of ubiquitin-specific deubiquitinating enzymes. Annu. Rev. Biochem. 2009, 78, 363. [Google Scholar] [CrossRef] [PubMed]
  18. Shelest, E. Transcription factors in fungi. FEMS Microbiol. Lett. 2008, 286, 145–151. [Google Scholar] [CrossRef] [PubMed]
  19. Park, J.; Park, J.; Jang, S.; Kim, S.; Kong, S.; Choi, J.; Ahn, K.; Kim, J.; Lee, S.; Kim, S. FTFD: An informatics pipeline supporting phylogenomic analysis of fungal transcription factors. Bioinformatics 2008, 24, 1024–1025. [Google Scholar] [CrossRef] [PubMed]
  20. Kim, J.-E.; Jin, J.; Kim, H.; Kim, J.-C.; Yun, S.-H.; Lee, Y.-W. Gip2, a putative transcription factor that regulates the aurofusarin biosynthetic gene cluster in Gibberella zeae. Appl. Environ. Microbiol. 2006, 72, 1645–1652. [Google Scholar] [CrossRef] [PubMed]
  21. Zhao, C.; Waalwijk, C.; de Wit, P.J.; van der Lee, T.; Tang, D. EBR1, a novel Zn2Cys6 transcription factor, affects virulence and apical dominance of the hyphal tip in Fusarium graminearum. Mol. Plant-Microbe Interact. 2011, 24, 1407–1418. [Google Scholar] [CrossRef] [PubMed]
  22. Horner, S.M.; Liu, H.M.; Park, H.S.; Briley, J.; Gale, M. Mitochondrial-associated endoplasmic reticulum membranes (MAM) form innate immune synapses and are targeted by hepatitis C virus. Proc. Natl. Acad. Sci. USA 2011, 108, 14590–14595. [Google Scholar] [CrossRef] [PubMed]
  23. Zhang, X.; Nuss, D.L. A host dicer is required for defective viral RNA production and recombinant virus vector RNA instability for a positive sense RNA virus. Proc. Natl. Acad. Sci. USA 2008, 105, 16749–16754. [Google Scholar] [CrossRef] [PubMed]
  24. Sun, Q.; Choi, G.H.; Nuss, D.L. A single Argonaute gene is required for induction of RNA silencing antiviral defense and promotes viral RNA recombination. Proc. Natl. Acad. Sci. USA 2009, 106, 17927–17932. [Google Scholar] [CrossRef] [PubMed]
  25. Chen, Y.; Gao, Q.; Huang, M.; Liu, Y.; Liu, Z.; Liu, X.; Ma, Z. Characterization of RNA silencing components in the plant pathogenic fungus Fusarium graminearum. Sci. Rep. 2015. [Google Scholar] [CrossRef] [PubMed]
  26. Wang, S.; Li, P.; Zhang, J.; Qiu, D.; Guo, L. Generation of a high resolution map of sRNAs from Fusarium graminearum and analysis of responses to viral infection. Sci. Rep. 2016. [Google Scholar] [CrossRef] [PubMed]
  27. Chapman, E.J.; Prokhnevsky, A.I.; Gopinath, K.; Dolja, V.V.; Carrington, J.C. Viral RNA silencing suppressors inhibit the microRNA pathway at an intermediate step. Genes Dev. 2004, 18, 1179–1186. [Google Scholar] [CrossRef] [PubMed]
  28. Lakatos, L.; Csorba, T.; Pantaleo, V.; Chapman, E.J.; Carrington, J.C.; Liu, Y.P.; Dolja, V.V.; Calvino, L.F.; López-Moya, J.J.; Burgyán, J. Small RNA binding is a common strategy to suppress RNA silencing by several viral suppressors. EMBO J. 2006, 25, 2768–2780. [Google Scholar] [CrossRef] [PubMed]
  29. Yaegashi, H.; Yoshikawa, N.; Ito, T.; Kanematsu, S. A mycoreovirus suppresses RNA silencing in the white root rot fungus, rosellinia necatrix. Virology 2013, 444, 409–416. [Google Scholar] [CrossRef] [PubMed]
  30. Segers, G.C.; van Wezel, R.; Zhang, X.; Hong, Y.; Nuss, D.L. Hypovirus papain-like protease p29 suppresses RNA silencing in the natural fungal host and in a heterologous plant system. Eukaryot. Cell 2006, 5, 896–904. [Google Scholar] [CrossRef] [PubMed]
  31. Li, R.; Yu, C.; Li, Y.; Lam, T.-W.; Yiu, S.-M.; Kristiansen, K.; Wang, J. Soap2: An improved ultrafast tool for short read alignment. Bioinformatics 2009, 25, 1966–1967. [Google Scholar] [CrossRef] [PubMed]
Figure 1. Detection of viral dsRNA using Northern dot blots. The first four samples in the last row, from left to right, correspond to blank control, F. graminearum PH-1, F. graminearum HN10-11F, and F. graminearum HN10. All other samples were derived from spores of F. graminearum HN10.
Ijms 17 01922 g001
Figure 2. Volcano plot displaying differentially expressed genes between virus-infected and virus-free samples. The y-axis displays to the -log10 of the mean expression value (FDR value), and the x-axis displays the Log2 (fold-change (FC)-value). The red dots represent the up-regulated differentially expressed transcripts between virus-infected and virus-free samples; the green dots represent the transcripts whose expression was down-regulated; and the gray dots indicate genes not showing significant differences.
Ijms 17 01922 g002
Figure 3. GO ontology classifications of differentially expressed genes. 305 DEGs were subjected to GO annotation. The vertical axis shows the names of clusters of GO terms, and the horizontal axis displays the −Log10 (p-value). A p-value < 0.05 was used as a threshold to select significant GO terms.
Ijms 17 01922 g003
Figure 4. KEGG annotation of differentially expressed genes. 78 DEGs were subjected to KEGG annotation and were grouped into 37 pathway classes. The vertical axis shows the name of KEGG terms and the horizontal axis displays the −Log10 (p-value). A p-value < 0.05 was used as a threshold to select significant KEGG pathways.
Ijms 17 01922 g004
Figure 5. H2O2 accumulation and HR in tobacco following p20 treatment. (A) Purification of recombinant p20. The proteins were resolved on SDS-PAGE with Coomassie brilliant blue R-250 staining. Lane M, protein molecular mass marker; Lane 1, p20; (B) Observation of H2O2 accumulation in N. benthamiana leaves. The left side of the leaf was injected with p20 and the other side was injected with BSA as a negative control. The infiltration extent was drawn onto the leaf right after infiltration and marked in the picture; (C) Hypersensitive response induced by p20 in N. benthamiana. P20 (left side) and Tris-HCL (right side) were injected into same leaf. The hypersensitive response was observed at 24 h postinjection.
Ijms 17 01922 g005
Figure 6. qRT-PCR validation of RNA-seq data. The expression of 10 selected genes was examined via real-time RT-PCR. For each qRT-PCR validation, three technical replications were performed. The beta-tubulin gene was used as an internal control.
Ijms 17 01922 g006
Figure 7. Analysis of enriched GO and KEGG terms involved in cellular redox regulation. Cellular components, molecular functions and biological process were included in the analysis. The terms that were up-regulated were colored in red and other down-regulated terms were colored in green.
Ijms 17 01922 g007
Table 1. Summary of sequencing data.
SampleRaw ReadsClean ReadsClean Ratio (%) brRNA Ratio (%) cGenome Mapping ReadsGenome Mapping Ratio (%) d
HN101 a47,553,25045,550,25095.790.3142,645,24489.68
HN102 a67,251,96061,857,85091.982.7154,383,99280.87
HN103 a59,989,57655,086,45291.821.7848,820,87981.38
HN10-11F1 a47,513,98445,490,46295.740.1443,087,30190.68
HN10-11F2 a41,710,16039,258,41294.121.2033,089,57679.33
HN10-11F3 a57,445,04452,402,11291.222.3345,621,58879.42
a HN101, HN102, and HN103: three biological replicates of an FgHV1-infected sample. HN10-11F1, HN10-11F2, and HN10-11F3: three biological replicates of an FgHV1-free sample; b Clean ratio = Clean reads/Raw reads; c rRNA ratio = rRNA/Raw Reads; d Genome mapping ratio = Genome mapping reads/Raw reads.
Table 2. Representative down-regulated and up-regulated F. graminearum genes showing relatively higher fold-changes in the FgHV1-infected strain relative to the virus-free strain.
Gene LocusFold_Change (Group 1/Group 2)p-ValueGene Function
Representative down-regulated genes in FgHV1-infected strain
FGSG_002260.0621919.03 × 10−13Domain: Fungal trichothecene efflux pump (TRI12)
FGSG_139620.1125871.77 × 10−17Alcohol dehydrogenase
FGSG_021380.1311424.73 × 10−5Cytochrome P450 oxidoreductase
FGSG_108020.1333041.99 × 10−28Domain: LrgB-like family
FGSG_044680.1448174.92 × 10−10Domain: Transmembrane amino acid transporter protein
FGSG_061270.1464736.70 × 10−85Formate dehydrogenase
FGSG_075820.1522920MFS transporter
FGSG_039840.1529311.161 × 10−3l-lactate dehydrogenase
FGSG_014500.1574986.18 × 10−57Domain: Calcipressin
FGSG_112720.1783271.05 × 10−13ABC transporter
FGSG_075980.1837622.45 × 10−32Domain: Alcohol acetyltransferase
FGSG_075090.1991095.39 × 10−6Domain: Major Facilitator Superfamily
FGSG_096970.2027265.33 × 10−226Domain: multidrug resistance protein
FGSG_109200.2114983.28 × 10−12Domain: Zinc-binding dehydrogenase
FGSG_112710.2225943.45 × 10−4Domain: Fungal specific transcription factor
Representative up-regulated genes in FgHV1-infected strain
FGSG_1120219.124559.96 × 10−13Domain: Guanylate kinase
FGSG_0176631.360522.99 × 10−41Branched-chain amino acid aminotransferase
FGSG_0280939.846526.84 × 10−182Domain: SRR1
FGSG_1145748.106469.17 × 10−137Endoribonuclease L-PSP
FGSG_0461656.208551.91 × 10−4Glutathione-dependent formaldehyde-activating enzyme
Table 3. Transcriptional factors from F. graminearum showing different expression levels in FgHV1-infected strain relative to virus-free strain.
Gene LocusFold_Change (Group 1/Group 2)p-ValueTranscription Factor Family
FGSG_112710.2225943.44 × 10−4Zn2Cys6
FGSG_032920.2904653.15 × 10−4Zn2Cys6
FGSG_045540.2957300Nucleic acid-binding, OB-fold
FGSG_065030.3249891.20 × 10−4Zn2Cys6
FGSG_090010.3353314.02 × 10−6bZIP
FGSG_075830.3671703.21 × 10−4Negative transcriptional regulator
FGSG_071920.3967621.71 × 10−8Zn2Cys6
FGSG_046260.4056244.77 × 10−5GATA type zinc finger
FGSG_042882.1091852.43 × 10−42C2H2 zinc finger
FGSG_127422.7150526.74 × 10−5Zn2Cys6
FGSG_025162.8250149.17 × 10−306bHLH
FGSG_103603.1484534.11 × 10−6C2H2 zinc finger
FGSG_099913.3604163.57 × 10−7Nucleic acid-binding, OB-fold
FGSG_055673.9331661.58 × 10−30bHLH
FGSG_007644.9405591.712 × 10−3C2H2 zinc finger
FGSG_098325.3992394.23 × 10−20bZIP
FGSG_042097.5905742.44 × 10−4Negative transcriptional regulator
FGSG_038817.8045801.49 × 10−4C2H2 zinc finger
FGSG_0824628.296565.34 × 10−23C2H2 zinc finger

