Article

Changes in Air CO2 Concentration Differentially Alter Transcript Levels of NtAQP1 and NtPIP2;1 Aquaporin Genes in Tobacco Leaves

Dipartimento di Scienze Agrarie, Forestali e Alimentari (DISAFA), ULF Colture arboree e Fisiologia Vegetale, Largo Paolo Braccini 2, 10095 Grugliasco (TO), Italy
*
Author to whom correspondence should be addressed.
Int. J. Mol. Sci. 2016, 17(4), 567; https://0-doi-org.brum.beds.ac.uk/10.3390/ijms17040567
Submission received: 26 February 2016 / Revised: 31 March 2016 / Accepted: 1 April 2016 / Published: 14 April 2016
(This article belongs to the Special Issue Gene–Environment Interactions)

Abstract

:
The aquaporin specific control on water versus carbon pathways in leaves is pivotal in controlling gas exchange and leaf hydraulics. We investigated whether Nicotiana tabacum aquaporin 1 (NtAQP1) and Nicotiana tabacum plasma membrane intrinsic protein 2;1 (NtPIP2;1) gene expression varies in tobacco leaves subjected to treatments with different CO2 concentrations (ranging from 0 to 800 ppm), inducing changes in photosynthesis, stomatal regulation and water evaporation from the leaf. Changes in air CO2 concentration ([CO2]) affected net photosynthesis (Pn) and leaf substomatal [CO2] (Ci). Pn was slightly negative at 0 ppm air CO2; it was one-third that of ambient controls at 200 ppm, and not different from controls at 800 ppm. Leaves fed with 800 ppm [CO2] showed one-third reduced stomatal conductance (gs) and transpiration (E), and their gs was in turn slightly lower than in 200 ppm– and in 0 ppm–treated leaves. The 800 ppm air [CO2] strongly impaired both NtAQP1 and NtPIP2;1 gene expression, whereas 0 ppm air [CO2], a concentration below any in vivo possible conditions and specifically chosen to maximize the gene expression alteration, increased only the NtAQP1 transcript level. We propose that NtAQP1 expression, an aquaporin devoted to CO2 transport, positively responds to CO2 scarcity in the air in the whole range 0–800 ppm. On the contrary, expression of NtPIP2;1, an aquaporin not devoted to CO2 transport, is related to water balance in the leaf, and changes in parallel with gs. These observations fit in a model where upregulation of leaf aquaporins is activated at low Ci, while downregulation occurs when high Ci saturates photosynthesis and causes stomatal closure.

Graphical Abstract

1. Introduction

Aquaporins are a family of small pore-forming integral membrane proteins that play an important role in plant water relations by facilitating water transport along a water potential gradient [1,2]. The physiological relevance of these proteins for transmembrane water flow has been hinted in experiments where their function was blocked by the inhibitor mercury chloride [3] and it has been more convincingly demonstrated using plants where the expression of selected aquaporins was inhibited or enhanced following genetic transformation [4,5,6,7].
A new perspective in the study of these proteins has been opened by observations that some members of the family do not facilitate water transport [8], or are able to transport other neutral molecules beside water, the most physiologically important among them being CO2 [9,10]. The first indirect evidence that CO2 may permeate aquaporins in plants was provided by Terashima and Ono [11], who showed that treatment with mercury chloride on Vicia faba and Phaseolus vulgaris leaves limits mesophyll CO2 conductance. Evidence that the tobacco aquaporin Nicotiana tabacum Aquaporin 1 (NtAQP1) facilitates transmembrane CO2 transport was provided by Uehlein et al. [12] using tobacco plants with altered aquaporin expression and injection in Xenopus laevis oocytes. In addition, the same authors confirmed the role of NtAQP1 as chloroplast gas pore: a low CO2 permeability of the inner chloroplast membranes was measured in plants where the NtAQP1 expression was repressed [13].
Analyses of the role of aquaporins in CO2 transport in leaves were performed by Hanba et al. [14] in rice, by Flexas et al. [15] in tobacco and by Hechwolf et al. [16] in Arabidopsis. Furthermore, the use of reverse genetic approaches clearly demonstrated that inhibition of plasma membrane intrinsic protein 1 (PIP1) gene expression determined lower mesophyll conductance to CO2 in both Arabidopsis [17] and poplar [6] transgenic plants. All these studies strengthen the hypothesis that aquaporins facilitate CO2 transport through plant membranes, and suggest that expression and activation of these “CO2 porins” may be a significant component of the leaf mesophyll conductance to CO2 [18].
In tobacco, two aquaporin genes belonging to the PIP1 and plasma membrane intrinsic protein 2 (PIP2) subfamilies have been isolated and functionally characterized. The NtAQP1, a member of the PIP1 subfamily, is expressed in the spongy parenchyma of tobacco leaves, in particular in cells surrounding stomata [19,20]. The PIP2 gene NtPIP2;1 is expressed in the floral tissue [21], and it plays an important role in water transport in roots [22,23], but its expression in leaves has not been tested up until now. The membrane water permeabilities of Xenopus oocytes expressing NtAQP1 and NtPIP2;1 have not been compared directly, but NtPIP2;1 enhances membrane permeability significantly more than NtPIP1;1, another PIP1 aquaporin of tobacco which shows 99% sequence homology with NtAQP1 [21], and NtAQP1 enhances permeability less than other PIP2 aquaporins [20]. In addition, heterologous expression in yeast cells revealed that NtAQP1 did not increase water transport activity, whereas NtPIP2;1 behaved as an efficient water channel [24]. In contrast, facilitation of CO2 transport, measured either through enhancement of permeability of Xenopus oocyte membranes or by heterologous expression in yeast cells, has been demonstrated for NtAQP1, whereas, on the contrary, NtPIP2;1 lacks a CO2-related function [12,24].
While CO2 concentration in the atmosphere surrounding leaves is fairly constant in the short term, the concentration within the leaf changes widely due to the combined effects of CO2 consumption by carboxylation and CO2 production by respiration and photorespiration. It is thus not surprising that, besides its metabolic role as a substrate for RUBISCO and other carboxylases, CO2 has a signalling role in plants, inducing physiological effects and, more notably, stomatal closure [25]. Furthermore, the progressive rise in atmospheric CO2 concentration is prompting interest in the study of the effects of changes in air [CO2] on plants, with the aim of modelling growth and production of plants in future climatic scenarios [26].
Mesophyll conductance to CO2 (gm) is routinely measured based on a combination of gas exchange and chlorophyll fluorescence techniques. Several environmental conditions such as light intensity and environmental stresses can affect gm [27]. Among other factors, gm is affected by ambient and leaf intercellular CO2 concentrations, showing both short-term and acclimation responses [28]. Taking into consideration that aquaporins facilitate the transport of CO2 beside water in the mesophyll cells [17,29,30], the question arises whether the regulation of gm by CO2 concentration may be mediated by changes in aquaporin expression or activity.
The goal of this work was to investigate whether different CO2 concentrations affect the gene expression of two tobacco aquaporins. We choose to study NtAQP1 because of its proven capacity to transport CO2 and because of its relatively low ability to transport water when expressed in Xenopus oocytes or yeast cells, and NtPIP2;1 which, in contrast, is characterized by large water transport rates and no CO2 facilitation in the same systems. In our in planta system, we show that gene expression for NtAQP1 positively responds to CO2 scarcity in the air, and on the contrary, gene expression for NtPIP2;1 is possibly related to water balance in the leaf, changing in parallel with stomatal conductance.

2. Results

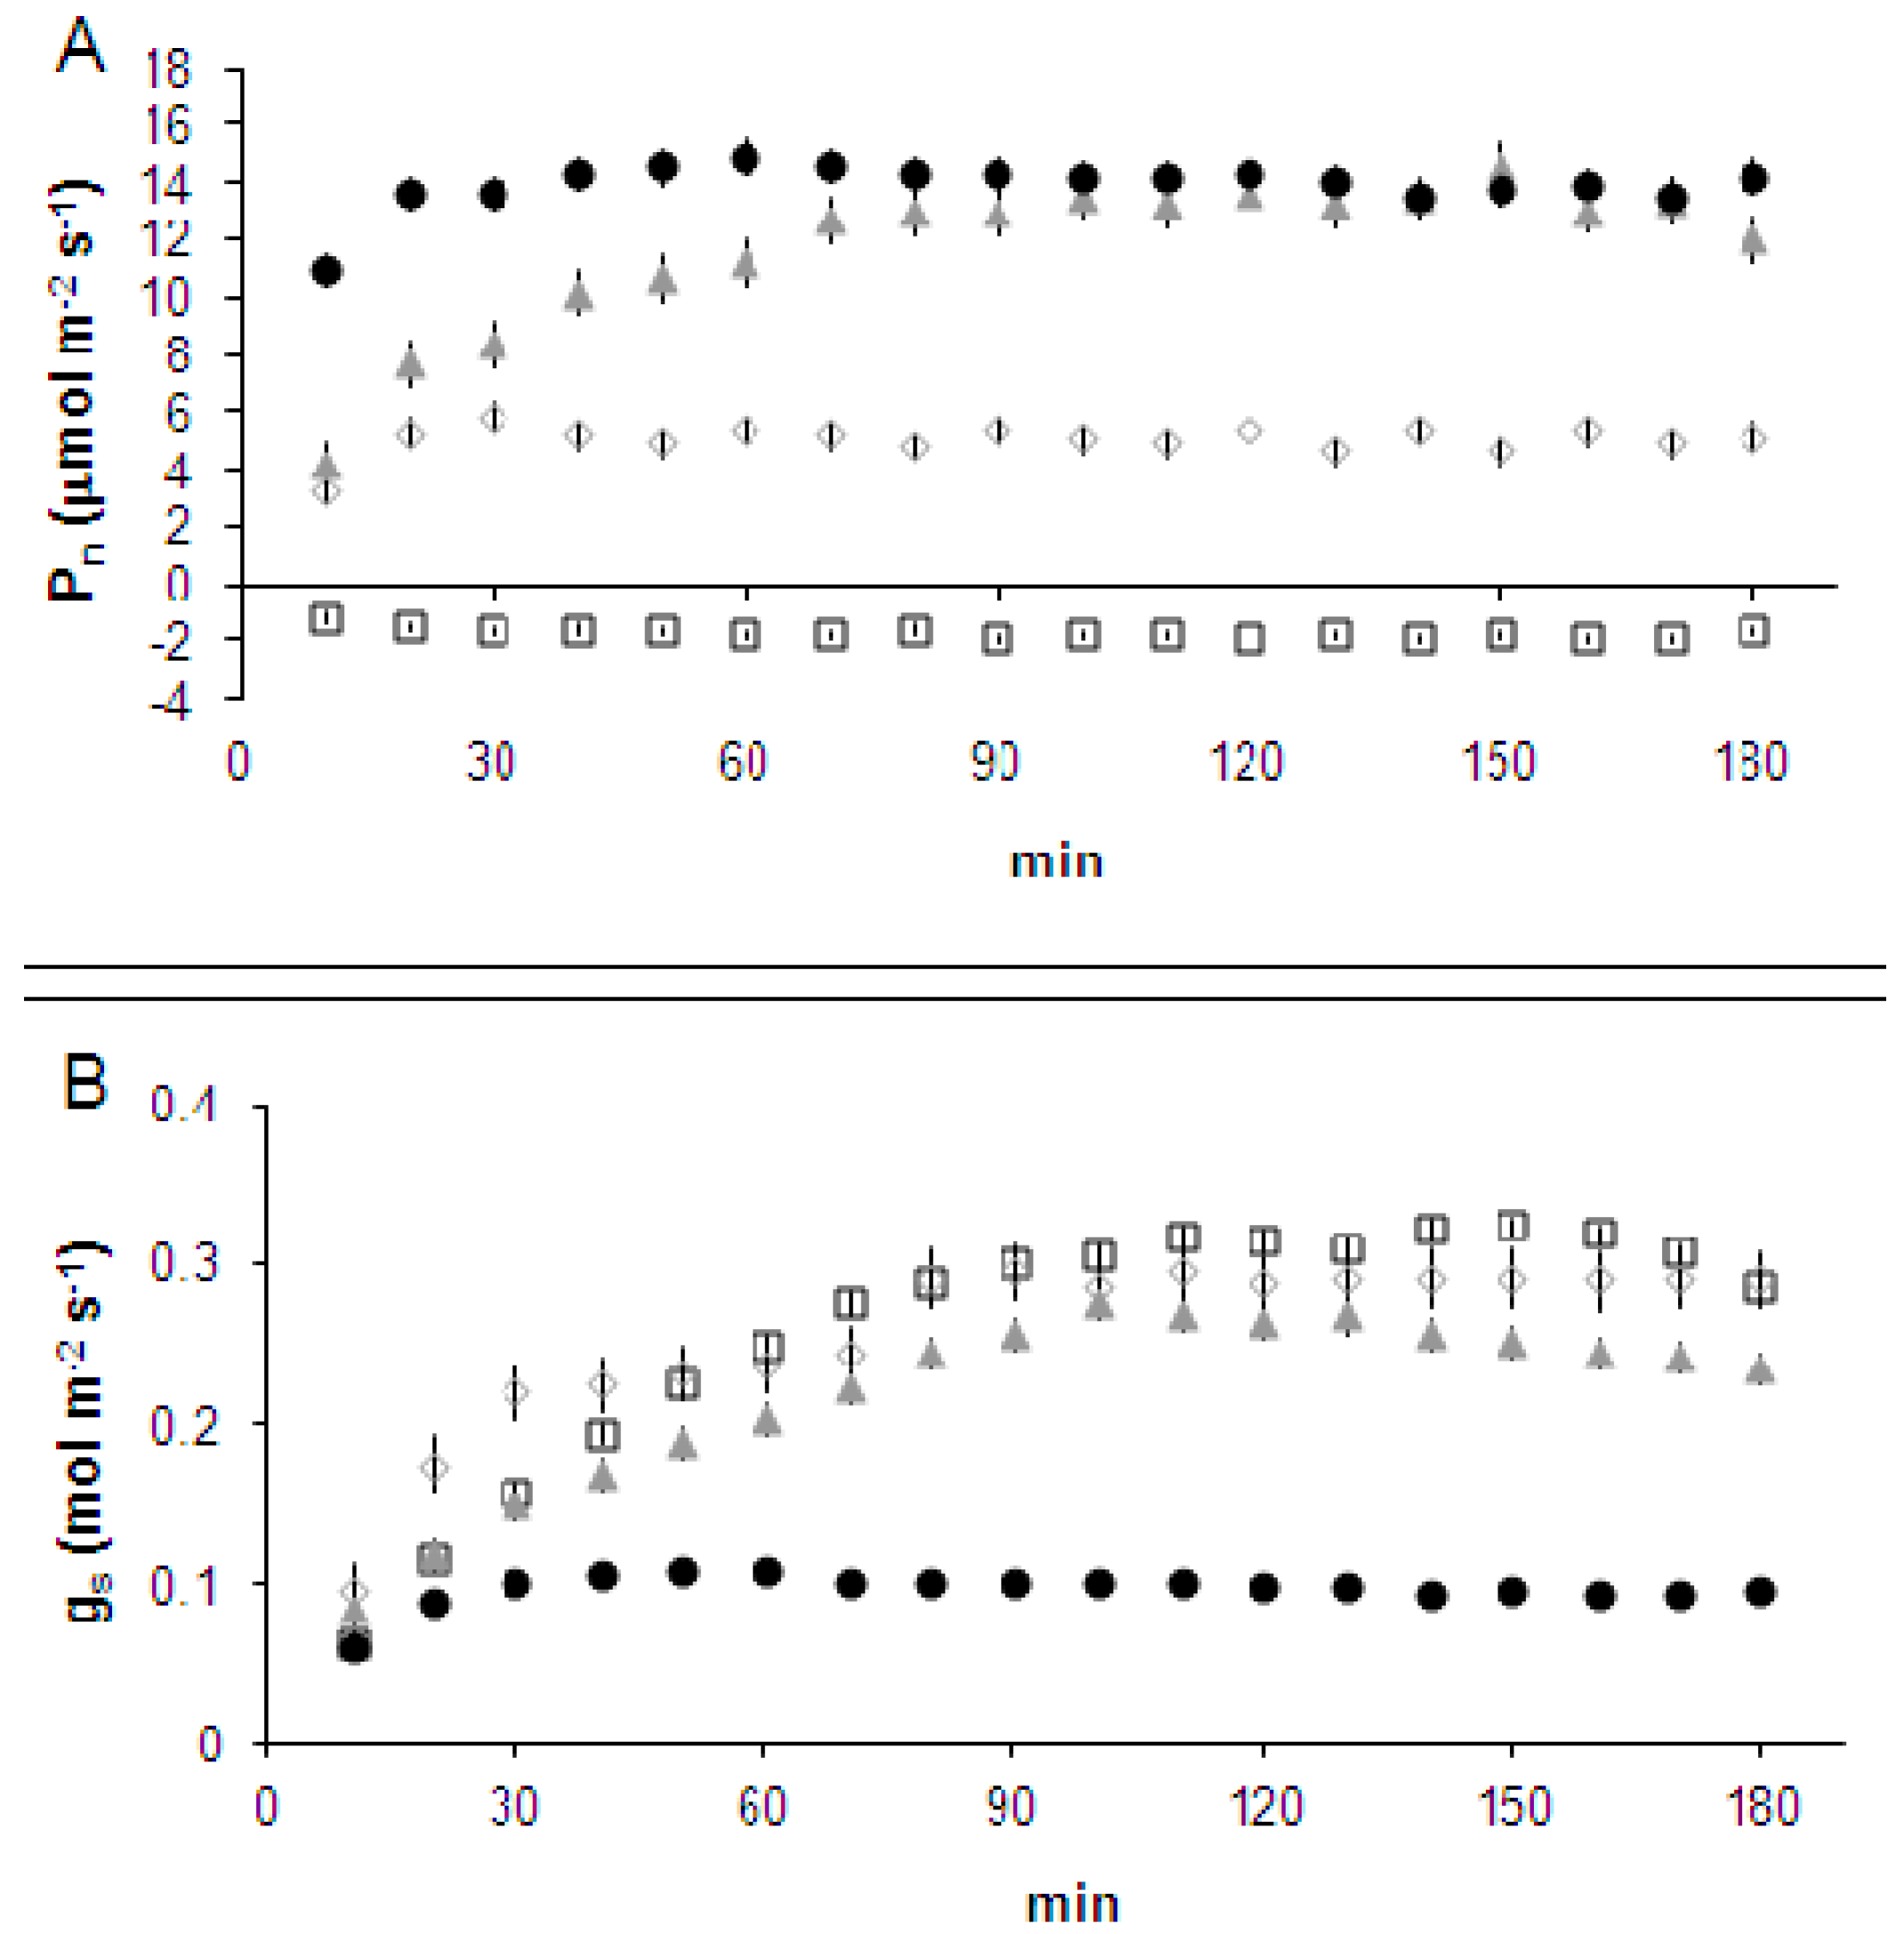
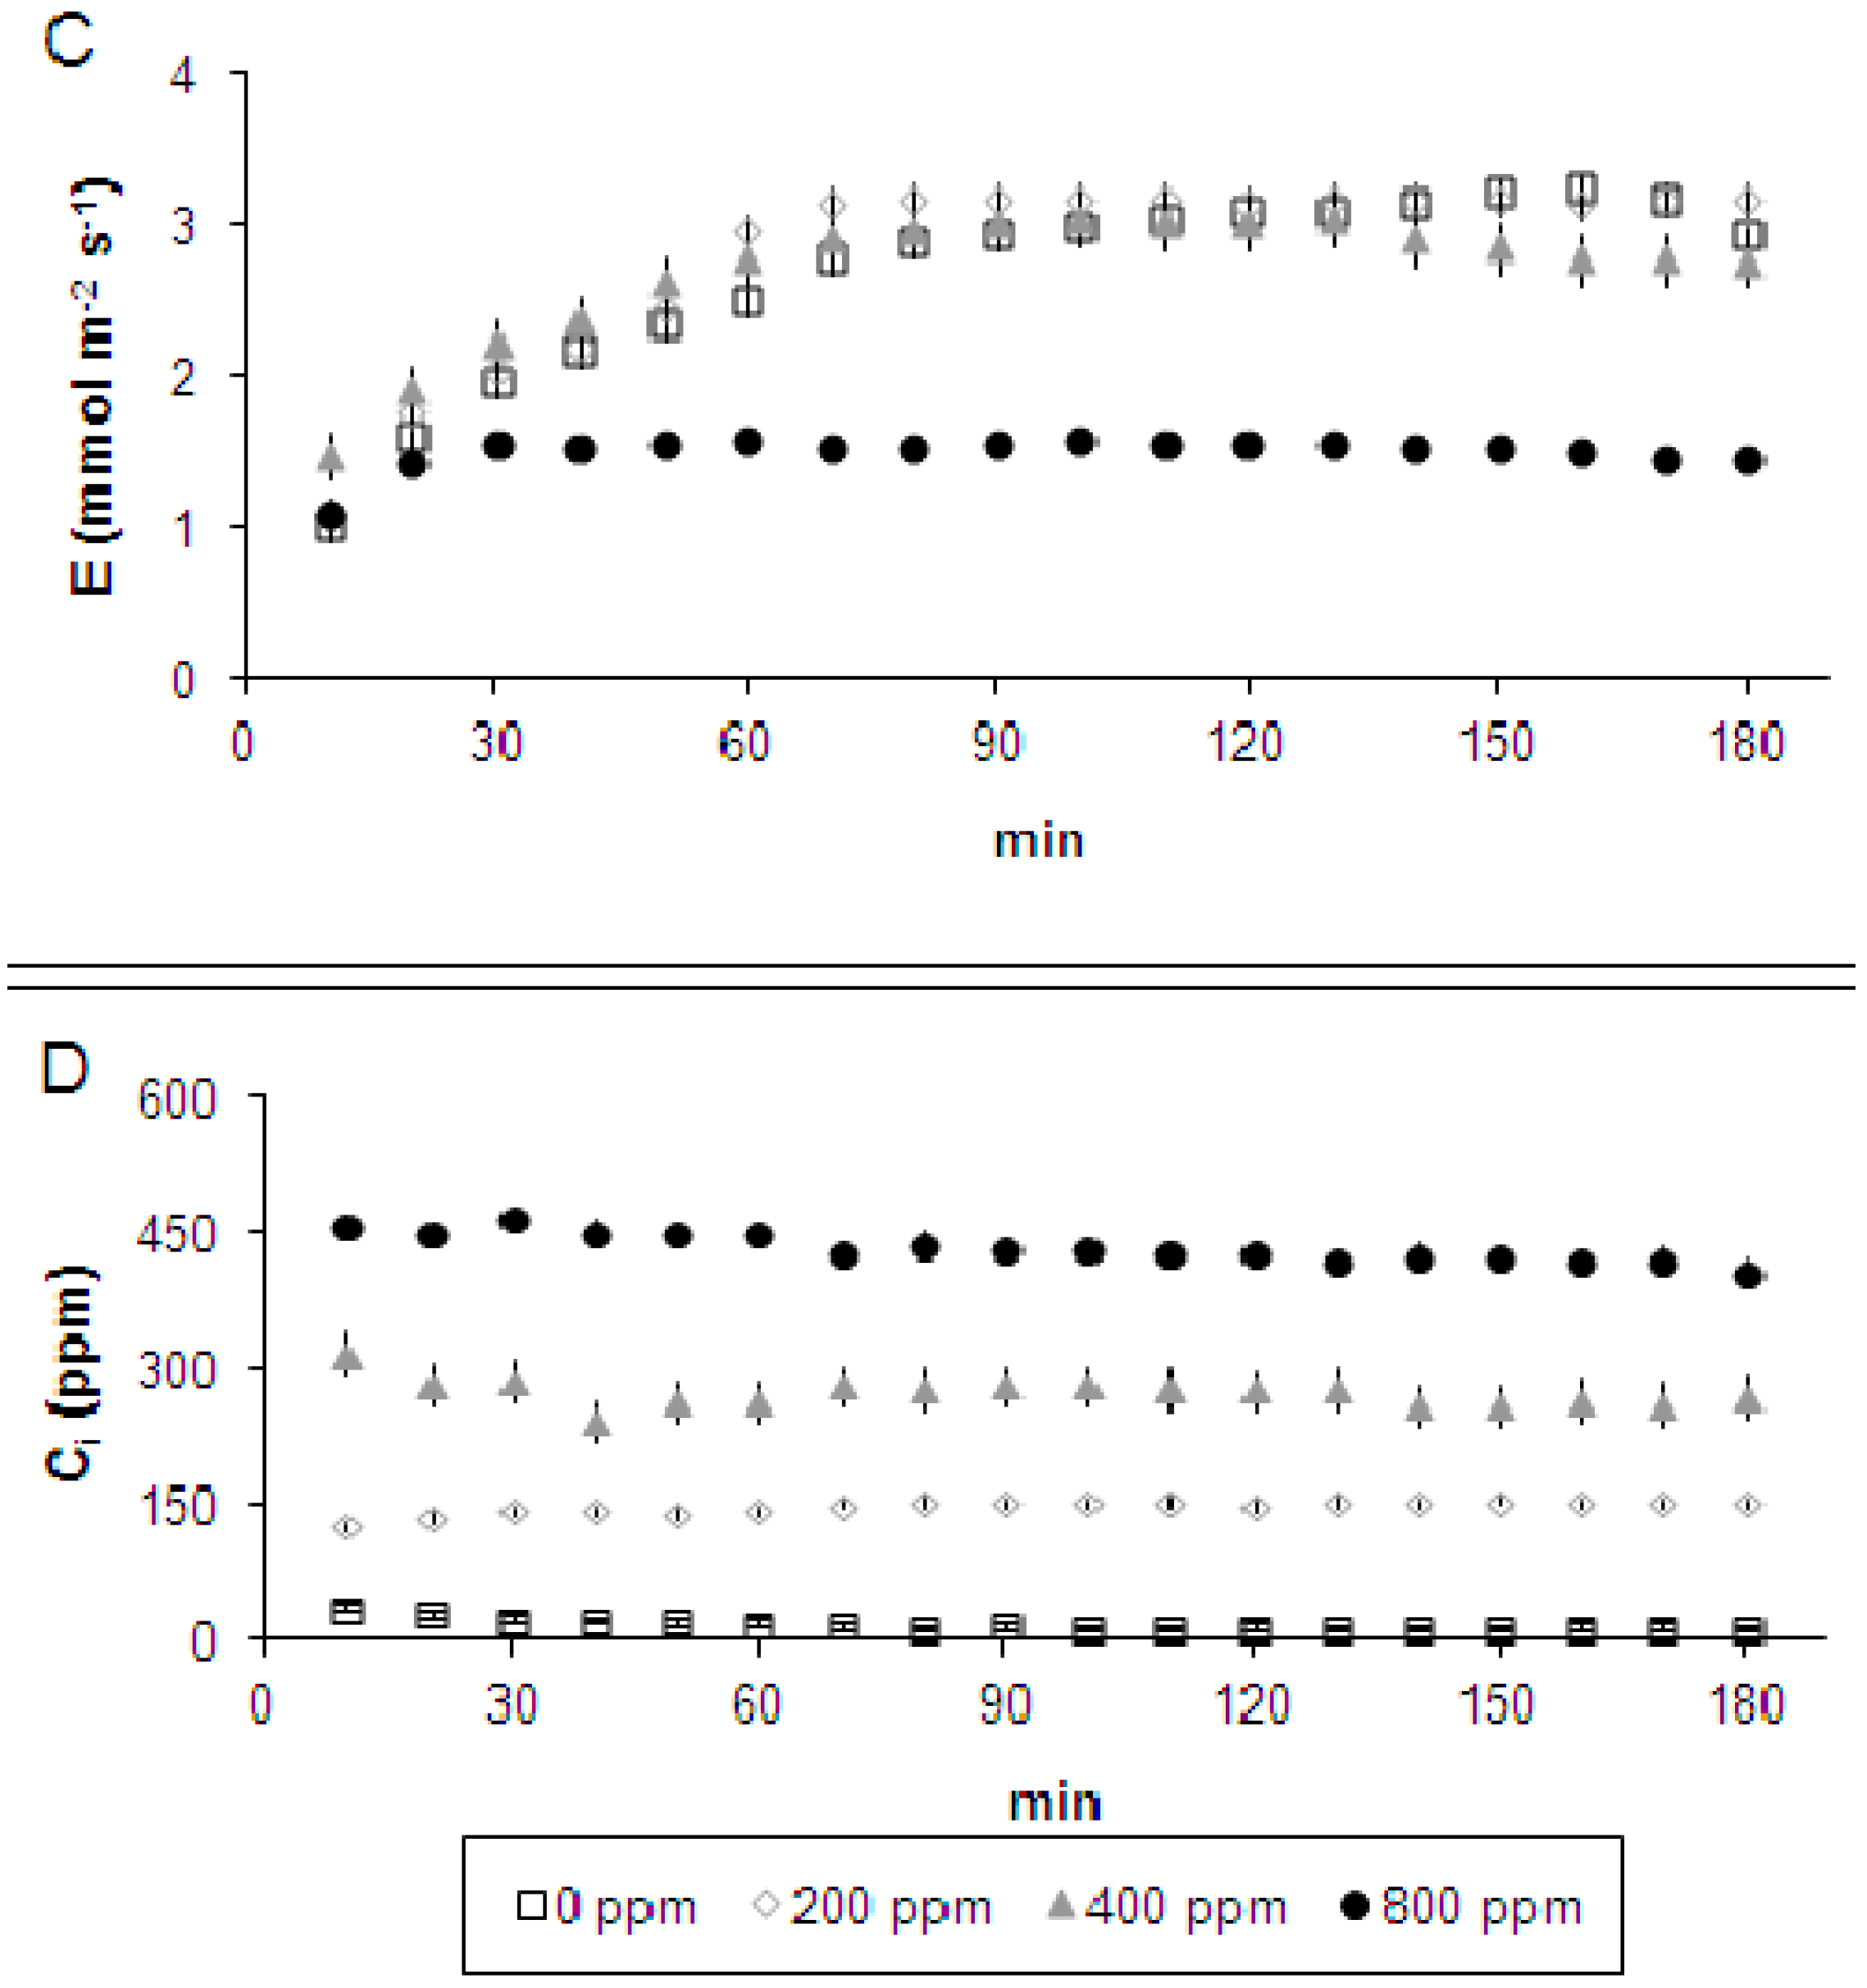
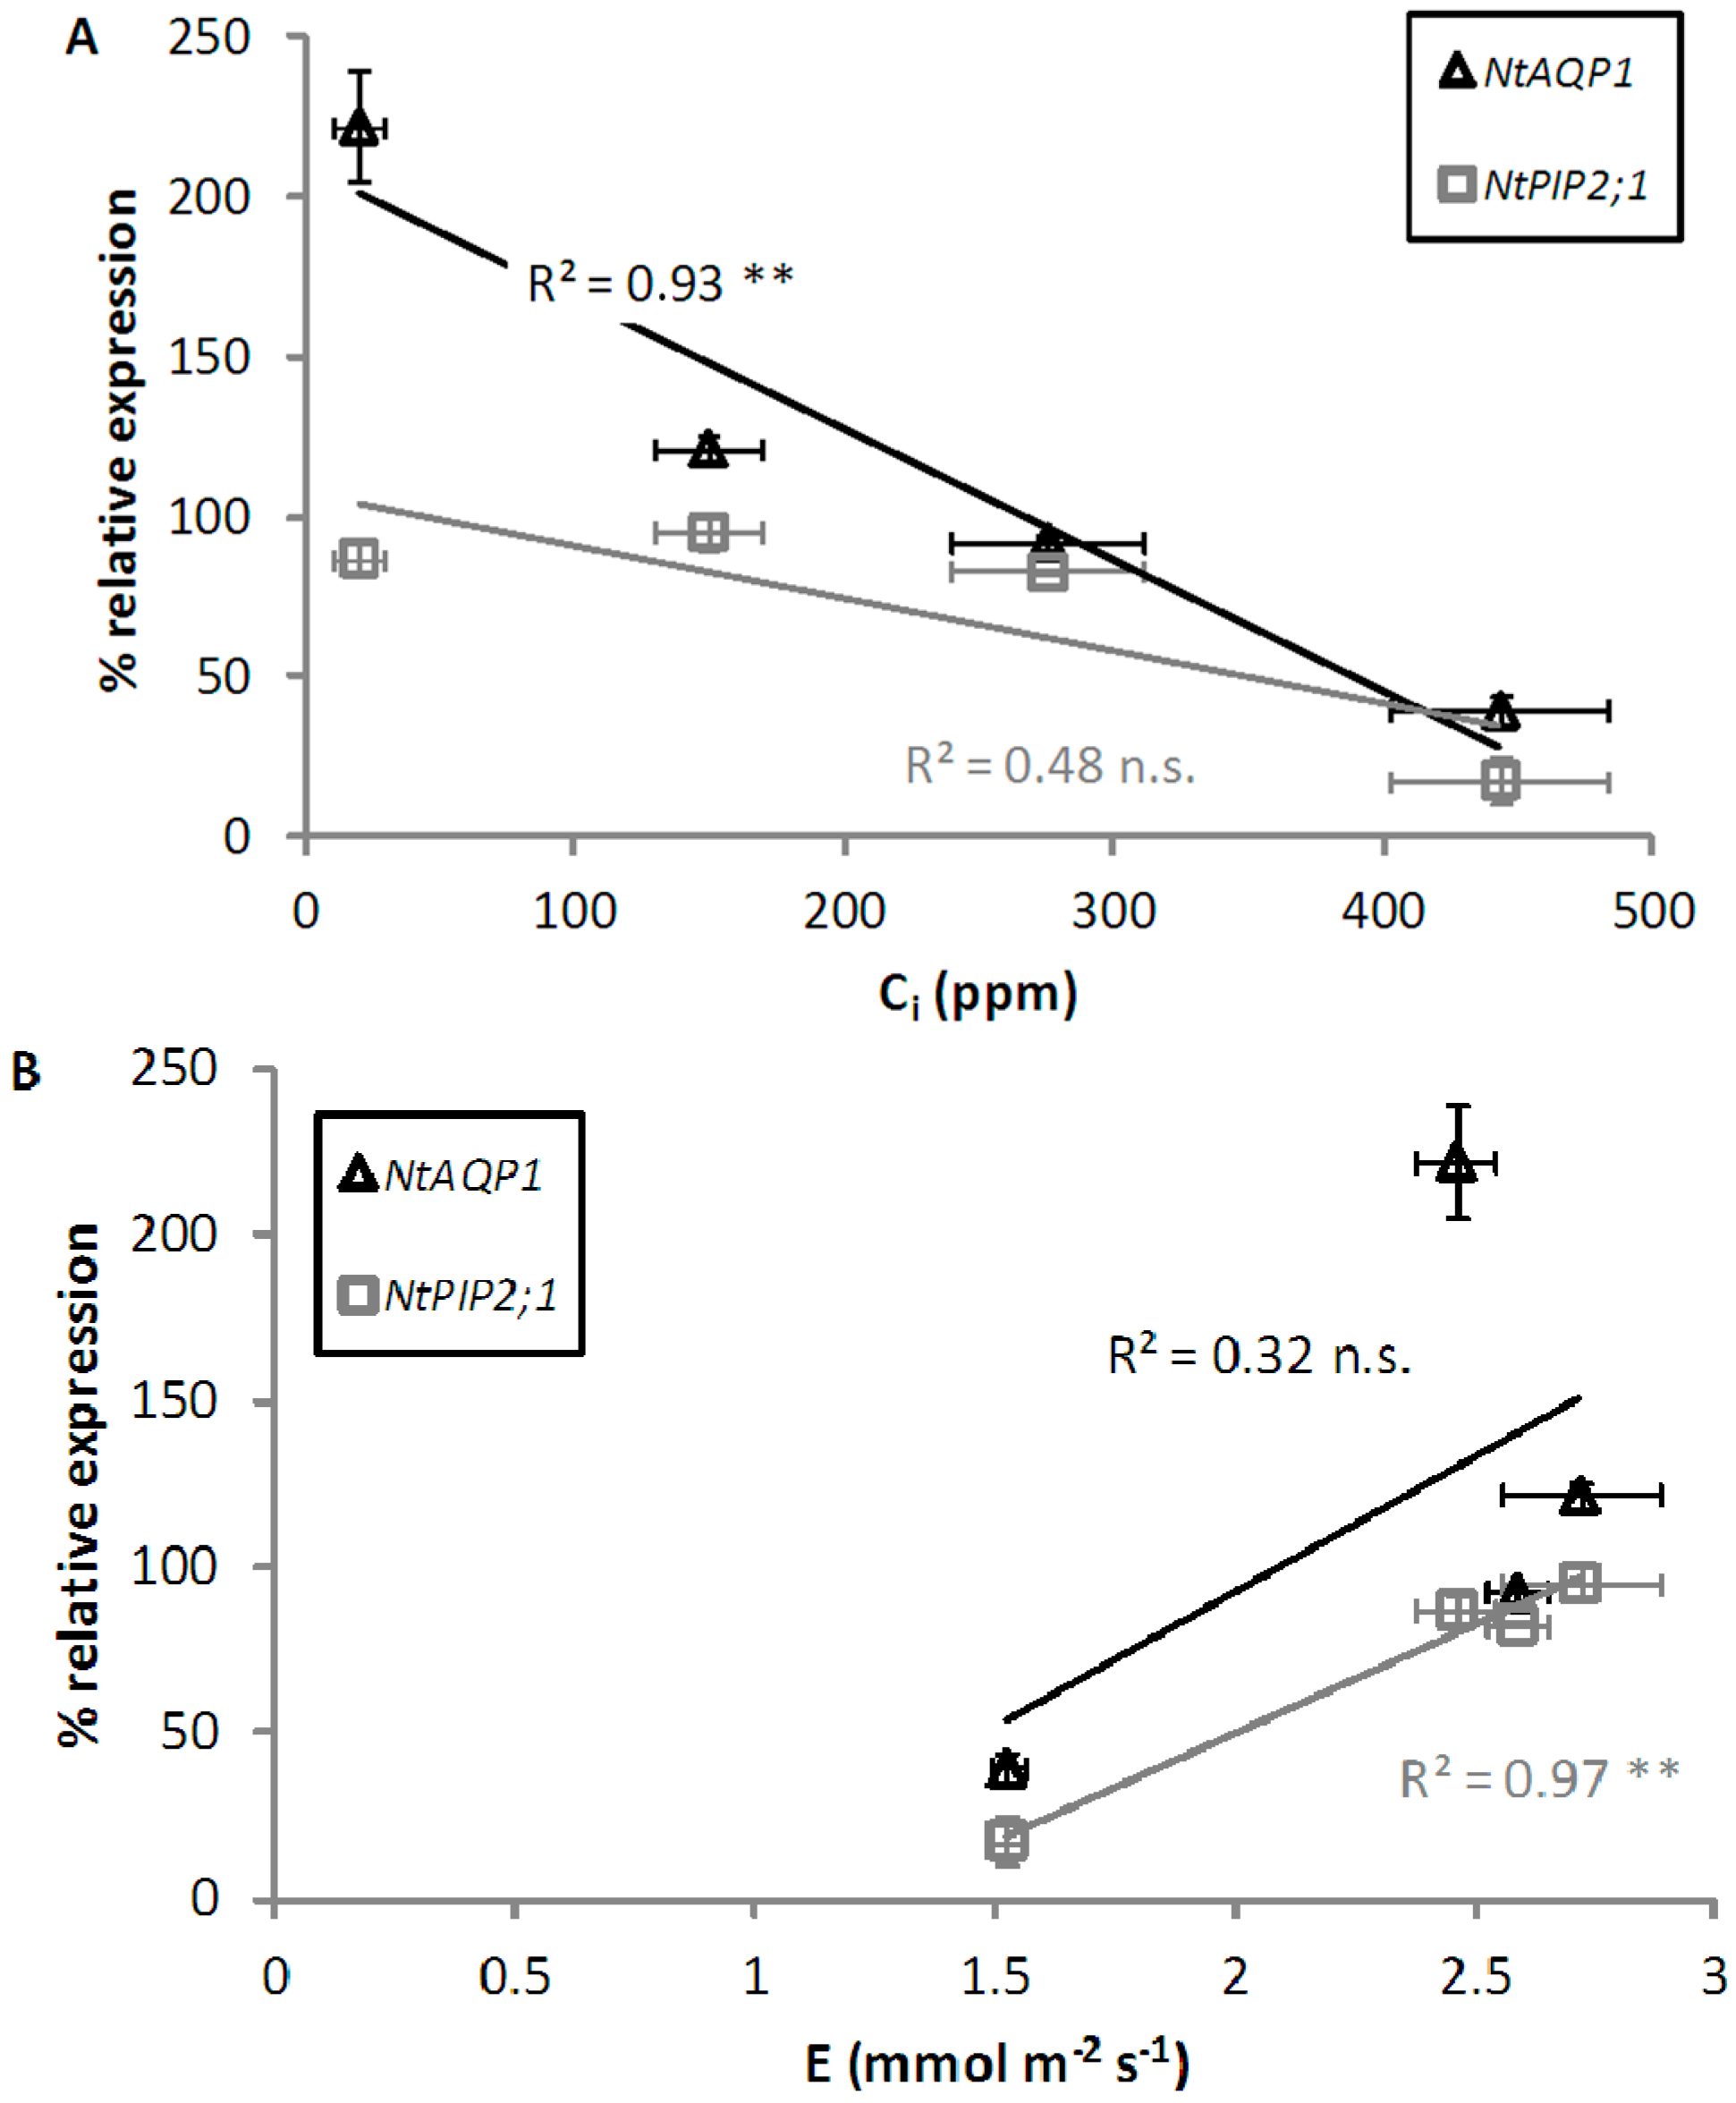
2.1. Leaf-to-Air Gas Exchange Responses to CO2 Enrichment and Impairment

Leaf portions enclosed in a sealed leaf chamber were exposed for up to three hours to air CO2 concentrations of, respectively, 0, 200, 400 and 800 ppm. Measurements taken in each of the three treatment periods did not significantly differ between each other at any time of measurement. After a short initial oscillation phase, the concentration of CO2 within the leaf chamber remained stable throughout the treatment period at values corresponding to those imposed, within ±3%. Leaf gas exchanges showed a period of adaptation for all treatments, as photosynthetic photon flux density (PPFD) in the greenhouse environment was about one-third that within the leaf chamber, and for this reason stomatal conductance (gs) and net photosynthesis (Pn) were low. At ambient [CO2] (400 ppm), the substomatal concentration (Ci) decreased within the first 30 min to a stable value of 275 ± 2.0 ppm. In this treatment gs increased during the first 90–100 min and slightly decreased during the following 80–90 min, inducing a similar pattern for leaf transpiration (E). Pn showed a trend similar to gs but the initial adaptation period ended after about 70 min, i.e., about 20 min before the end of the gs increase, in agreement with an expected metabolic feedback control of stomatal conductance. When leaves were fed at 800 ppm CO2, Ci was significantly higher than in control leaves (436 ± 2.0 ppm) and, as a consequence, maximum Pn was already reached in about 10 min. However, the increase in Ci also affected gs, which, after a brief increase, remained at about one-third that of ambient controls. As a consequence, even by doubling CO2 availability, we observed carbon assimilation values quite similar to those in ambient conditions. Following feeding 200 ppm CO2, Ci remained stable throughout the experiment at 150 ± 1.0 ppm, and Pn was about one-third of the maximum values recorded at both 400 and 800 ppm CO2. Although this is expected to release the Ci limitation of stomatal opening, gs was not significantly higher than in ambient controls, suggesting that maximum gs values recorded at both ambient and 800 ppm CO2 could not be exceeded, as limited by the PPFD. Water loss from the leaf, as estimated by E measurements, was similar in this treatment as compared to 400 ppm CO2. Feeding leaves with air containing zero CO2 induced a Ci very close to zero (19.1 ± 0.7 ppm). Also, in this case, gs did not increase more than observed at 200 ppm CO2 while Pn was, as expected, lower than zero. Transpiration followed the pattern dictated by gs, as in the 400 ppm CO2 treatment (Figure 1).

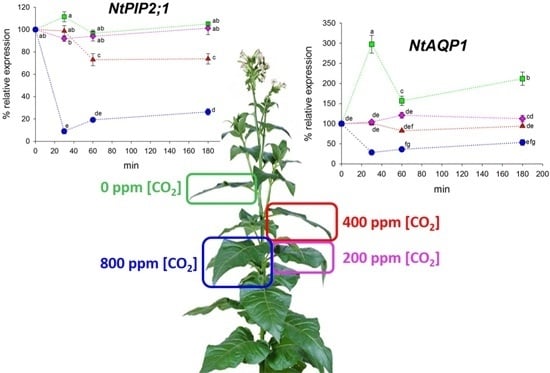
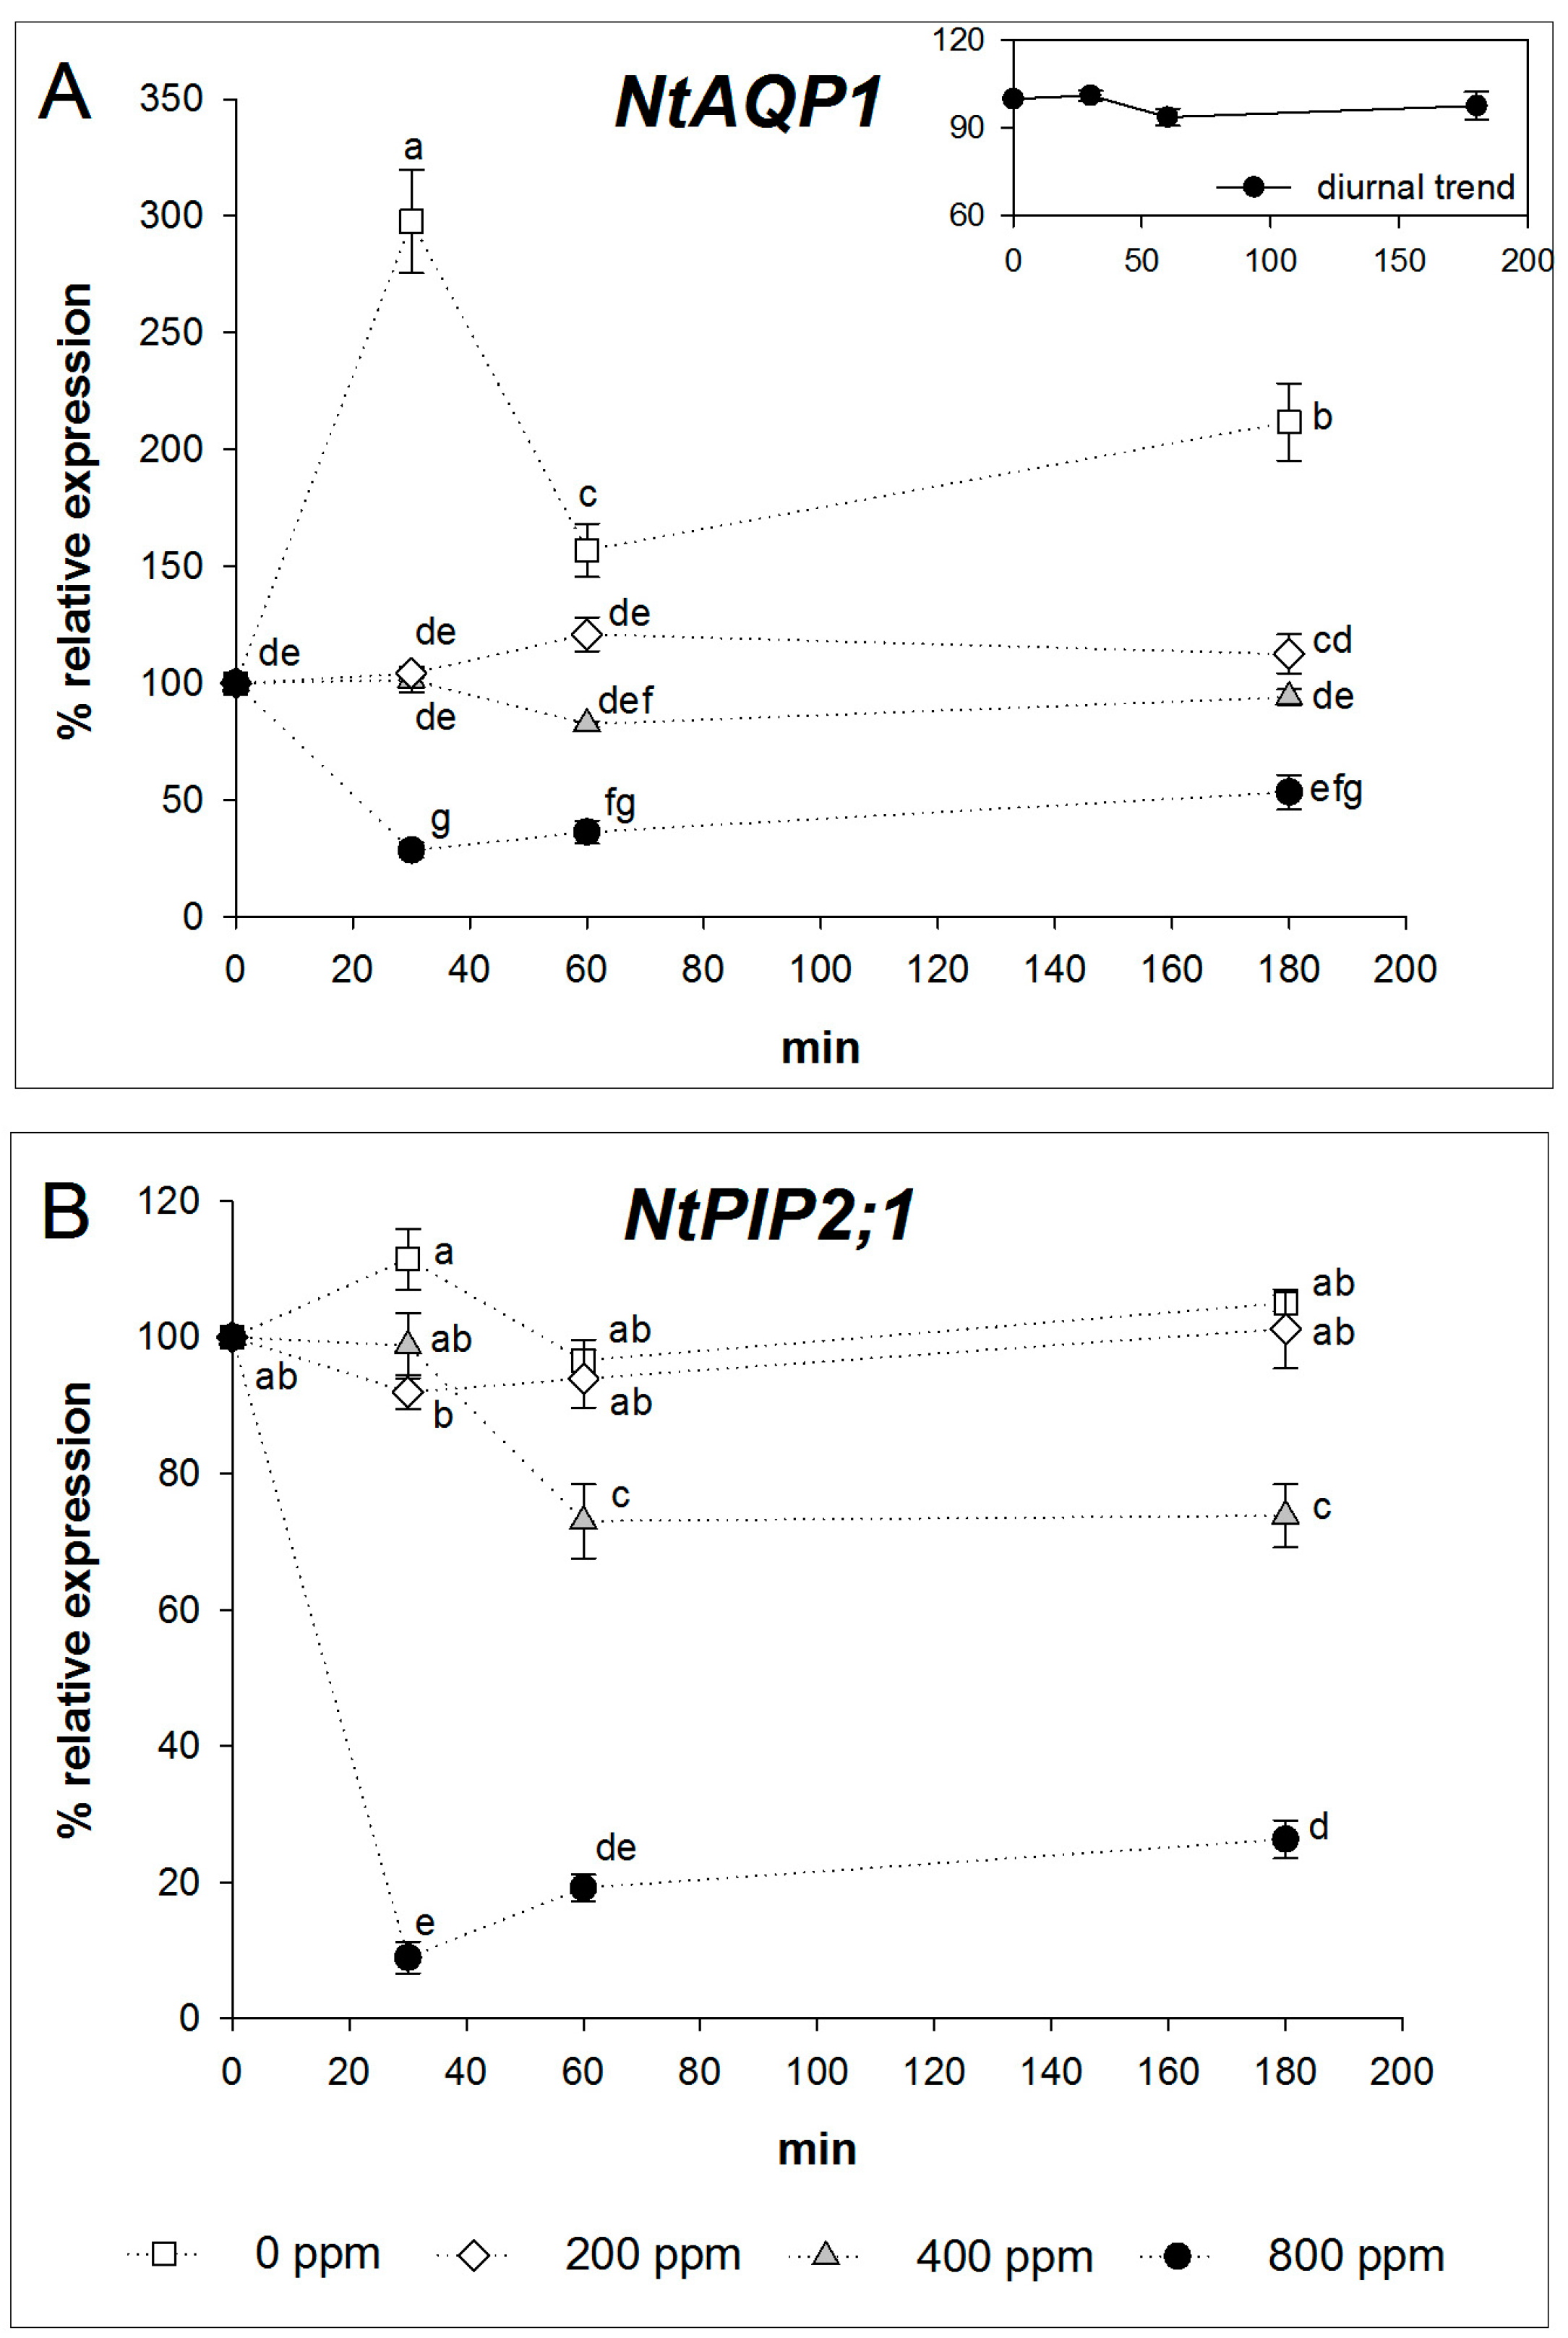
2.2. Expression Analysis of NtAQP1 and NtPIP2;1

Since it has been reported that the expression of aquaporins is under circadian regulation [31,32], we preliminarily monitored the expression level of NtAQP1 at ambient [CO2], during a time span of 4.5 h (from 10 a.m. to 2:30 p.m.). No transcript level difference among time points was observed (Figure 2A, inset).
NtAQP1 gene expression remained fairly constant after 30, 60 and 180 min of 400 ppm CO2 treatment. Treatment with 200 ppm CO2 induced a slight increase above control in transcript levels after 60 and 180 min from the start of experiment.
A marked and significant increase in NtAQP1 expression was observed in leaves treated with 0 ppm CO2: transcript abundance was increased three-fold after 30 min, 1.5-fold after 60 min, and two-fold after 180 min compared to the control values. On the contrary, the 800 ppm CO2 treatment reduced NtAQP1 expression compared to the control at all measurement times (Figure 2A).
Leaves fed with 400 ppm CO2 for 60 and 180 min showed a similar NtPIP2;1 transcript accumulation, about 20% lower than that measured after 30 min from starting the treatment. Treatments with air containing 200 and 0 ppm CO2 concentrations significantly increased the expression of NtPIP2;1, whereas a significant decrease in transcript levels compared to the control was observed in the 800 ppm CO2 treatment (Figure 2B).

3. Discussion

We have analysed the expression responses of two aquaporin genes in tobacco leaves treated with air containing different CO2 concentrations. Treatments were applied to the leaf patches enclosed by the gas exchange leaf chamber. The values of Ci were estimated using the model of von Caemmerer and Farquhar [33], which requires the input of Pn. It has been shown that lateral CO2 movement in homobaric leaves (such as those of tobacco) can take place if a CO2 gradient is present and that this movement can cause Pn values which are not correctly measured by gas exchange [34,35,36]. Indeed, some of our treatments induced a sharp CO2 gradient across the boundary between the projection of the leaf chamber and the rest of the leaf, thus potentially inducing alterations of Pn which would have not be measured by gas exchange and thus could have caused errors in the assessment of Ci. We are, however, confident that our Ci measurements reflected real intercellular CO2 concentrations as i) we used a relatively large leaf chamber (lateral CO2 movement extends in the order of a few millimeters [37]) and ii) the increases in Pn induced by lateral CO2 flow and not revealed by gas exchange measurement were not higher than 20% in leaf chambers ca. six times smaller than we used [34], and this would not radically change the Ci differences we measured between treatments.
Our results show that the expression of the aquaporin genes was inversely correlated to CO2 concentrations (Figure 3A). This relationship was relatively strict and significant for NtAQP1, and much less evident for NtPIP2;1. It is notable, even if physiologically not relevant, that at 0 ppm CO2, expression markedly increased compared to the control for the PIP1 gene, while it was only weakly affected in the case of NtPIP2;1. A possible mechanistic explanation of these results is that aquaporin (and in particular NtAQP1) expression is directly controlled by the CO2 concentration in the mesophyll cells, which is in equilibrium with substomatal air [CO2]. A regulative role of CO2 on plant gene expression has been reported for genes involved in a range of processes such as primary metabolism [38], ripening of fruits [39,40], and development of floral organs [41]. At present, there is only sporadic information about modifications of aquaporin gene expression in response to changing CO2 air concentration. A microarray analysis study following six years of exposure of poplar to 550 ppm [CO2] in a FACE (free-air CO2 enrichment) experiment [26] reported downregulation of aquaporin genes belonging to both the PIP1 and PIP2 subfamilies. The expression decrease reported by these authors was less pronounced than in our experiment, possibly due to acclimation effects, and to the fact that air [CO2] was about 550 ppm in the FACE experiment, while we fed leaves 800 ppm CO2.
Exposure of leaves to different air [CO2], however, also affects stomatal conductance, leaf evaporation, and may thus potentially induce localized water stress. Some of these parameters control aquaporin expression and thus the effect of changing air [CO2] could be indirect and mediated by these factors. Aquaporin expression is affected by hyperosmotic stresses such as water, salt, and cold stress. Our plants were well watered and soil water availability was strictly controlled, in order to keep leaf water potentials always high. No treatment induced stomatal opening above values measured in control (400 ppm) leaves, and thus the potential induction of local areas of lower water potential within the leaf chamber should be ruled out. Some reports suggest that leaf evaporation may control leaf or shoot aquaporin expression [42,43], possibly through accumulation of ABA in the evaporating tissues [44]. In our experiment, E was positively correlated with aquaporin expression, especially in the PIP2 gene, suggesting that expression could be positively controlled by E, besides the negative control exerted by CO2 (Figure 3B). Interestingly, the maximum transcript level for NtAQP1 was indeed achieved after 30 min at zero [CO2], when, due to the initial adaptation stage, E did not significantly differ among treatments.
Taking into account that NtAQP1, and not NtPIP2;1, shows CO2 transport facilitation properties [24], these observations fit in a model where upregulation of a CO2-transporting aquaporin is activated at low Ci and helps to maintain photosynthetic levels, while downregulation takes place in a situation where high Ci saturates photosynthesis and causes stomatal closure [25,45]. This pattern of regulation could have important functional implications in the facilitation of CO2 transport to the mesophyll cells. Transgenic over- or under-expression of aquaporins of the PIP1 and PIP2 subfamilies indeed affects gm in barley, tobacco and Arabidopsis leaves [14,15,46]. Changes of mesophyll CO2 conductance (gm) have been analyzed by Flexas et al. [28] in the 200–1000 ppm Ci range on tobacco leaves with an experimental setup similar to ours. Their results have a striking similarity to the changes in aquaporin gene expression we observed, and modifications of NtAQP1 expression in this experiment followed the same trend as gm in the cited paper.
In conclusion, expression of NtAQP1 negatively responds to air [CO2] in the whole range of 0–800 ppm. On the contrary, gene expression of NtPIP2;1, an aquaporin not facilitating CO2 transport, is little affected by air [CO2], and changes in parallel with transpiration. Our results suggest that expression of NtAQP1 may be an essential determinant of plant adaptation to changing air [CO2]. Aquaporins act as molecular compensatory mechanisms to environmental constraints [47,48,49]. To our knowledge, this is the first example of a compensatory role at the transcript level related to changing CO2 availability. At the post-transcriptional level, it is known that aquaporins are gated off by low pH [50]; exposing cells to high CO2 is also expected to lower the cytoplasmic pH, and this helps to deactivate aquaporins at a high level of air [CO2].

4. Materials and Methods

4.1. Plant Materials, CO2 Treatment and Gas Exchange Measurements

The experiment was carried out on leaves of Nicotiana tabacum L. cv. Samsun. Seeds were planted in trays on soil and after four weeks the plants were transplanted and kept in a shaded greenhouse in 3 L containers filled with a substrate composed of a sandy-loam soil/expanded clay/peat mixture (3:1:2). Photosynthetic photon flux density (PPFD) in the greenhouse averaged 120 μmol·m–2·s–1 at the beginning of the experiment and ambient CO2 concentration was 390 ppm.
Twenty-five (±2.1)-day-old tobacco leaves from 15 plants were used for both gas exchange measurements and expression analysis. Leaf portions (6.25 cm2) enclosed in a sealed chamber were continuously fed with air (200 mL·min–1) containing different CO2 concentrations such that CO2 concentration within the leaf chamber was respectively 0, 200, 400 and 800 ppm (four treatments in total), using an LCpro+ portable gas exchange system (ADC Bioscientific, Great Amwell, UK). Each treatment was subsequently applied for 30, 60 and 180 min on three consecutive leaves on the same plant in a single day from 10 a.m. to 2:30 p.m. ± 0.06 h and each treatment was carried out on three plants (n = 3). Measurements were completed within 12 successive days following a randomized distribution of the four treatments and of the three biological replicates (plants).
Gas exchange measurements were performed using the same LCpro+ portable gas exchange system, based on an open-flow gas circuit system equipped with microclimate control. H2O and CO2 concentrations at the inlet and outlet of the cuvette were measured using a differential infrared gas analyzer. The leaf chamber area was 6.25 cm2 and the PPFD above the leaf portion enclosed within the chamber was 350 μmol·m–2·s–1 PPFD. Leaf temperature was 26.2 ± 0.32 °C throughout the measurement time. Data were recorded at 2 min intervals throughout the treatment time. Sub-stomatal CO2 concentration (Ci) was calculated according to Farquhar et al. [33,45]. Data analysis and calculations were carried out using Microsoft Excel (Microsoft Corporation, Redmond, WT, USA).

4.2. RNA Extraction, cDNA Synthesis and Real Time PCR

Total RNA was extracted from three independent treated leaves collected from three plants from each treatment and (thus corresponding to three biological replicates for each treatment) according to the protocol described by Prescot et al. [51]. Further leaf samples (n = 3) were collected from three plants used as control for preliminarily monitoring the gene expression level at ambient [CO2], during a time span of 4.5 h (from 10 a.m. to 2:30 p.m.).
RNA yield and purity were determined spectrophometrically at A260 and A280, and its integrity checked by electrophoresis on an agarose gel. Contaminant genomic DNA was removed from the samples by digestion with RNase-free DNase I (Fermentas). cDNA was synthesized using SuperScript II Reverse Transcriptase (Invitrogen) according to supplier’s instruction, and the resulting cDNA was diluted and used as a template in PCR reactions.
Primer 3 program [52] was used to design specific primers: the forward primers were designed on the open reading frame (ORF) regions while the reverse primers on 3′-untranslated (UTR) regions. Primers were characterized by a length of 20–24 nucleotides, a predicted melting temperature (Tm) of 60–63 °C, and amplicon lengths of 100–130 base pairs (bp). The primer sequences used for gene expression analysis are listed in the Table 1.
Transcript abundance for NtAQP1 (GenBank AJ001416) and NtPIP2;1 (GenBank AF440272) genes in the leaves exposed to various CO2 treatments was quantify by real-time PCR with iQTM SYBR Green Master Mix (Bio-Rad, Hercules, CA, USA) on an ICycler Q apparatus (Bio-Rad, Foster City, CA, USA). Reactions were done in 20 μL final volumes containing 0.5 μM of each primer, 2 μL of cDNA appropriate dilution and 10 μL of 2× iQ™ SYBR Green Master Mix Reagent (Bio-Rad; containing 100 nM KCl, 40 mM Tris-HCl, pH 8.4, 0.4 mM dNTPs, 50 U/μL iTaq DNA polymerase, 6 mM MgCl2, 20 nM SYBR Green I, 20 nM fluorescein). PCR cycling program consisted of one cycle of 2 min at 95 °C, followed by 45 cycles of 95 °C for 15 s and 60 °C for 45 s, with a final melt gradient starting from 50 °C and heating to 95 °C at a rate of 0.5 °C·s–1. The efficiency of the primer set was evaluated by performing standard curve with five dilutions of cDNA and similar values were obtained.
The resulting data were analyzed using ICycler software (Bio-Rad, Foster City, CA, USA), and the values were normalized to the transcript levels of elongation factor 1α (EF1α) gene. In order to evaluate the stability of EF1α transcript abundance and its suitability as a housekeeping control, gene expression values were also normalized using actin as the reference gene. No significant changes were observed when data were normalized with any of the two different reference genes (data no shown). RT-PCR was carried out using three biological replicates for treatment and time; and three technical replicates were performed for each of the three biological sample.
The data were organized according to the “comparative threshold cycle” method [53] and the relative expression level of each gene in different conditions was referred to that of a calibrator gene set to 100 and represented by the expression value of leaves subjected to 400 ppm air [CO2] at time 0 (control samples).

4.3. Statistical Analysis

Data were analyzed with the Sigma Stat 2.0 (SPSS, Chicago, IL, USA) statistics 16 package. One-way ANOVA was used to test differences between experimental groups. We used Tukey’s test to make post-hoc pair-wise comparisons between means. Samples from leaves subjected to 400 ppm air [CO2] were considered as ambient control samples.

5. Conclusions

Gene expression for NtAQP1 positively responds to CO2 scarcity in the air in the whole range of 0–800 ppm. On the contrary, gene expression for NtPIP2;1, an aquaporin not facilitating CO2 transport, is related to water balance in the leaf, and changes in parallel with stomatal conductance.
Our results suggest that expression of NtAQP1 and NtPIP2;1 is an essential determinant of mesophyll conductance in tobacco under changing Ci. Further research is needed to verify whether gm and aquaporin expression are coupled also under changes in other environmental and physiological parameters. Aquaporins are known to act as a molecular compensatory mechanism of morphological and/or functional constraints [47,48,49]. However, to our knowledge, this is the first example of a compensatory enhancement of aquaporin expression related to changing CO2 availability.
Our observations could fit in a model where upregulation of CO2-transporting aquaporins can be activated at low internal [CO2] (Ci), thus helping to maintain photosynthetic levels, while down-regulation takes place in a situation where high Ci saturates photosynthesis and causes stomatal closure. As the expression of aquaporin genes in leaves addresses plant regulation upon abiotic stress [44,54], the aquaporin-specific control on water versus carbon pathways in leaves [30] will possibly drive future research in this topic [55].

Acknowledgments

We are grateful to Gabriele Viretto for help in gas exchange measurements and to Ralf Kaldenhoff for helpful discussions. Francesca Secchi acknowledges funding from “Programma Giovani Ricercatori Rita Levi Montalcini” grant.

Author Contributions

Francesca Secchi performed molecular experiments, wrote the initial manuscript draft and participated in performing physiological analyses. Andrea Schubert improved former version of the manuscript, participated in the organization of the studies, in data interpretation and finalization of this manuscript. Claudio Lovisolo performed the physiological analyses and participated in the organization of the studies, in data interpretation and finalization of the manuscript. All authors read and approved the final manuscript.

Conflicts of Interest

The authors declare no conflict of interest.

Abbreviations

Ci
leaf internal (substomatal) CO2 concentration
Gs
stomatal conductance
Pn
leaf net photosynthesis
E
transpiration rate
ANOVA
analysis of variance

References

  1. Kaldenhoff, R.; Ribas-Carbo, M.; Flexas, J.; Lovisolo, C.; Heckwolf, M.; Uehlein, N. Aquaporins and plant water balance. Plant Cell Environ. 2008, 31, 658–666. [Google Scholar] [CrossRef] [PubMed]
  2. Maurel, C.; Boursiac, Y.; Luu, D.T.; Santoni, V.; Shahzad, Z.; Verdoucq, L. Aquaporins in plants. Physiol. Rev. 2015, 95, 1321–1358. [Google Scholar] [CrossRef] [PubMed]
  3. Hirano, Y.; Okimoto, N.; Kadohira, I.; Suematsu, M.; Yasuoka, K.; Yasui, M. Molecular mechanisms of how mercury inhibits water permeation through Aquaporin1: Understanding by molecular dynamics simulation. Biophys. J. 2010, 98, 1512–1519. [Google Scholar] [CrossRef] [PubMed]
  4. Hachez, C.; Zelazny, E.; Chaumont, F. Modulating the expression of aquaporin genes in planta: A key to understand their physiological functions? Biochim. Biophys. Acta 2006, 1758, 1142–1156. [Google Scholar] [CrossRef] [PubMed]
  5. Perrone, I.; Gambino, G.; Chitarra, W.; Vitali, M.; Pagliarani, C.; Riccomagno, N.; Balestrini, R.; Kaldenhoff, R.; Uehlein, N.; Gribaudo, I.; et al. The Grapevine Root-Specific Aquaporin VvPIP2;4N Controls Root Hydraulic Conductance and Leaf Gas Exchange under Well-Watered Conditions But Not under Water Stress. Plant Physiol. 2012, 160, 965–977. [Google Scholar] [CrossRef] [PubMed]
  6. Secchi, F.; Zwieniecki, M.A. The physiological response of Populus tremula x alba leaves to the down-regulation of PIP1 aquaporin gene expression under no water stress. Front. Plant Sci. 2013, 4, 507. [Google Scholar] [CrossRef] [PubMed]
  7. Secchi, F.; Zwieniecki, M.A. Down-Regulation of Plasma Intrinsic Protein1 Aquaporin in Poplar Trees Is Detrimental to Recovery from Embolism. Plant Physiol. 2014, 164, 1789–1799. [Google Scholar] [CrossRef] [PubMed]
  8. Lopez, D.; Bronner, G.; Brunel, N.; Auguin, D.; Bourgerie, S.; Brignolas, F.; Carpin, S.; Tournaire-Roux, C.; Maurel, C.; Fumanal, B.; et al. Insights into Populus XIP aquaporins: Evolutionary expansion, protein functionality, and environmental regulation. J. Exp. Bot. 2012, 63, 2217–2230. [Google Scholar] [CrossRef] [PubMed] [Green Version]
  9. Uehlein, N.; Sperling, H.; Heckwolf, M.; Kaldenhoff, R. The Arabidopsis aquaporin PIP1;2 rules cellular CO2 uptake. Plant Cell Environ. 2012, 35, 1077–1083. [Google Scholar] [CrossRef] [PubMed]
  10. Mori, I.C.; Rhee, J.; Shibasaka, M.; Sasano, S.; Kaneko, T.; Horie, T.; Katsuhara, M. CO2 Transport by PIP2 Aquaporins of Barley. Plant Cell Physiol. 2014, 55, 251–257. [Google Scholar] [CrossRef] [PubMed]
  11. Terashima, I.; Ono, K. Effects of HgCl2 on CO2 dependence of leaf photosynthesis: Evidence indicating involvement of aquaporins in CO2 diffusion across the plasma membrane. Plant Cell Physiol. 2002, 43, 70–78. [Google Scholar] [CrossRef] [PubMed]
  12. Uehlein, N.; Lovisolo, C.; Siefritz, F.; Kaldenhoff, R. The tobacco aquaporin NtAQP1 is a membrane CO2 pore with physiological functions. Nature 2003, 425, 734–737. [Google Scholar] [CrossRef] [PubMed]
  13. Uehlein, N.; Otto, B.; Hanson, D.T.; Fischer, M.; McDowell, N.; Kaldenhoff, R. Function of Nicotiana tabacum aquaporins as chloroplast gas pores challenges the concept of membrane CO2 permeability. Plant Cell 2008, 20, 648–657. [Google Scholar] [CrossRef] [PubMed]
  14. Hanba, Y.T.; Shibasaka, M.; Hayashi, Y.; Hayakawa, T.; Kasamo, K.; Terashima, I.; Katsuhara, M. Overexpression of the barley aquaporin HvPIP2;1 increases internal CO2 conductance and CO2 assimillation in the leaves of transgenic rice plants. Plant Cell Physiol. 2004, 45, 521–529. [Google Scholar] [CrossRef] [PubMed]
  15. Flexas, J.; Ribas-Carbo, M.; Hanson, D.T.; Bota, J.; Otto, B.; Cifre, J.; McDowell, N.; Medrano, H.; Kaldenhoff, R. Tobacco aquaporin NtAQP1 is involved in mesophyll conductance to CO2 in vivo. Plant J. 2006, 48, 427–439. [Google Scholar] [CrossRef] [PubMed]
  16. Heckwolf, M.; Pater, D.; Hanson, D.T.; Kaldenhoff, R. The Arabidopsis thaliana aquaporin AtPIP1;2 is a physiologically relevant CO2 transport facilitator. Plant J. 2011, 67, 795–804. [Google Scholar] [CrossRef] [PubMed]
  17. Sade, N.; Galle, A.; Flexas, J.; Lerner, S.; Peleg, G.; Yaaran, A.; Moshelion, M. Differential tissue-specific expression of NtAQP1 in Arabidopsis thaliana reveals a role for this protein in stomatal and mesophyll conductance of CO2 under standard and salt-stress conditions. Planta 2014, 239, 357–366. [Google Scholar] [CrossRef] [PubMed]
  18. Evans, J.R.; Kaldenhoff, R.; Genty, B.; Terashima, I. Resistances along the CO2 diffusion pathway inside leaves. J. Exp. Bot. 2009, 60, 2235–2248. [Google Scholar] [CrossRef] [PubMed]
  19. Otto, B.; Kaldenhoff, R. Cell-specific expression of the mercury-insensitive plasma-membrane aquaporin NtAQP1 from Nicotiana tabacum. Planta 2000, 211, 167–172. [Google Scholar] [PubMed]
  20. Biela, A.; Grote, K.; Otto, B.; Hoth, S.; Hedrich, R.; Kaldenhoff, R. The Nicotiana tabacum plasma membrane aquaporin NtAQP1 is mercury-insensitive and permeable for glycerol. Plant J. 1999, 18, 565–570. [Google Scholar] [CrossRef] [PubMed]
  21. Bots, M.; Feron, R.; Uehlein, N.; Weterings, K.; Kaidenhoff, R.; Mariani, T. PIP1 and PIP2 aquaporins are differentially expressed during tobacco anther and stigma development. J. Exp. Bot. 2005, 56, 113–121. [Google Scholar] [CrossRef] [PubMed]
  22. Mahdieh, M.; Mostajeran, A.; Horie, T.; Katsuhara, M. Drought stress alters water relations and expression of PIP-type aquaporin genes in Nicotiana tabacum plants. Plant Cell Physiol. 2008, 49, 801–813. [Google Scholar] [CrossRef] [PubMed]
  23. Mahdieh, M.; Mostajeran, A. Abscisic acid regulates root hydraulic conductance via aquaporin expression modulation in Nicotiana tabacum. J. Plant Physiol. 2009, 166, 1993–2003. [Google Scholar] [CrossRef] [PubMed]
  24. Otto, B.; Uehlein, N.; Sdorra, S.; Fischer, M.; Ayaz, M.; Belastegui-Macadam, X.; Heckwolf, M.; Lachnit, M.; Pede, N.; Priem, N.; et al. Aquaporin Tetramer Composition Modifies the Function of Tobacco Aquaporins. J. Biol. Chem. 2010, 285, 31253–31260. [Google Scholar] [CrossRef] [PubMed]
  25. Mott, K.A. Sensing of atmospheric CO2 by plants. Plant Cell Environ. 1990, 13, 731–737. [Google Scholar] [CrossRef]
  26. Taylor, G.; Street, N.R.; Tricker, P.J.; Sjodin, A.; Graham, L.; Skogstrom, O.; Calfapietra, C.; Scarascia-Mugnozza, G.; Jansson, S. The transcriptome of Populus in elevated CO2. New Phytol. 2005, 167, 143–154. [Google Scholar] [CrossRef] [PubMed]
  27. Niinemets, U.; Diaz-Espejo, A.; Flexas, J.; Galmes, J.; Warren, C.R. Role of mesophyll diffusion conductance in constraining potential photosynthetic productivity in the field. J. Exp. Bot. 2009, 60, 2249–2270. [Google Scholar] [CrossRef] [PubMed]
  28. Flexas, J.; Diaz-Espejo, A.; Galmes, J.; Kaldenhoff, R.; Medrano, H.; Ribas-Carbo, M. Rapid variations of mesophyll conductance in response to changes in CO2 concentration around leaves. Plant Cell Environ. 2007, 30, 1284–1298. [Google Scholar] [CrossRef] [PubMed]
  29. Miyazawa, S.; Yoshimura, S.; Shinzaki, Y.; Maeshima, M.; Miyake, C. Deactivation of aquaporins decreases internal conductance to CO2 diffusion in tobacco leaves grown under long-term drought. Funct. Plant Biol. 2008, 35, 553–564. [Google Scholar] [CrossRef]
  30. Ferrio, J.P.; Pou, A.; Florez-Sarasa, I.; Gessler, A.; Kodama, N.; Flexas, J.; Ribas-Carbo, M. The Peclet effect on leaf water enrichment correlates with leaf hydraulic conductance and mesophyll conductance for CO2. Plant Cell Environ. 2012, 35, 611–625. [Google Scholar] [CrossRef] [PubMed]
  31. Lopez, M.; Bousser, A.S.; Sissoeff, I.; Gaspar, M.; Lachaise, B.; Hoarau, J.; Mahe, A. Diurnal regulation of water transport and aquaporin gene expression in maize roots: Contribution of PIP2 proteins. Plant Cell Physiol. 2003, 44, 1384–1395. [Google Scholar] [CrossRef] [PubMed]
  32. Siefritz, F.; Otto, B.; Bienert, G.P.; van der Krol, A.; Kaldenhoff, R. The plasma membrane aquaporin NtAQP1 is a key component of the leaf unfolding mechanism in tobacco. Plant J. 2004, 37, 147–155. [Google Scholar] [CrossRef] [PubMed]
  33. Von Caemmerer, S.; Farquhar, G.D. Some relationships between the biochemistry of photosynthesis and the gas exchange of leaves. Planta 1981, 153, 376–387. [Google Scholar] [CrossRef] [PubMed]
  34. Pieruschka, R.; Schurr, U.; Jensen, M.; Wolff, W.F.; Jahnke, S. Lateral diffusion of CO2 from shaded to illuminated leaf parts affects photosynthesis inside homobaric leaves. New Phytol. 2006, 169, 779–787. [Google Scholar] [CrossRef] [PubMed]
  35. Morison, J.I.L.; Gallouet, E.; Lawson, T.; Cornic, G.; Herbin, R.; Baker, N.R. Lateral diffusion of CO2 in leaves is not sufficient to support photosynthesis. Plant Physiol. 2005, 139, 254–266. [Google Scholar] [CrossRef] [PubMed]
  36. Morison, J.I.L.; Lawson, T.; Cornic, G. Lateral CO2 diffusion inside dicotyledonous leaves can be substantial: Quantification in different light intensities. Plant Physiol. 2007, 145, 680–690. [Google Scholar] [CrossRef] [PubMed]
  37. Pieruschka, R.; Chavarria-Krauser, A.; Cloos, K.; Scharr, H.; Schurr, U.; Jahnke, S. Photosynthesis can be enhanced by lateral CO2 diffusion inside leaves over distances of several millimeters. New Phytol. 2008, 178, 335–347. [Google Scholar] [CrossRef] [PubMed]
  38. Ainsworth, E.A.; Rogers, A.; Vodkin, L.O.; Walter, A.; Schurr, U. The effects of elevated CO2 concentration on soybean gene expression. An analysis of growing and mature leaves. Plant Physiol. 2006, 142, 135–147. [Google Scholar] [CrossRef] [PubMed]
  39. Rothan, C.; Duret, S.; Chevalier, C.; Raymond, P. Suppression of ripening-associated gene expression in tomato fruits subjected to a high CO2 concentration. Plant. Physiol. 1997, 114, 255–263. [Google Scholar] [PubMed]
  40. Fernandez-Caballero, C.; Rosales, R.; Romero, I.; Escribano, M.I.; Merodio, C.; Sanchez-Ballesta, M.T. Unraveling the roles of CBF1, CBF4 and dehydrin 1 genes in the response of table grapes to high CO2 levels and low temperature. J. Plant Physiol. 2012, 169, 744–748. [Google Scholar] [CrossRef] [PubMed]
  41. Springer, C.J.; Orozco, R.A.; Kelly, J.K.; Ward, J.K. Elevated CO2 influences the expression of floral-initiation genes in Arabidopsis thaliana. New Phytol. 2008, 178, 63–67. [Google Scholar] [CrossRef] [PubMed]
  42. Galmés, J.; Pou, A.; Alsina, M.M.; Tomàs, M.; Medrano, H.; Flexas, J. Aquaporin expression in response to different water stress intensities and recovery in Richter-110 (Vitis sp.): Relationship with ecophysiological status. Planta 2007, 226, 671–681. [Google Scholar] [CrossRef] [PubMed]
  43. Secchi, F.; Lovisolo, C.; Uehlein, N.; Kaldenhoff, R.; Schubert, A. Isolation and functional characterization of three aquaporins from olive (Olea europaea L.). Planta 2007, 225, 381–392. [Google Scholar] [CrossRef] [PubMed]
  44. Perrone, I.; Pagliarini, C.; Lovisolo, C.; Chitarra, W.; Roman, F.; Schubert, A. Recovery from water stress affects grape leaf petiole transcriptome. Planta 2012, 235, 1383–1396. [Google Scholar] [CrossRef] [PubMed]
  45. Farquhar, G.D.; von Caemmerer, S.; Berry, J.A. Models of photosynthesis. Plant Physiol. 2001, 125, 42–45. [Google Scholar] [CrossRef] [PubMed]
  46. Sade, N.; Shatil-Cohen, A.; Attia, Z.; Maurel, C.; Boursiac, Y.; Kelly, G.; Granot, D.; Yaaran, A.; Lerner, S.; Moshelion, M. The Role of Plasma Membrane Aquaporins in Regulating the Bundle Sheath-Mesophyll Continuum and Leaf Hydraulics. Plant Physiol. 2014, 166, 1609. [Google Scholar] [CrossRef] [PubMed]
  47. Agre, P. Aquaporin water channels (Nobel lecture). Angew. Chem. Int. Ed. 2004, 43, 4278–4290. [Google Scholar] [CrossRef] [PubMed]
  48. Kaldenhoff, R.; Grote, K.; Zhu, J.J.; Zimmermann, U. Significance of plasmalemma aquaporins for water-transport in Arabidopsis thaliana. Plant J. 1998, 14, 121–128. [Google Scholar] [CrossRef] [PubMed]
  49. Lovisolo, C.; Secchi, F.; Nardini, A.; Salleo, S.; Buffa, R.; Schubert, A. Expression of PIP1 and PIP2 aquaporins is enhanced in olive dwarf genotypes and is related to root and leaf hydraulic conductance. Physiol. Plant. 2007, 130, 543–551. [Google Scholar] [CrossRef]
  50. Tournaire-Roux, C.; Sutka, M.; Javot, H.; Gout, E.; Gerbeau, P.; Luu, D.T.; Bligny, R.; Maurel, C. Cytosolic pH regulates root water transport during anoxic stress through gating of aquaporins. Nature 2003, 425, 393–397. [Google Scholar] [CrossRef] [PubMed]
  51. Prescott, A.; Martin, C. A rapid method for the quantitative assessment of levels of specific mRNAs in plants. Plant Mol. Biol. Rep. 1987, 4, 219–224. [Google Scholar] [CrossRef]
  52. Rozen, S.; Skaletsky, H.J. Primer 3 on the WWW for general users and for biologist programmers. In Bioinformatics Methods and Protocols: Methods in Molecular Biology; Krawetz, S., Misener, S., Eds.; Humana Press: Totowa, NJ, USA, 2000; pp. 365–386. [Google Scholar]
  53. Rasmussen, R. Quantification on the LightCycler instrument. In Rapid Cycle Real-Time PCR: Methods and Application; Meuer, S., Wittwer, C., Nakagawara, K., Eds.; Springer: Berlin, Germany; Heidelberg, Germany; New York, NY, USA, 2001; pp. 21–34. [Google Scholar]
  54. Cramer, G.R.; Urano, K.; Delrot, S.; Pezzotti, M.; Shinozaki, K. Effects of abiotic stress on plants: A systems biology perspective. BMC Plant Biol. 2011, 11, 163. [Google Scholar] [CrossRef] [PubMed]
  55. Kaldenhoff, R.; Kai, L.; Uehlein, N. Aquaporins and membrane diffusion of CO2 in living organisms. Biochim. Biophys. Acta 2014, 1840, 1592–1595. [Google Scholar] [CrossRef] [PubMed]
Figure 1. Time course (10 min step) of (A) leaf net photosynthesis (Pn); (B) leaf stomatal conductance (gs); (C) transpiration rate (E); and (D) leaf substomatal CO2 concentration (Ci), measured in Nicotiana tabacum leaves treated with air containing different CO2 concentrations. Zero ppm CO2: black empty squares; 200 ppm CO2: grey empty diamonds; 400 ppm CO2: grey filled triangles; 800 ppm CO2: black filled circles. Data are means of five points recorded every two minutes. Data are the averages of three independent biological samples (error bars denote SE) for each treatment and time (n = 3).
Ijms 17 00567 g001aIjms 17 00567 g001b
Figure 2. Time course of (A) the Nicotiana tabacum aquaporin 1 (NtAQP1) transcript level and (B) the Nicotiana tabacum plasma membrane intrinsic protein 2;1 (NtPIP2;1) transcript level in tobacco leaves treated with air containing different CO2 concentrations. Samples were taken at 0, 30, 60 and 180 min after starting treatment. Values represent expression relative to that observed in control plants (400 ppm CO2) at time 0. In the A inset, the expression level of NtAQP1 at ambient [CO2], during a time span of 4.5 h (from 10 a.m. to 2:30 p.m.) is displayed. The expression levels of the target genes were normalized using Elongation factor 1 α as internal control. Zero ppm CO2: black empty squares; 200 ppm CO2: grey empty diamonds; 400 ppm CO2: grey filled triangles; 800 ppm CO2: black filled circles; samples not subjected to imposed CO2: black filled triangles. The results are the averages of three independent biological samples (error bars denote SE) for each treatment and time (n = 3). Different letters denote statistically significant differences by Tukey’s test.
Ijms 17 00567 g002
Figure 3. NtAQP1 and NtPIP2;1 transcript levels were plotted respectively vs. (A) leaf substomatal CO2 concentration (Ci) and (B) transpiration rate (E). NtAQP1: black empty triangles; NtPIP2;1: grey empty squares (means ± SE, n = 3). Asterisks mark significance of regression (** p < 0.01, n.s., not significant).
Ijms 17 00567 g003
Table 1. List of primers used for quantitative Real Time PCR.
Gene NameForward Primer (5′–3′)Reverse Primer (5′–3′)
NtAQP1CTGGATCTTTTGGGTTGGACCAGAAAGATTAAGGCTTCTTGAGG
NtPIP2;1CATTTGTGGGAGCATTGGTACTGGTAGTGGTTGCAAAAGTTG
NtEF-1αCTCTCTGCGTACCCACCATTTAGCACCAGTTGGGTCCTTC
ActinCGTCCTTAGTGGTGGAACAGCCACCACCTTGATCTTC

