Article

MicroRNA Expression Profiling in CCl4-Induced Liver Fibrosis of Mus musculus

1
Department of Biological Sciences, Pusan National University, Pusan 46241, Korea
2
Department of Microbiology, Pusan National University, Pusan 46241, Korea
*
Authors to whom correspondence should be addressed.
These authors contributed equally to this work.
Int. J. Mol. Sci. 2016, 17(6), 961; https://0-doi-org.brum.beds.ac.uk/10.3390/ijms17060961
Submission received: 9 May 2016 / Revised: 12 June 2016 / Accepted: 13 June 2016 / Published: 17 June 2016
(This article belongs to the Section Biochemistry)

Abstract

:
Liver fibrosis is a major pathological feature of chronic liver diseases, including liver cancer. MicroRNAs (miRNAs), small noncoding RNAs, regulate gene expression posttranscriptionally and play important roles in various kinds of diseases; however, miRNA-associated hepatic fibrogenesis and its acting mechanisms are poorly investigated. Therefore, we performed an miRNA microarray in the fibrotic livers of Mus musculus treated with carbon-tetrachloride (CCl4) and analyzed the biological functions engaged by the target genes of differentially-expressed miRNAs through gene ontology (GO) and in-depth pathway enrichment analysis. Herein, we found that four miRNAs were upregulated and four miRNAs were downregulated more than two-fold in CCl4-treated livers compared to a control liver. Eight miRNAs were predicted to target a total of 4079 genes. GO analysis revealed that those target genes were located in various cellular compartments, including cytoplasm, nucleolus and cell surface, and they were involved in protein-protein or protein-DNA bindings, which influence the signal transductions and gene transcription. Furthermore, pathway enrichment analysis demonstrated that the 72 subspecialized signaling pathways were associated with CCl4-induced liver fibrosis and were mostly classified into metabolic function-related pathways. These results suggest that CCl4 induces liver fibrosis by disrupting the metabolic pathways. In conclusion, we presented several miRNAs and their biological processes that might be important in the progression of liver fibrosis; these findings help increase the understanding of liver fibrogenesis and provide novel ideas for further studies of the role of miRNAs in liver fibrosis.

Graphical Abstract

1. Introduction

Liver fibrosis, a typical feature of most chronic liver diseases, is characterized by excessive accumulation of extracellular matrix proteins, such as fibrillar collagen, as a result of the wound-healing response to persistent hepatic injury [1]. It accelerates the progression of liver disease by the destruction of the normal hepatic parenchyma, eventually leading to liver cirrhosis, liver failure or even liver cancer. Thus, reversing liver fibrosis is a critical point of therapy for patients with various chronic liver diseases with fibrosis, such as hepatitis B/C virus (HBV/HCV)-mediated cirrhosis, primary biliary cirrhosis and non-alcoholic steatohepatitis (NASH). Although several cytokines and signaling pathways involved in liver fibrosis have been found [1], it remains unclear how noncoding RNAs regulate the underlying mechanisms of hepatic fibrogenesis.
MicroRNAs (miRNAs) include approximately 22 nucleotides of endogenous noncoding RNAs conserved across species [2]. Newly-transcribed miRNAs have a relatively long stem-loop structure, and they are sequentially processed to become mature miRNAs by ribonuclease III enzymes Drosha and Dicer, found in the nucleus and the cytoplasm, respectively [2]. miRNAs interact with their target genes through base-pairing between their ~6–8 nucleotides in the 5′-end, called the seed sequence, and through the complementary sequences within the mRNA of the target genes, inducing degradation or translational inhibition of the mRNAs [3]. It has been reported that miRNAs are important regulators in various biological processes, such as cell proliferation, differentiation, immune response and metabolism [4,5,6], and their aberrant expression is closely associated with many diseases, including liver diseases [7,8]. Thus, miRNAs have come to the forefront as novel biomarkers and therapeutic agents for liver diseases.
Growing evidence suggests that dysregulated expression of miRNAs is closely associated with fibrosis appearing in various organs, including the liver [9,10]. Among those miRNAs, miR-21 and miR-29a/b are reported to be commonly related to fibrosis in multiple organs, including the heart, lung, skin, kidney and liver [9,10]. In the fibrotic liver, miR-21 is upregulated and promotes the transdifferentiation of quiescent hepatic stellate cells (HSCs) into myofibroblastic HSCs, a major cell type producing collagen in the liver [11]. miR-29a/b, which directly inhibits the synthesis of collagen, is downregulated during the activation of HSCs, promoting liver fibrosis [12]. In addition, miR-19b acts as an anti-fibrotic factor by regulating transforming growth factor (TGF)-β signaling in HSCs [13]. In the heart, miR-24 attenuates cardiac fibrosis and inhibits the differentiation of cardiac fibroblasts by targeting furin, a protease for TGF-β maturation [14]. miR-192 and miR-200a/b have antifibrotic roles in tubular epithelial cells, but they are profibrotic to the mesangial cells of the glomerulus in the kidney [10]. However, the studies reveal only part of the complicated mechanism of certain miRNA-mediated fibrogenesis. However, liver fibrosis is known with respect to the highly complicated physiological and molecular events. Thus, it is necessary to investigate the whole regulatory network composed of miRNA and its target genes to establish a better strategy for treating liver fibrosis.
There are currently 2603, 1920 and 807 known mature miRNAs in humans, mice and rats, respectively (miRBase, Release 21). These miRNAs were predicted to possibly bind with 19,475 (28,353 transcripts) genes in human (TargetScan, Release 7) and 18,615 (23,795 transcripts) genes in mice (TargetScan, Release 6). A recent study shows that more than one-third of human genes are regulated by miRNAs [6]. However, among these huge amounts of potential factors, it is difficult to investigate which miRNAs and which targets of a specific miRNA are important in the pathogenesis of disease. Therefore, microarray and functional analysis for their target genes are good methods to identify important miRNAs that play the essential roles in the pathological processes by regulating the expression of target genes.
In the present study, we analyzed the expressional level of genome-wide miRNAs in livers of carbon-tetrachloride (CCl4)- or corn oil-treated mice using the miRNA array assay. We found that a total of eight miRNAs were differentially expressed in fibrotic livers of CCl4-treated mice compared to the control livers of corn oil-treated mice (>2-fold, p < 0.05). A bioinformatics analysis showed that these miRNAs targeted 4079 potential genes. To identify the mechanisms regulated by these miRNAs during liver fibrosis, we conducted gene ontology (GO) analysis and in-depth Kyoto Encyclopedia of Genes and Genomes (KEGG) pathway enrichment analysis of the putative target genes. Seventy-two enriched signaling pathways were found to be associated with liver fibrosis (p < 0.05), and a total of 843 genes among 4079 potential target genes were shown to be involved in these enriched signaling pathways (p < 0.05). These enriched pathways were largely classified into metabolic-related pathways. These results demonstrate that differentially-expressed miRNAs in fibrotic livers target specific genes, being involved in metabolic-related pathways, suggesting that understanding the potential biological functions of these miRNAs in these pathways will help to develop novel therapeutics in treating patients with liver disease.

2. Results

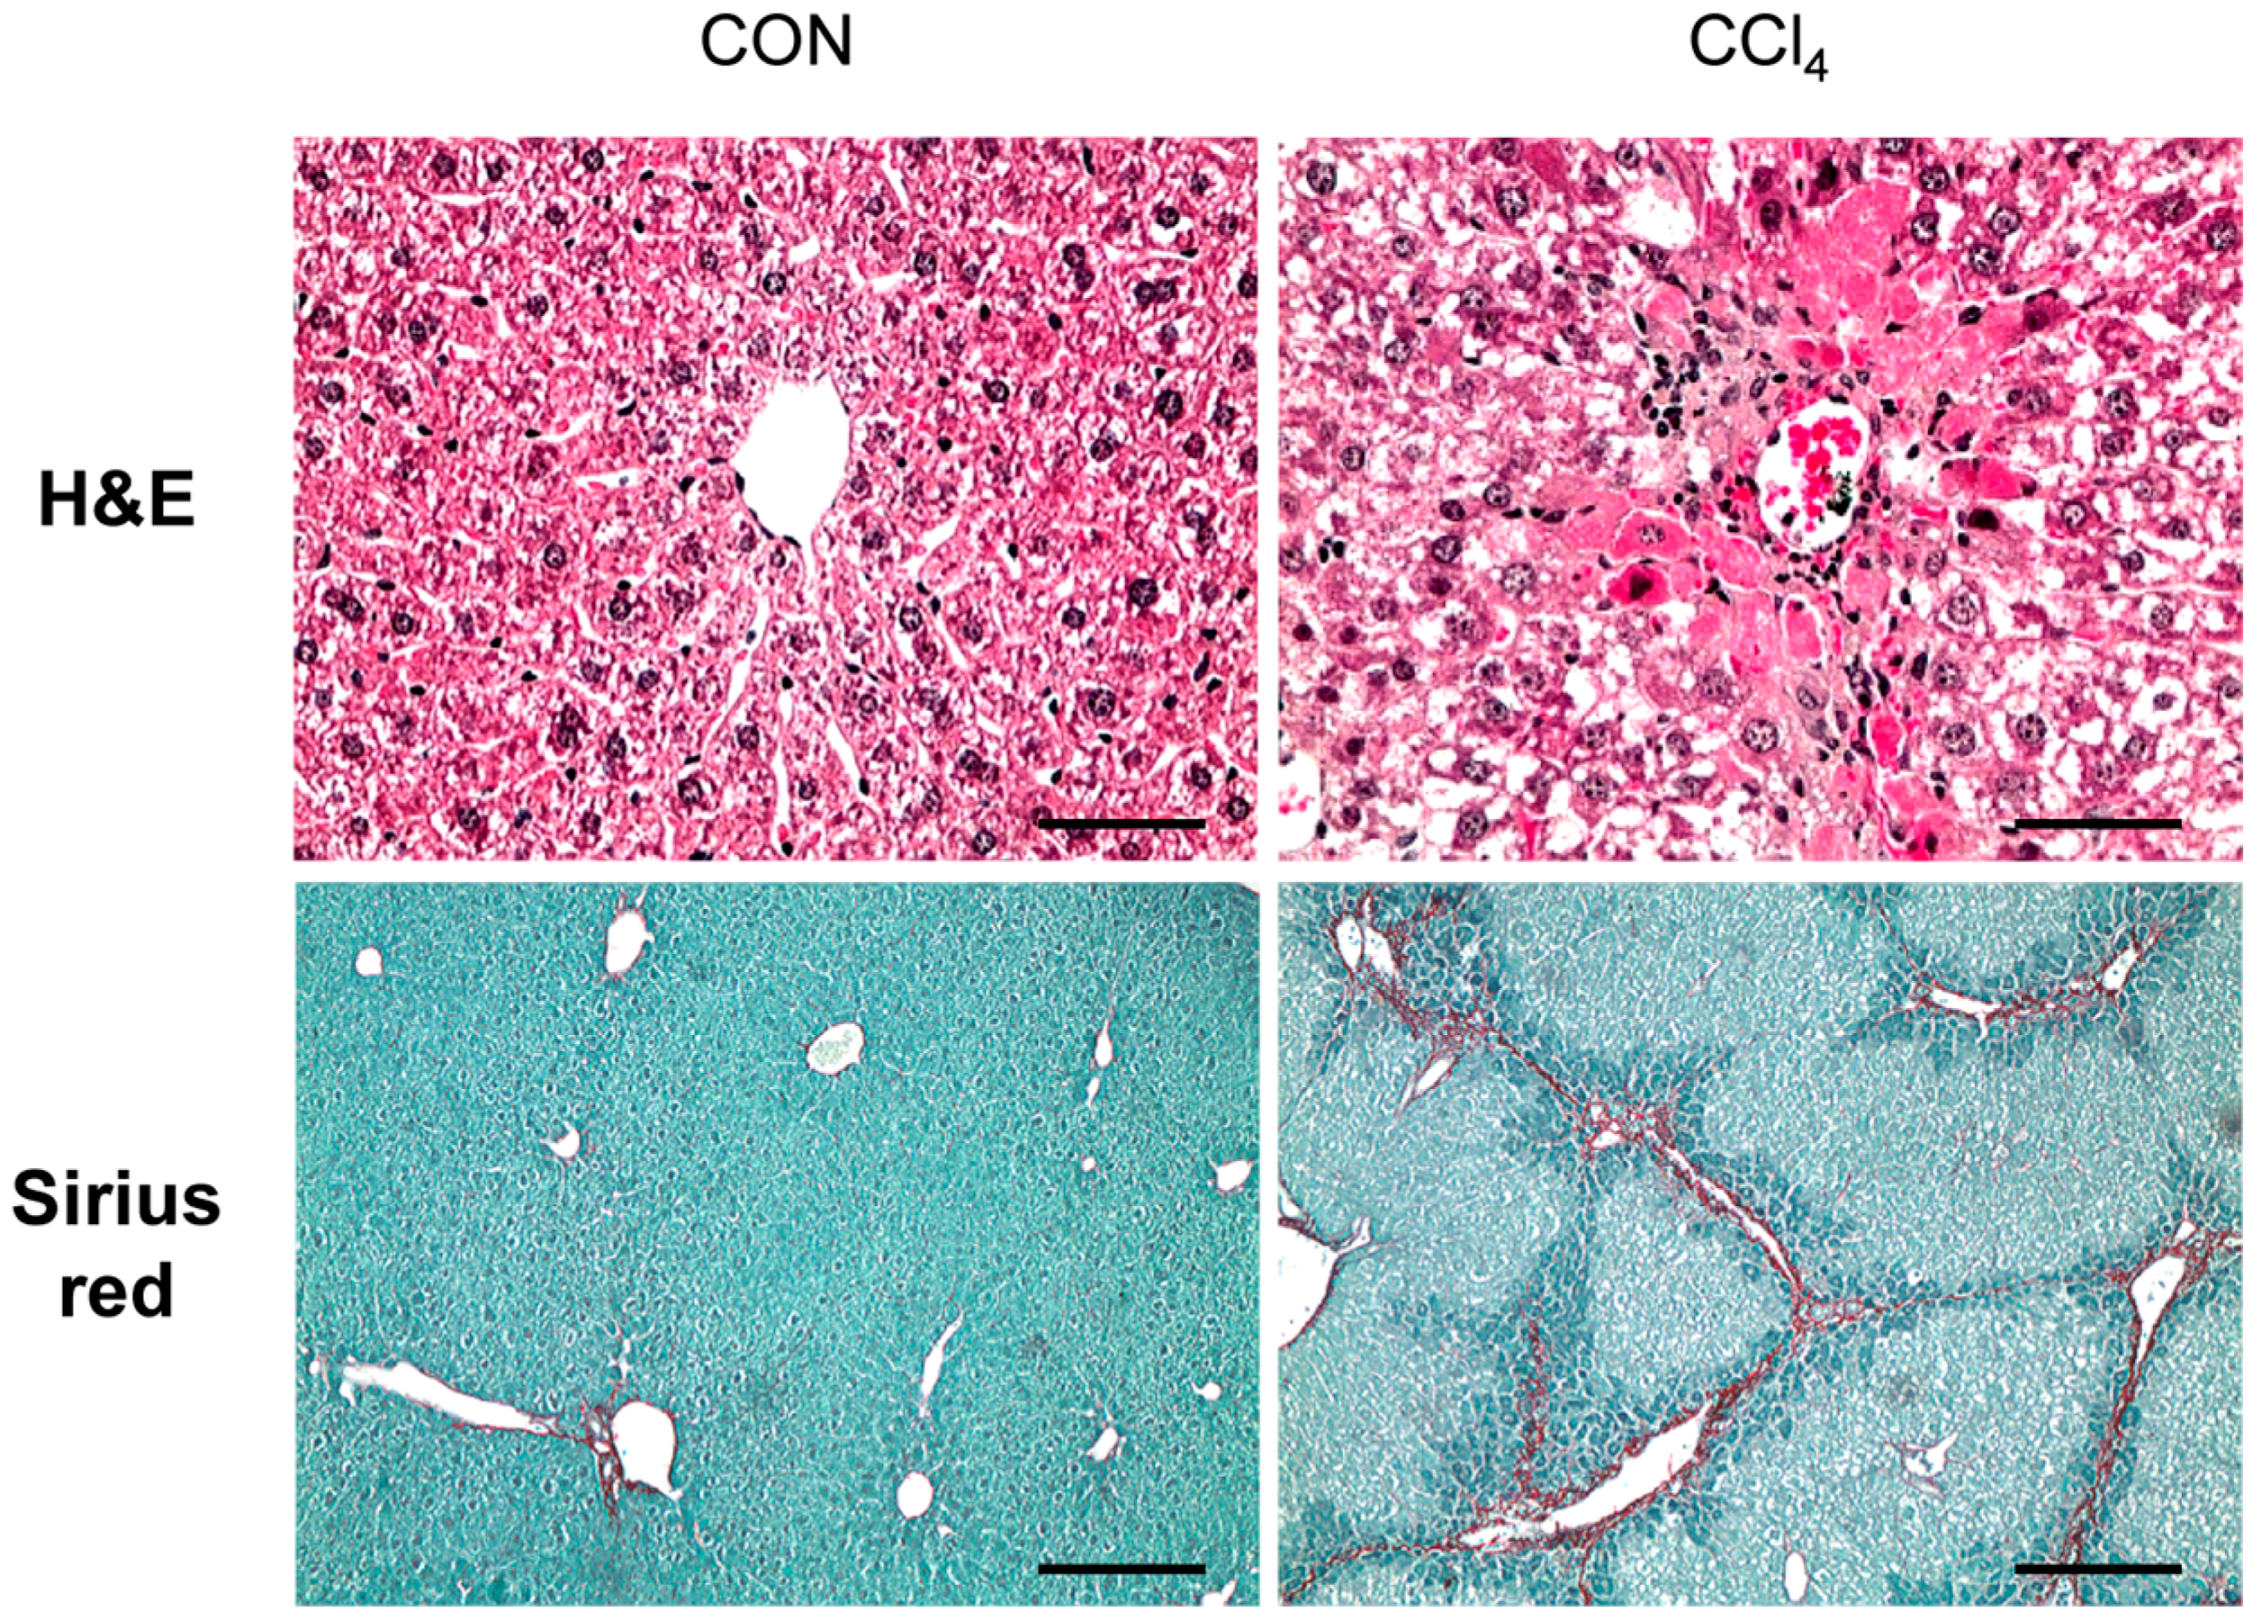
2.1. Carbon-Tetrachloride-Induced Liver Fibrosis in Mice

CCl4 is a well-known chemical that induces liver fibrosis through a hepatotoxic injury-mediated response in experimental animals [15,16]. To generate a chronically-damaged liver with fibrosis, we exposed mice to CCl4 for 10 weeks by intraperitoneal injection. Histomorphological changes after CCl4 treatment were examined by hematoxylin-eosin (H&E) stain (Figure 1). H&E staining showed that dead or ballooned hepatocytes were accumulated around the central vein, and immune cells infiltrated into the interspaces of these damaged hepatocytes in the liver sections of the CCl4-injected mice. In addition, Sirius red staining presented the collagen deposition and fibrotic septa formed by the collagen matrix in livers of CCl4-treated mice (Figure 1). Those morphological changes and this collagen deposition were rarely detected in the livers of corn oil-treated mice. These results suggest that CCl4 promotes hepatic fibrosis in mice.

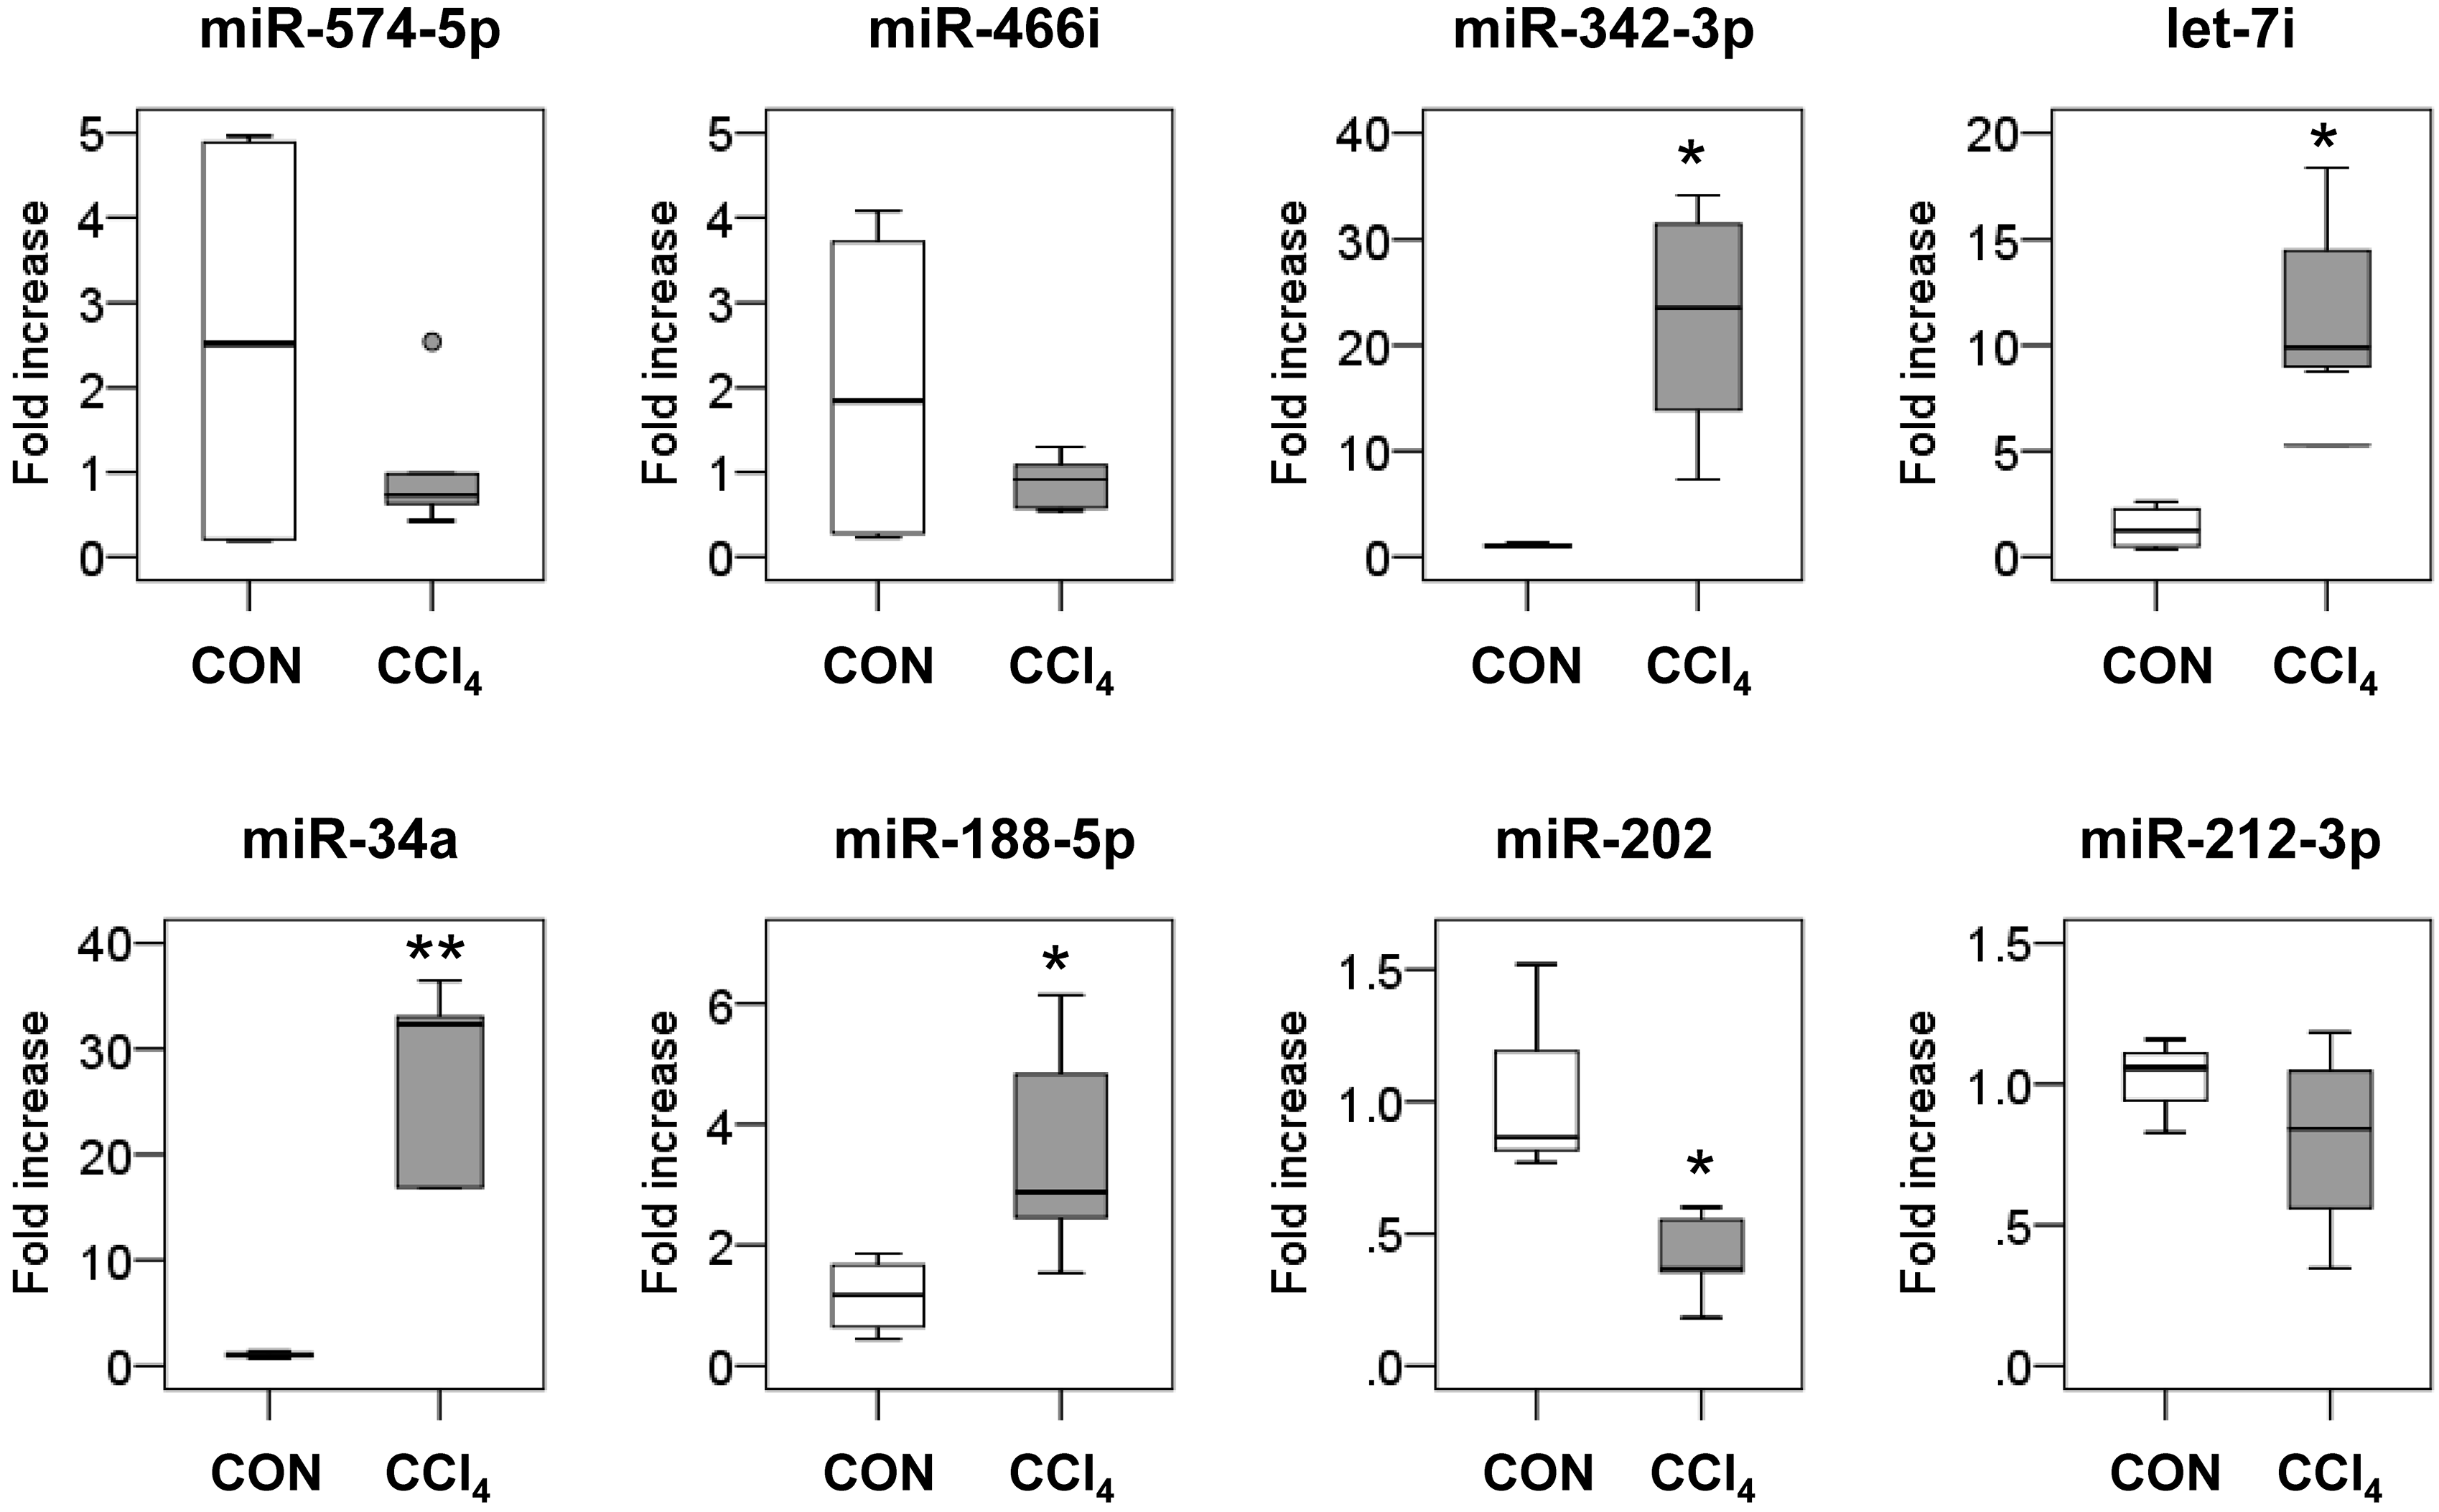
2.2. Dysregulated MicroRNAs’ (miRNAs) Expression in Fibrotic Livers

To investigate the miRNA expression profile in fibrotic liver, we performed miRNA array analysis on CCl4-induced fibrotic livers and compared them to control livers. A total of 12 miRNAs that showed more than a two-fold difference between CCl4-treated and control livers were filtered (n = 3/each group, p < 0.05). Among these 12 miRNAs, seven miRNAs, including mmu-miR-574-5p, mmu-miR-466i-5p, mmu-miR-342-3p, mmu-let7i-5p, mmu-miR-34a-5p, mmu-miR-188-5p and mmu-miR-5119, were upregulated, whereas five miRNAs, including mmu-miR-378a-3p, mmu-miR-202-3p, mmu-miR-378b, mmu-miR-378d and mmu-miR-212-3p, were downregulated in CCl4 compared to the control group (Table 1). All data of the miRNA profiles are listed in Table S1.
To validate the data of the miRNA array, we conducted real-time quantitative reverse transcriptional polymerase chain reaction (qRT-PCR) for the expression of six upregulated miRNAs (mmu-miR-574-5p, mmu-miR-466i, mmu-miR-342-3p, mmu-let-7i, mmu-miR-34a and mmu-miR-188-5p) and five downregulated miRNAs (mmu-miR-378a-3p, mmu-miR-202, mmu-miR-378b, mmu-miR-378d and mmu-miR-212-3p) in liver tissues from the CCl4 group (n = 5) and the control group (n = 4). Because the reduced expression of miR-378a-3p, miR-378b and miR-378d in the fibrotic liver was demonstrated in the previous studies [17], duplicated results were not shown in the present study. Furthermore, analysis for miR-5119 was excluded in these assays, because miR-5119 was barely detected in the databases and was not conserved in humans and other species. It was confirmed that miR-342-3p, let-7i, miR-34a and miR-188-5p increased and miR-202, miR-378a-3p, miR-378b and miR-378d decreased in the CCl4-treated livers compared to the control livers (p < 0.05) (Figure 2). Thus, among the eleven miRNAs examined, the expression levels of eight miRNAs were consistent with the microarray results.

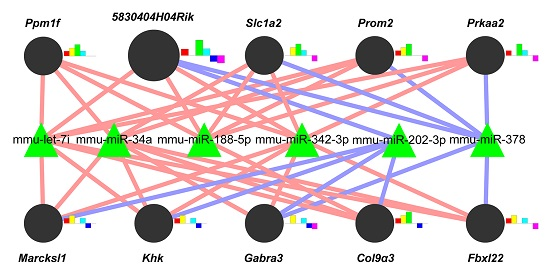
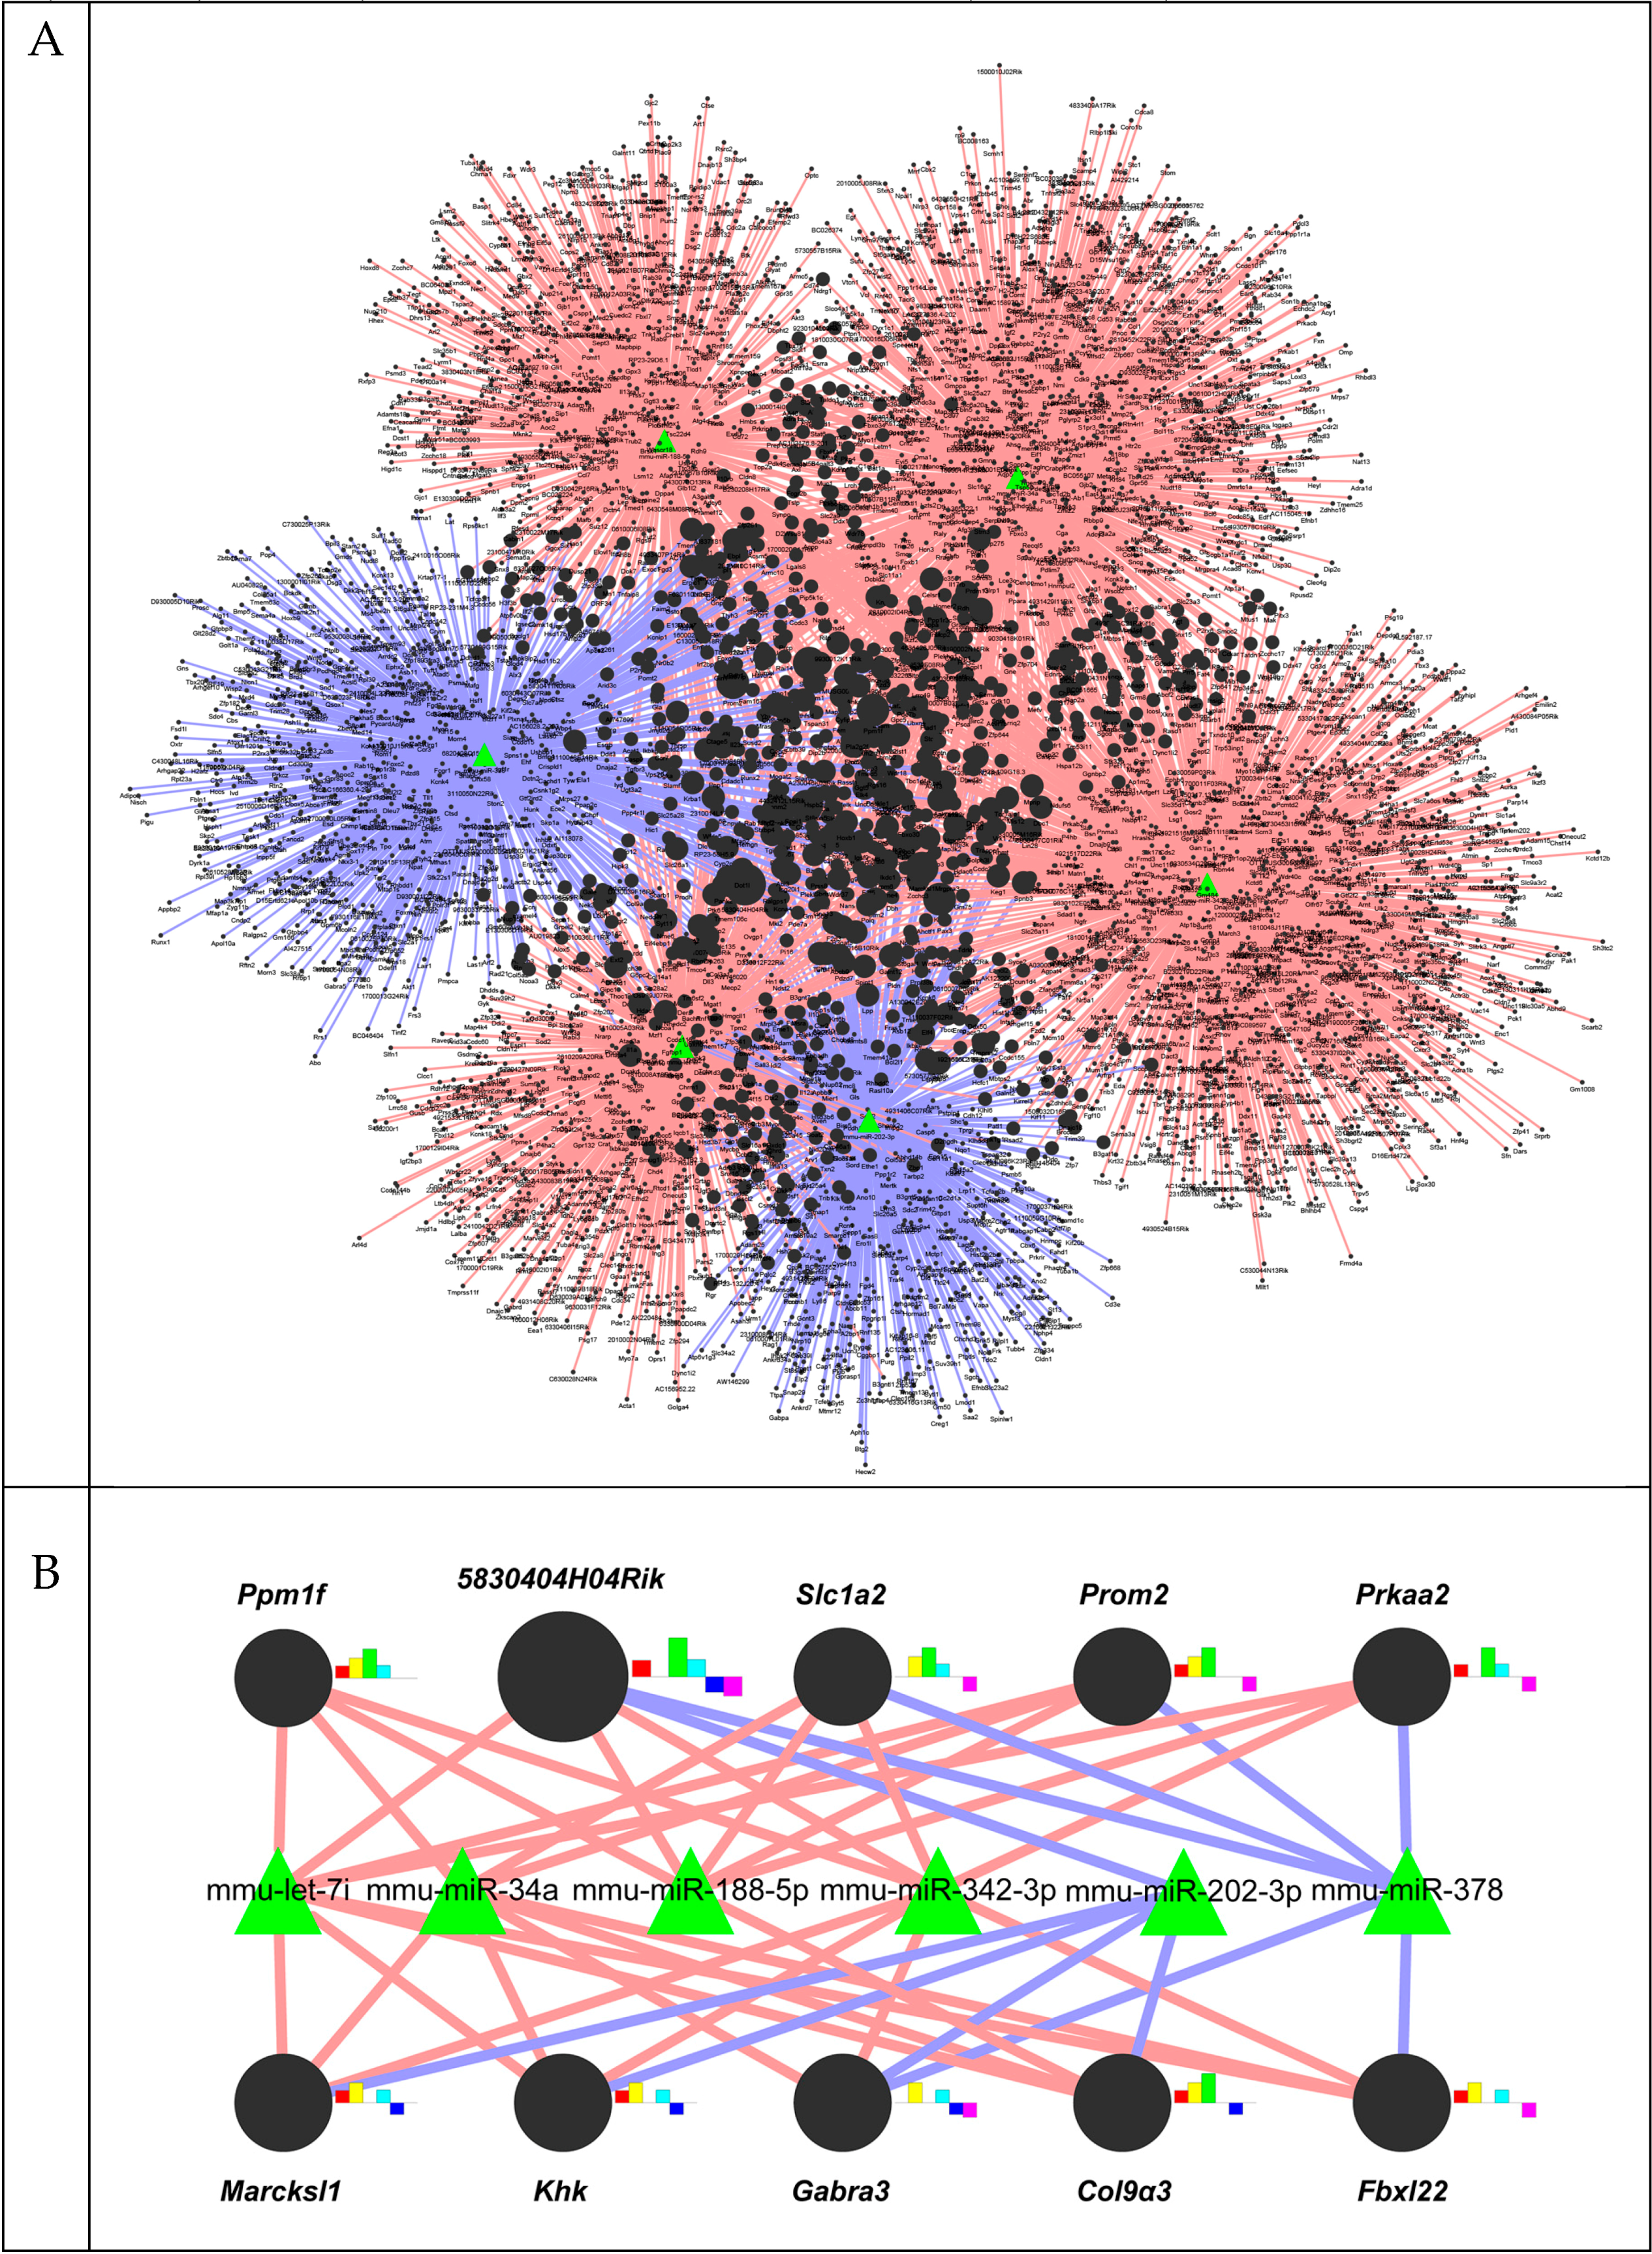
2.3. A Gene-Regulatory Network of miRNAs Altered in Liver Fibrosis

To probe what genes were targeted by the eight miRNAs differentially expressed in liver fibrosis, as confirmed by qRT-PCR analysis, and to construct networks of these miRNAs and their target genes, we conducted bioinformatics analysis on these miRNAs using miRWalk. Because miR-378a-3p, miR-378b and miR-378d were integrated into one miR-378 family in this analysis, three individual miRNA members were counted as one miRNA. Hence, six miRNAs were investigated to find their target genes. miRWalk analysis showed that a total of 4079 genes were predicted as the target genes of these selected miRNAs (cutoff at p < 0.05). Figure 3A presents the whole network composed of these miRNAs and their predicted target genes. Each individual miRNA had its own target genes, forming a distinct regulatory system. Each regulatory system was linked to the core target genes regulated by more than two miRNAs, making a whole system.
The top ten core target genes and their expected regulation by miRNAs are shown in Figure 3B. Interestingly, five miRNAs, including three upregulated miRNAs (let-7i, miR-188-5p and miR-342-3p) and two downregulated miRNAs (miR-202-3p and miR-378), were related to 5830404H04Rik, a C2 calcium-dependent domain containing 2 (C2cd2). Nine other genes, protein phosphatase 1F (PP2C domain containing) (Ppm1f), solute carrier family 1 (glial high affinity glutamate transporter) (Slc1a2), prominin 2 (Prom2), protein kinase, AMP-activated, α 2 catalytic subunit (Prkaa2), MARCKS-like 1 (Marcksl1), ketohexokinase (Khk), γ-aminobutyric acid (GABA) A receptor, subunit α 3 (Gabra3), collagen, type IX, α 3 (Col9a3) and F-box and leucine-rich repeat protein 22 (Fbxl22), were related to the different combinations of four up- or downregulated miRNAs. A list of all predicted target genes is shown in Table S2. To examine whether the miRNAs influenced the expression of their predicted target genes, we conducted qRT-PCR analysis for these genes. The RNA levels of 5830404H04Rik, Slc1a2, Khk, Gabra3, Col9a3 and Fbxl22 were significantly changed in the CCl4 group compared to the control group (Figure 4). These data indicated that dysregulated miRNAs might modulate the expression of their target genes during liver fibrogenesis.

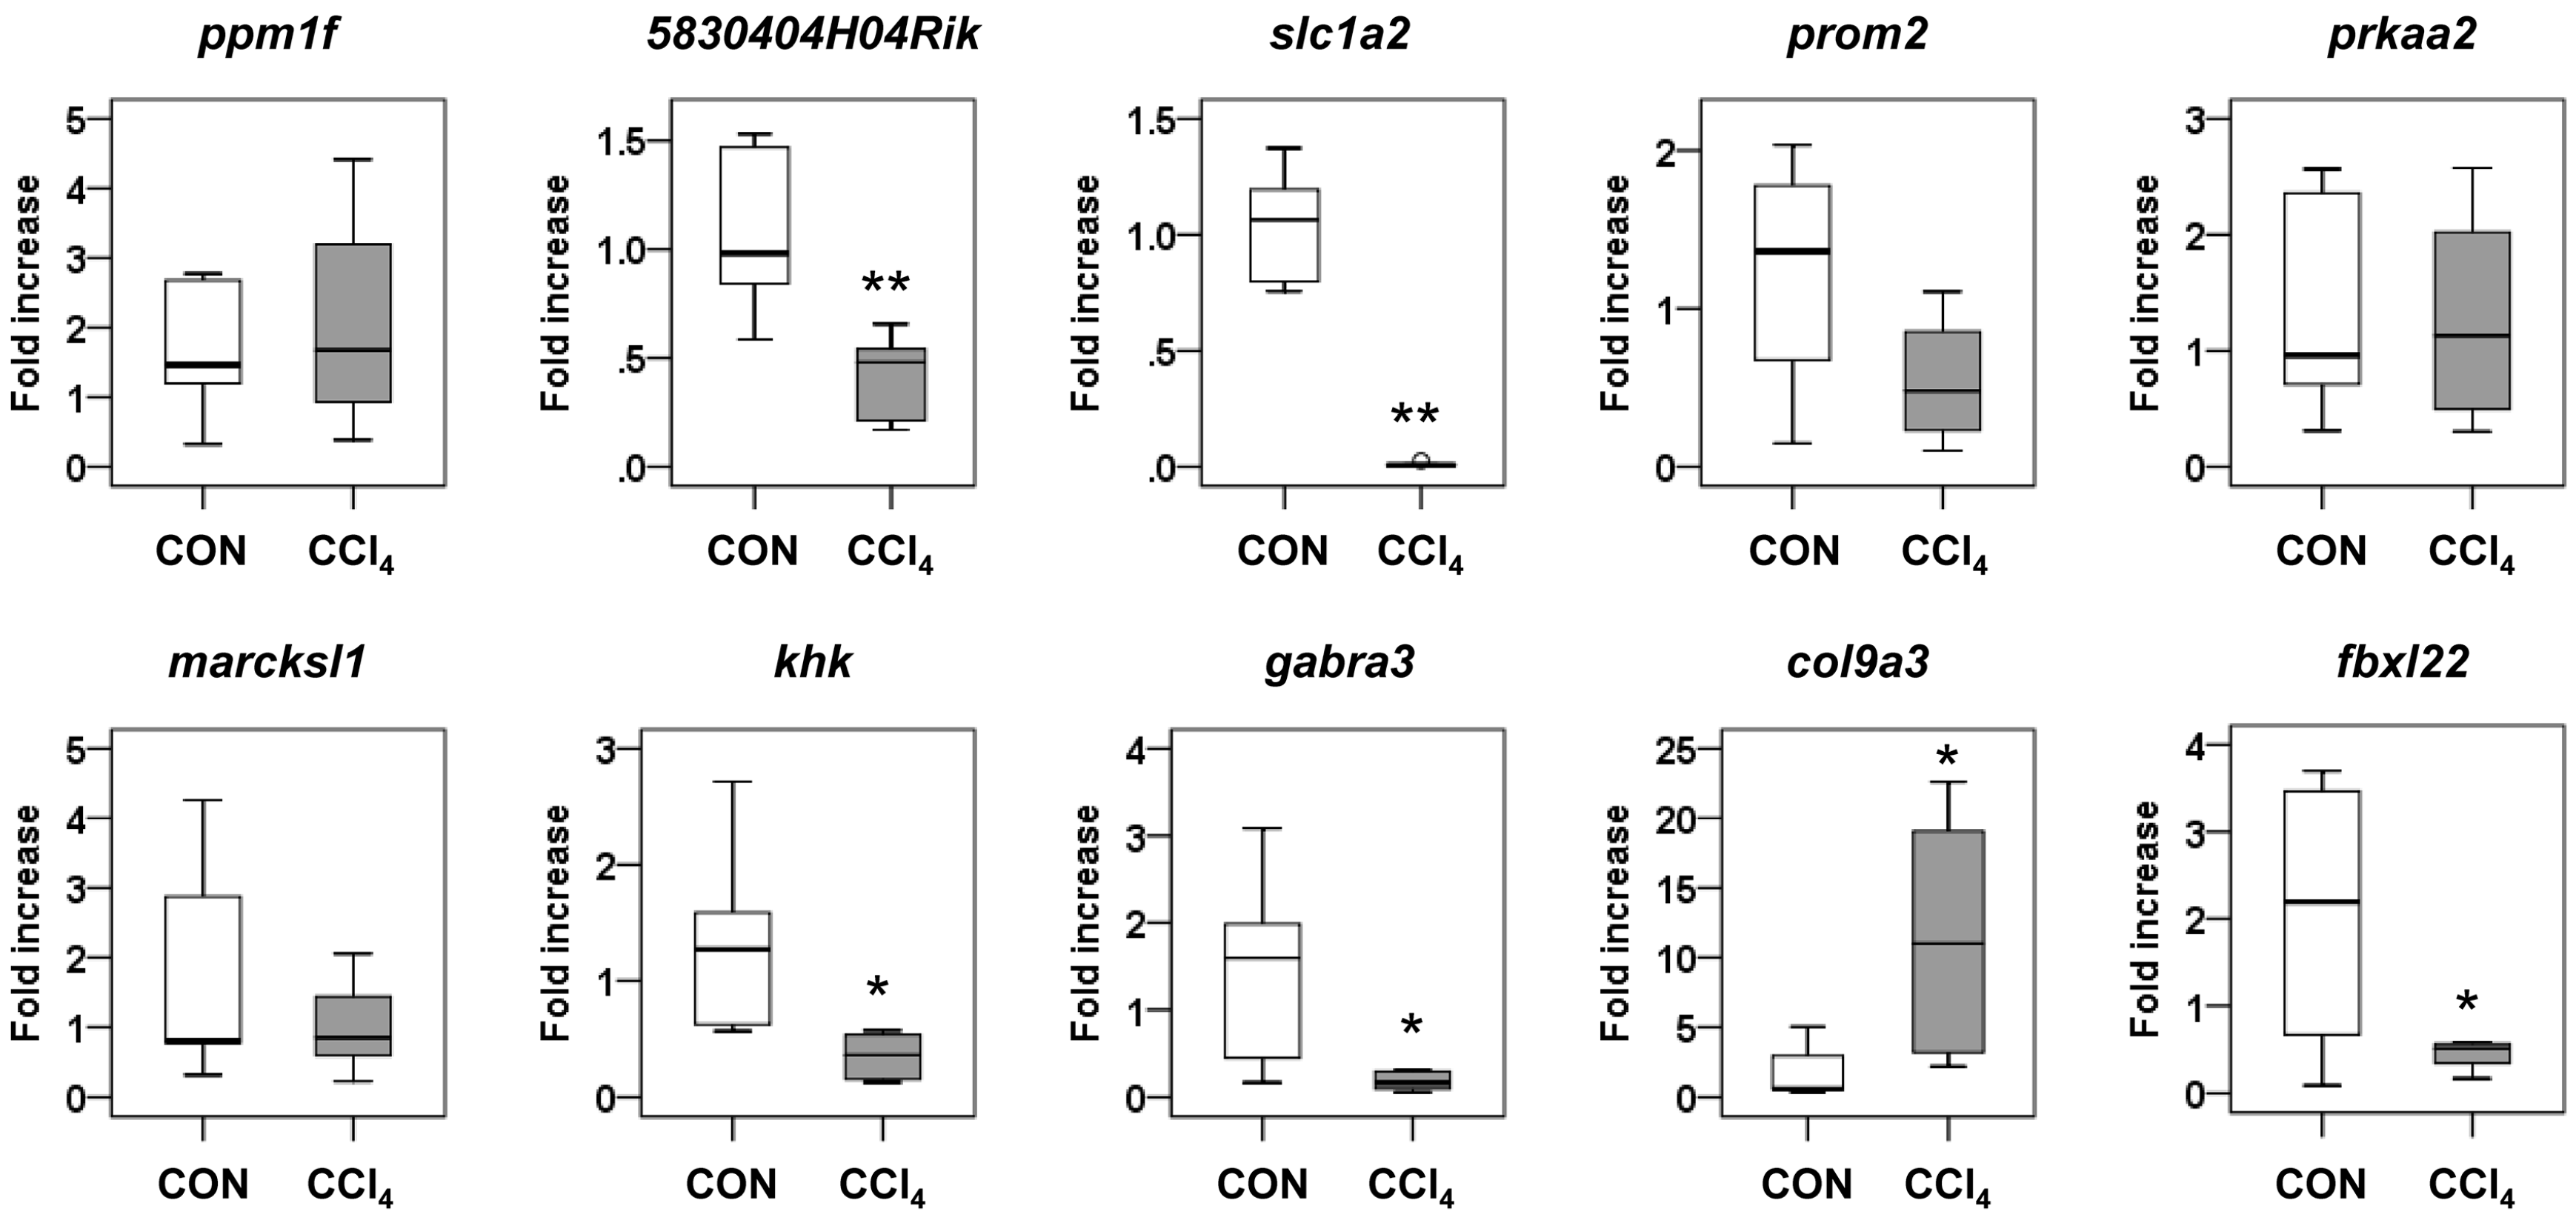
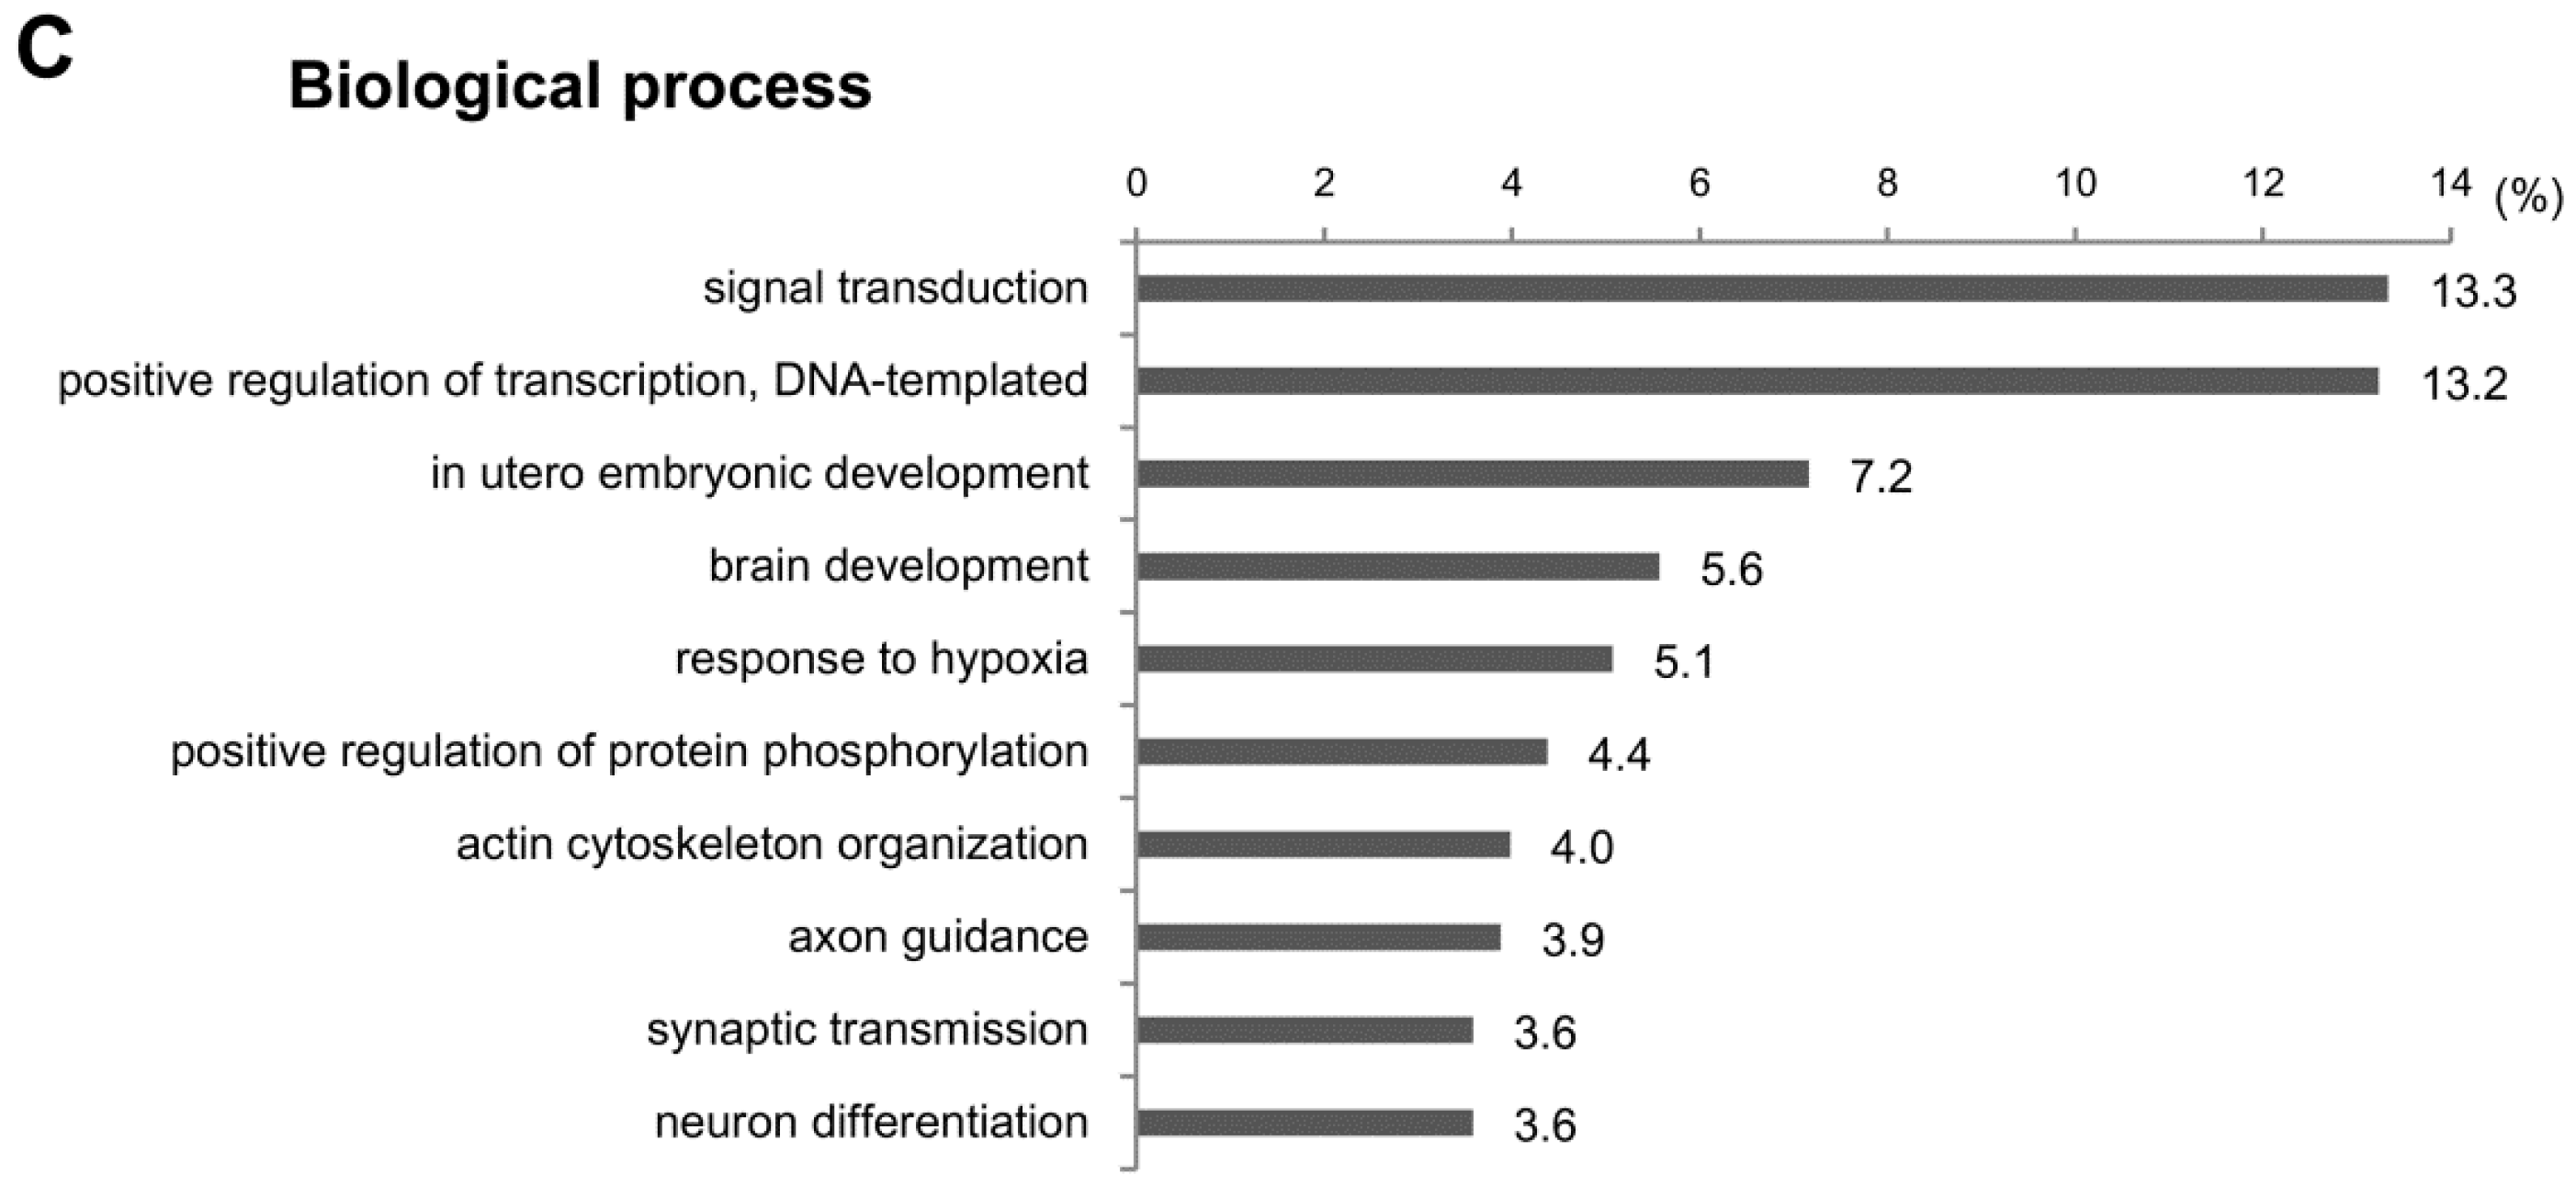
2.4. Functional Analysis of the Predicted Target Genes

To investigate the functions of the target genes predicted above, we performed GO analysis for the cellular components, molecular functions and biological processes. We cut off the GO enrichment data at p < 0.001 and calculated the percentages of target genes involved in subcategories (Figure 5). In cellular component analysis, we found that about half of target genes were located in the cytoplasm (48.7%) (Figure 5A). Other target genes were scattered in various subcellular loci, including the intracellular (12.4%), nucleolus (8%) and cell surface (5.7%). In the molecular function assay, most target genes were related to protein-protein or protein-DNA bindings, such as the identical protein binding (22.9%), sequence-specific DNA binding (22.7%), protein kinase binding (13.9%) and protein heterodimerization activity (13.9%) (Figure 5B). In line with the fact that the protein-protein interactions are involved in the signal transduction controlling gene expression [18], the signal transduction (13.3%) and the DNA-templated positive control of transcription (13.2%) were the largest categories in biological process (Figure 5C). All data from the GO analyses on miRNA-target genes are listed in Table S3.
To further understand the biological functions of the predicted target genes in liver fibrosis, we performed KEGG pathway analyses, which provided more detailed information about the signaling pathways in which the target genes were involved. The key signaling pathways regulated by six miRNAs were selected by KEGG enrichment at p < 0.05 and are listed in Table 2. Interestingly, 24 of the 72 total pathways were directly related to metabolism, including metabolic pathways (25.3%), other types of O-glycan biosynthesis (48.4%), sphingolipid metabolism (41.7%), glycosaminoglycan biosynthesis (keratan sulfate (60%), lysine degradation (39.2%), N-glycan biosynthesis (38.8%), fatty acid biosynthesis (57.1%), ovarian steroidogenesis (36.2%), fatty acid degradation (36.7%), glycosphingolipid biosynthesis), lacto and neolacto series (42.3%), glycerolipid metabolism (34.5%), fatty acid metabolism (34%), valine, leucine and isoleucine degradation (33.3%), glycolysis/gluconeogenesis (31.8%), amino sugar and nucleotide sugar metabolism (34%), melanogenesis (29%), thiamine metabolism (75%), valine, leucine and isoleucine biosynthesis (75%), tryptophan metabolism (32.6%), purine metabolism (25.7%), thyroid hormone synthesis (29.6%), glycerophospholipid metabolism (28.3%), citrate cycle (tricarboxylic acid (TCA) cycle) (34.4%) and glycosaminoglycan degradation (38.1%). Additionally, several signaling pathways involved in cellular metabolic processes were included in the significantly-annotated pathways by KEGG pathway analysis. For example, the hedgehog (Hh) signaling pathway (34.7%) and tumor necrosis factor (TNF) signaling pathway (29.4%) play the critical roles in regulating metabolism of HSCs [19] and adipocytes [20], respectively. The percentages in parenthesis indicate the proportion of target genes in total genes associated with the pathway. All data from the KEGG pathway analysis of the target genes are listed in Table S4.

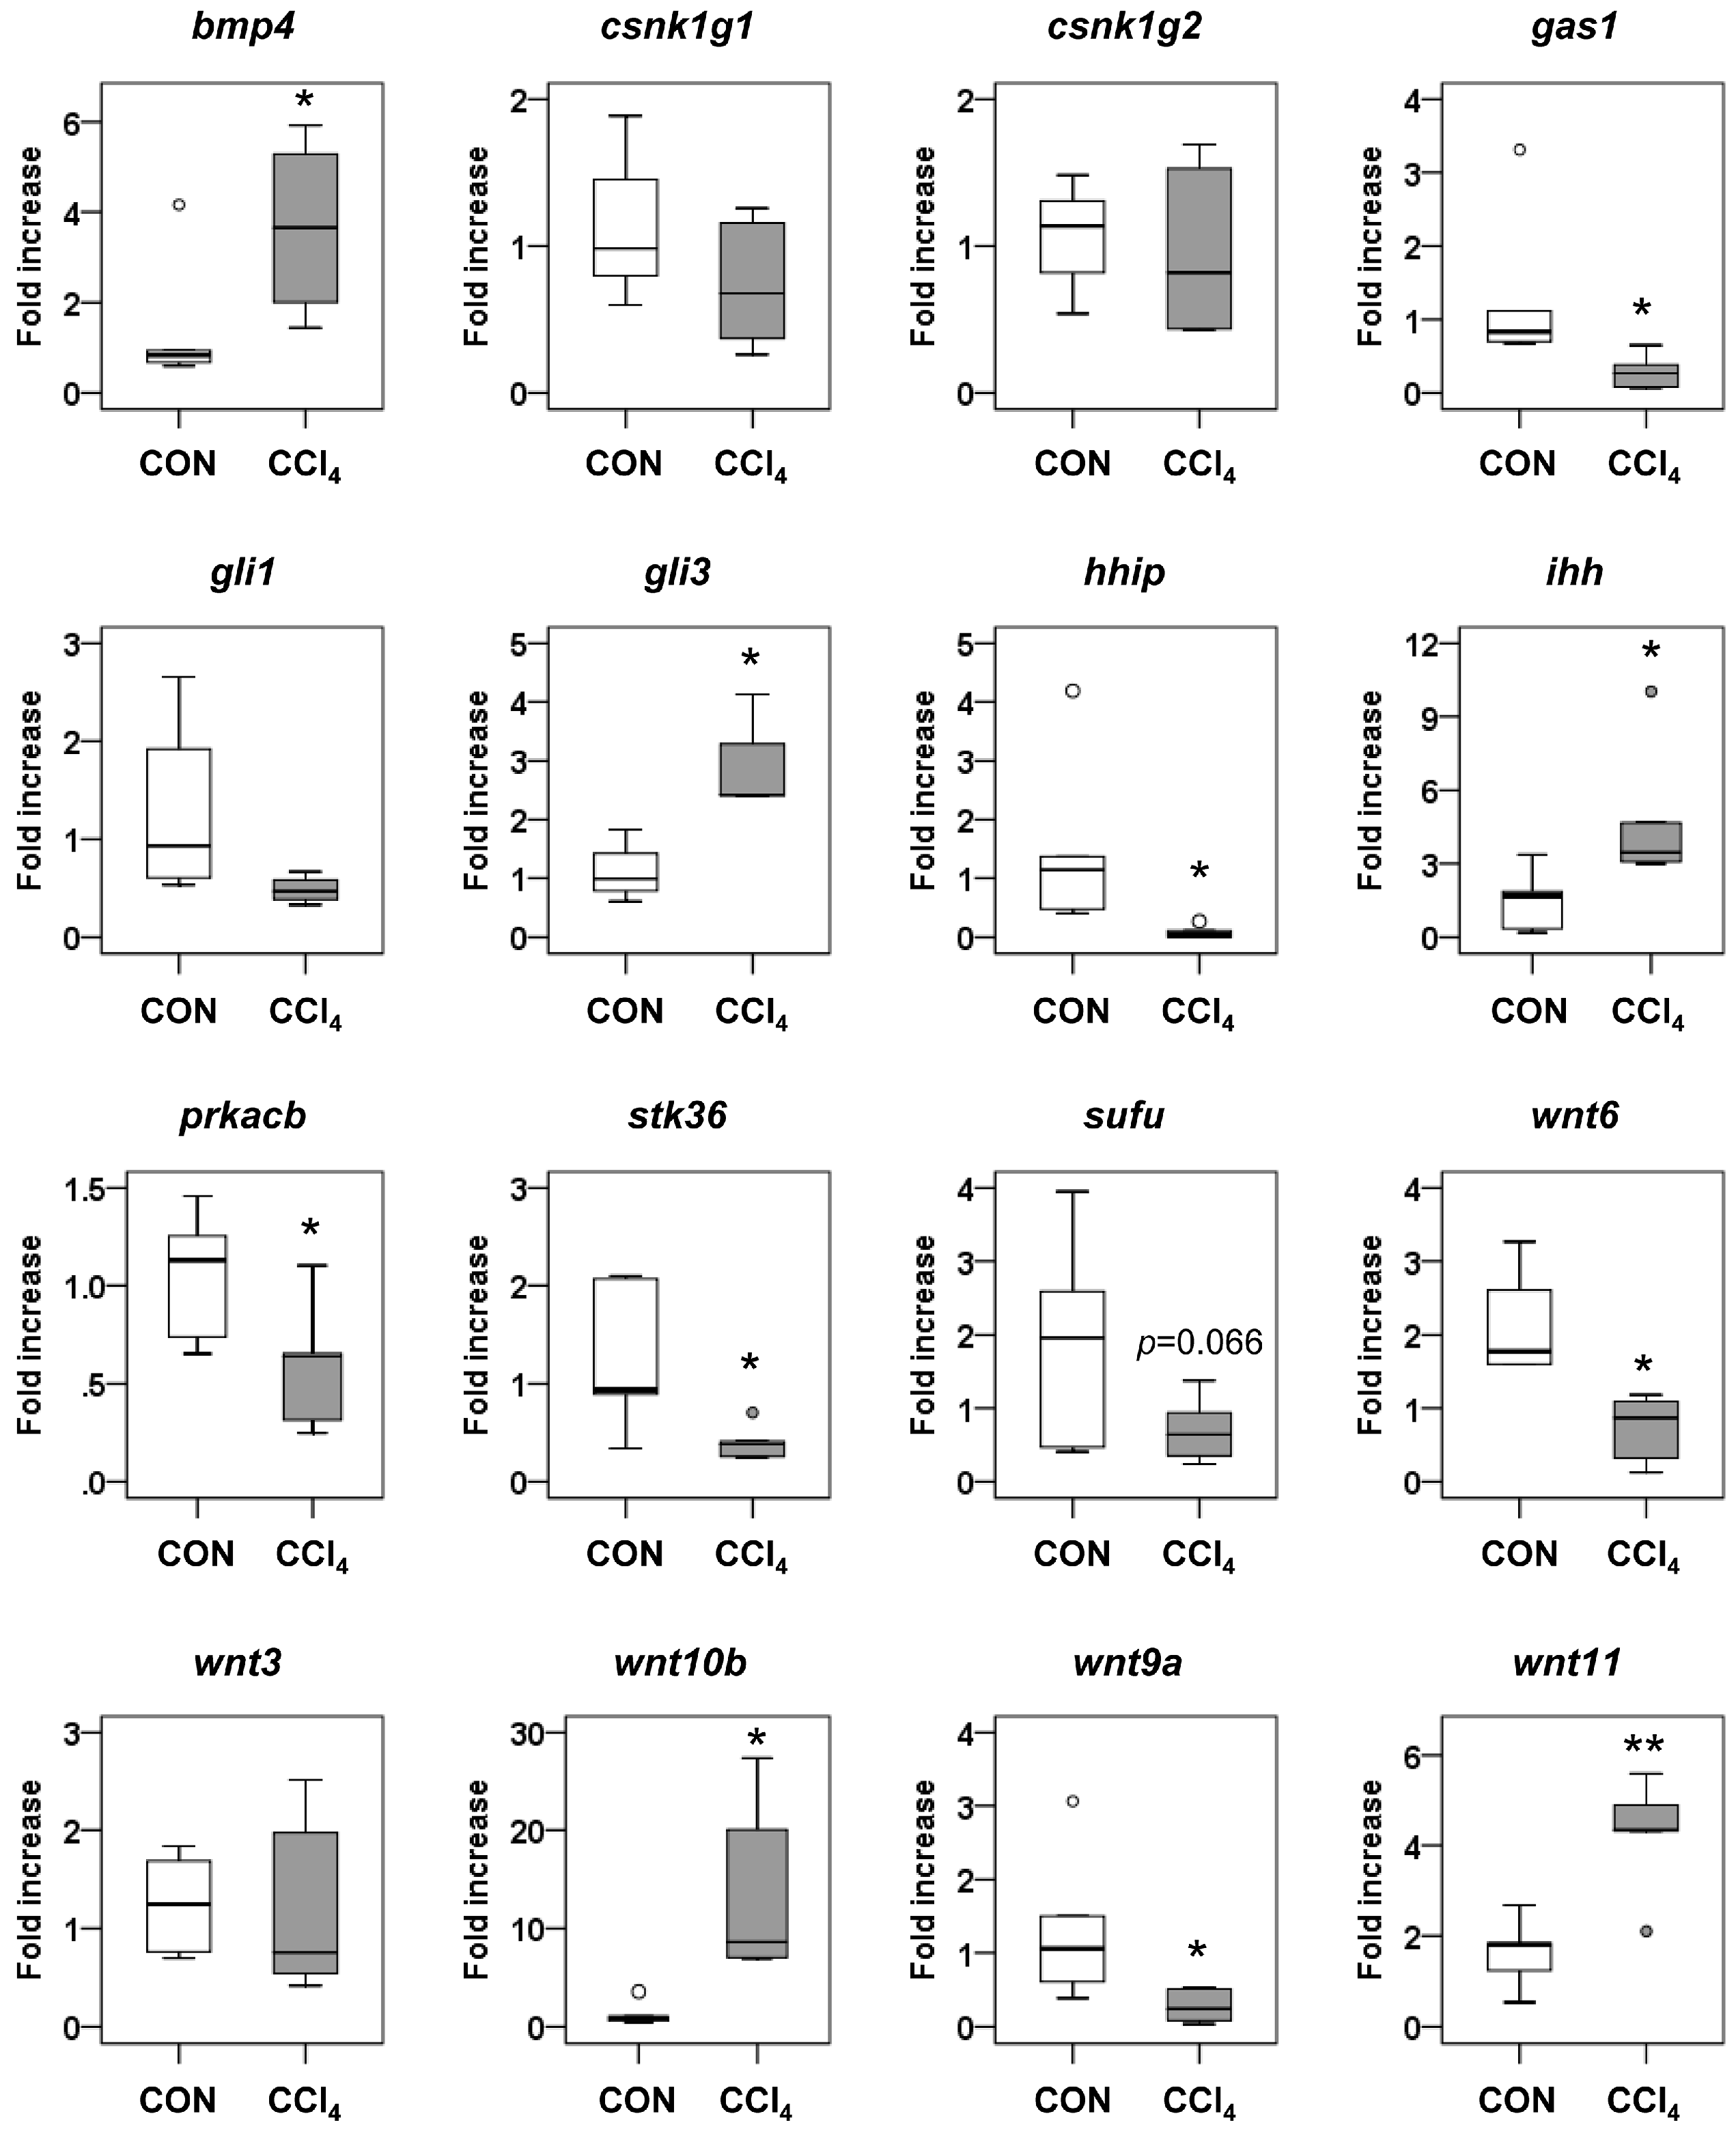
2.5. Interaction of miRNA Target Involved in Hedgehog Signaling

Among the significantly-enriched 72 pathways in the KEGG pathway analysis, Hh signaling is in our interest because it contributes to the liver fibrosis by stimulating the activation of HSCs [19,21]. To further understand how miRNAs regulate the genes involved in Hh signaling, we examined the expression of target genes involved in the Hh signaling pathway by qRT-PCR analysis. In Table 3, we summarized the Hh signaling-related putative target genes, such as bone morphogenetic protein 4 (Bmp4), casein kinase 1 γ 1 (Csnk1g1), Csnk1g2, growth arrest specific 1 (Gas1), GLI-Krüppel family member 1 (Gli1), Gli3, hedgehog-interacting protein (Hhip), Indian Hh (Ihh), cyclic adenosine monophosphate (cAMP)-dependent protein kinase catalytic subunit β (Prkacb), serine/threonine kinase 36 (Stk36), suppressor of fused homolog (Sufu) and members of the wingless-type mouse mammary tumor virus (MMTV) integration site family (Wnt6, Wnt3, Wnt3a, Wnt10b, Wnt9a and Wnt11). Among the total of 17 genes, the expression of eleven genes was significantly changed in livers of the CCl4-treated mice compared to the corn oil-treated mice (p < 0.05) (Figure 6). The mRNA expression of Wnt3a was non-detectable in both corn oil- and CCl4-treated livers. Two Hh-activator genes, bmp4 and gli3, targeted by miR-378, were upregulated as miR-378 was downregulated in the fibrotic liver (Table 1 and Figure 6). Hhip, a well-established Hh inhibitor [22,23], was analyzed to be targeted by miR-342-3p, and its expression was reduced with the increase of miR-342-3p during liver fibrosis (Table 1, Figure 2 and Figure 6). In addition, the RNA level of Gas1, Prkacb, Stk36 and Wnt9a significantly decreased as the expression of their regulatory miRNAs, miR-188-5p for Gas1, miR-34a for Prkacb, let-7i for Stk36 and let-7i and miR-342-3p for Wnt9a, increased in the CCl4 group compared to the control group. The expression of these target genes was inversely correlated with the expression of their regulatory miRNAs, showing the inhibitory effect of miRNAs on their target genes. On the other hand, the expression of Ihh, Wnt10b and Wnt11 was elevated with the increase of their regulatory miRNAs, miR-34a, miR-342-3p and miR-188-5p, respectively, and the level of Wnt6 was reduced with the decrease of its regulator miRNA, miR-378, in the CCl4 group, implying that other regulatory factors might be additionally involved in the expression of these genes. These results suggest that the miRNAs influence the liver fibrosis by altering the expression of target genes associated with Hh signaling.

3. Discussion

miRNAs are known to be involved in many biological processes, and their dysregulation has been reported in several diseases. miRNAs are more stable than messenger RNA and are available for quantification in various body fluids, such as serum, plasma, urine and saliva [24,25]. Thus, miRNAs are expected to be novel biomarkers. In addition, successful in vivo manipulation of certain miRNA using oligonucleotide transfection and a viral expression system suggests that miRNAs are potential therapeutic agents [26,27]. However, it is not fully understood what miRNAs are altered and what and how biological procedures are affected by miRNAs during liver fibrogenesis.
In the present study, we analyzed the liver of mice treated for 10 weeks with CCl4 by microarray. To investigate the distinct signaling pathways involved in CCl4-induced liver fibrosis, we also performed genome-wide GO and in-depth KEGG pathway enrichment analysis for the target genes of miRNAs. We found that eight miRNAs (four upregulated and four downregulated) were significantly dysregulated in CCl4-treated livers compared to corn oil-treated livers (p < 0.05), and a total of 4079 target genes were predicted for these miRNAs. GO enrichment analysis revealed that most of the putative target genes were located in the cytoplasm where most cellular biochemical reactions occur. With respect to molecular functions and biological processes, most of the miRNA target genes were involved in signal transduction, which is a series of biochemical events in response to extracellular signals and mediates the metabolism and gene expression in the cells. For example, miR-26a targeting several key regulators of hepatic metabolism and insulin signaling, such as GSK3β, PKCδ/θ, ACSL3/4, PCK1 and TCF7L2, ameliorates the obesity-induced metabolic complications by improving the insulin sensitivity and decreasing both of the hepatic glucose production and the fatty acid synthesis in mice fed with a high-fat diet [28].
In the KEGG pathway enrichment analysis for assessing the biological functions of putative target genes, we sorted out the 72 total signaling pathways that might be critical in the progression of liver fibrosis (p < 0.05). We found several pathways that were known to be involved in liver fibrosis, such as the AMPK signaling pathway (36.4%) [29], the FoxO signaling pathway (31.1%) [30], the Notch signaling pathway (38.8%) [31], the mitogen-activated protein kinase (MAPK) signaling pathway (26.9%) [32], the estrogen signaling pathway (30.6%) [33], the p53 signaling pathway (32.4%) [34], the hedgehog signaling pathway (34.7.5%) [35], the mechanistic target of rapamycin (mTOR) signaling pathway (32.8%) [36], hepatitis B (27.6%) [37], the PI3K-Akt signaling pathway (24.5%) [38], cAMP signaling pathway (25.8%) [39], the TGF-β signaling pathway (29.3%) [40] and the hypoxia-inducible factor (HIF)-1 signaling pathway (27%) [41]. In addition, a main biological process involving various metabolic pathways was found in this analysis.
Metabolic pathways are closely associated with liver functions, because the hepatocytes occupying over 80% of the liver mass are responsible for carbohydrate, lipid and protein metabolism. Metabolic syndromes, such as obesity, diabetes, hyperdyslipidemia, hypercholesterolemia and insulin resistance, are related to nonalcoholic fatty liver disease, capable of ongoing hepatic fibrogenesis [42]. Recently, altered protein glycosylation has been shown to regulate the activation of HSCs [43] and the pathogenesis of various liver diseases [44]. Glycoproteins, such as fibronectin, laminin and hyaluronic acid, are overexpressed in fibrotic livers [45]. In addition, the oligonucleotide microarray for glycan-related genes and the lectin (glycan-recognizing protein) microarray for structure profiling of glycan reported the altered expression of glycan-related genes and changed glycan patterns on the surface of hepatocytes in the fibrotic livers of CCl4-treated mice [46]. In line with these findings, glycan-associated metabolic pathways, including the other types of O-glycan biosynthesis (48.4%), glycosaminoglycan biosynthesis (keratin sulfate (60%)), N-glycan biosynthesis (38.8%), glycosaminoglycan degradation (38.1%) and proteoglycans in cancer (24.9%), were highly enriched in the present study.
Recent studies demonstrate that Hh signaling plays the essential roles in liver fibrosis by controlling the metabolism of HSCs. Hh signaling induces the activation of HSCs by increasing the expression of genes involved in glycolysis, whereas the suppression of the Hh pathway in activated HSCs reduces the number of glycolysis-occurring HSCs and the degree of liver fibrosis in mice [19]. Furthermore, curcumin, the polyphenolic chemical from turmeric, reduces the expression of glycolysis-regulatory genes by inhibiting the Hh signaling pathway in HSCs of rat fibrotic liver [47]. These findings suggest that the miRNAs targeting Hh signaling, among differentially-expressed miRNAs in liver fibrosis, influence the HSC metabolic pathways and activation by regulating Hh signaling. In the current study, the Hh-related genes, including Bmp4, Gas1, Gli3, Hhip, Ihh, Prkacb, Stk36, Wnt6, Wnt10b, Wnt9a and Wnt11, were dysregulated in our murine model of CCl4-induced liver fibrosis. Hhip is a well-known repressor of Hh ligands (Sonic Hh, Indian Hh, Desert Hh) [48,49] and known to be downregulated in the injured liver [50]. As the expression of Hhip was lowered, its putative regulator miR-342-3p and the RNA level of Ihh and Gli3 were significantly elevated in the CCl4 group compared to the control group (p < 0.05). These findings imply that the activation of Ihh-mediated Hh signaling may be promoted by miR-342-3p-mediated inhibition of Hhip during liver fibrosis. Bmp4 was reported to be induced by Sonic Hh and Ihh [51,52], and its expression was significantly elevated in the fibrotic livers of rat with bile duct ligation and an in vitro-cultured rat HSC line [53]. In line with these findings, the RNA level of Bmp4 was greatly higher in CCl4-treated fibrotic liver than corn oil-treated liver of mice in the present study. Although four other Hh-related genes, including Gas1, Prkacb, Stk36 and Wnt9a, were significantly downregulated with the simultaneous upregulation of their regulator miRNAs in the CCl4 group compared to the control group, the roles of these Hh-related genes in liver fibrosis is poorly understood. Further studies are needed to elucidate their function in liver. Consistent with our data, Wnt10b was reported to be elevated in primary rat HSCs during activation [54]. Although the function of Wnt11 and Wnt6 in liver fibrosis was unknown, Wnt11 was shown to enhance the expression of mesenchymal markers, such as Zeb1, Snail1, Pai1 and α-SMA, in response to the TGF-β signaling in renal fibrosis [55], and Wnt6 was reported to be downregulated during renal fibrogenesis [56]. Wnt10b, a putative target gene of miR-342-3p, and Wnt11 targeted by miR-188-5p were upregulated in the fibrotic liver, although the expression of miR-342-3p and miR-188-5p were elevated. In addition, the expression of wnt6 targeted by miR-378 decreased, despite the reduction of miR-378 in CCl4-treated liver. These results suggest that other factors might be involved in regulating the expression of these genes, rather than the miRNA-induced gene silencing. It is also possible that the miRNAs positively regulate the expression of Wnt10b, Wnt11 and Wnt6, because miRNAs are known to be able to upregulate the expression of their target genes depending on the types of cells, cell culture condition and association with other regulatory elements [57,58]. Therefore, additional studies are further required to understand what kinds of miRNAs positively or negatively regulate the expression of their putative target genes, and consequentially, how they influence cellular events during liver fibrosis.
In the KEGG analysis presenting the relation between miRNAs and their target genes, a total of 843 putative target genes were predicted to be involved in the top 72 pathways associated with CCl4-induced hepatic fibrosis. Among these predicted targets, 680 genes were each individually connected with a single dysregulated miRNA, whereas 163 genes were related to more than two miRNAs. Prkaa2, one of the core target genes (Figure 3B) related to miR-378, miR-342-3p, miR-188-5p and let-7i, seems to be involved in the FoxO signaling pathway, mTOR signaling pathway, PI3K-Akt signaling pathway, AMPK signaling pathway, insulin signaling pathway and the adipocytokine signaling pathway. Of the putative target genes, 231 target genes were predicted to be modulated by miR-342-3p, which was reported to control lipogenesis and cholesterogenesis by targeting SREBP-1, a key transcription factor for lipogenesis-related genes, such as fatty acid synthase (FASN) and 3-hydroxy-3-methylglutaryl-CoA reductase (HMGCR). In addition, the level of miR-342-3p was reported to be higher in liver cirrhosis and NASH than chronic hepatitis and nonalcoholic fatty liver, respectively, although its function in cirrhosis and NASH was not investigated [59,60]. miR-34a was predicted to be connected with 245 target genes. miR-34a, which is a member of the miR-34 family composed of miR-34a, -34b and -34c, is well known as a tumor suppressor in various kinds of cancers, including liver cancer [61]. During liver regeneration after partial hepatectomy, miR-34a was highly upregulated [62]. In addition, matrix metallopeptidase 9 (MMP9), a marker of activated HSC, was upregulated in human hepatocytes transfected with miR-34a precursor, and the level of miR-34a increased in ethanol-exposed hepatocyte and liver followed by upregulation of the MMP9 in mice [63]. Taken together, those results indicate that miR-34a is associated with liver fibrosis.
Among the downregulated miRNAs, the expression of miR-378 was validated in both the fibrotic livers of CCl4-treated mice and in the activated HSCs in our previous study [17]. We demonstrated that miR-378 promoted the inactivation of HSCs by targeting Gli3, a transcriptional factor of Hh signaling. This reduced expression of miR-378 and induced expression of miR-34a-5p were also shown in the fibrotic liver of dimethylnitrosamine (DMN)-treated rats [64] and methionine/choline-deficient (MCD)-dieted mice [65]. In addition, miR-202 was shown to be a tumor suppressor that inhibited cell proliferation by targeting Gli1, a transcription factor of the Hh signaling pathway, in gastric cancer [66]. In the current studies, miR-202 was predicted to target Col9α3, a fibrillar collagen, increased in fibrotic liver. These findings suggest the potential of miR-202 as an anti-fibrotic factor in the liver.
We reported eight miRNAs differentially expressed in the fibrotic liver, whereas other groups found more than eight miRNAs showing the change of expression in the fibrotic liver [64,65,67]. There are several factors influencing the data, such as the method of microarray analysis, mouse strain, chemical, period of chemical or injury treatment [17]. The SurePrint G3 Mouse miRNA Microarray (Agilent, Santa Clara, CA, USA) that covered 1247 unique mouse miRNA targets using a more updated version (miRBase v19.0 [68]) was employed to analyze our sample. Hence, our microarray data analyzed by the more advanced version provided the updated miRNA expression profiles in chronically-damaged liver with fibrosis. In addition, the expression change of eight miRNAs among 12 miRNAs was validated through qRT-PCR. As described above, up- or downregulation of miR-378, miR-34a-5p and miR-202 was reported by other independent studies [64,65,66].

4. Materials and Methods

4.1. Experimental Animal Model

Animal models of liver fibrosis were constructed as previously described [17,69]. Six-week-old male C57BL/6 mice were purchased from Hyochang (Dae-gu, Korea), maintained under a twelve-hour light/dark cycle and allowed free access to food and water. After one week for adaptation, mice received intraperitoneal injection of 0.6 mL/kg body weight of carbon-tetrachloride (CCl4, Sigma-Aldrich, St. Louis, MO, USA) dissolved in corn oil, twice a week for ten weeks, in order to induce liver fibrosis. Mice having the same volume of corn oil were used for the control group (n = 6/each group). At forty-eight hours after the last injection, mice were sacrificed, and liver tissues were collected. This study was carried out in strict accordance with the recommendations in the Guide for the Care and Use of Laboratory Animals of the National Institutes of Health (NIH, New York, NY, USA). All animal care and experiments were approved by the Pusan National University Institutional Animal Care and Use Committee (PNU-IACUC).

4.2. Hematoxylin-Eosin and Sirius Red Staining

Liver specimens were fixed in 10% neutral buffered formalin (NBF, Sigma-Aldrich), embedded in paraffin and cut into 4-µm sections. To perform the H&E and Sirius red staining to examine hepatic morphology and fibrosis, respectively, specimens were deparaffinized, hydrated and stained by standard methods.

4.3. RNA Isolation and MicroRNA Microarray

Total RNA, including miRNA, was purified from liver tissues by using TRIzol Reagent (Ambion, Thermo Fisher Scientific, Waltham, MA, USA) according to the manufacturer’s instruction. RNA quantity and quality were determined using a NanoDrop (Thermo Fisher Scientific Waltham, MA, USA) and Bioanalyzer (Agilent, Santa Clara, CA, USA). Desalted Cy3-labeled RNA was prepared from 100 ng of total RNA by using Agilent’s miRNA Complete Labeling and Hyb Kit (Agilent, Santa Clara, CA, USA) and then hybridized to the Agilent miRNA expression microarray according to the protocols provided by the manufacturer. The SurePrint G3 Mouse miRNA Microarray, Release 19.0, 8 × 60 K (Agilent, Inc., Santa Clara, CA, USA), platform was used for miRNA profiling, and raw data were extracted using the software provided by Agilent Feature Extraction Software (v11.0.1.1). For microarray analysis, raw data were firstly filtered by flag signal as the detection in all samples. Filtered raw data were processed using the limma Bioconductor package [70] in the R statistical environment [71]. After the quantile normalization of data, differentially-expressed miRNAs were identified with p < 0.05 and fold changes >2. The microarray data have been deposited in the NCBI GEO database under the accession code GSE77271.

4.4. Real-Time Quantitative Reverse Transcriptional Polymerase Chain Reaction Analysis

Template cDNA was synthesized from total RNA using the miScript Reverse Transcriptase Kit (Qiagen, Hilden, Germany) or the SupersScript First-strand Synthesis System (Invitrogen, Thermo Fisher Scientific, Waltham, MA, USA) according to the manufacturer’s protocol. Then, real-time PCR was performed using the miScript SYBR Green PCR Kit (Qiagen) or Power SYBR Green Master Mix (Applied Biosystem, Thermo Fisher Scientific, Waltham, MA, USA) on the manufacturer’s specification (Mastercycler Real-Time PCR machine, Eppendorf, Hamburg, Germany). All reactions were in triplicate, and data were analyzed according to the ∆∆Ct method. U1A small nuclear RNA (RNU1A) for miRNA and 40S ribosomal protein S9 mRNA for mRNA were used for normalization of the expression level. The sequences of miRNA primers used in this study are as follows: mmu-miR-574-5p, TGAGTGTGTGTGTGTGAGTGTGT; mmu-miR-466i, TGTGTGTGTGTGTGTGTGTG; mmu-miR-342-3p, TCTCACACAGAAATCGCACCCGT; mmu-let-7i-5p, TGAGGTAGTAGTTTGTGCTGTT; mmu-miR-34a-5p, TGGCAGTGTCTTAGCTGGTTGT; mmu-miR-188-5p, CATCCCTTGCATGGTGGAGGG; mmu-miR-202-3p, AGAGGTATAGCGCATGGGAAGA; mmu-miR-212-3p, TAACAGTCTCCAGTCACGGCCA; U1A snRNA, CGACTGCATAATTTGTGGTAGTGG. These primers were used in combination with the miScript Universal primer (Qiagen). The sequences of mRNA primers used in this study are listed in Table 4.

4.5. Statistical Analysis

Results of qRT-PCR analysis are shown as the mean ± standard error of mean (SEM) among individuals of the same group. Statistical significances between control and CCl4-treated groups were analyzed by the unpaired two-sample Student’s t-test, and p < 0.05 (one-tailed) was considered as significantly different.

4.6. MicroRNA Target Prediction

The miRWalk database [72] was used to identify target genes of 6 differentially-expressed miRNAs. In this analysis, genes with p < 0.05 were regarded as predicted and validated targets. To construct the overall network between miRNAs and target genes, we visualize interactions using the Cytoscape software [73]. In a network, green triangles represent differentially-expressed miRNAs, and black circles represent target genes. The color variations of edges are as follows: red, upregulated miRNAs; blue, downregulated miRNAs. Furthermore, the size of circles reflects the number of interactions with miRNAs.

4.7. Gene Ontology and Kyoto Encyclopedia of Genes and Genomes Enrichment Analyses

To investigate the biological functions of potential target genes controlled by hepatic fibrosis-associated miRNAs, we attempted to conduct GO enrichment analysis. To accomplish this, we downloaded GO annotation data for Mus musculus from the UniProt database [74] and matched to target genes via the python language script. In addition, KEGG enrichment analysis was carried out using total pathways and modules’ data. These data were downloaded using the WGET program that retrieves contents from web sites [75] and matched to target genes in the same way as for GO enrichment analysis. Finally, the results of GO and KEGG enrichment analysis were ranked with statistical significance by calculating their p-values based on hypergeometric distribution with p < 0.001 and p < 0.05 considered to indicate significance, respectively [76].

5. Conclusions

In conclusion, we identified a total of eight miRNAs differentially expressed in fibrotic livers of CCl4-treated mice compared to the control livers of corn oil-treated mice. We first performed the bioinformatics analysis for these eight miRNAs, including target prediction, using miRWalk, GO analysis and KEGG pathway enrichment analysis. This approach demonstrates that enriched GO and pathways are consistent with well-known and associated signaling pathways involved in liver fibrosis. In addition, it showed that the dynamic interactions of various signaling pathways contributed to hepatic fibrogenesis and that these complicated networks were regulated by miRNAs. Although further study is needed to verify the potential roles of these miRNAs in liver, they may help to develop novel diagnostic biomarkers and therapeutic targets in chronic liver diseases with fibrosis.

Supplementary Materials

Supplementary materials can be found at https://0-www-mdpi-com.brum.beds.ac.uk/1422-0067/17/6/961/s1.

Acknowledgments

This work was supported by the National Research Foundation (NRF) of Korea funded by the Korea government (MEST) (NRF-2014M2B2A9030333) to Youngmi Jung.

Author Contributions

Jeongeun Hyun, Young-Su Seo and Youngmi Jung conceived of and designed the experiments. Jeongeun Hyun, Jungwook Park, Sihyung Wang, Jieun Kim and Hyun-Hee Lee performed the experiments. Jeongeun Hyun, Jungwook Park, Young-Su Seo and Youngmi Jung analyzed the data. Young-Su Seo and Youngmi Jung contributed reagents/materials/analysis tools. Jeongeun Hyun, Young-Su Seo and Youngmi Jung wrote the paper.

Conflicts of Interest

The authors declare no conflict of interest.

Abbreviations

HBV/HCVhepatitis B/C virus
NASHnon-alcoholic steatohepatitis
miRNAmicroRNAs
HSChepatic stellate cells
TGFtransforming growth factor
CCl4carbon-tetrachloride
GOgene ontology
KEGGKyoto Encyclopedia of Genes and Genomes
H&Ehematoxylin-eosin stain
qRT-PCRquantitative reverse transcriptional polymerase chain reaction
C2cd2C2 calcium-dependent domain containing 2
Ppm1fprotein phosphatase 1F
Slcla2solute carrier family 1
Prom2prominin 2
Prkaa2protein kinase, AMP-activated, α 2 catalytic subunit
Marcksl1MARCKS-like 1
Khkketohexokinase
Gabra3γ-aminobutyric acid (GABA) A receptor, subunit α 3
Col9a3collagen, type IX, α 3
TCAtricarboxylic acid
Fbxl22F-box and leucine-rich repeat protein 22
Hhhedgehog
TNFtumor necrosis factor
Bmp4bone morphogenetic protein 4
Csnk1g1casein kinase 1 γ 1
Gas1growth arrest specific 1
Gli1GLI-Krüppel family member 1
HhipHh-interacting protein
IhhIndian hedgehog
cAMPcyclic adenosine monophosphate
PrkacbcAMP-dependent protein kinase catalytic subunit β
Stk36serine/threonine kinase 36
Sufusuppressor of fused homolog
MMTVmouse mammary tumor virus
Wntwingless-type MMTV integration site family
MAPKmitogen-activated protein kinase
mTORmechanistic target of rapamycin
HIFhypoxia-inducible factor
FASNfatty acid synthase
HMGCR3-hydroxy-3-methylglutaryl-CoA reductase
MMP9matrix metallopeptidase 9
DMNdimethylnitrosamine
MCDmethionine/choline-deficient
NBFneutral buffered formalin
RNU1AU1A small nuclear RNA
SEMstandard error of the mean
GOgene ontology

References

  1. Bataller, R.; Brenner, D.A. Liver fibrosis. J. Clin. Investig. 2005, 115, 209–218. [Google Scholar] [CrossRef] [PubMed]
  2. Kim, V.N. MicroRNA biogenesis: Coordinated cropping and dicing. Nat. Rev. Mol. Cell Biol. 2005, 6, 376–385. [Google Scholar] [CrossRef] [PubMed]
  3. Bartel, D.P. MicroRNAs: Target recognition and regulatory functions. Cell 2009, 136, 215–233. [Google Scholar] [CrossRef] [PubMed]
  4. Lee, H.-M.; Nguyen, D.T.; Lu, L.-F. Progress and challenge of microRNA research in immunity. Front. Genet. 2014, 5, 1–8. [Google Scholar]
  5. Shenoy, A.; Blelloch, R.H. Regulation of microRNA function in somatic stem cell proliferation and differentiation. Nat. Rev. Mol. Cell Biol. 2014, 15, 565–576. [Google Scholar] [CrossRef] [PubMed]
  6. Bartel, D.P. MicroRNAs: Genomics, biogenesis, mechanism, and function. Cell 2004, 116, 281–297. [Google Scholar] [CrossRef]
  7. Bala, S.; Petrasek, J.; Mundkur, S.; Catalano, D.; Levin, I.; Ward, J.; Alao, H.; Kodys, K.; Szabo, G. Circulating microRNAs in exosomes indicate hepatocyte injury and inflammation in alcoholic, drug-induced, and inflammatory liver diseases. Hepatology 2012, 56, 1946–1957. [Google Scholar] [CrossRef] [PubMed]
  8. Szabo, G.; Bala, S. MicroRNAs in liver disease. Nat. Rev. Gastroenterol. Hepatol. 2013, 10, 542–552. [Google Scholar] [CrossRef] [PubMed]
  9. Jiang, X.; Tsitsiou, E.; Herrick, S.E.; Lindsay, M.A. MicroRNAs and the regulation of fibrosis. FEBS J. 2010, 277, 2015–2021. [Google Scholar] [CrossRef] [PubMed]
  10. Bowen, T.; Jenkins, R.H.; Fraser, D.J. MicroRNAs, transforming growth factor β-1, and tissue fibrosis. J. Pathol. 2013, 229, 274–285. [Google Scholar] [CrossRef] [PubMed]
  11. Zhao, J.; Tang, N.; Wu, K.; Dai, W.; Ye, C.; Shi, J.; Zhang, J.; Ning, B.; Zeng, X.; Lin, Y. miR-21 simultaneously regulates ERK1 signaling in HSC activation and hepatocyte EMT in hepatic fibrosis. PLoS ONE 2014, 9, e108005. [Google Scholar] [CrossRef] [PubMed]
  12. Roderburg, C.; Urban, G.W.; Bettermann, K.; Vucur, M.; Zimmermann, H.; Schmidt, S.; Janssen, J.; Koppe, C.; Knolle, P.; Castoldi, M. Micro-RNA profiling reveals a role for miR-29 in human and murine liver fibrosis. Hepatology 2011, 53, 209–218. [Google Scholar] [CrossRef] [PubMed]
  13. Lakner, A.M.; Steuerwald, N.M.; Walling, T.L.; Ghosh, S.; Li, T.; McKillop, I.H.; Russo, M.W.; Bonkovsky, H.L.; Schrum, L.W. Inhibitory effects of microRNA 19b in hepatic stellate cell-mediated fibrogenesis. Hepatology 2012, 56, 300–310. [Google Scholar] [CrossRef] [PubMed]
  14. Wang, J.; Huang, W.; Xu, R.; Nie, Y.; Cao, X.; Meng, J.; Xu, X.; Hu, S.; Zheng, Z. MicroRNA-24 regulates cardiac fibrosis after myocardial infarction. J. Cell. Mol. Med. 2012, 16, 2150–2160. [Google Scholar] [CrossRef] [PubMed]
  15. Williams, A.T.; Burk, R.F. In Carbon tetrachloride hepatotoxicity: An example of free radical-mediated injury. Semin. Liver Dis. 1990, 10, 279–284. [Google Scholar] [CrossRef] [PubMed]
  16. Shi, J.; Aisaki, K.; Ikawa, Y.; Wake, K. Evidence of hepatocyte apoptosis in rat liver after the administration of carbon tetrachloride. Am. J. Pathol. 1998, 153, 515–525. [Google Scholar] [CrossRef]
  17. Hyun, J.; Wang, S.; Kim, J.; Rao, K.M.; Park, S.Y.; Chung, I.; Ha, C.-S.; Kim, S.-W.; Yun, Y.H.; Jung, Y. MicroRNA-378 limits activation of hepatic stellate cells and liver fibrosis by suppressing GLI3 expression. Nat. Commun. 2016, 7, 1–16. [Google Scholar] [CrossRef] [PubMed]
  18. Pawson, T.; Nash, P. Protein–protein interactions define specificity in signal transduction. Genes Dev. 2000, 14, 1027–1047. [Google Scholar] [PubMed]
  19. Chen, Y.; Choi, S.S.; Michelotti, G.A.; Chan, I.S.; Swiderska-Syn, M.; Karaca, G.F.; Xie, G.; Moylan, C.A.; Garibaldi, F.; Premont, R. Hedgehog controls hepatic stellate cell fate by regulating metabolism. Gastroenterology 2012, 143, 1319–1329. [Google Scholar] [CrossRef] [PubMed]
  20. Sethi, J.K.; Hotamisligil, G.S. In The role of TNFα in adipocyte metabolism, Semin. Cell Dev. Biol. 1999, 10, 19–29. [Google Scholar] [CrossRef] [PubMed]
  21. Yang, L.; Wang, Y.; Mao, H.; Fleig, S.; Omenetti, A.; Brown, K.D.; Sicklick, J.K.; Li, Y.X.; Diehl, A.M. Sonic hedgehog is an autocrine viability factor for myofibroblastic hepatic stellate cells. J. Hepatol. 2008, 48, 98–106. [Google Scholar] [CrossRef] [PubMed]
  22. Tada, M.; Kanai, F.; Tanaka, Y.; Tateishi, K.; Ohta, M.; Asaoka, Y.; Seto, M.; Muroyama, R.; Fukai, K.; Imazeki, F. Down-regulation of hedgehog-interacting protein through genetic and epigenetic alterations in human hepatocellular carcinoma. Clin. Cancer Res. 2008, 14, 3768–3776. [Google Scholar] [CrossRef] [PubMed]
  23. Chuang, P.-T.; Kawcak, T.N.; McMahon, A.P. Feedback control of mammalian hedgehog signaling by the hedgehog-binding protein, HIP1, modulates FGF signaling during branching morphogenesis of the lung. Genes Dev. 2003, 17, 342–347. [Google Scholar] [CrossRef] [PubMed]
  24. Gantier, M.P.; McCoy, C.E.; Rusinova, I.; Saulep, D.; Wang, D.; Xu, D.; Irving, A.T.; Behlke, M.A.; Hertzog, P.J.; Mackay, F. Analysis of microRNA turnover in mammalian cells following DICER1 ablation. Nucleic Acids Res. 2011, 39, 5692–5703. [Google Scholar] [CrossRef] [PubMed]
  25. Weber, J.A.; Baxter, D.H.; Zhang, S.; Huang, D.Y.; Huang, K.H.; Lee, M.J.; Galas, D.J.; Wang, K. The microRNA spectrum in 12 body fluids. Clin. Chem. 2010, 56, 1733–1741. [Google Scholar] [CrossRef] [PubMed]
  26. Esau, C.; Davis, S.; Murray, S.F.; Yu, X.X.; Pandey, S.K.; Pear, M.; Watts, L.; Booten, S.L.; Graham, M.; McKay, R. MiR-122 regulation of lipid metabolism revealed by in vivo antisense targeting. Cell Metab. 2006, 3, 87–98. [Google Scholar] [CrossRef] [PubMed]
  27. Kota, J.; Chivukula, R.R.; O'Donnell, K.A.; Wentzel, E.A.; Montgomery, C.L.; Hwang, H.-W.; Chang, T.-C.; Vivekanandan, P.; Torbenson, M.; Clark, K.R. Therapeutic microRNA delivery suppresses tumorigenesis in a murine liver cancer model. Cell 2009, 137, 1005–1017. [Google Scholar] [CrossRef] [PubMed]
  28. Fu, X.; Dong, B.; Tian, Y.; Lefebvre, P.; Meng, Z.; Wang, X.; Pattou, F.; Han, W.; Lou, F.; Jove, R. MicroRNA-26a regulates insulin sensitivity and metabolism of glucose and lipids. J. Clin. Investig. 2015, 125, 2497–2509. [Google Scholar] [CrossRef] [PubMed]
  29. Li, J.; Pan, Y.; Kan, M.; Xiao, X.; Wang, Y.; Guan, F.; Zhang, X.; Chen, L. Hepatoprotective effects of berberine on liver fibrosis via activation of amp-activated protein kinase. Life Sci. 2014, 98, 24–30. [Google Scholar] [CrossRef] [PubMed]
  30. Adachi, M.; Osawa, Y.; Uchinami, H.; Kitamura, T.; Accili, D.; Brenner, D.A. The forkhead transcription factor FoxO1 regulates proliferation and transdifferentiation of hepatic stellate cells. Gastroenterology 2007, 132, 1434–1446. [Google Scholar] [CrossRef] [PubMed]
  31. Zhang, X.; Du, G.; Xu, Y.; Li, X.; Fan, W.; Chen, J.; Liu, C.; Chen, G.; Liu, C.; Zern, M.A. Inhibition of notch signaling pathway prevents cholestatic liver fibrosis by decreasing the differentiation of hepatic progenitor cells into cholangiocytes. Lab. Investig. 2016, 96, 350–360. [Google Scholar] [CrossRef] [PubMed]
  32. Ji, L.; Xue, R.; Tang, W.; Wu, W.; Hu, T.; Liu, X.; Peng, X.; Gu, J.; Chen, S.; Zhang, S. Toll like receptor 2 knock-out attenuates carbon tetrachloride (CCl4)-induced liver fibrosis by downregulating MAPK and NF-κB signaling pathways. FEBS Lett. 2014, 588, 2095–2100. [Google Scholar] [CrossRef] [PubMed]
  33. Harada, K.; Yuko, K.; Sato, Y.; Ikeda, H.; Nakanuma, Y. Significance of oestrogen-related receptor γ on biliary epithelial cells in the pathogenesis of primary biliary cirrhosis. J. Clin. Pathol. 2014, 67, 566–572. [Google Scholar] [CrossRef] [PubMed]
  34. Kodama, T.; Takehara, T.; Hikita, H.; Shimizu, S.; Shigekawa, M.; Tsunematsu, H.; Li, W.; Miyagi, T.; Hosui, A.; Tatsumi, T. Increases in p53 expression induce CTGF synthesis by mouse and human hepatocytes and result in liver fibrosis in mice. J. Clin. Investig. 2011, 121, 3343–3356. [Google Scholar] [CrossRef] [PubMed]
  35. Philips, G.M.; Chan, I.S.; Swiderska, M.; Schroder, V.T.; Guy, C.; Karaca, G.F.; Moylan, C.; Venkatraman, T.; Feuerlein, S.; Syn, W.-K. Hedgehog signaling antagonist promotes regression of both liver fibrosis and hepatocellular carcinoma in a murine model of primary liver cancer. PLoS ONE 2011, 6, e23943. [Google Scholar] [CrossRef] [PubMed]
  36. Li, J.; Li, X.; Xu, W.; Wang, S.; Hu, Z.; Zhang, Q.; Deng, X.; Wang, J.; Zhang, J.; Guo, C. Antifibrotic effects of luteolin on hepatic stellate cells and liver fibrosis by targeting AKT/mTOR/p70S6K and TGFβ/Smad signalling pathways. Liver Int. 2015, 35, 1222–1233. [Google Scholar] [CrossRef] [PubMed]
  37. Lok, A. Hepatitis B: Liver fibrosis and hepatocellular carcinoma. Gastroenterol. Clin. Biol. 2009, 33, 911–915. [Google Scholar] [CrossRef] [PubMed]
  38. Son, G.; Hines, I.N.; Lindquist, J.; Schrum, L.W.; Rippe, R.A. Inhibition of phosphatidylinositol 3-kinase signaling in hepatic stellate cells blocks the progression of hepatic fibrosis. Hepatology 2009, 50, 1512–1523. [Google Scholar] [CrossRef] [PubMed]
  39. Yang, Y.; Wang, H.; Lv, X.; Wang, Q.; Zhao, H.; Yang, F.; Yang, Y.; Li, J. Involvement of camp-PKA pathway in adenosine A 1 and A 2A receptor-mediated regulation of acetaldehyde-induced activation of HSCs. Biochimie 2015, 115, 59–70. [Google Scholar] [CrossRef] [PubMed]
  40. Gressner, A.M.; Weiskirchen, R.; Breitkopf, K.; Dooley, S. Roles of TGF-β in hepatic fibrosis. Front. Biosci. 2002, 7, d793–d807. [Google Scholar] [CrossRef] [PubMed]
  41. Moon, J.-O.; Welch, T.P.; Gonzalez, F.J.; Copple, B.L. Reduced liver fibrosis in hypoxia-inducible factor-1α-deficient mice. Am. J. Physiol. Gastrointest. Liver Physiol. 2009, 296, G582–G592. [Google Scholar] [CrossRef] [PubMed]
  42. Marchesini, G.; Bugianesi, E.; Forlani, G.; Cerrelli, F.; Lenzi, M.; Manini, R.; Natale, S.; Vanni, E.; Villanova, N.; Melchionda, N. Nonalcoholic fatty liver, steatohepatitis, and the metabolic syndrome. Hepatology 2003, 37, 917–923. [Google Scholar] [CrossRef] [PubMed]
  43. Qin, Y.; Zhong, Y.; Dang, L.; Zhu, M.; Yu, H.; Chen, W.; Cui, J.; Bian, H.; Li, Z. Alteration of protein glycosylation in human hepatic stellate cells activated with transforming growth factor-β1. J. Proteom. 2012, 75, 4114–4123. [Google Scholar] [CrossRef] [PubMed]
  44. Blomme, B.; Van Steenkiste, C.; Callewaert, N.; van Vlierberghe, H. Alteration of protein glycosylation in liver diseases. J. Hepatol. 2009, 50, 592–603. [Google Scholar] [CrossRef] [PubMed]
  45. Tsukada, S.; Parsons, C.J.; Rippe, R.A. Mechanisms of liver fibrosis. Clin. Chim. Acta 2006, 364, 33–60. [Google Scholar] [CrossRef] [PubMed]
  46. Yu, H.; Zhu, M.; Qin, Y.; Zhong, Y.; Yan, H.; Wang, Q.; Bian, H.; Li, Z. Analysis of glycan-related genes expression and glycan profiles in mice with liver fibrosis. J. Proteome Res. 2012, 11, 5277–5285. [Google Scholar] [CrossRef] [PubMed]
  47. Lian, N.; Jiang, Y.; Zhang, F.; Jin, H.; Lu, C.; Wu, X.; Lu, Y.; Zheng, S. Curcumin regulates cell fate and metabolism by inhibiting hedgehog signaling in hepatic stellate cells. Lab. Investig. 2015, 95, 790–803. [Google Scholar] [CrossRef] [PubMed]
  48. Bishop, B.; Aricescu, A.R.; Harlos, K.; O'Callaghan, C.A.; Jones, E.Y.; Siebold, C. Structural insights into hedgehog ligand sequestration by the human hedgehog-interacting protein hhip. Nat. Struct. Mol. Biol. 2009, 16, 698–703. [Google Scholar] [CrossRef] [PubMed]
  49. Chuang, P.-T.; McMahon, A.P. Vertebrate hedgehog signalling modulated by induction of a hedgehog-binding protein. Nature 1999, 397, 617–621. [Google Scholar] [CrossRef] [PubMed]
  50. Omenetti, A.; Choi, S.; Michelotti, G.; Diehl, A.M. Hedgehog signaling in the liver. J. Hepatol. 2011, 54, 366–373. [Google Scholar] [CrossRef] [PubMed]
  51. Roberts, D.J.; Johnson, R.L.; Burke, A.C.; Nelson, C.E.; Morgan, B.A.; Tabin, C. Sonic hedgehog is an endodermal signal inducing Bmp-4 and Hox genes during induction and regionalization of the chick hindgut. Development 1995, 121, 3163–3174. [Google Scholar] [PubMed]
  52. Astorga, J.; Carlsson, P. Hedgehog induction of murine vasculogenesis is mediated by Foxf1 and Bmp4. Development 2007, 134, 3753–3761. [Google Scholar] [CrossRef] [PubMed]
  53. Fan, J.; Shen, H.; Sun, Y.; Li, P.; Burczynski, F.; Namaka, M.; Gong, Y. Bone morphogenetic protein 4 mediates bile duct ligation induced liver fibrosis through activation of SMAD1 and ERK1/2 in rat hepatic stellate cells. J. Cell. Physiol. 2006, 207, 499–505. [Google Scholar] [CrossRef] [PubMed]
  54. Cheng, J.H.; She, H.; Han, Y.-P.; Wang, J.; Xiong, S.; Asahina, K.; Tsukamoto, H. Wnt antagonism inhibits hepatic stellate cell activation and liver fibrosis. Am. J. Physiol. Gastrointest. Liver Physiol. 2008, 294, G39–G49. [Google Scholar] [CrossRef] [PubMed]
  55. Zhang, P.; Cai, Y.; Soofi, A.; Dressler, G.R. Activation of Wnt11 by transforming growth factor-β drives mesenchymal gene expression through non-canonical wnt protein signaling in renal epithelial cells. J. Biol. Chem. 2012, 287, 21290–21302. [Google Scholar] [CrossRef] [PubMed]
  56. Beaton, H.; Andrews, D.; Parsons, M.; Murphy, M.; Gaffney, A.; Kavanagh, D.; McKay, G.J.; Maxwell, A.P.; Taylor, C.T.; Cummins, E.P. Wnt6 regulates epithelial cell differentiation and is dysregulated in renal fibrosis. Am. J. Physiol. Ren. Physiol. 2016. [Google Scholar] [CrossRef] [PubMed]
  57. Valinezhad Orang, A.; Safaralizadeh, R.; Kazemzadeh-Bavili, M. Mechanisms of miRNA-mediated gene regulation from common downregulation to mRNA-specific upregulation. Int. J. Genom. 2014, 2014, 1–15. [Google Scholar] [CrossRef] [PubMed]
  58. Vasudevan, S. Posttranscriptional upregulation by microRNAs. Wiley Interdiscip. Rev. RNA 2012, 3, 311–330. [Google Scholar] [CrossRef] [PubMed]
  59. Murakami, Y.; Yasuda, T.; Saigo, K.; Urashima, T.; Toyoda, H.; Okanoue, T.; Shimotohno, K. Comprehensive analysis of microRNA expression patterns in hepatocellular carcinoma and non-tumorous tissues. Oncogene 2005, 25, 2537–2545. [Google Scholar] [CrossRef] [PubMed]
  60. Jin, X.; Chen, Y.P.; Kong, M.; Zheng, L.; Yang, Y.D.; Li, Y.M. Transition from hepatic steatosis to steatohepatitis: Unique microRNA patterns and potential downstream functions and pathways. J. Gastroenterol. Hepatol. 2012, 27, 331–340. [Google Scholar] [CrossRef] [PubMed]
  61. Dang, Y.; Luo, D.; Rong, M.; Chen, G. Underexpression of miR-34a in hepatocellular carcinoma and its contribution towards enhancement of proliferating inhibitory effects of agents targeting c-MET. PLoS ONE 2013, 8, e61054. [Google Scholar] [CrossRef] [PubMed]
  62. Chen, H.; Sun, Y.; Dong, R.; Yang, S.; Pan, C.; Xiang, D.; Miao, M.; Jiao, B. miR-34a is upregulated during liver regeneration in rats and is associated with the suppression of hepatocyte proliferation. PLoS ONE 2011, 6, e20238. [Google Scholar] [CrossRef] [PubMed]
  63. Meng, F.; Glaser, S.S.; Francis, H.; Yang, F.; Han, Y.; Stokes, A.; Staloch, D.; McCarra, J.; Liu, J.; Venter, J. Epigenetic regulation of miR-34a expression in alcoholic liver injury. Am. J. Pathol. 2012, 181, 804–817. [Google Scholar] [CrossRef] [PubMed]
  64. Li, W.Q.; Chen, C.; Xu, M.D.; Guo, J.; Li, Y.M.; Xia, Q.M.; Liu, H.M.; He, J.; Yu, H.Y.; Zhu, L. The rno-miR-34 family is upregulated and targets ACSL1 in dimethylnitrosamine-induced hepatic fibrosis in rats. FEBS J. 2011, 278, 1522–1532. [Google Scholar] [CrossRef] [PubMed]
  65. Du, J.; Niu, X.; Wang, Y.; Kong, L.; Wang, R.; Zhang, Y.; Zhao, S.; Nan, Y. miR-146a-5p suppresses activation and proliferation of hepatic stellate cells in nonalcoholic fibrosing steatohepatitis through directly targeting WNT1 and WNT5A. Sci. Rep. 2015, 5, 1–14. [Google Scholar] [CrossRef] [PubMed]
  66. Zhao, Y.; Li, C.; Wang, M.; Su, L.; Qu, Y.; Li, J.; Yu, B.; Yan, M.; Yu, Y.; Liu, B. Decrease of miR-202–3p expression, a novel tumor suppressor, in gastric cancer. PLoS ONE 2013, 8, e69756. [Google Scholar] [CrossRef] [PubMed]
  67. Roy, S.; Benz, F.; Vargas Cardenas, D.; Vucur, M.; Gautheron, J.; Schneider, A.; Hellerbrand, C.; Pottier, N.; Alder, J.; Tacke, F. miR-30c and miR-193 are a part of the TGF-β-dependent regulatory network controlling extracellular matrix genes in liver fibrosis. J. Dig. Dis. 2015, 16, 513–524. [Google Scholar] [CrossRef] [PubMed]
  68. Mirbase. Available online: http://www.mirbase.org/ (accessed on 1 November 2014).
  69. Kim, J.; Wang, S.; Hyun, J.; Choi, S.S.; Cha, H.; Ock, M.; Jung, Y. Hepatic stellate cells express thymosin β4 in chronically damaged liver. PLoS ONE 2015, 10, e0122758. [Google Scholar]
  70. Bioconductor. Available online: http://www.bioconductor.org/ (accessed on 1 November 2014).
  71. R project. Available online: https://www.r-project.org/ (accessed on 1 November 2014).
  72. Dweep, H.; Sticht, C.; Pandey, P.; Gretz, N. Mirwalk–database: Prediction of possible miRNA binding sites by “walking” the genes of three genomes. J. Biomed. Inform. 2011, 44, 839–847. [Google Scholar] [CrossRef] [PubMed]
  73. Cytoscape. Available online: http://cytoscape.org/ (accessed on 1 November 2014).
  74. Uniprot. Available online: http://www.uniprot.org/ (accessed on 1 November 2014).
  75. GNU Wget 1.18 Manual. Available online: https://www.gnu.org/software/wget/ (accessed on 1 November 2014).
  76. Qureshi, R.; Sacan, A. Weighted set enrichment of gene expression data. BMC Syst. Biol. 2013, 7, 1–11. [Google Scholar] [CrossRef] [PubMed]
Figure 1. Changes of liver histomorphology and increased fibrosis in carbon-tetrachloride (CCl4)-treated livers. Hematoxylin-eosin (H&E) staining shows hepatocyte necrosis and immune-cell infiltration of the liver from representative CCl4-treated mice compared to corn oil-treated mice (CON) (scale bar = 50 µm). Sirius red staining in liver sections from representative CON and CCl4-treated mice shows the excessive collagen deposition in CCl4-treated livers (scale bar = 100 µm).
Ijms 17 00961 g001
Figure 2. Validation of miRNA microarray results by real-time quantitative reverse transcriptional polymerase chain reaction (qRT-PCR). qRT-PCR analysis was performed to validate the expression of dysregulated miRNAs in CCl4-treated livers, including six upregulated miRNAs (miR-574-5p, miR-466i, miR-342-3p, let-7i, miR-34a and miR-188-5p) and two downregulated miRNAs (miR-202 and miR-212-3p) in liver tissues from corn oil-treated mice (CON) (n = 4) and CCl4-treated mice (n = 5). Medians and ranges are graphed (* p < 0.05, ** p < 0.005, vs. the CON group). A small dot indicates the maximum observation beyond the range.
Ijms 17 00961 g002
Figure 3. The regulatory network of miRNAs and target genes. The interaction network between miRNAs and target genes was generated by the Cytoscape program. Green-triangle and black-circle nodes indicate six differentially-expressed miRNAs and 4079 target genes, respectively. Color variations of the edges are as follows: red, upregulated miRNAs; blue, downregulated miRNAs. The size of the circle nodes indicates the numbers of associated miRNAs. The smallest node represents genes associated with one miRNA, while the largest node represents genes associated with five miRNAs. (A) Total network; (B) top 10 core networks. Bar graphs on the right side of target genes show the log change of associated miRNAs in CCl4-treated livers (red: let-7i, yellow: miR-34a, green: miR-188-5p, sky blue: miR-342-3p, blue: miR-202-3p, pink: miR-378).
Ijms 17 00961 g003
Figure 4. Expressions of top 10 core genes, Ppm1f, 5830404H04Rik, Slc1a2, Prom2, Prkaa2, Marcksl1, Khk, Gabra3, Col9a3 and Fbxl22, targeted by more than four miRNAs in liver tissues from corn oil-(CON) (n = 6) or CCl4-treated mice (n = 6). Medians and ranges are graphed (* p < 0.05, ** p < 0.005, vs. the CON group).
Ijms 17 00961 g004
Figure 5. GO analysis of predicted target genes of dysregulated miRNAs in CCl4-induced liver fibrosis. GO enrichment analysis was conducted to investigate the functions of target genes of differentially-expressed miRNAs in CCl4-treated livers. A total of 63 terms were identified based on a p-value of <0.001. The top 10 GO terms and percentage of target genes are displayed in the graph. All data from the GO analyses on miRNA-target genes are listed in Table S3. (A) Cellular component; (B) molecular function; (C) biological process.
Ijms 17 00961 g005aIjms 17 00961 g005b
Figure 6. Expressions of target genes involved in the Hh signaling pathway. qRT-PCR analyses on the genes involved in Hh signaling, including Bmp4, Csnk1g1, Csnk1g2, Gas1, Gli1, Gli3, Hhip, Ihh, Prkacb, Stk36, Sufu, Wnt6, Wnt3, Wnt10b, Wnt9a and Wnt11, were conducted in liver tissues from corn oil-treated mice (CON) (n = 6) and CCl4-treated mice (n = 6). Medians and ranges are graphed (* p < 0.05, ** p < 0.005, vs. the CON group). Small dots indicate the maximum or minimum observations beyond the range.
Ijms 17 00961 g006
Table 1. Dysregulated microRNAs (miRNAs) in carbon-tetrachloride (CCl4)-induced liver fibrosis (>2-fold, p < 0.05).
Probe IDLog2 Change (CCl4/Corn Oil)Fold Change (CCl4/Corn Oil)Adjust p-Value
Upregulated miRNAs
mmu-miR-574-5p3.62521063812.339490.000259147
mmu-miR-466i-5p3.0843637938.4817610.000830411
mmu-miR-342-3p1.1805577132.2666440.003273323
mmu-let-7i-5p1.1364960662.1984640.016247731
mmu-miR-34a-5p1.8714557393.6590160.032876548
mmu-miR-188-5p2.7007791266.5015290.042779303
mmu-miR-51191.0480525362.0677370.042779303
Downregulated miRNAs
mmu-miR-378a-3p−1.3387790050.3953550.00162313
mmu-miR-202-3p−1.0791145510.4733190.003273323
mmu-miR-378b−1.3602334720.3895190.003273323
mmu-miR-378d−1.4248437950.372460.003273323
mmu-miR-212-3p−1.1327092030.4560580.018962762
Table 2. Significantly-enriched top 40 pathways of the target genes of differently-expressed miRNAs in CCl4-induced liver fibrosis (p < 0.05).
KEGG IDPathwayp-ValueKEGG IDPathwayp-Value
mmu01100Metabolic pathways8.71 × 10−8mmu04020Calcium signaling pathway3.75 × 10−3
mmu04152AMPK signaling pathway6.75 × 10−6mmu00071Fatty acid degradation4.23 × 10−3
mmu04920Adipocytokine signaling pathway4.78 × 10−5mmu04022cGMP-PKG signaling pathway4.62 × 10−3
mmu05200Pathways in cancer1.90 × 10−4mmu04915Estrogen signaling pathway6.78 × 10−3
mmu00514Other types of O-glycan biosynthesis3.13 × 10−4mmu00601Glycosphingolipid biosynthesis: lacto and neolacto series7.17 × 10−3
mmu00600Sphingolipid metabolism4.13 × 10−4mmu00561Glycerolipid metabolism7.21 × 10−3
mmu00533Glycosaminoglycan biosynthesis: keratan sulfate7.12 × 10−4mmu04115p53 signaling pathway9.55 × 10−3
mmu04910Insulin signaling pathway9.09 × 10−4mmu04666Fc γ R-mediated phagocytosis9.57 × 10−3
mmu00310Lysine degradation1.04 × 10−3mmu04014Ras signaling pathway1.00 × 10−2
mmu04068FoxO signaling pathway1.08 × 10−3mmu04725Cholinergic synapse1.01 × 10−2
mmu04974Protein digestion and absorption1.34 × 10−3mmu04340Hedgehog signaling pathway1.02 × 10−2
mmu04210Apoptosis1.53 × 10−3mmu04668TNF signaling pathway1.03 × 10−2
mmu00510N-Glycan biosynthesis1.62 × 10−3mmu04660T cell receptor signaling pathway1.05 × 10−2
mmu04330Notch signaling pathway1.62 × 10−3mmu04150mTOR signaling pathway1.12 × 10−2
mmu04080Neuroactive ligand-receptor interaction1.83 × 10−3mmu04142Lysosome1.25 × 10−2
mmu04611Platelet activation2.06 × 10−3mmu04550Signaling pathways regulating pluripotency of stem cells1.26 × 10−2
mmu00061Fatty acid biosynthesis2.21 × 10−3mmu01212Fatty acid metabolism1.27 × 10−2
mmu04913Ovarian steroidogenesis2.56 × 10−3mmu05340Primary immunodeficiency1.28 × 10−2
mmu04360Axon guidance2.84 × 10−3mmu00280Valine, leucine and isoleucine degradation1.31 × 10−2
mmu04010MAPK signaling pathway3.34 × 10−3mmu00010Glycolysis/gluconeogenesis1.36 × 10−2
MAPK, mitogen-activated protein kinase; PKG, protein kinase G; TNF, tumor necrosis factor; mTOR, mechanistic target of rapamycin.
Table 3. Putative target genes involved in the Hedgehog signaling pathway.
RefSeqGene NameTargeting miRNAOther Involved Pathways
NM_007554Bmp4mmu-miR-378TGF-β signaling pathway, signaling pathways regulating pluripotency of stem cells, pathways in cancer, basal cell carcinoma
NM_173185Csnk1g1mmu-miR-202-3p-
NM_134002Csnk1g2mmu-miR-378-
NM_008086Gas1mmu-miR-188-5p-
NM_010296Gli1mmu-miR-188-5pcAMP signaling pathway, pathways in cancer, basal cell carcinoma
NM_008130Gli3mmu-miR-378
NM_020259Hhipmmu-miR-342-3p
NM_010544Ihhmmu-miR-34a-
NM_011100Prkacbmmu-miR-34aMAPK signaling pathway, Ras signaling pathway, calcium signaling pathway, cAMP signaling pathway, apoptosis, adrenergic signaling in cardiomyocytes, platelet activation, cholinergic synapse, insulin signaling pathway, ovarian steroidogenesis, estrogen signaling pathway, melanogenesis, thyroid hormone synthesis, vasopressin-regulated water reabsorption, salivary secretion, bile secretion, pathways in cancer, proteoglycans in cancer, dilated cardiomyopathy
NM_175031Stk36mmu-let-7iPathways in cancer, basal cell carcinoma
NM_015752Sufummu-miR-34a
NM_009526Wnt6mmu-miR-378Signaling pathways regulating pluripotency of stem cells, melanogenesis, pathways in cancer, proteoglycans in cancer, basal cell carcinoma
NM_009522Wnt3ammu-let-7i
NM_009521Wnt3mmu-miR-342-3p
NM_011718Wnt10b
NM_139298Wnt9ammu-let-7i, mmu-miR-342-3p
NM_009519Wnt11mmu-miR-188-5p
TGF, transforming growth factor; cAMP, cyclic adenosine monophosphate; MAPK, mitogen-activated protein kinase.
Table 4. Primer sequences of mRNA used for qRT-PCR analysis.
GeneForward (5’ to 3’)Reverse (5’ to 3’)
Ppm1fGCTTCTTCAACTGCCTTTGGCCATGACCATCAAACACAGC
5830404H04RikGCTGGCTCATTTTCTTCAGGCGGAAGAAAAGCACCATCAT
Slc1a2TCTGAGGAGGCCAATACCACTTCATCCCGTCCTTGAACTC
Prom2GTGTGACATGATGGCTGACCACCCTGGGGATATGGAAAAG
Pkaa2CGGCGCCTTTCCTTGAATATGGCCTGTTCCTCACGGTATTA
Marcksl1GGCAGCCAGAGCTCTAAGGTCACGTGGCCATTCTCCT
KhkAGCCTCATGGAAGAGAAGCAGGAGGTCATCCAGGACAAAA
Gabra3ATGTGGCACTTTTATGTGACCACCCCAGGTTCTTGTCGTCTTG
Col9a3CAAGGATGGCATTGATGGAGCAGACCATCTACACCAGGCAGT
Fbxl22ATGGGCAAGCAGGTTAAATGCACGCGAACAGAACAGAAAA
Bmp4GAGGAGGAGGAAGAGCAGAGTGGGATGTTCTCCAGATGTT
Csnk1g1CAGTGGTTTTCACCTTCTGGAGGCCTTCACCTGCACTG
Csnk1g2TACTACTTCGGCCCTTGTGGGGCTTCACGTCACGGTAGAT
Gas1TAAATTGCTTGTGACCACTGGAGCATTACCGATGGATAGA
Gli1TGTGTGAGCAAGAAGGTTGCATGGCTTCTCATTGGAGTGG
Gli3GCAACCTCACTCTGCAACAACCTTGTGCCTCCATTTTGAT
HhipGGTCACATCTTGGGATTTGGTCCATTGTGAGTCTGGGTCA
IhhCAATCCCGACATCATCTTCAAGTTCAGACGGTCCTTGCAG
PrkacbTCTTTCCTGCGTCATCAGTGAAGGGAGCACTGGTCAGAGA
Stk36CCAGGAGAGTAGCAGCATCCTGTCTGCTCGGAATCATCTG
SufuTCCAGGTTACCGCTATCGTCTCCACTGTTGGGCTGAATGT
Wnt6TGTCAGTTCCAGTTCCGTTTCCGCTGCGGTGATTGCAAACA
Wnt3aGGCTCCTCTCGGATACCTCTGGGCATGATCTCCACGTAGT
Wnt3CAAGCACAACAATGAAGCAGGTCGGGACTCACGGTGTTTC
Wnt10bACGACATGGACTTCGGAGAGAAGTCATTCTCGCCTGGATGTCCC
Wnt9aGGCACAGGGTTACAAACAACGGACAGAGGCAACTGAGAAA
Wnt11ATGTGCGGACAACCTCAGCTACGCATCAGTTTATTGGCTTGG

