Article

Six2 Is a Coordinator of LiCl-Induced Cell Proliferation and Apoptosis

by
Jianing Liu
1,†,
Pan Ju
1,†,
Yuru Zhou
1,2,†,
Ya Zhao
1,3,†,
Yajun Xie
1,
Yaoshui Long
1,
Yuping Gu
1,
Dongsheng Ni
1,
Zhongshi Lyv
1,
Zhaomin Mao
1,
Jin Hao
1,
Yiman Li
1,
Qianya Wan
1,
Quist Kanyomse
1,
Yamin Liu
1,
Yue Xiang
4,
Ruoli Wang
4,
Xiangling Chen
4,
Junman Zhang
4,
Xihan Liu
4,
Hui Zhao
5,
Qin Zhou
1 and
Ge Li
1,6,*
add Show full author list remove Hide full author list
1
Division of Molecular Nephrology and the Creative Training Center for Undergraduates, the Ministry of Education Key Laboratory of Clinical Diagnostics, School of Laboratory Medicine, Chongqing Medical University, Chongqing 400016, China
2
The fifth Clinical College of Medicine, Chongqing Medical University, Chongqing 400016, China
3
Department of Laboratory Medicine, the First Hospital of Xi’an, Xi’an 710002, China
4
Department of scientific and technological activity, Chongqing Yucai Middle School, Chongqing 400016, China
5
Key Laboratory for Regenerative Medicine, Ministry of Education, School of Biomedical Sciences, Faculty of Medicine, The Chinese University of Hong Kong, Hong Kong, China
6
The Center of Experimental Teaching Management, Chongqing Medical University, Chongqing 400016, China
*
Author to whom correspondence should be addressed.
Int. J. Mol. Sci. 2016, 17(9), 1504; https://0-doi-org.brum.beds.ac.uk/10.3390/ijms17091504
Submission received: 3 May 2016 / Revised: 16 August 2016 / Accepted: 1 September 2016 / Published: 8 September 2016
(This article belongs to the Section Bioinorganic Chemistry)

Abstract

:
The metanephric mesenchyme (MM) cells are a subset of kidney progenitor cells and play an essential role in mesenchymal-epithelial transition (MET), the key step of nephron generation. Six2, a biological marker related to Wnt signaling pathway, promotes the proliferation, inhibits the apoptosis and maintains the un-differentiation of MM cells. Besides, LiCl is an activator of Wnt signaling pathway. However, the role of LiCl in cellular regulation of MM cells remains unclear, and the relationship between LiCl and Six2 in this process is also little known. Here, we performed EdU assay and flow cytometry assay to, respectively, detect the proliferation and apoptosis of MM cells treated with LiCl of increasing dosages. In addition, reverse transcription-PCR (RT-PCR) and Western-blot were conducted to measure the expression of Six2 and some maker genes of Wnt and bone-morphogenetic-protein (BMP) signaling pathway. Furthermore, luciferase assay was also carried out to detect the transcriptional regulation of Six2. Then we found LiCl promoted MM cell proliferation at low-concentration (10, 20, 30, and 40 mM). The expression of Six2 was dose-dependently increased in low-concentration (10, 20, 30, and 40 mM) at both mRNA and protein level. In addition, both of cell proliferation and Six2 expression in MM cells declined when dosage reached high-concentration (50 mM). However, Six2 knock-down converted the proliferation reduction at 50 mM. Furthermore, Six2 deficiency increased the apoptosis of MM cells, compared with negative control cells at relative LiCl concentration. However, the abnormal rise of apoptosis at 30 mM of LiCl concentration implies that it might be the reduction of GSK3β that increased cell apoptosis. Together, these demonstrate that LiCl can induce the proliferation and apoptosis of MM cells coordinating with Six2.

Graphical Abstract

1. Introduction

During renal development, nephrons originate from a population of self-renewing Six2 positive nephron progenitor cells, a part of metanephric mesenchyme (MM) cells [1,2,3]. Sine oculis homeobox homolog 2 (Six2), encoding a transcription factor, is required for the differentiation of MM cells, beginning with mesenchymal-to-epithelial transition (MET) to form early developing nephrons [4,5]. Furthermore, Six2 regulates the proliferation (self-renewing) and consumption of nephron progenitor cells (a subset of MM cells) [1,6]. Six2 promotes proliferation and inhibits apoptosis of MM cells to maintain MM cells in a progenitor state, which contributes to nephrogenesis [1,7]. Furthermore, in mouse kidney development, Six2 deficiency promotes abnormal differentiation of mesenchyme cells and depletion of nephron progenitor cells in the cap mesenchyme (CM), finally leads to renal hypoplasia [1].
Six2 is a crucial biomarker connected to Wnt signaling pathway that is highly conserved in evolution. Wnt signaling pathway functions in development by regulating numerous genes and proteins including Six2 [8,9]. Most significantly, Wnt/β-catenin signaling determines cell fate of proliferation or differentiation in development [10]. Furthermore, lithium chloride (LiCl) is a classic activator of Wnt signaling by inhibiting GSK3β expression [11]. This lithium salt of hydrochloric acid is an important therapeutic agent and can regulate proliferation and apoptosis in cancer cells [12]. However, it is little known whether LiCl affects the proliferation and apoptosis of MM cells or not. Furthermore, the relationship between LiCl and Six2 in the cellular regulation of MM cells is also unclear.
Here, we firstly demonstrated that LiCl can promote MM cells proliferation in low-concentration (10, 20, 30, and 40 mM). In mK3 cells, the expression of Six2 and cell proliferation increased with dose-dependent of LiCl. Furthermore, knockdown of Six2 can reduce the proliferation in LiCl-treated mK3 cells, showing that LiCl can induce the proliferation of mK3 cells via up-regulating Six2 expression.

2. Results

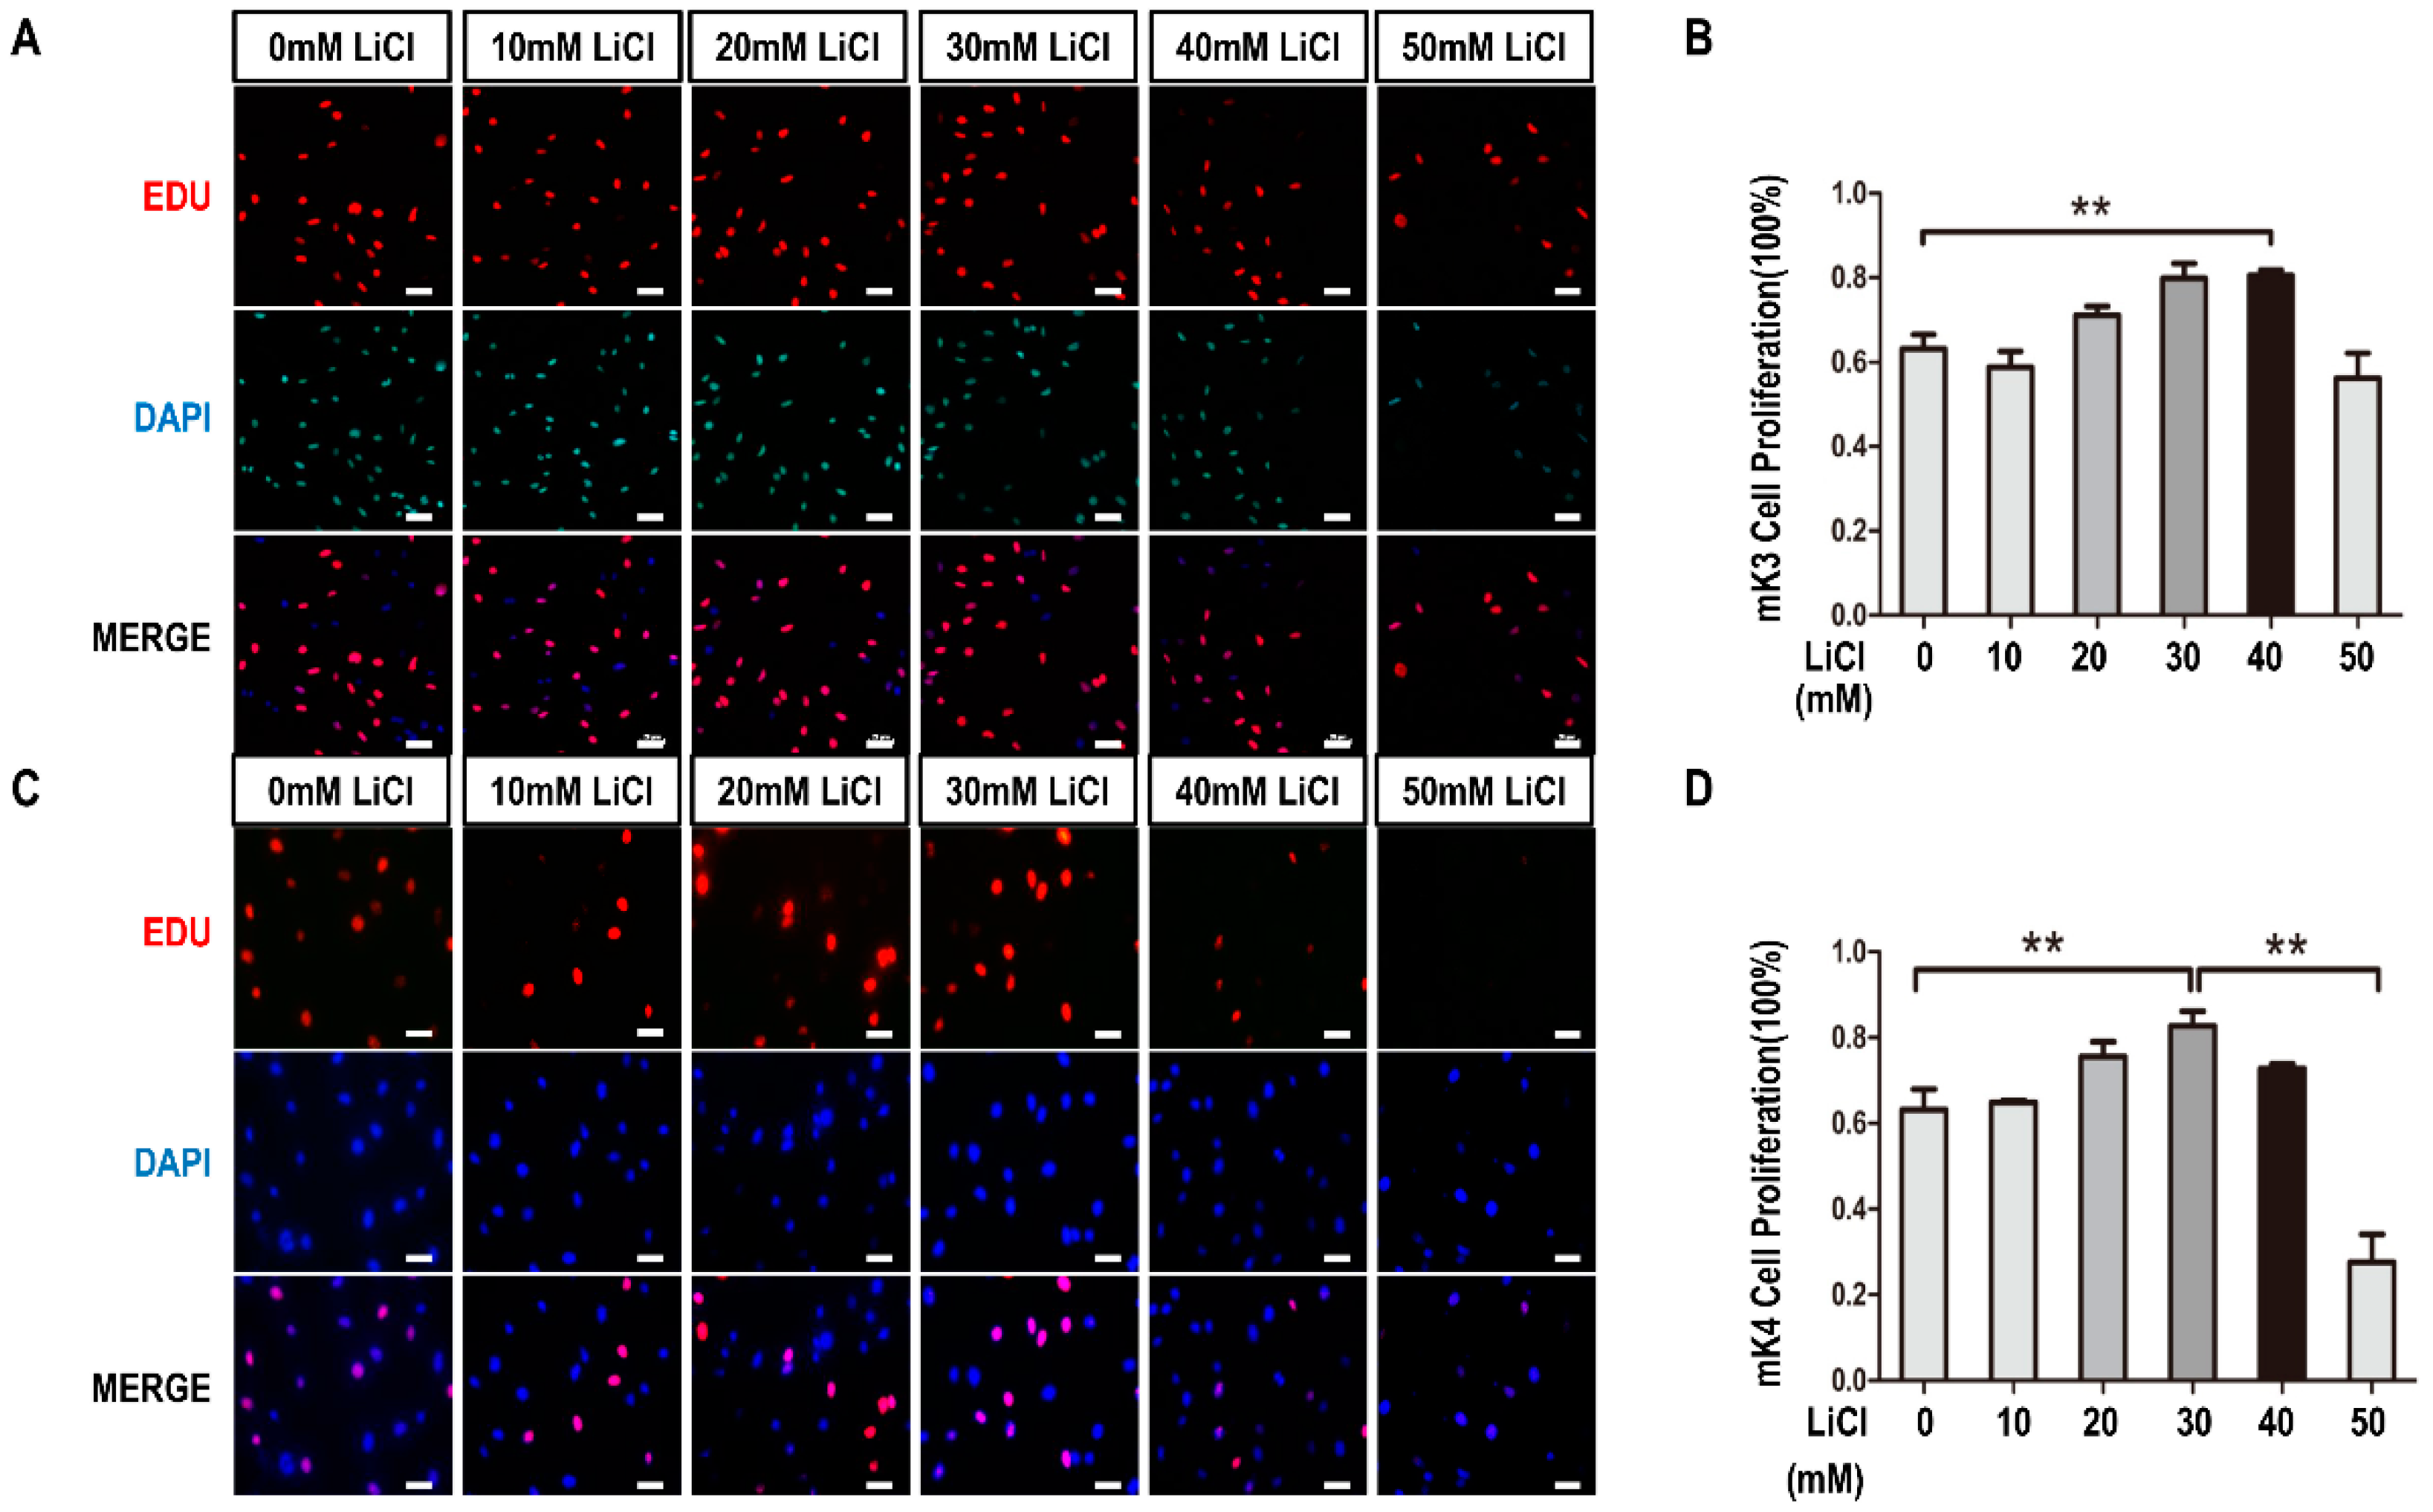
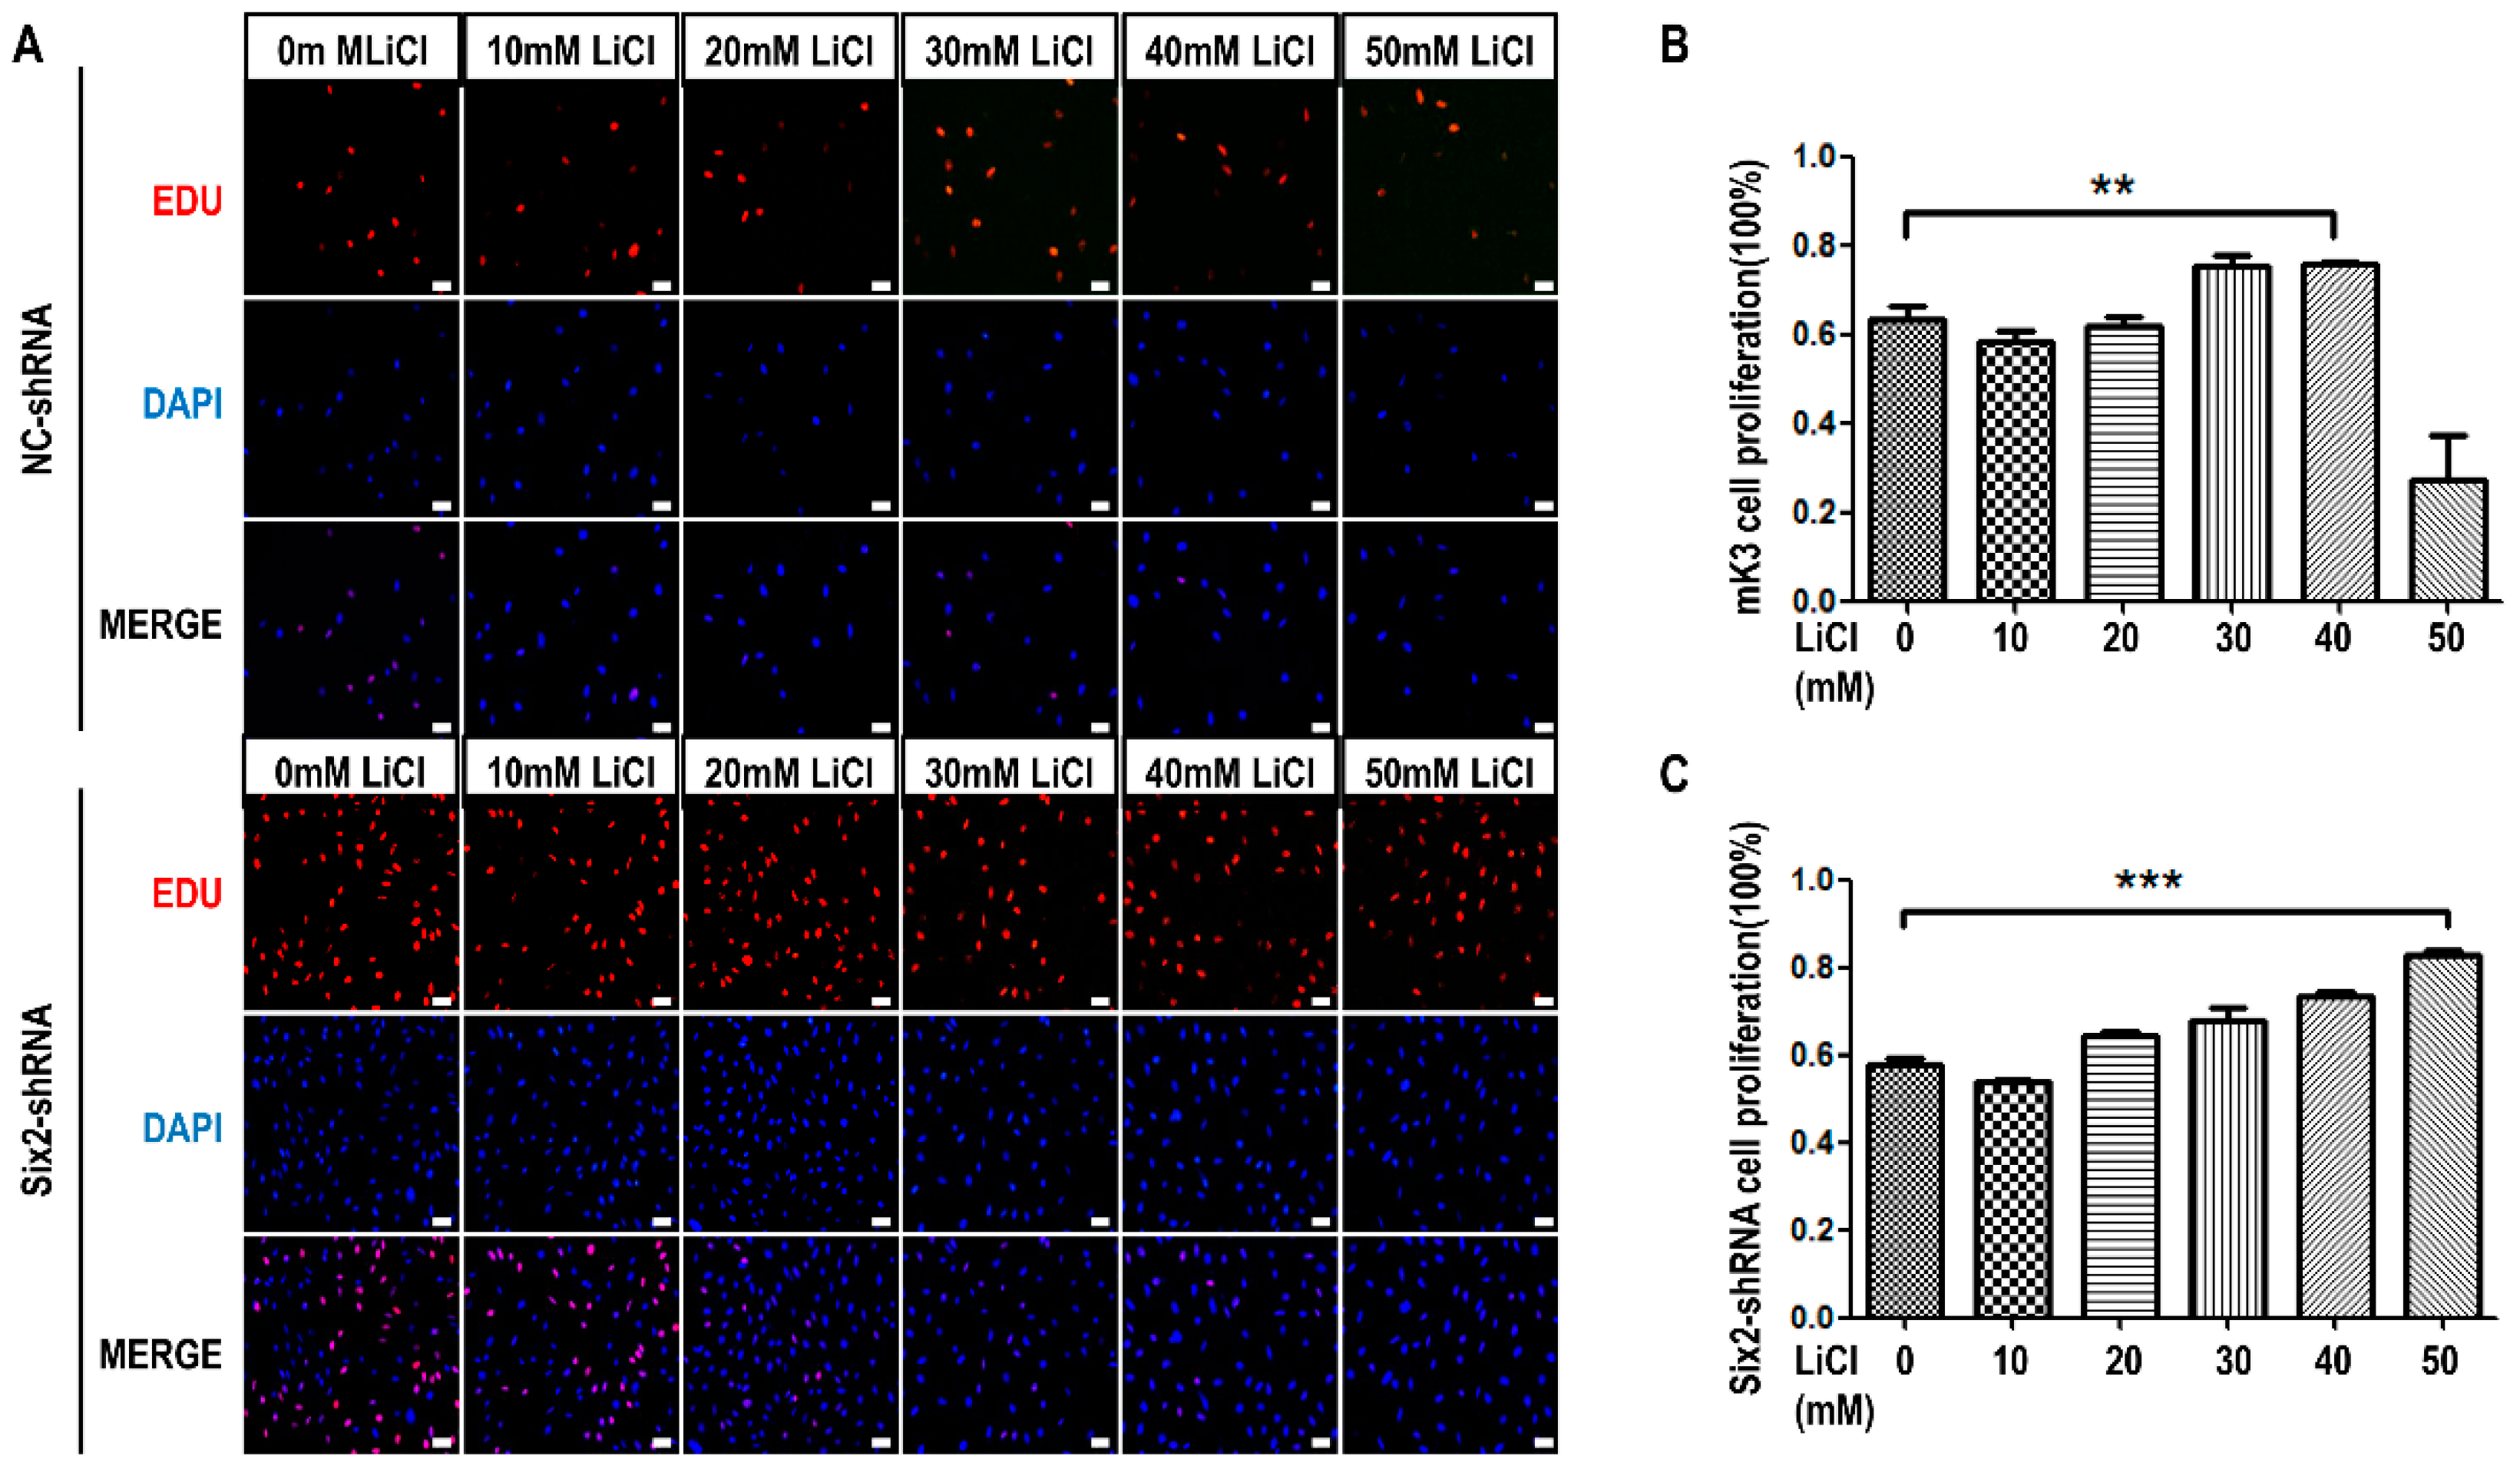
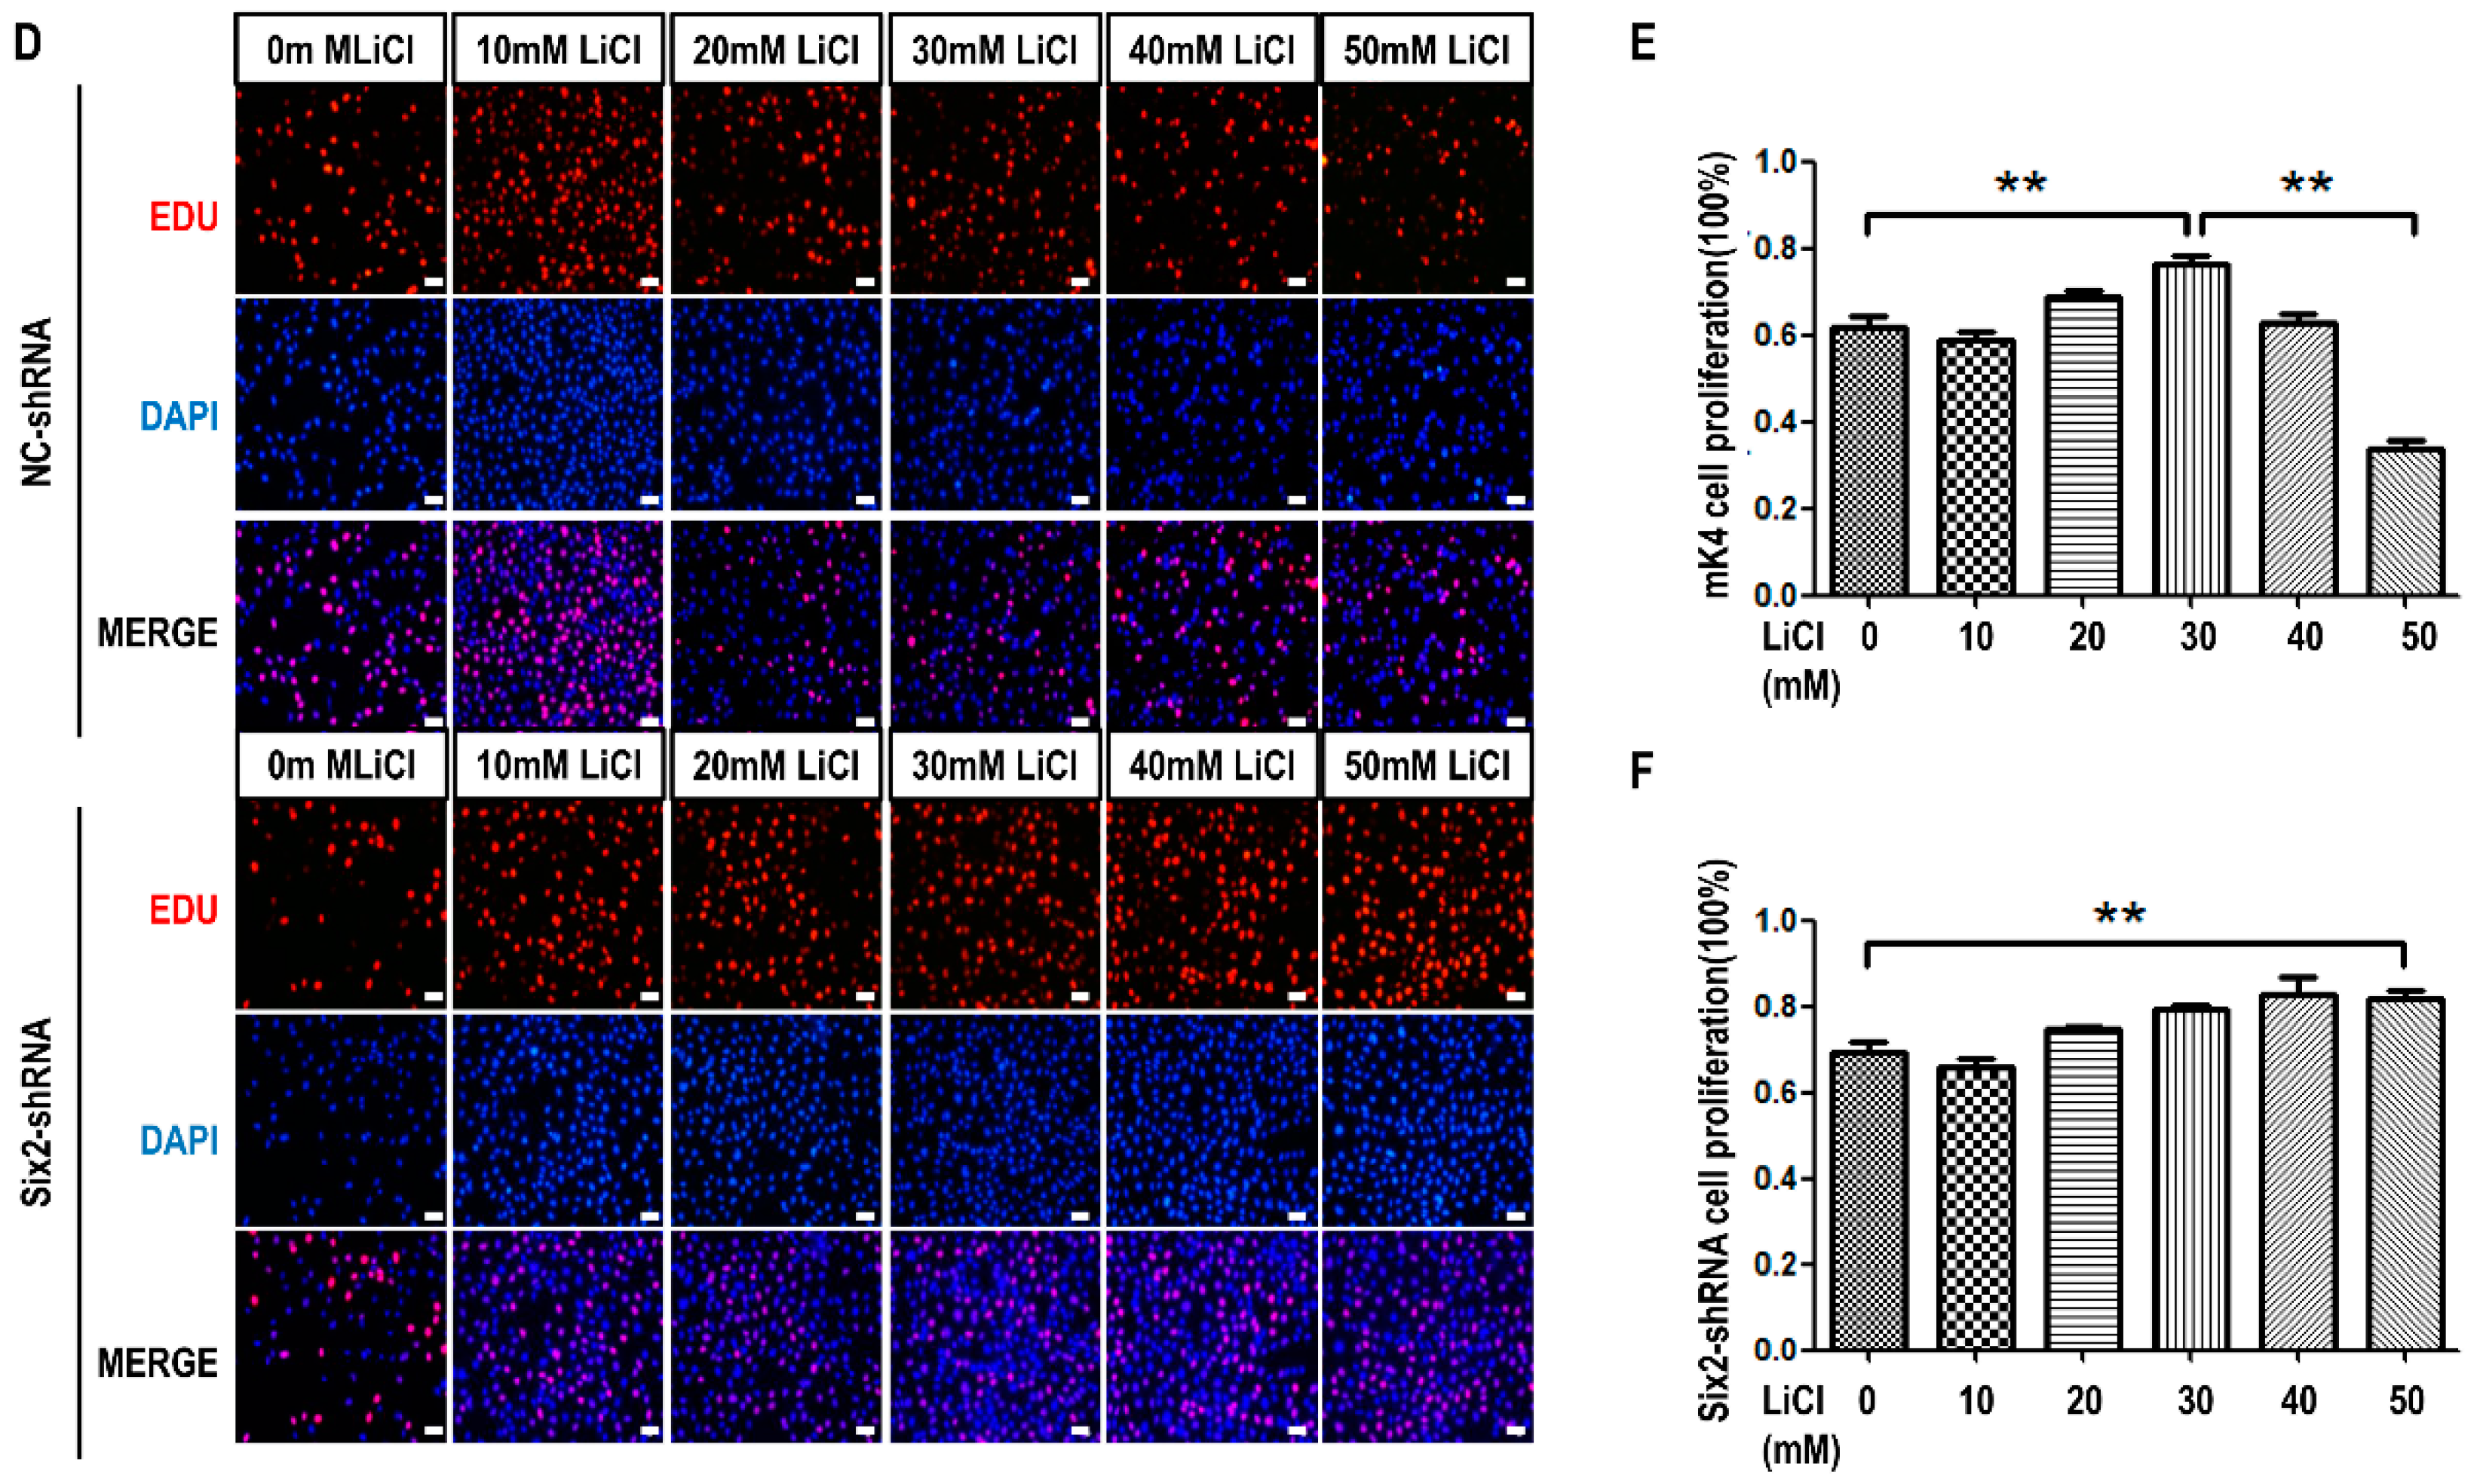
2.1. LiCl Promotes the Proliferation of Metanephric mesenchyme (MM) Cells at Low-Concentration and Inhibits It at High-Concentration

To clarify the relationship between LiCl and proliferation of MM cells, we treated the mK3 cells and mK4 cells with LiCl of increasing dosages (0, 10, 20, 30, 40, and 50 mM) and detected the proliferation rate using 5-ethynyl-2′-deoxyuridine (EdU) assay. The results Showed that mK3 cells proliferation rate was increased with concentration rising at low-concentration range (0, 10, 20, 30, and 40 mM) compared control cell, while it was partially reduced at high-concentration (50 mM) compared with the highest proliferation at 30 or 40 mM (Figure 1A,B). Similarly, in mK4 cells, cell proliferation rate was increased at low concentration of LiCl while the increasing was inhibited at 50 mM (Figure 1C,D). Therefore, we speculated that LiCl continuously promotes the proliferation of mK3 cells at low-concentration and inhibits it at high-concentration.

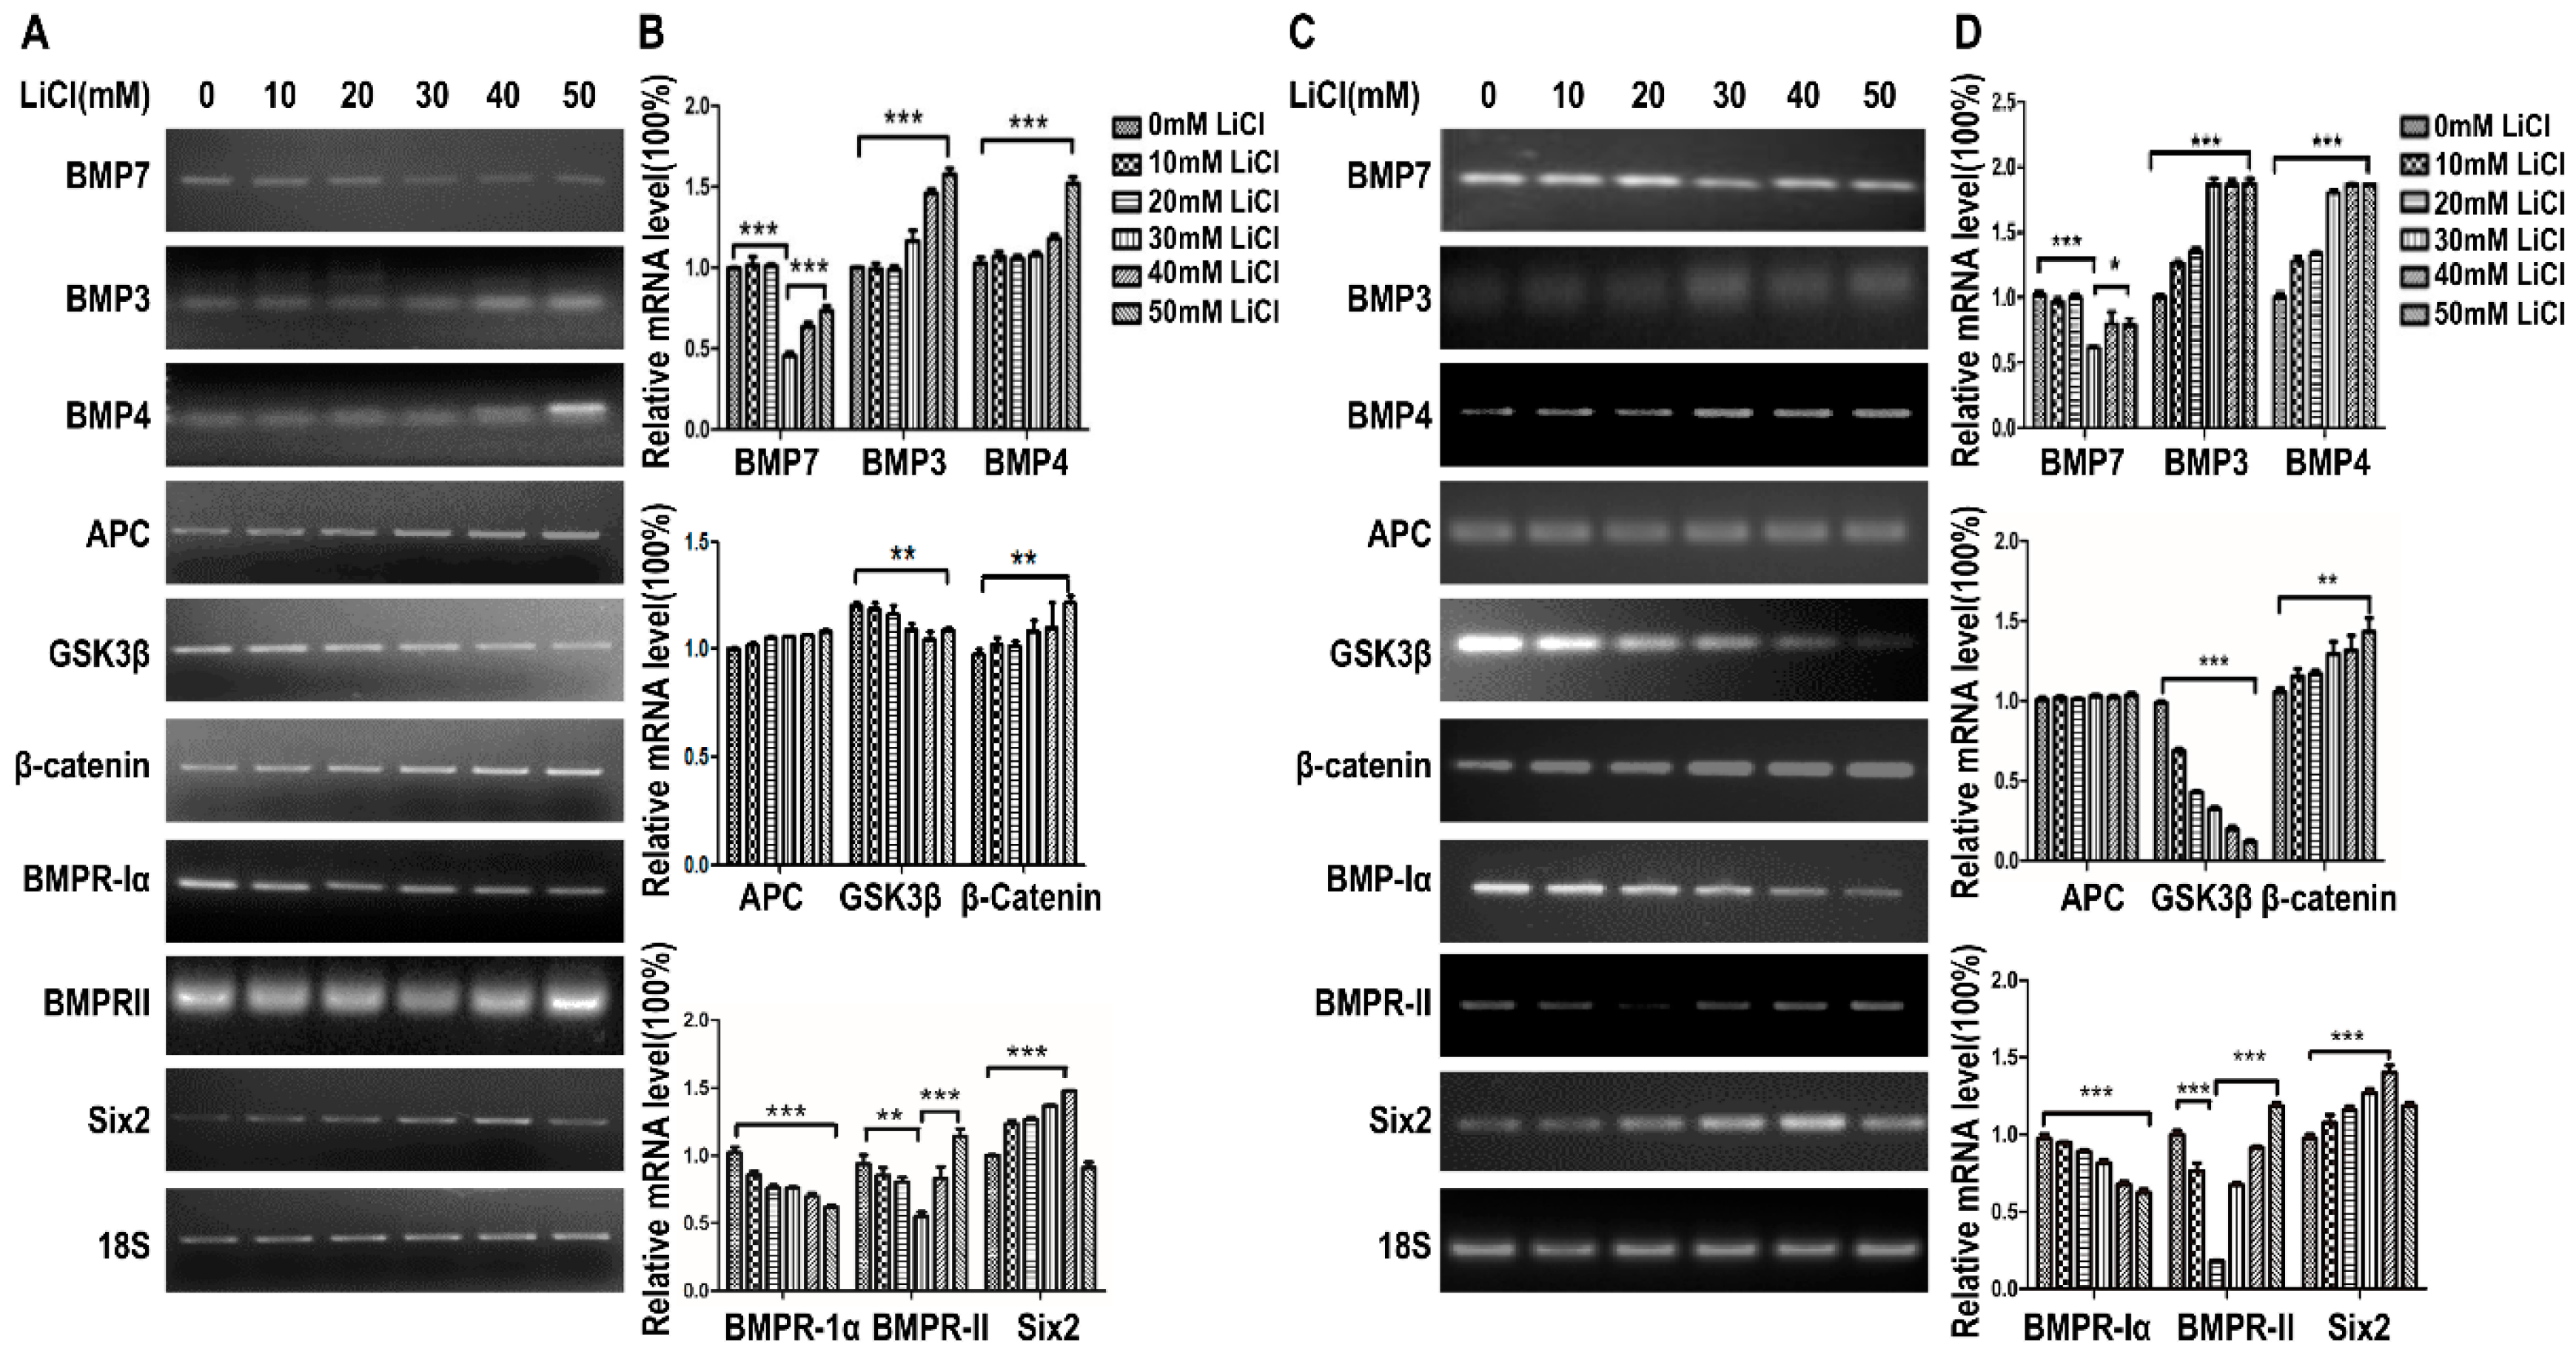
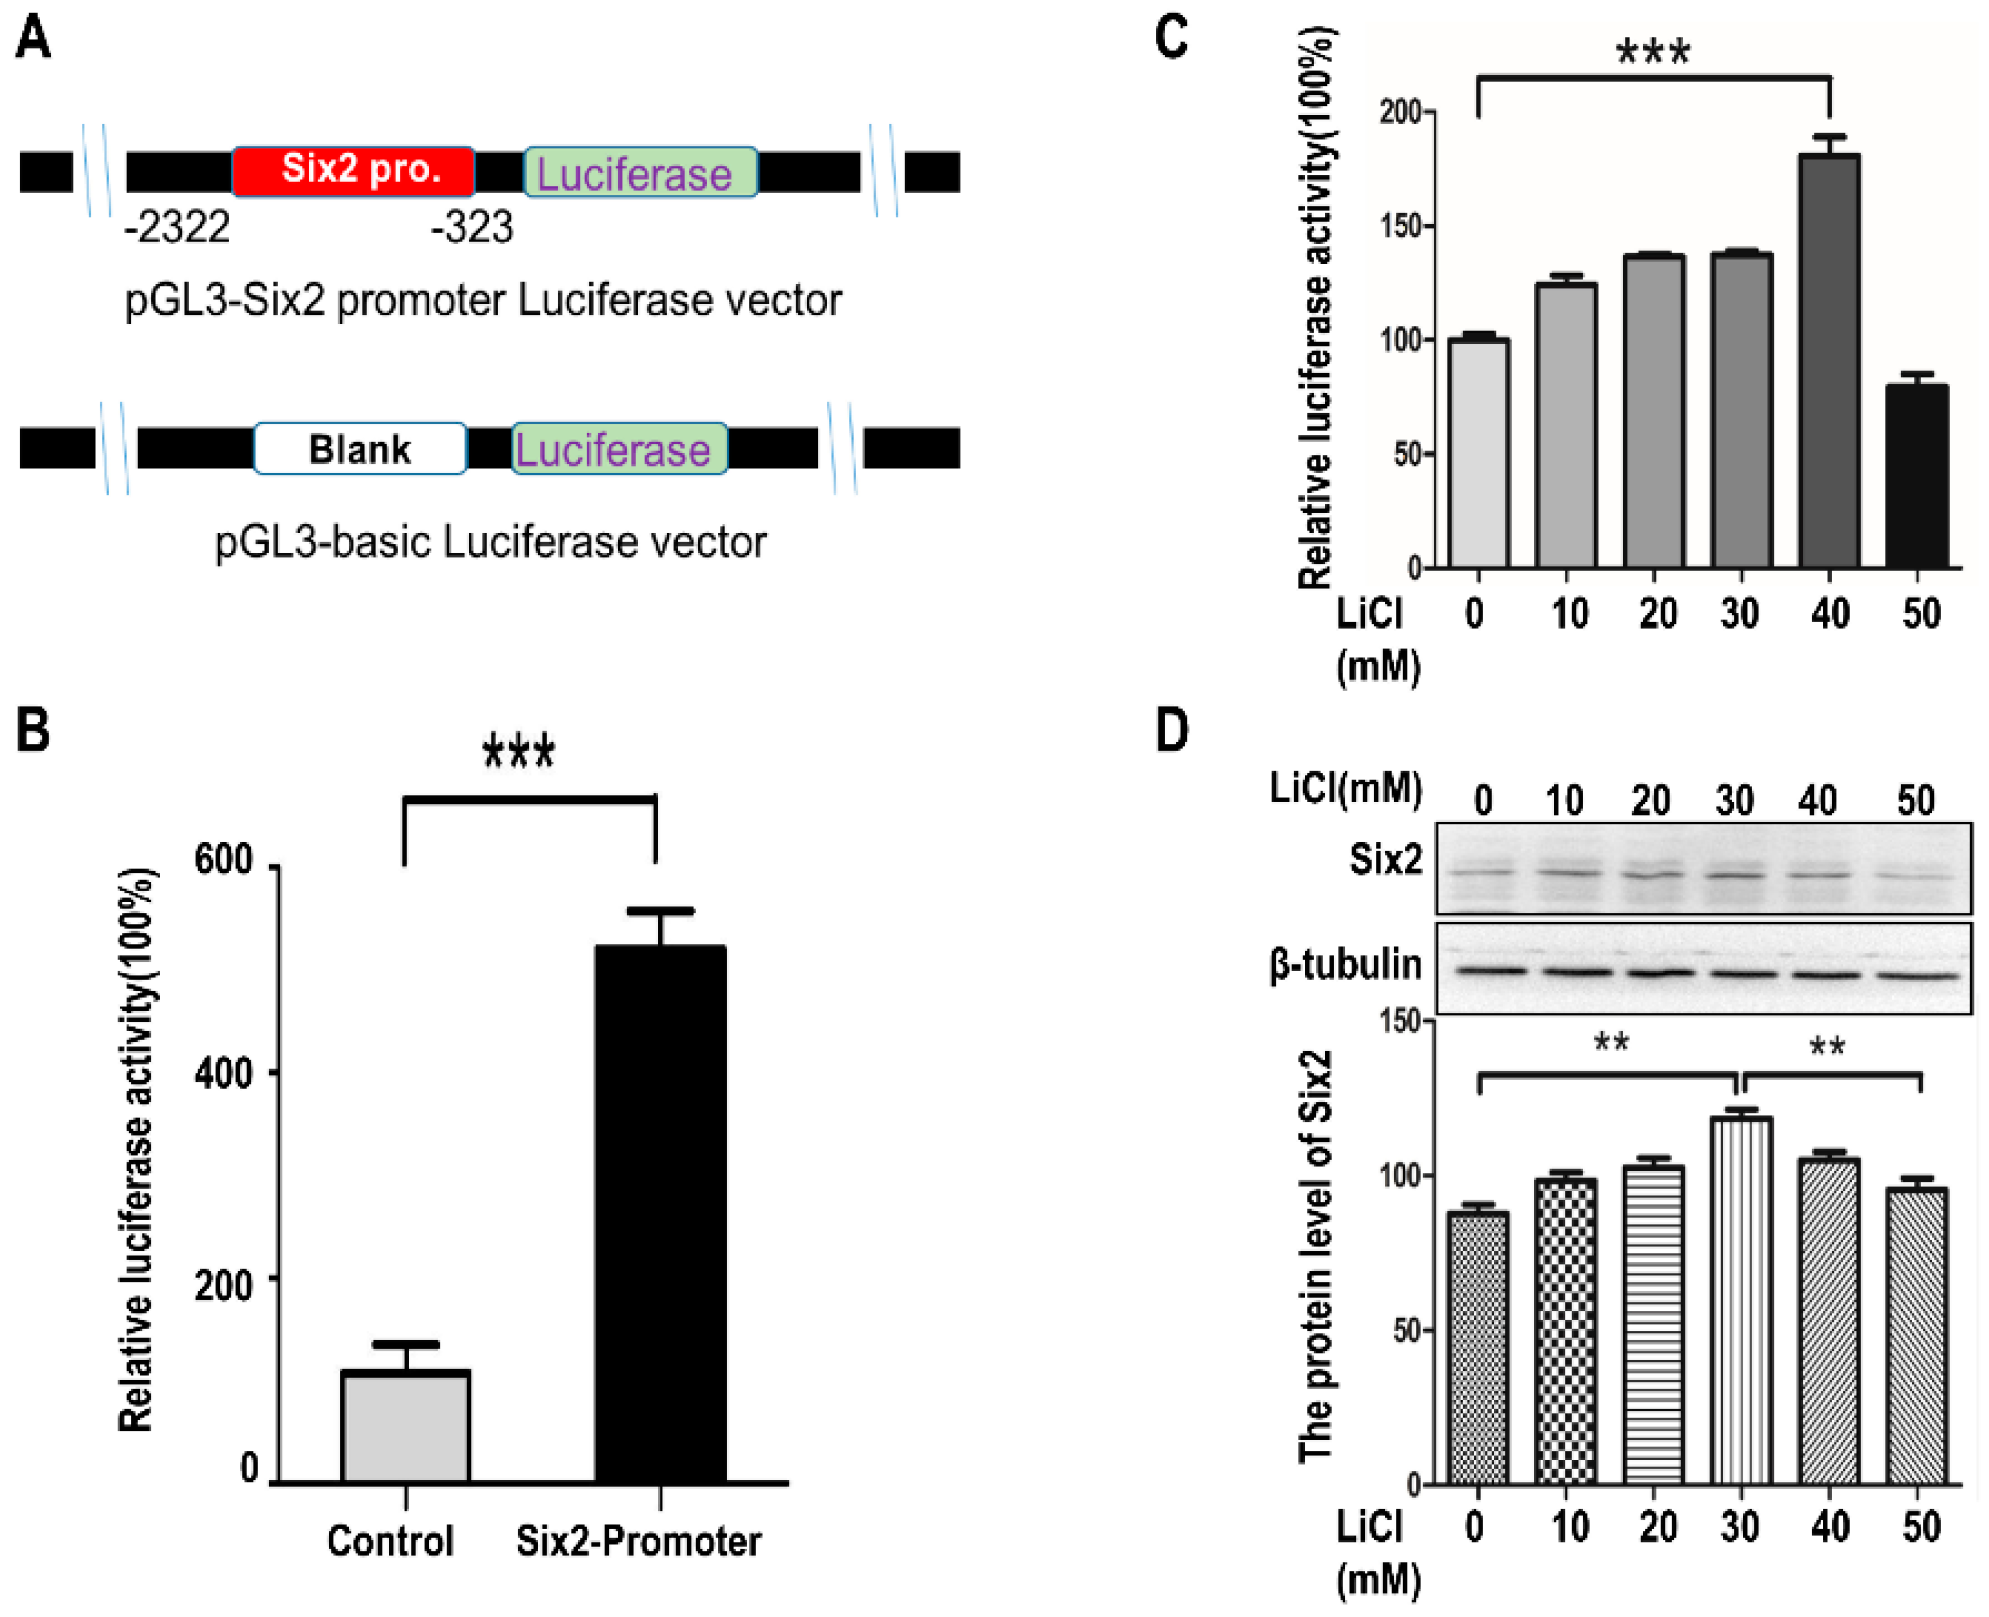
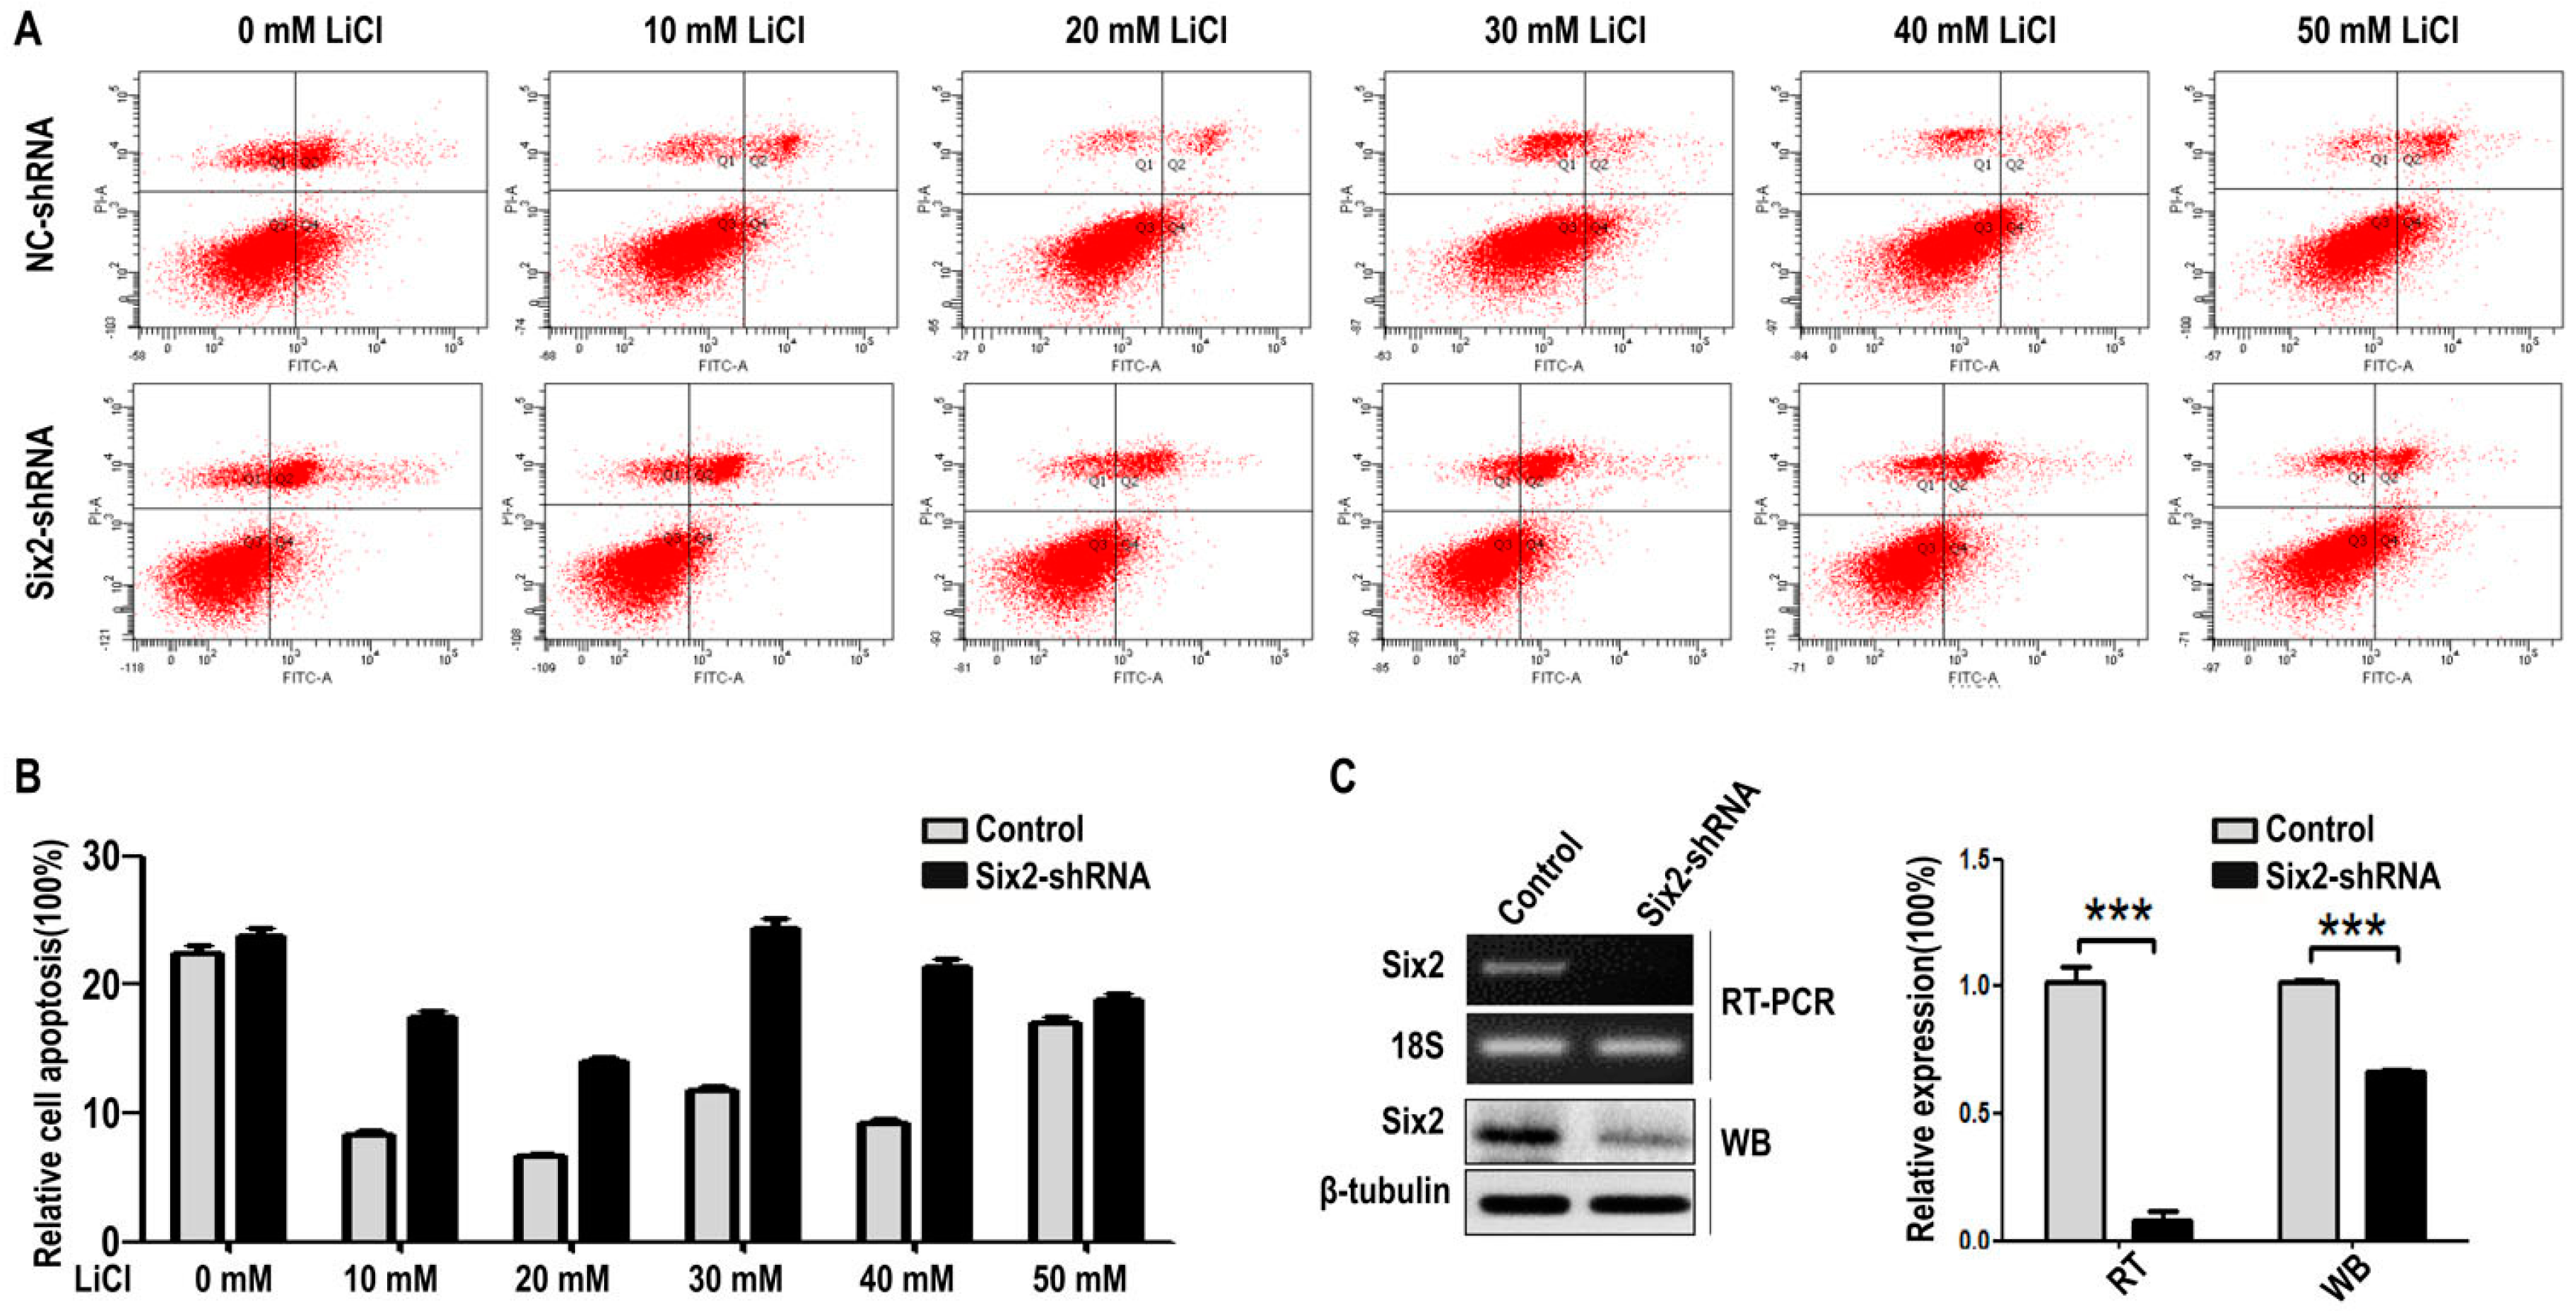
2.2. LiCl Up-Regulates the Expression of Six2 at Low-Concentration and Down-Regulates Six2 at High-Concentration

To demonstrate the relationship between LiCl and Six2, we isolated the total RNA from mK3 and mK4 cells treated with LiCl of increasing dosages and detected the expression of Six2 and makers of Wnt and BMP signal pathway. As shown in Figure 2A,B, the expression of APC and β-catenin gene was increased gradually as concentration of LiCl rose, corresponding to the cell proliferation promotion, while the expression of GSK3Β was decreased (Figure 1B). Among BMP signal markers, the expression of BMP3 and BMP4 was increased, while the expression of BMP7 and BMPRII was reduced at low concentration of LiCl (0, 10, 20, and 30 mM) and then it was increased. The expression of BMPR-IA was reduced continually as concentration of LiCl increased. Six2 expression is promoted at low dosages and the promotion was partially deleted at high dosage (50 mM), which was consistent with cell proliferation regulation trend as LiCl concentration rose (Figure 2A,B). All these detections and data were repeated in another cell line, mK4 cells (Figure 2C,D).
To further identify the relationship between Six2 and LiCl, HEK293T cells were transfected with Six2 promoter-LuC and treated with LiCl of increasing dosages. Then luciferase assay was performed to analyze the function of Six2 promoter-LuC (Figure 3A,B). From the results of luciferase activity, we recognized that Six2 promoter-LuC was functional and LiCl promoted Six2 expression at low-concentration (0, 10, 20, 30, and 40 mM) and the promotion was inhibited it at high-concentration (50 mM) at mRNA level (Figure 3C) and protein level (Figure 3D). Moreover, this tendency was also confirmed in mK4 cells (Figure S1). Thus, we drew conclusions that LiCl may up-regulate Six2 at low-concentration and down-regulate Six2 at high-concentration at transcription and translation level.

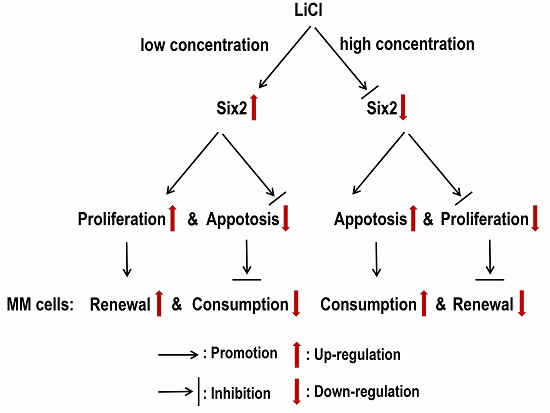
2.3. LiCl Induces the Proliferation and Apoptosis of MM Cells with the Coordination of Six2

To testify whether Six2 is involved in the process of LiCl modulated cell proliferation, mK3 and mK4 cells were transfected with Six2-shRNA or negative control shRNA and treated with LiCl of increasing dosages. Firstly, we detected the efficiency of Six2 deficiency by RT-PCR and Western blot, the results showed that the Six2 expression is apparently decreased compared with negative shRNA controls, and 18S and β-tubulin, respectively, served as internal control of RT-PCR and Western blot (Figure 2A,B and Figure 3D). Moreover, we found that integral proliferation tendency was changed in mK3 cells transfected with Six2-shRNA. The proliferation was increased within groups treated with LiCl of increasing dosages (0, 10, 20, 30, 40, and 50 mM), compared with 0 mM LiCl treated cells though there was not significant difference between 0 and 10 mM (Figure 4A–C). This suggested that Six2 deficiency inhibits the decreasing of mK3 cell proliferation induced by 50 mM LiCl. This result was independently repeated in mK4 cells (Figure 4D–F). In addition, to make the relationship between LiCl and Six2 clearer, we detected the proliferation of Six2-overexpressed mK3 cells with LiCl treatment. The result showed that Six2 promoted the increasing of cell proliferation induced by low LiCl concentration (10, 20, 30, and 40 mM) and maintained the decreasing of cell proliferation at high concentration (50 mM) (Figure S2A,B). The efficiency of Six2 overexpression in mK3 cells was significantly checked by Western-blot (Figure S2C).
Finally, we performed cell apoptosis assay of mK3 and mK4 cells using FCM. The results illustrated that LiCl inhibits mK3 cell apoptosis at low-concentration (10, 20, and 40 mM) compared with the non-LiCl control, and partially deletes this function at 30 and 50 mM, respectively, compared with 20 or 40 mM (Figure 5A,B). While Six2 knock-down increased cell apoptosis rate in 10 mM to 50 mM LiCl treated mK3 cells, compared with the negative shRNA control cells (Figure 5A,B). Moreover, these findings were significantly repeated in another cell line, mK4 cells (Figure S3A,B). Then, the efficiency of Six2 deletion was detected in mK3 and mK4 cells (Figure 5C and Figure S3C). These results suggested that Six2 inhibits MM cell apoptosis and Six2 plays a crucial role in the process that LiCl promotes cell proliferation and inhibit apoptosis at low-concentration.

3. Discussion

In this study, we carried out EdU assay to measure the proliferation of mK3 and mK4 cells treated with LiCl of increasing dosages to identify the cellular regulation of LiCl in mK3 cells proliferation. The results confirmed that LiCl promotes MM cell proliferation at low-concentration (0, 10, 20, 30, and 40 mM) and inhibits it at high-concentration (50 mM) (Figure 1A,B). To clarify that LiCl regulates Six2 gene expression, we detected the mRNA expression of Six2 gene and markers of Wnt and BMP signaling pathway. The results showed that LiCl increased the mRNA expression of Six2 at the concentration of 10, 20, 30, and 40 mM compared with 0 mM but decreased it at 50 mM compared with the highest concentration (Figure 2A–D). Then, we further analyzed the relationship between LiCl and Six2 by luciferase assay, discovering that the luciferase activity of Six2 presented the same variation trend with Six2 mRNA expression when concentration of LiCl rose (Figure 3B,C). Similarly, LiCl regulated the protein expression of Six2 to the identical trend in mK3 cells (Figure 3D) and mK4 cells (Figure S1). Afterwards, to study whether Six2 affects the function of LiCl to cell proliferation, we knocked down or overexpressed Six2 and subsequently carried out EdU assay in mK3 cells. The result showed that the proliferation of mK3 cells increased as the concentration of LiCl rose from 10 to 50 mM, though Six2 was silenced. It suggested that Six2 deficiency inhibits the decreasing of mK3 cell proliferation induced by 50 mM LiCl (Figure 4A–C), which was notably confirmed in another cell line, mK4 cells (Figure 4D–F). Moreover, Six2 promotes cell proliferation increasing induced by low LiCl concentration and convert the decreasing of cell proliferation induced by high LiCl concentration in mK3 cells (Figure S2). In addition, we also found that LiCl inhibits mK3 and mK4 cell apoptosis at low-concentration (0, 10, 20, 30, 40 mM) compared with the non-LiCl control, and partially deletes this function at high-concentration (50 mM) (Figure 5A,B and Figure S3). Meanwhile, Six2 knock-down increased cell apoptosis rate in 10 M to 50 mM LiCl treated mK3 cells, compared with the negative shRNA control cells (Figure 5A,B).
LiCl has been reported to promote the proliferation of hippocampal neural stem/progenitor cells [13]. Here, we confirmed that LiCl also promoted MM cell proliferation at low-concentration (0, 10, 20, 30, and 40 mM). Differently, MM cell proliferation was decreased at high-concentration (50 mM) compared with the highest proliferation at 30 or 40 mM (Figure 1B,D). This variation trend was identical to the expression of Six2 at mRNA level (Figure 2) and protein level (Figure 3C,D and Figure S1). As we all know, Six2, as a transcription factor, is an important gene involved in numerous signaling pathways and regulates organs development, and even impacts tumors generation [14]. It is reported that Six2 is involved in the self-renewal of MM cells via maintaining cells at the progenitor state, which plays an essential role in kidney development [2]. Meanwhile, LiCl can inhibit cell proliferation [14]. These explained that there might exist an accumulation, which increased Six2 expression as the concentration of LiCl rose in a low-concentration range (0, 10, 20, 30, and 40 mM) but the increasing was inhibited when the concentration of LiCl reached one limit (50 mM) [14].
In addition, Six2 determines MM cell self-renewal associated with Wnt signaling pathway [6], a significant signaling pathway that functions in organs development and activated by LiCl [15]. Here we found the mRNA expression of Wnt signaling pathway markers in mK3 cells treated with LiCl of increasing concentration. The expression of β-catenin was increased gradually as concentration of LiCl rose (Figure 2B,D), corresponding to the cell proliferation promotion (Figure 1B,D); while the expression of GSK3β was decreased. Among BMP signal markers, the expression of BMP3 and BMP4 was increased, while the expression of BMP7 and BMPRII was reduced at 30 mM of LiCl concentration and then it was increased continuously, and the expression of BMPR-IA was reduced continually as concentration of LiCl increased (Figure 2B,D).
Moreover, the proliferation of mK3 cells was increased continuously as the concentration of LiCl increased though Six2 was silenced (Figure 4B,C,E,F). These results may be caused by the interactions of Six2 and other genes. Generally, Six2 plays a leading role in the regulation of proliferation. As Six2 was knocked down, other genes accumulate under the role of dose-increasing LiCl and play dominant roles in promoting proliferation [16,17,18]. Besides, we found that Six2 deficiency increased the apoptosis of mK3 cells, compared with negative control cells at relative LiCl concentration (Figure 5A,B and Figure S3A,B). Furthermore, the abnormal rise of apoptosis at 30 mM of LiCl concentration implies that there may be another gene GSK3β that increased cell apoptosis. As concentration of LiCl rises, Six2 is expressed increasingly while GSK3β is expressed decreasingly. Since Six2 is knockdown, Six2 expression activity is much less than GSK3β, so GSK3β plays a critical role in leading to increased apoptosis when the concentration of LiCl was 30 Mm [19]. However, Six2 is expressed increasingly as concentration of LiCl rises, and partly inhibits the increasing apoptosis at 40 and 50 mM of LiCl concentration [20]. Surprisingly, there are some reports that claim the mammalian target of rapamycin (mTOR) pathway was involved in embryonic development; for instance, stimulation of the mTOR pathway with l-leucine rescued many developmental defects of establishment of sister chromatid cohesion N-acetyltransferase 2 (Esco2)-mutant embryos [21,22]. In addition, the reduction of mTOR pathway, combined with activation of canonical Wnt/β-catenin signaling, maintains human and mouse long-term Hematopoietic Stem Cells (HSCs) under cytokine-free conditions ex vivo, and this combining can increase the number of HSCs cells [23]. Therefore, these studies give us the idea that mTOR might be involved in the regulation of MM cell proliferation and apoptosis with the induction of LiCl and coordinating with some key factors of Wnt pathway, such as GSK3β.
In our research, we first studied significant function between Six2 and LiCl in mK3 cells and recognized that Six2 modulate the process that LiCl promote mK3 cell proliferation and inhibit the apoptosis. Furthermore, this regulation is crucial in MET to guarantee formation of nephron with complete function. We also discovered that there might be interactions between Six2 and GSK3β that regulate cell apoptosis, which need further study.

4. Materials and Methods

4.1. Plasmids Construction

PGL3-Six2 promoter-luciferase reporter gene were constructed and used in Dual-luciferase assays, relative to the internal control, plasmid pRL-SV40. The promoter of murine Six2 was cloned from C57BL/6 mouse genomic DNA by PCR with the forward primer: CGTGCTAGCCCGGGCTATTTCCCAGGTCCCCTGGAATCCT and the reverse primer: CCGGAATGCCAAGCTCTTGCAGCTTTTTTAATAATATTAT. The PCR fragments were inserted into the XhoI/HindIII site (upstream of fly luciferase gene) of the pGL3-luciferase vector to create pGL3-Six2 promoter-luciferase using the ligation-independent cloning. pGL3-basic vector (Promega, Madison, WI, USA) and pRL-SV40 was purchased from Promega. The pLKO.1-m.Six2-shRNA, Six2 knockdown vector, the target sequence is CCTCCACAAGAATGAAAGCGT.

4.2. Cell Culture

mK3 (a mouse clonal cell line representing the un-differentiation stage of metanephric mesenchyme [24]) cells, mK4 cells (partial-differentiated MM cell line) and human embryonic kidney 293T (HEK293T) cells were cultured in Dulbecco’s modified Eagle’s medium (DMEM) (Gibico, Carls-bad, CA, USA), added 10% fetal bovine serum (FBS) (Gibico, Carlsbad, CA, USA) and penicillin (1000 units/mL) and streptomycin (1000 µg/mL) at 37 °C with 5% CO2, 100% humidity treated with LiCl of increasing dosages (0, 10, 20, 30, 40, and 50 mM).

4.3. Transfection and Luciferase Assays

HEK293T cells were incubated in 24-well plate (0.1 million each well) for 24 h and then transiently co-transfected with pGL3-Six2 promoter-luciferase and plasmid pRL-SV40 utilizing Polyetherimide (PEI) (23966-2, polysciences, Warrington, PA, USA). mK3 cells were transfected with pLKO.1-m.Six2-shRNA using lentivirus vector. For luciferase assays, HEK293T cells were transfected with pGL3-Six2 promoter-luciferase (500 ng/well) and pRL-SV40 (10 ng/well) for 36 h and then treated with LiCl of increasing dosages for 12 h. Luciferase (Luc) activity was assayed using Dual-Luciferase Reporter assay kit (Promega). Levels of firefly luciferase were standardized to those of Renilla.

4.4. Reverse Transcription-PCR (RT-PCR)

mK3 and mK4 cells were incubated for 24 h and treated by LiCl of increasing dosages for 12 h. The total RNA was isolated using Trizol (Invitrogen, Carlsbad, CA, USA). The Wnt and BMP signal markers, respectively APC primer F: TCTTCAGTGCCTCAACTTGC and primer R: GGAGACAGAATGGAGGTGCT, β-catenin primer F: GTCAGCTCGTGTCCTGTGAA and primer R: AGTGGCTGACAGCAGCTTTT, GSK3β primer F: ACTTCCTGTGGCCTGTCAGG and primer R: CAGCTTTTGGTAGCATGAAAGT, BMPR-IA primer F: ACATCAGATTACTGGGAGC and primer R: GCAAGGTATCCTCTGGTGCT, BMPRII primers F: CTTTACTGAGAACTTTCCAC and primer R: CCAAAACATAAGGCGACTATC, BMP3 primer F: TGGCTCTATGACAGGTACAG and primer R: ATGTTCTCCGACTTGGTTAG, BMP4 primers F: TTGTTCAAGATTGGCT CCCAAG and primer R: GGCATAATAAAACGACCATCAGC, BMP7 primers F: ACCCTTCATGGTGGCCTTCT and primer R: CCTCAGGGCCTCTTGGTTCT, and Six2 primers F: GCCAAGGAAAGGGAGAACAG and R: TGAGCAACAGAGCGGGACT were detected by RT-PCR and the expression activities of these markers were normalized to internal control (18 s). The relative gene expression was analyzed using Image J Software (National Institutes of Health, Bethesda, MD, USA).

4.5. Western Blot

mK3 and mK4 cells were cultured in 6-well plates for 24 h and treated with LiCl of increasing dosages for 12 h. Furthermore, the Western blot assays was processed with antibodies Six2 (1:600, proteintech, Chicago, IL, USA) and internal control β-tubulin (1:5000, proteintech) followed by the research “Identification of a thyroid microsomal antigen by Western blot and immune-precipitation” [25].

4.6. 5-Ethynyl-20-deoxyuridine (EdU) Assays

mK3 and mK4 cells were incubated in 24-well plate (0.05 million/well) for 24 h and treated with LiCl of increasing dosages for 12 h. Furthermore, the proliferation of mK3 cells were determined in vitro via the EdU DNA Proliferation in Detection kit (RiboBio, Guangzhou, China).

4.7. Flow Cytometry Apoptosis Assays

mK3 and mK4 cells were treated with LiCl of increasing dosages for 12 h and the apoptosis assays were measured by flow cytometers (FCM) with Annexin V-FITC Apoptosis Detection Kit (KeyGEN BioTECH, Nanjing, China).

4.8. Statistical Analysis

All of the work was performed in triplicate, and the results are presented as the mean ± standard error of the mean (SEM). We used the GraphPad Prism 5 software (GraphPad, San Diego, CA, USA) to calculate the statistical results. p-values were counted by Student’s t-test and * p < 0.05, ** p < 0.01, and *** p < 0.001 were considered statistical differences.

5. Conclusions

Our study implies that LiCl can induce the proliferation and apoptosis of MM cells coordinating with Six2.

Supplementary Materials

Supplementary materials can be found at www.mdpi.com/1422-0067/17/9/1504/s1.

Acknowledgments

We sincerely thank the National Natural Science Foundation of China (Grant No. 31271563 and Grant No. 81572076) to Qin Zhou and the National Basic Research Program of China (No. 2011CB944002) to Qin Zhou for their support.

Author Contributions

Jianing Liu, Pan Ju, Ya Zhao, Yuru Zhou, Yajun Xie Qin Zhou and Ge Li conceived and designed the experiments; Jianing Liu, Jianing Liu, Pan Ju, Yaoshui Long, Yuping Gu, Dongsheng Ni, and Yaoshui Long performed the experiments; Zhongshi Lyu and Zhaomin Mao analyzed the data; Jin Hao, Yiman Li, Qianya Wan, Yamin Liu, Yue Xiang, Ruoli Wang, Xiangling Chen, Junman Zhang and Xihan Liu contributed to reagents/materials/analysis tools; and Pan Ju, Yaoshui Long, Yuping Gu, Ya Zhao, Yuru Zhou, Yajun Xie, Hui Zhao, Qin Zhou and Ge Li wrote the paper.

Conflicts of Interest

The authors declare no conflict of interest.

Abbreviations

MMmetanephric mesenchymal
UBureteric bud
Six2Sine oculis homeobox homolog 2
LiCllithium chloride
BMPbone morphogenetic protein
FITCFluorescein isothiocyanate fitc
HEKhuman embryonic kidney
METmesenchymal-epithelial-transition
DMEMDulbecco’s modified Eagle’s medium

References

  1. Self, M.; Lagutin, O.V.; Bowling, B.; Hendrix, J.; Cai, Y.; Dressler, G.R.; Oliver, G. Six2 is required for suppression of nephrogenesis and progenitor renewal in the developing kidney. EMBO J. 2006, 25, 5214–5228. [Google Scholar] [CrossRef] [PubMed]
  2. Kobayashi, A.; Valerius, M.T.; Mugford, J.W.; Carroll, T.J.; Self, M.; Oliver, G.; McMahon, A.P. Six2 defines and regulates a multipotent self-renewing nephron progenitor population throughout mammalian kidney development. Cell Stem Cell 2008, 3, 169–181. [Google Scholar] [CrossRef] [PubMed]
  3. Chu, J.Y.; Sims-Lucas, S.; Bushnell, D.S.; Bodnar, A.J.; Kreidberg, J.A.; Ho, J. Dicer function is required in the metanephric mesenchyme for early kidney development. Am. J. Physiol. Ren. Physiol. 2014, 306, F764–F772. [Google Scholar] [CrossRef] [PubMed]
  4. Klein, G.; Langegger, M.; Goridis, C.; Ekblom, P. Neural cell adhesion molecules during embryonic induction and development of the kidney. Development 1988, 102, 749–761. [Google Scholar] [PubMed]
  5. Mugford, J.W.; Yu, J.; Kobayashi, A.; McMahon, A.P. High-resolution gene expression analysis of the developing mouse kidney defines novel cellular compartments within the nephron progenitor population. Dev. Biol. 2009, 333, 312–323. [Google Scholar] [CrossRef] [PubMed]
  6. Park, J.S.; Ma, W.; O’Brien, L.; Chung, E.; Guo, J.J.; Cheng, J.G.; Valerius, M.T.; Mcmahon, J.; Wong, W.H.; Mcmahon, A. Six2 and Wnt regulate self-renewal and commitment of nephron progenitors through shared gene regulatory networks. Dev. Cell 2012, 23, 637–651. [Google Scholar] [CrossRef] [PubMed]
  7. lyu, Z.; Mao, Z.; Wang, H.; Fang, Y.; Chen, T.; Wan, Q.; Wang, M.; Wang, N.; Xiao, J.; Wei, H.; et al. MiR-181b targets Six2 and inhibits the proliferation of metanephric mesenchymal cells in vitro. Biochem. Biophys. Res. Commun. 2013, 440, 495–501. [Google Scholar] [CrossRef] [PubMed]
  8. Clevers, H. Wnt/β-catenin signaling in development and disease. Cell 2006, 127, 469–480. [Google Scholar] [CrossRef] [PubMed]
  9. Cadigan, K.M.; Nusse, R. Wnt signaling: A common theme in animal development. Genes Dev. 1997, 11, 3286–3305. [Google Scholar] [CrossRef] [PubMed]
  10. Yang, Q.M.; Liu, Y.G.; Shen, Q.W.; Shi, X.E.; Yang, G.S. Activation canonical Wnt signaling by LiCl induces porcine skeletal muscle satellite cells differentiation into slow muscle. Chin. J. Anim. Sci. 2012, 28, 26–32. [Google Scholar]
  11. Marija, M.; Vladanka, T.; Jelena, M.; Milena, S. Quercetin and lithium chloride modulate Wnt signaling in pluripotent embryonal carcinoma NT2/D1 cells. Arch. Biol. Sci. 2013, 65, 201–209. [Google Scholar] [CrossRef]
  12. Kaufmann, L.; Marinescu, G.; Nazarenko, I.; Thiele, W.; Oberle, C.; Sleeman, J.; Blattner, C. LiCl induces TNF-α and FasL production, thereby stimulating apoptosis in cancer cells. Cell Commun. Signal. CCS 2011, 9, 15. [Google Scholar] [CrossRef] [PubMed]
  13. Zanni, G.; Martino, E.D.; Omelyanenko, A.; Andäng, M.; Delle, U.; Elmroth, K.; Blomgren, K. Lithium increases proliferation of hippocampal neural stem/progenitor cells and rescues irradiation-induced cell cycle arrestin vitro. Oncotarget 2015, 6, 365–368. [Google Scholar]
  14. Laurenz, J.C.; Smith, S.B. Lithium chloride does not inhibit the proliferation of L6 myoblasts by decreasing intracellular free inositol. J. Anim. Sci. 1998, 76, 66–73. [Google Scholar] [CrossRef] [PubMed]
  15. Hao, H.P.; Wen, L.B.; Li, J.R.; Wang, Y.; Ni, B.; Wang, R.; Wang, X.; Sun, M.X.; Fan, H.J.; Mao, X. LiCl inhibits PRRSV infection by enhancing Wnt/β-catenin pathway and suppressing inflammatory responses. Antivir. Res. 2015, 117, 99–109. [Google Scholar] [CrossRef] [PubMed]
  16. Kroeger, P.T., Jr.; Shoue, D.A.; Mezzacappa, F.M.; Gerlach, G.F.; Wingert, R.A.; Schulz, R.A. Knockdown of SCF(Skp2) function causes double-parked accumulation in the nucleus and DNA re-replication in Drosophila plasmatocytes. PLoS ONE 2013, 8, e79019. [Google Scholar] [CrossRef] [PubMed]
  17. Skytt, D.M.; Klawonn, A.M.; Stridh, M.H.; Pajecka, K.; Patruss, Y.; Quintana-Cabrera, R.; Bolanos, J.P.; Schousboe, A.; Waagepetersen, H.S. siRNA knock down of glutamate dehydrogenase in astrocytes affects glutamate metabolism leading to extensive accumulation of the neuroactive amino acids glutamate and aspartate. Neurochem. Int. 2012, 61, 490–497. [Google Scholar] [CrossRef] [PubMed]
  18. Wang, H.; Sun, W.; Ma, J.; Pan, Y.; Wang, L.; Zhang, W. Polycystin-1 mediates mechanical strain-induced osteoblastic mechanoresponses via potentiation of intracellular calcium and Akt/β-catenin pathway. PLoS ONE 2014, 9, e91730. [Google Scholar] [CrossRef] [PubMed]
  19. Ying, Y.; Zhu, H.; Liang, Z.; Ma, X.; Li, S. GLP1 protects cardiomyocytes from palmitate-induced apoptosis via Akt/GSK3b/b-catenin pathway. J. Mol. Endocrinol. 2015, 55, 245–262. [Google Scholar] [CrossRef] [PubMed]
  20. Li, L.; Song, H.; Zhong, L.; Yang, R.; Yang, X.Q.; Jiang, K.L.; Liu, B.Z. Lithium chloride promotes apoptosis in human leukemia NB4 cells by inhibiting glycogen synthase kinase-3 β. Int. J. Med. Sci. 2015, 12, 805–810. [Google Scholar] [CrossRef] [PubMed]
  21. Xu, B.; Lee, K.K.; Zhang, L.; Gerton, J.L. Stimulation of mTORC1 with l-leucine rescues defects associated with Roberts syndrome. PLoS Genet. 2013, 9, e1003857. [Google Scholar] [CrossRef] [PubMed]
  22. Xu, B.; Sowa, N.; Cardenas, M.E.; Gerton, J.L. l-leucine partially rescues translational and developmental defects associated with zebrafish models of Cornelia de Lange syndrome. Hum. Mol. Genet. 2015, 24, 1540–1555. [Google Scholar] [CrossRef] [PubMed]
  23. Huang, J.; Nguyen-McCarty, M.; Hexner, E.O.; Danet-Desnoyers, G.; Klein, P.S. Maintenance of hematopoietic stem cells through regulation of Wnt and mTOR pathways. Nat. Med. 2012, 18, 1778–1785. [Google Scholar] [CrossRef] [PubMed]
  24. Valerius, M.T.; Patterson, L.T.; Witte, D.P.; Potter, S.S. Microarray analysis of novel cell lines representing two stages of metanephric mesenchyme differentiation. Mech. Dev. 2002, 110, 151–164. [Google Scholar] [CrossRef]
  25. Hamada, N.; Grimm, C.; Mori, H.; DeGroot, L.J. Identification of a thyroid microsomal antigen by Western blot and immunoprecipitation. J. Clin. Endocrinol. Metab. 1985, 61, 120–128. [Google Scholar] [CrossRef] [PubMed]
Figure 1. LiCl promotes cell proliferation in mK3 and mK4 cells. (A) mK3 cells were treated with LiCl of increasing dosages (0, 10, 20, 30, 40, and 50 mM) for 12 h and performed with 5-ethynyl-20-deoxyuridine (EdU) assays. Proliferating mK3 cells were labeled with EdU (red) and cell nucleuses were stained with DAPI (blue). The EdU results were accessed by fluorescent microscope (200×) with the scale bar representing 20 µm and the respective pictures were merged to the purple one; (B) Statistical analysis of mK3 cell proliferation. Values were presented as mean ± SEM (n = 3). p-values were calculated by Student t-test, ** p < 0.01 relative to control; (C) mK4 cells were treated in the same way as in (A) and the EdU assay were conducted; (D) Statistical analysis of mK4 cell proliferation. Values were presented as mean ± SEM (n = 3). p-values were calculated by Student t-test, ** p < 0.01 relative to control.
Ijms 17 01504 g001
Figure 2. LiCl activates Wnt and BMP signaling pathway. (A) mK3 cells were treated with LiCl of increasing dosages (0, 10, 20 M, 30, 40, and 50 mM) for 12 h. The expression Wnt and BMP Signal markers were detected for confirming the function of LiCl by RT-PCR; (B) The relative mRNA expressions in mK3 cells was quantified by gray scan, normalized to the internal control 18S. Values were presented as mean ± SEM (n = 3). p-values were calculated by Student t-test, ** p < 0.01, *** p < 0.001 relative to control; (C) mK4 cells were treated same with mK3 cells and the mRNA expression of the same genes was tested by RT-PCR; (D) The relative mRNA expressions in mK4 cells were quantified by gray scan, normalized to the internal control 18S. Values were presented as mean ± SEM (n = 3). p-values were calculated by Student t-test, * p < 0.05, ** p < 0.01, *** p < 0.001 relative to control.
Ijms 17 01504 g002
Figure 3. LiCl regulates the expression of Six2 at mRNA and protein level. (A) pGL3-Six2 promoter-Luciferase construction was simulate by diagram. The Six2 promoter ranging from −2322 to −323 (Six genome sequence) was obtained from NCBI; (B) HEK293T cells were co-transfected with pRL-SV40 (renilla control) and pGL3-Six2 promoter-LuC for 36 h. Luciferase activity was normalized to Renilla control. p-values were calculated by Student t-test. Values represents mean values ± SEM of triplicate experiments, *** p < 0.001 relative to control; (C) HEK293T cells were co-transfected with pRL-SV40 (renilla control) and pGL3-Six2-LuC for 36 h then were treated with LiCl of increasing dosages for 12 h. Luciferase activity was measured using dual luciferase reporter assay, normalized to Renilla control. Values were presented as mean ± SEM (n = 3), *** p < 0.001 relative to control; (D) mK3 cells were treated with LiCl of increasing dosages for 12 h. The Six2 expression at protein level was tested by Western-blot. Values were presented as mean ± SEM (n = 3), ** p < 0.01 relative to control.
Ijms 17 01504 g003
Figure 4. Knockdown of Six2 gene inhibits cell proliferation while LiCl treatment of low-concentration promotes cell proliferation in mK3 and mK4 cells. (A) mK3 cells were transfected with negative shRNA control and Six2-shRNA for 36 h and treated with LiCl of increasing dosages for 12 h. Proliferating mK3 cells were labeled with EdU (red) and cell nucleus were stained with hoechst (blue). The EdU results were accessed by fluorescent microscope (200×) with the scale bar representing 20 μm and the respective pictures were merged to the purple one; (B,C) Statistical analysis of cell proliferation. Values were presented as mean ± SEM (n = 3), ** p < 0.01, *** p < 0.001 relative to control; (D) mK4 cells were transfected and were detected by EdU assay as same as mK3 cells in (A); (E,F) Statistical analysis of cell proliferation. Values were presented as mean ± SEM (n = 3), ** p < 0.01 relative to control.
Ijms 17 01504 g004aIjms 17 01504 g004b
Figure 5. Knockdown of Six2 gene accelerates cell apoptosis while LiCl treatment of low-concentration inhibits cell apoptosis in mK3 cells. (A) mK3 cells were transfected with negative shRNA control and Six2-shRNA for 36 h and treated with LiCl of increasing dosages. The apoptosis was detected by FCM; (B) Statistical analysis of cell apoptosis and histogram was drawn in GraphPad Prism 5; (C) The efficiency of knockdown Six2 at mRNA and protein level, compared with internal control 18S and β-tubulin, respectively. Values were presented as mean ± SEM (n = 3), *** p < 0.001 relative to control.
Ijms 17 01504 g005

