Article

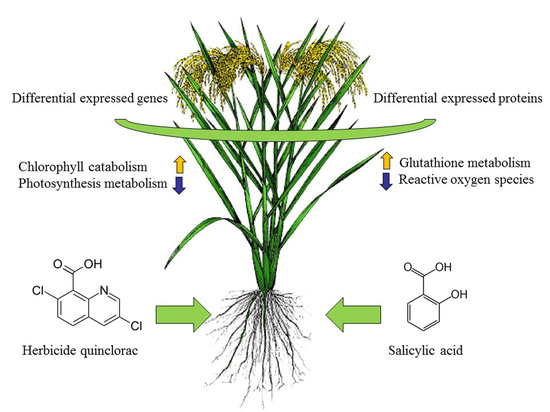
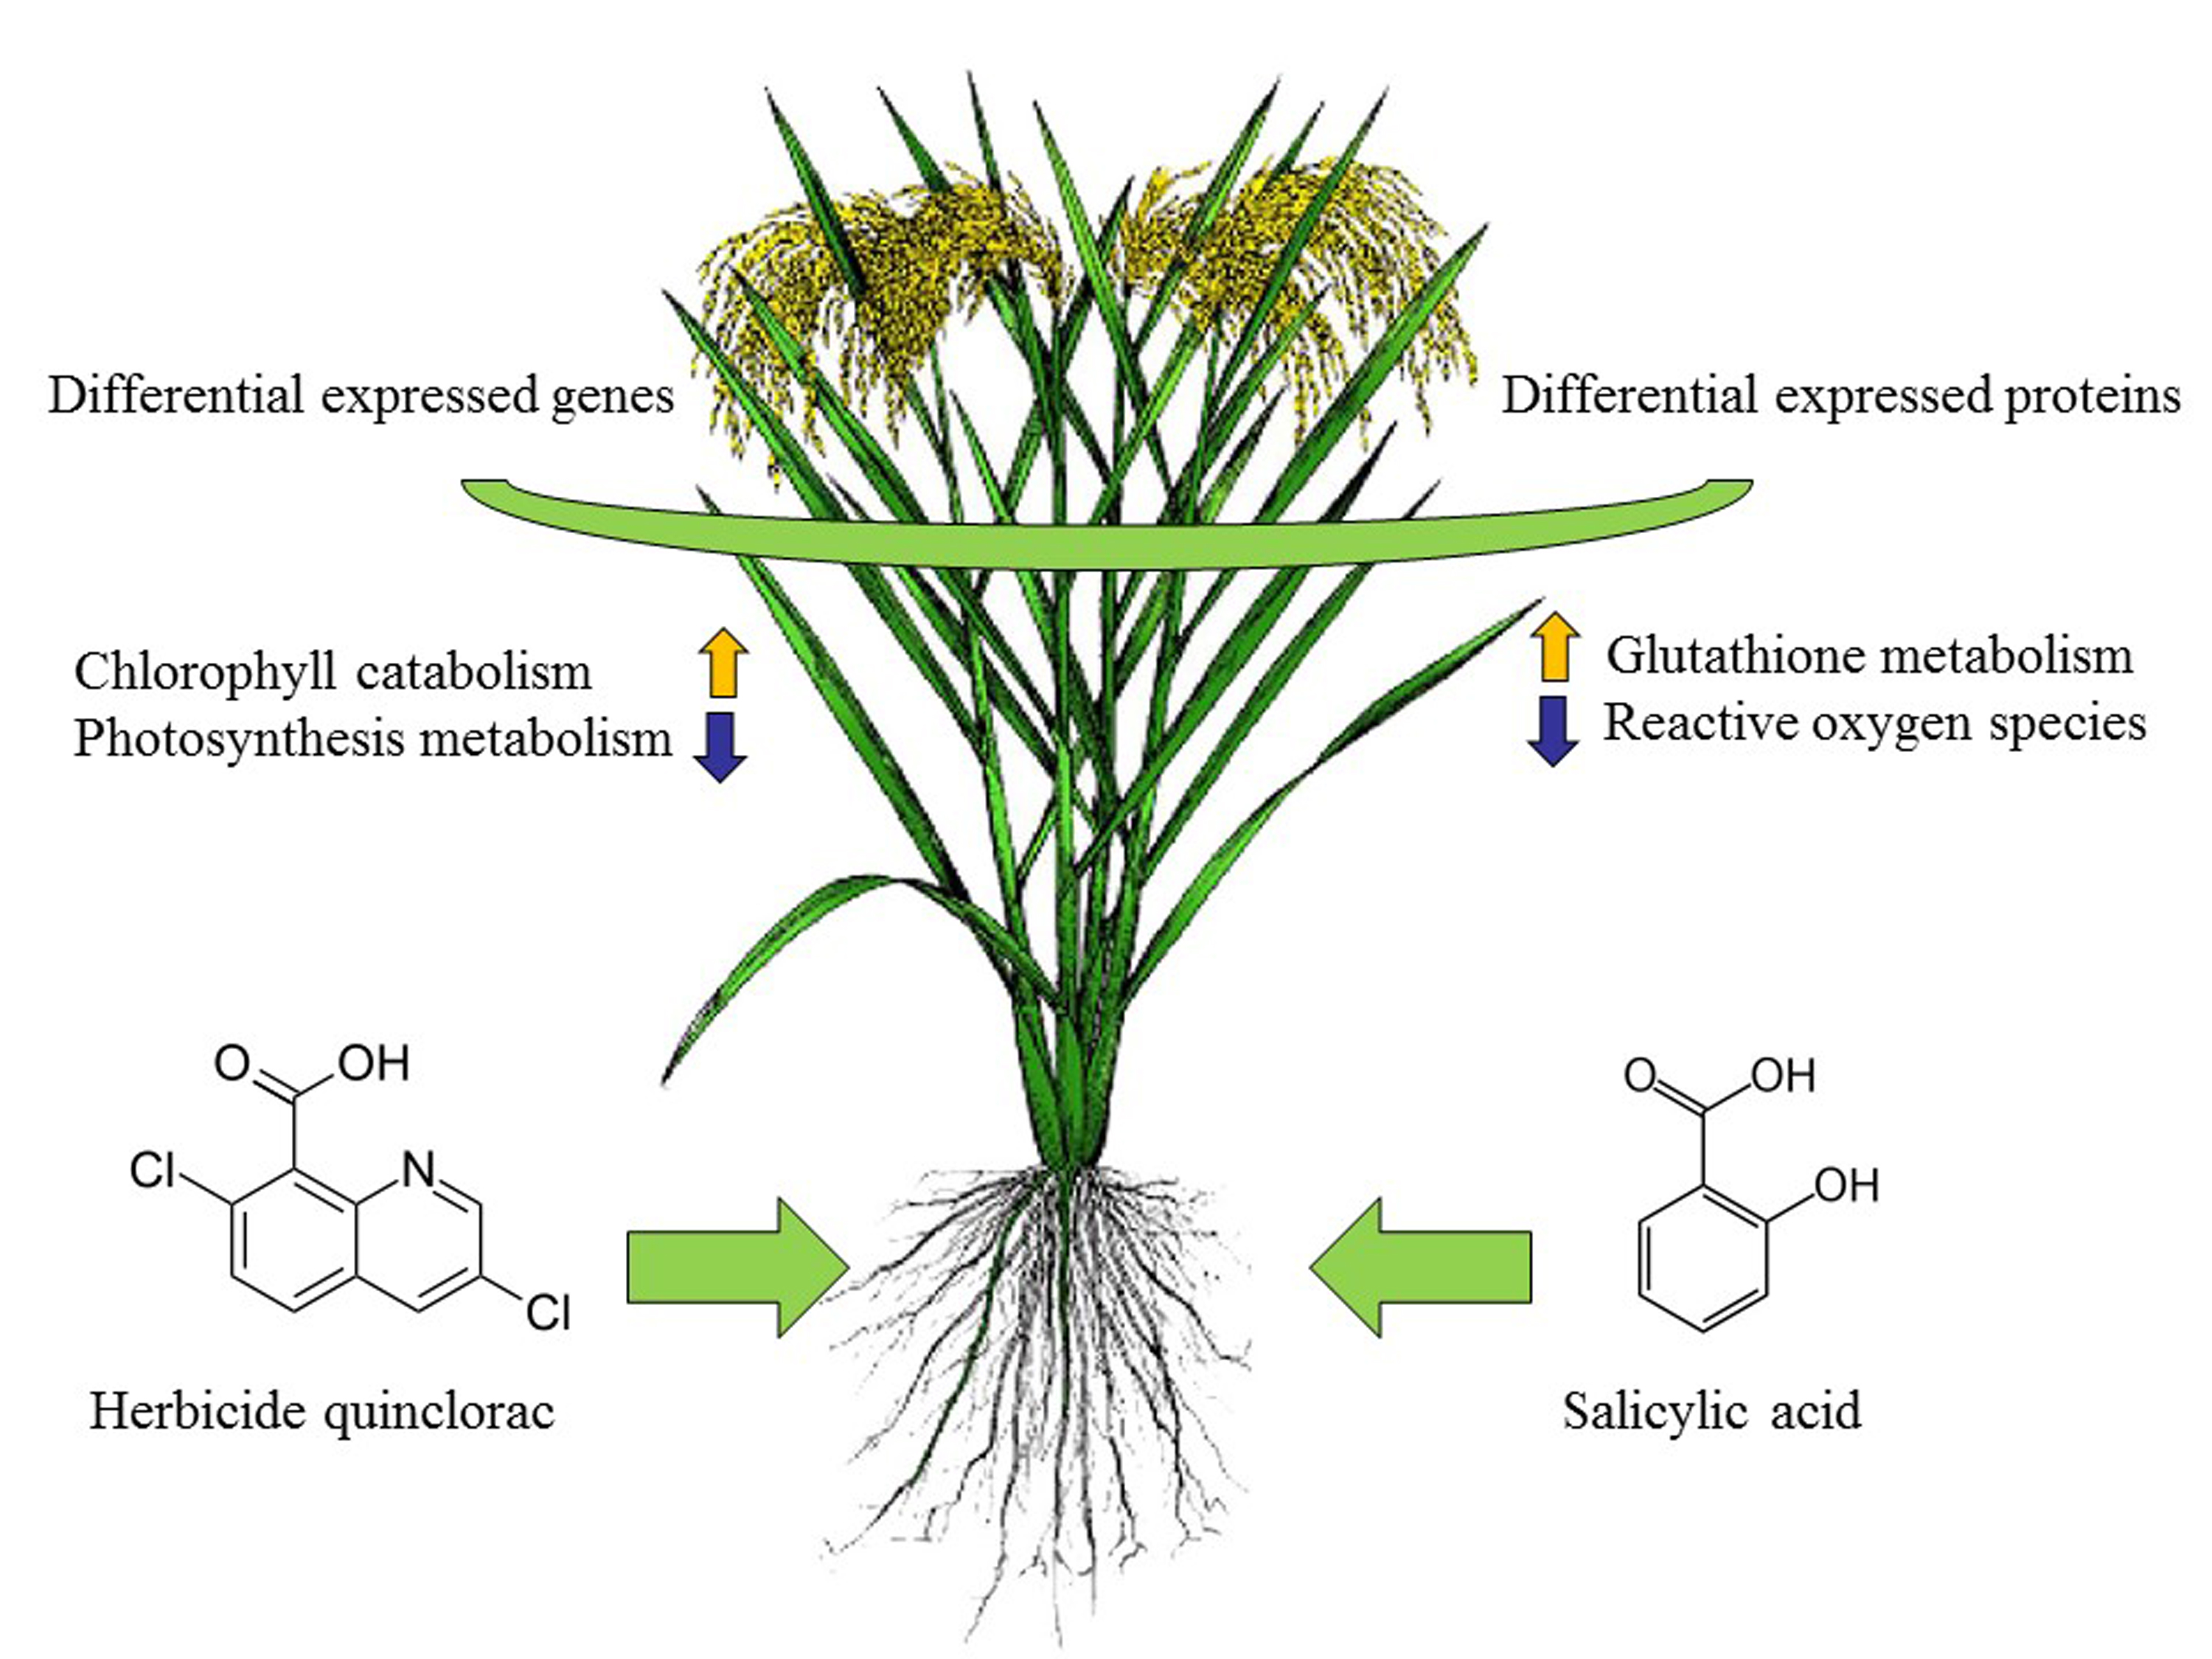
Complementary RNA-Sequencing Based Transcriptomics and iTRAQ Proteomics Reveal the Mechanism of the Alleviation of Quinclorac Stress by Salicylic Acid in Oryza sativa ssp. japonica

1
Institute of Crop Science and Zhejiang Key Laboratory of Crop Germplasm, Zhejiang University, Hangzhou 310058, China
2
Institute of Crop Science and Resource Conservation (INRES), Abiotic Stress Tolerance in Crops, University of Bonn, 53115 Bonn, Germany
3
Institute of Biotechnology, Zhejiang University, Hangzhou 310058, China
*
Authors to whom correspondence should be addressed.
Int. J. Mol. Sci. 2017, 18(9), 1975; https://0-doi-org.brum.beds.ac.uk/10.3390/ijms18091975
Submission received: 9 July 2017 / Revised: 8 September 2017 / Accepted: 12 September 2017 / Published: 14 September 2017
(This article belongs to the Special Issue Abiotic Stress and Gene Networks in Plants 2017)

Abstract

:
To uncover the alleviation mechanism of quinclorac stress by salicylic acid (SA), leaf samples of Oryza sativa ssp. Japonica under quinclorac stress with and without SA pre-treatment were analyzed for transcriptional and proteomic profiling to determine the differentially expressed genes (DEGs) and proteins (DEPs), respectively. Results showed that quinclorac stress altered the expression of 2207 DEGs (1427 up-regulated, 780 down-regulated) and 147 DEPs (98 down-regulated, 49 up-regulated). These genes and proteins were enriched in glutathione (GSH) metabolism, porphyrin and chlorophyll metabolism, the biosynthesis of secondary metabolites, glyoxylate and dicarboxylate metabolism, and so on. It also influenced apetala2- ethylene-responsive element binding protein (AP2-EREBP) family, myeloblastosis (MYB) family and WRKY family transcription factors. After SA pre-treatment, 697 genes and 124 proteins were differentially expressed. Pathway analysis showed similar enrichments in GSH, glyoxylate and dicarboxylate metabolism. Transcription factors were distributed in basic helix-loop-helix (bHLH), MYB, Tify and WRKY families. Quantitative real-time PCR results revealed that quinclorac stress induced the expression of glutathion reductase (GR) genes (OsGR2, OsGR3), which was further pronounced by SA pre-treatment. Quinclorac stress further mediated the accumulation of acetaldehyde in rice, while SA enhanced the expression of OsALDH2B5 and OsALDH7 to accelerate the metabolism of herbicide quinclorac for the protection of rice. Correlation analysis between transcriptome and proteomics demonstrated that, under quinclorac stress, correlated proteins/genes were mainly involved in the inhibition of intermediate steps in the biosynthesis of chlorophyll. Other interesting proteins/genes and pathways regulated by herbicide quinclorac and modulated by SA pre-treatment were also discussed, based on the transcriptome and proteomics results.

Graphical Abstract

1. Introduction

Rice (Oryza sativa L.) is one of the most important cereal crops in China, grown over an area of 30.2 million hectares and producing 208.2 million tons of rice [1]. However, weeds are one of the major biological constraints in rice production. The average yield losses in paddy field due to weeds may vary from 40% to 60%, and can even reach between 94% and 96%, depending upon the cropping system and management practices [2].
The most effective, prompt and economic method for the control of weeds is related to the use of chemicals, such as the application of herbicides. Synthetic herbicides have been used in agriculture on a global scale for about 70 years. Quinclorac (3,7-dichloro-8-quinolinecarboxylic acid) belonging to the quinoline carboxylic acid type is one of most effective synthetic herbicides, which can easily kill Echinochloa crus-galli (barnyard grass) and other rice weeds [3]. In China, this herbicide has been used to control barnyard grass in rice fields for almost 30 years; however, it has now evolved a resistance to quinclorac [4]. Excessive or inappropriate herbicide use to control resistant weeds can cause phytotoxicity, which may jeopardize the crop at an early stage. The concept of enhancing crop tolerance to herbicides with the use of chemical treatments was proposed in the late 1940s [5].
Modern genetic research has explicated that most genes exercise their functions through the regulation of particular proteins. Intuitively, a gene’s high level of transcripts should represent a corresponding high level of protein. However, it has been extensively demonstrated that post transcriptional processing determines steady-state protein levels [6]. RNA sequencing (RNA-Seq), as a transcript quantification technology, provides a far more precise measurement of transcripts levels and their isoforms than other approaches, and thus has been widely and successfully applied in transcript profiling, annotation and gene identification in various plant species [7,8,9]. Likewise, proteomics is also gaining recognition as a reliable and reproducible high-throughput approach for understanding biological processes [10,11]. Isobaric tagging for relative and absolute quantification (iTRAQ), a second-generation, gel-free proteomics analysis gives more accurate quantitation of protein levels.
According to our preliminary results [12,13,14], we selected SA as an antidote to alleviate quinclorac toxicity in rice plants and found that SA mainly functioned by increasing antioxidant defense and by reducing the levels of reactive oxygen species (ROS). However, the expression of genes, proteins and an understanding of the SA-mediated alleviation of quinclorac toxicity at molecular levels is still undisclosed. To provide novel insights into the molecular basis of the SA-mediated alleviation of quinclorac toxicity in rice, we therefore carried out transcriptomic and proteomic profiling to identify the changes at the level of gene expression, and post-translational modifications to elucidate the mechanisms involved in the temporal and spatial regulation of genes/proteins under SA pre-treatment and quinclorac stress.

2. Results

2.1. Primary Transcriptome Analysis

In the transcriptome project, we sequenced 3 RNA-Seq groups (control, Q and Q + SA) with 3 replications, which approximately generated 13,127,032 raw sequencing reads, and then 13,046,191 clean reads after filtering low quality reads (Table 1). A control group of plants was treated with nutrient solution. The Q group of plants was treated with herbicide quinclorac (0.1 mM), whereas Q + SA treatment represents the pre-treatment of rice plants with SA (10 mg/L) for two days prior to the application of herbicide quinclorac (0.1 mM). The average mapping ratio with the reference gene is 89% and the average genome mapping ratio is 86%. We calculated the correlation value between three replicated samples based on normalized expression results and drew a correlation heatmap, as shown in Figure 1. The correlation coefficient was 99% (control-1 and control-2), 98% (control-1 and control-3), and 95% (control-2 and control-3), respectively. The correlation coefficient for Q samples was 99% (Q-1 and Q-2), while it was 94% (Q + SA-1 and Q + SA-2) for Q + SA samples, respectively, which revealed a high sample repeatability. Results demonstrated that the control group (control-1, control-2 and control-3) was significantly different from the Q group (Q-1, Q-2 and Q-3), and the Q + SA group (Q + SA-1, Q + SA-2 and Q + SA-3).

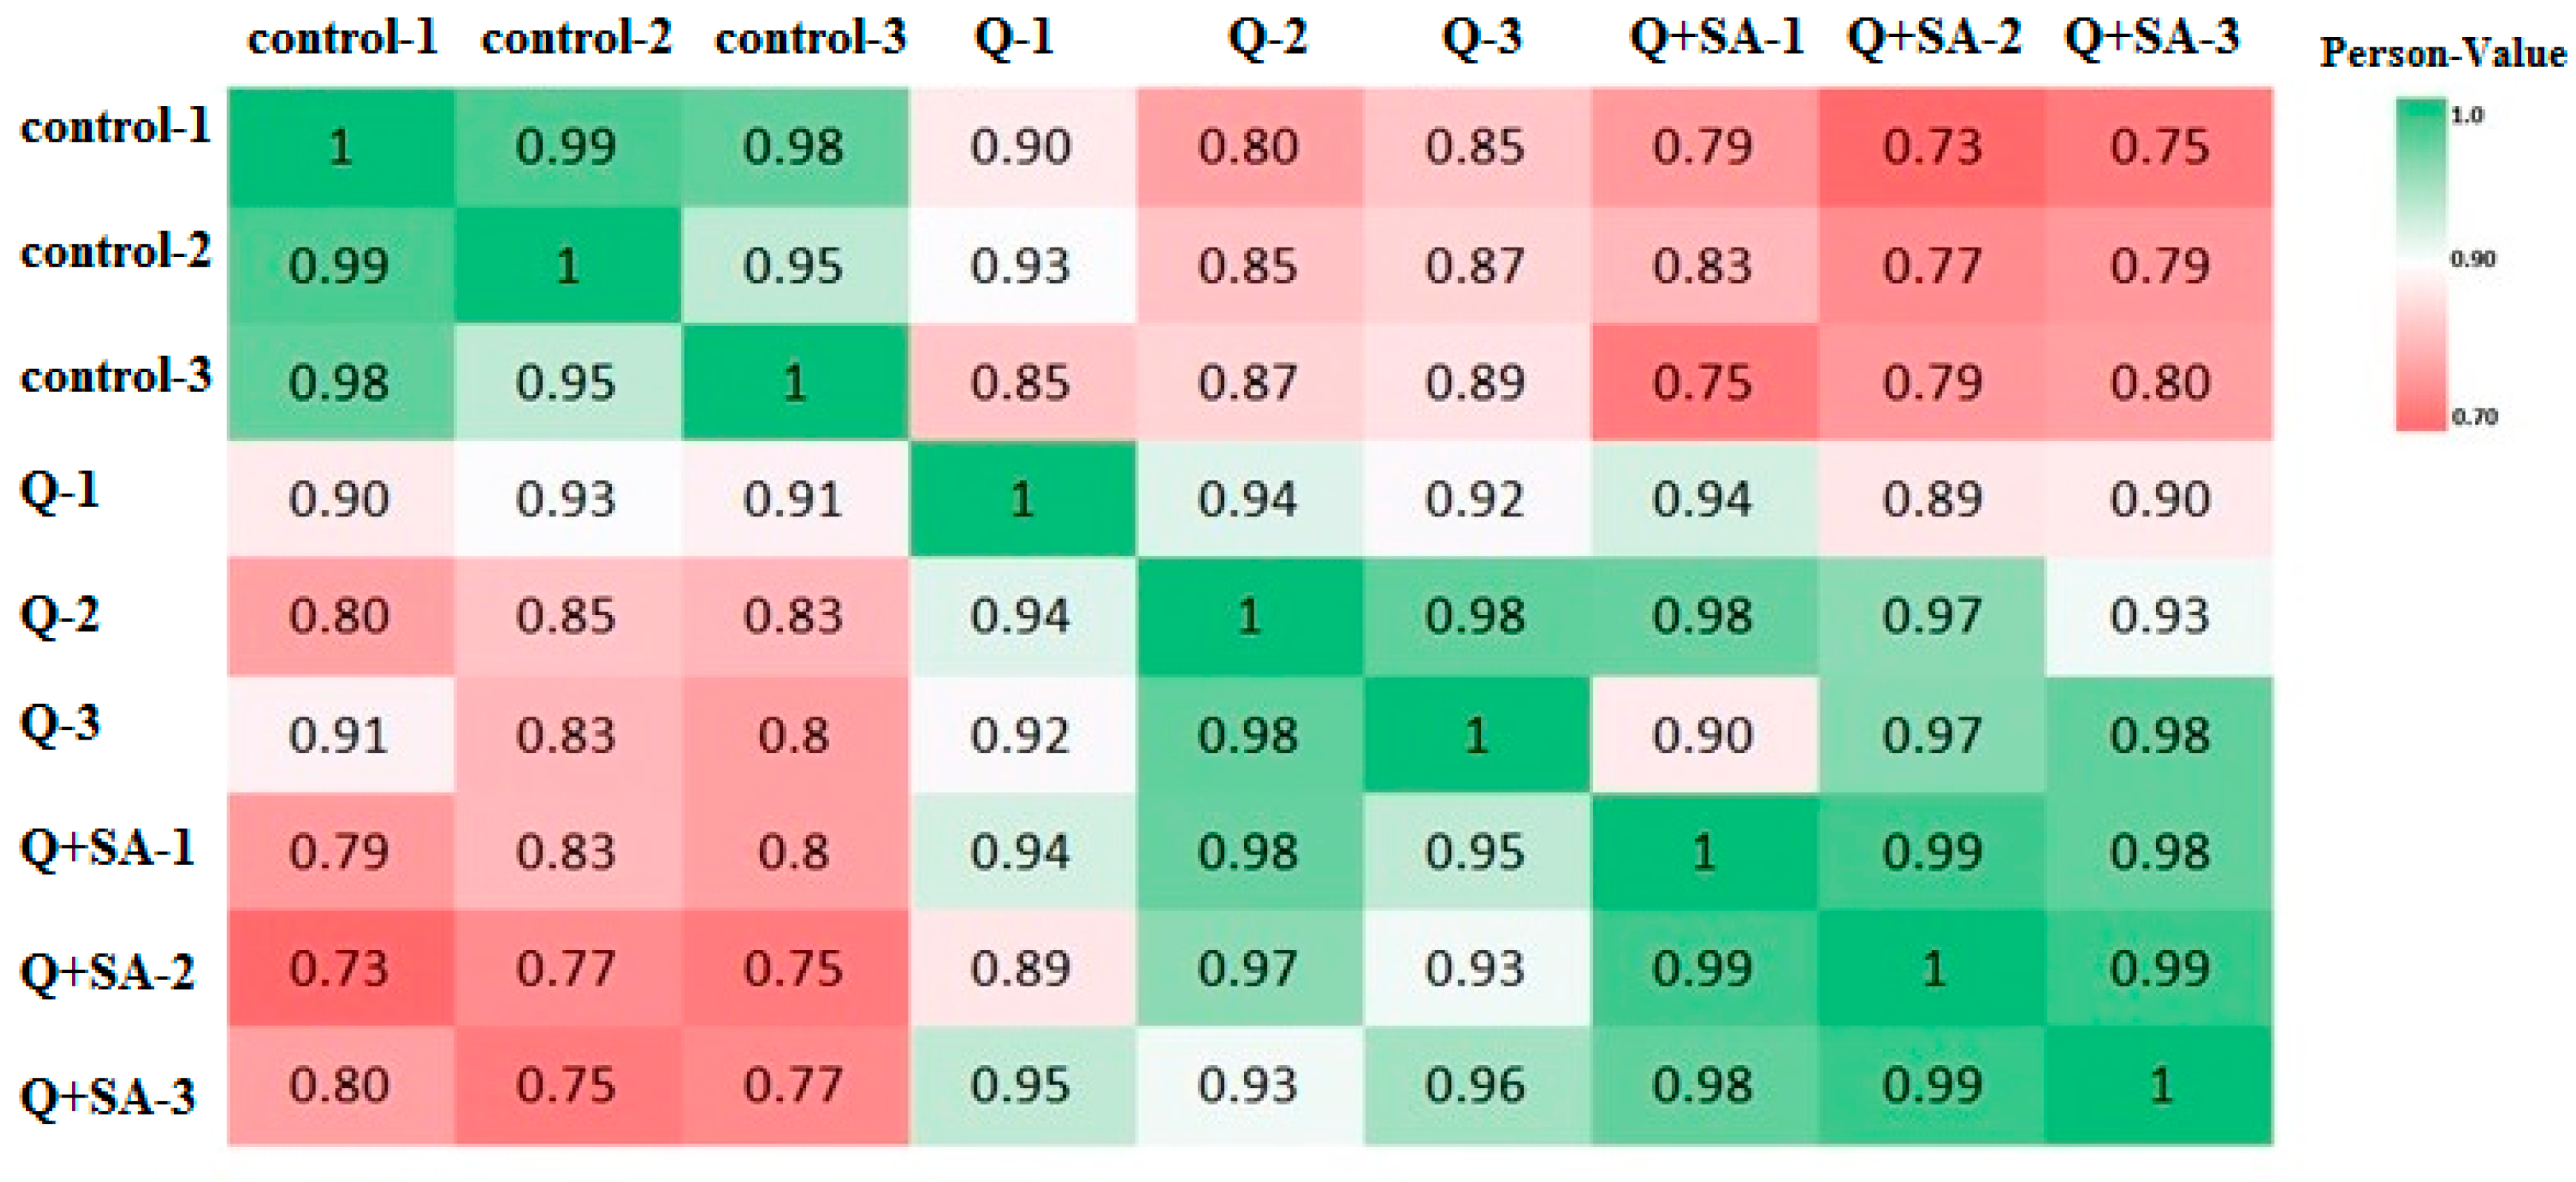
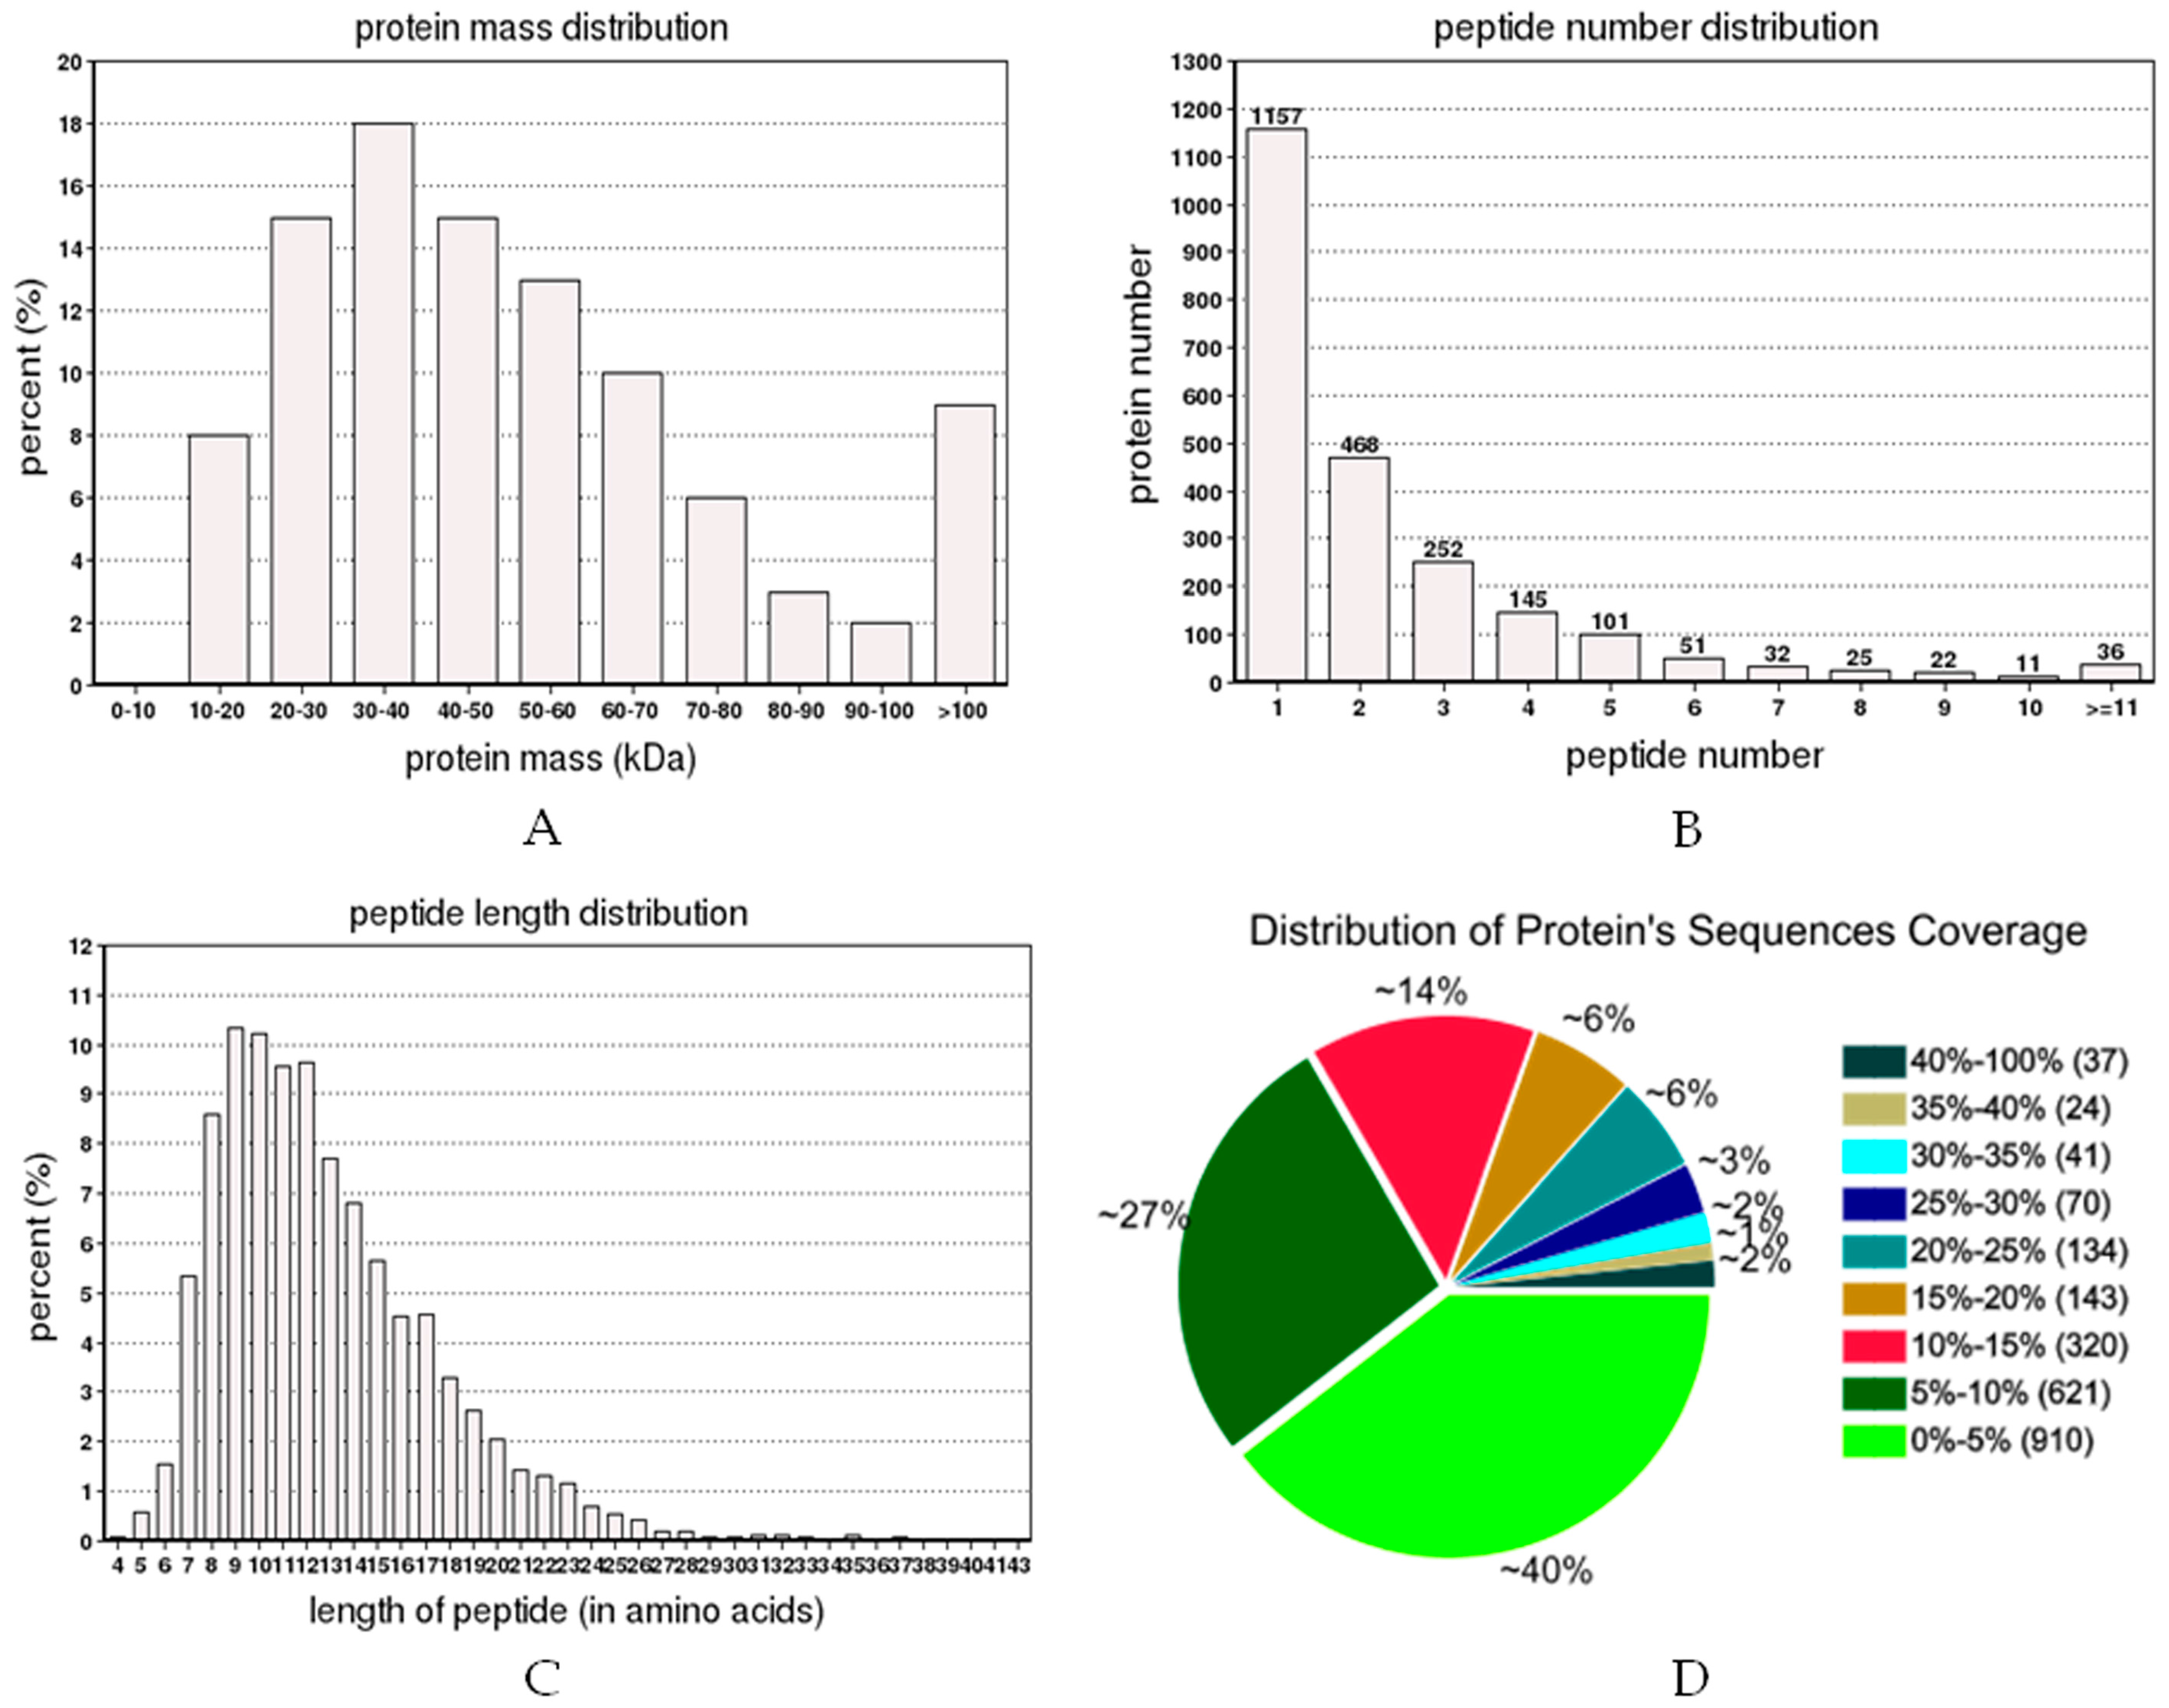
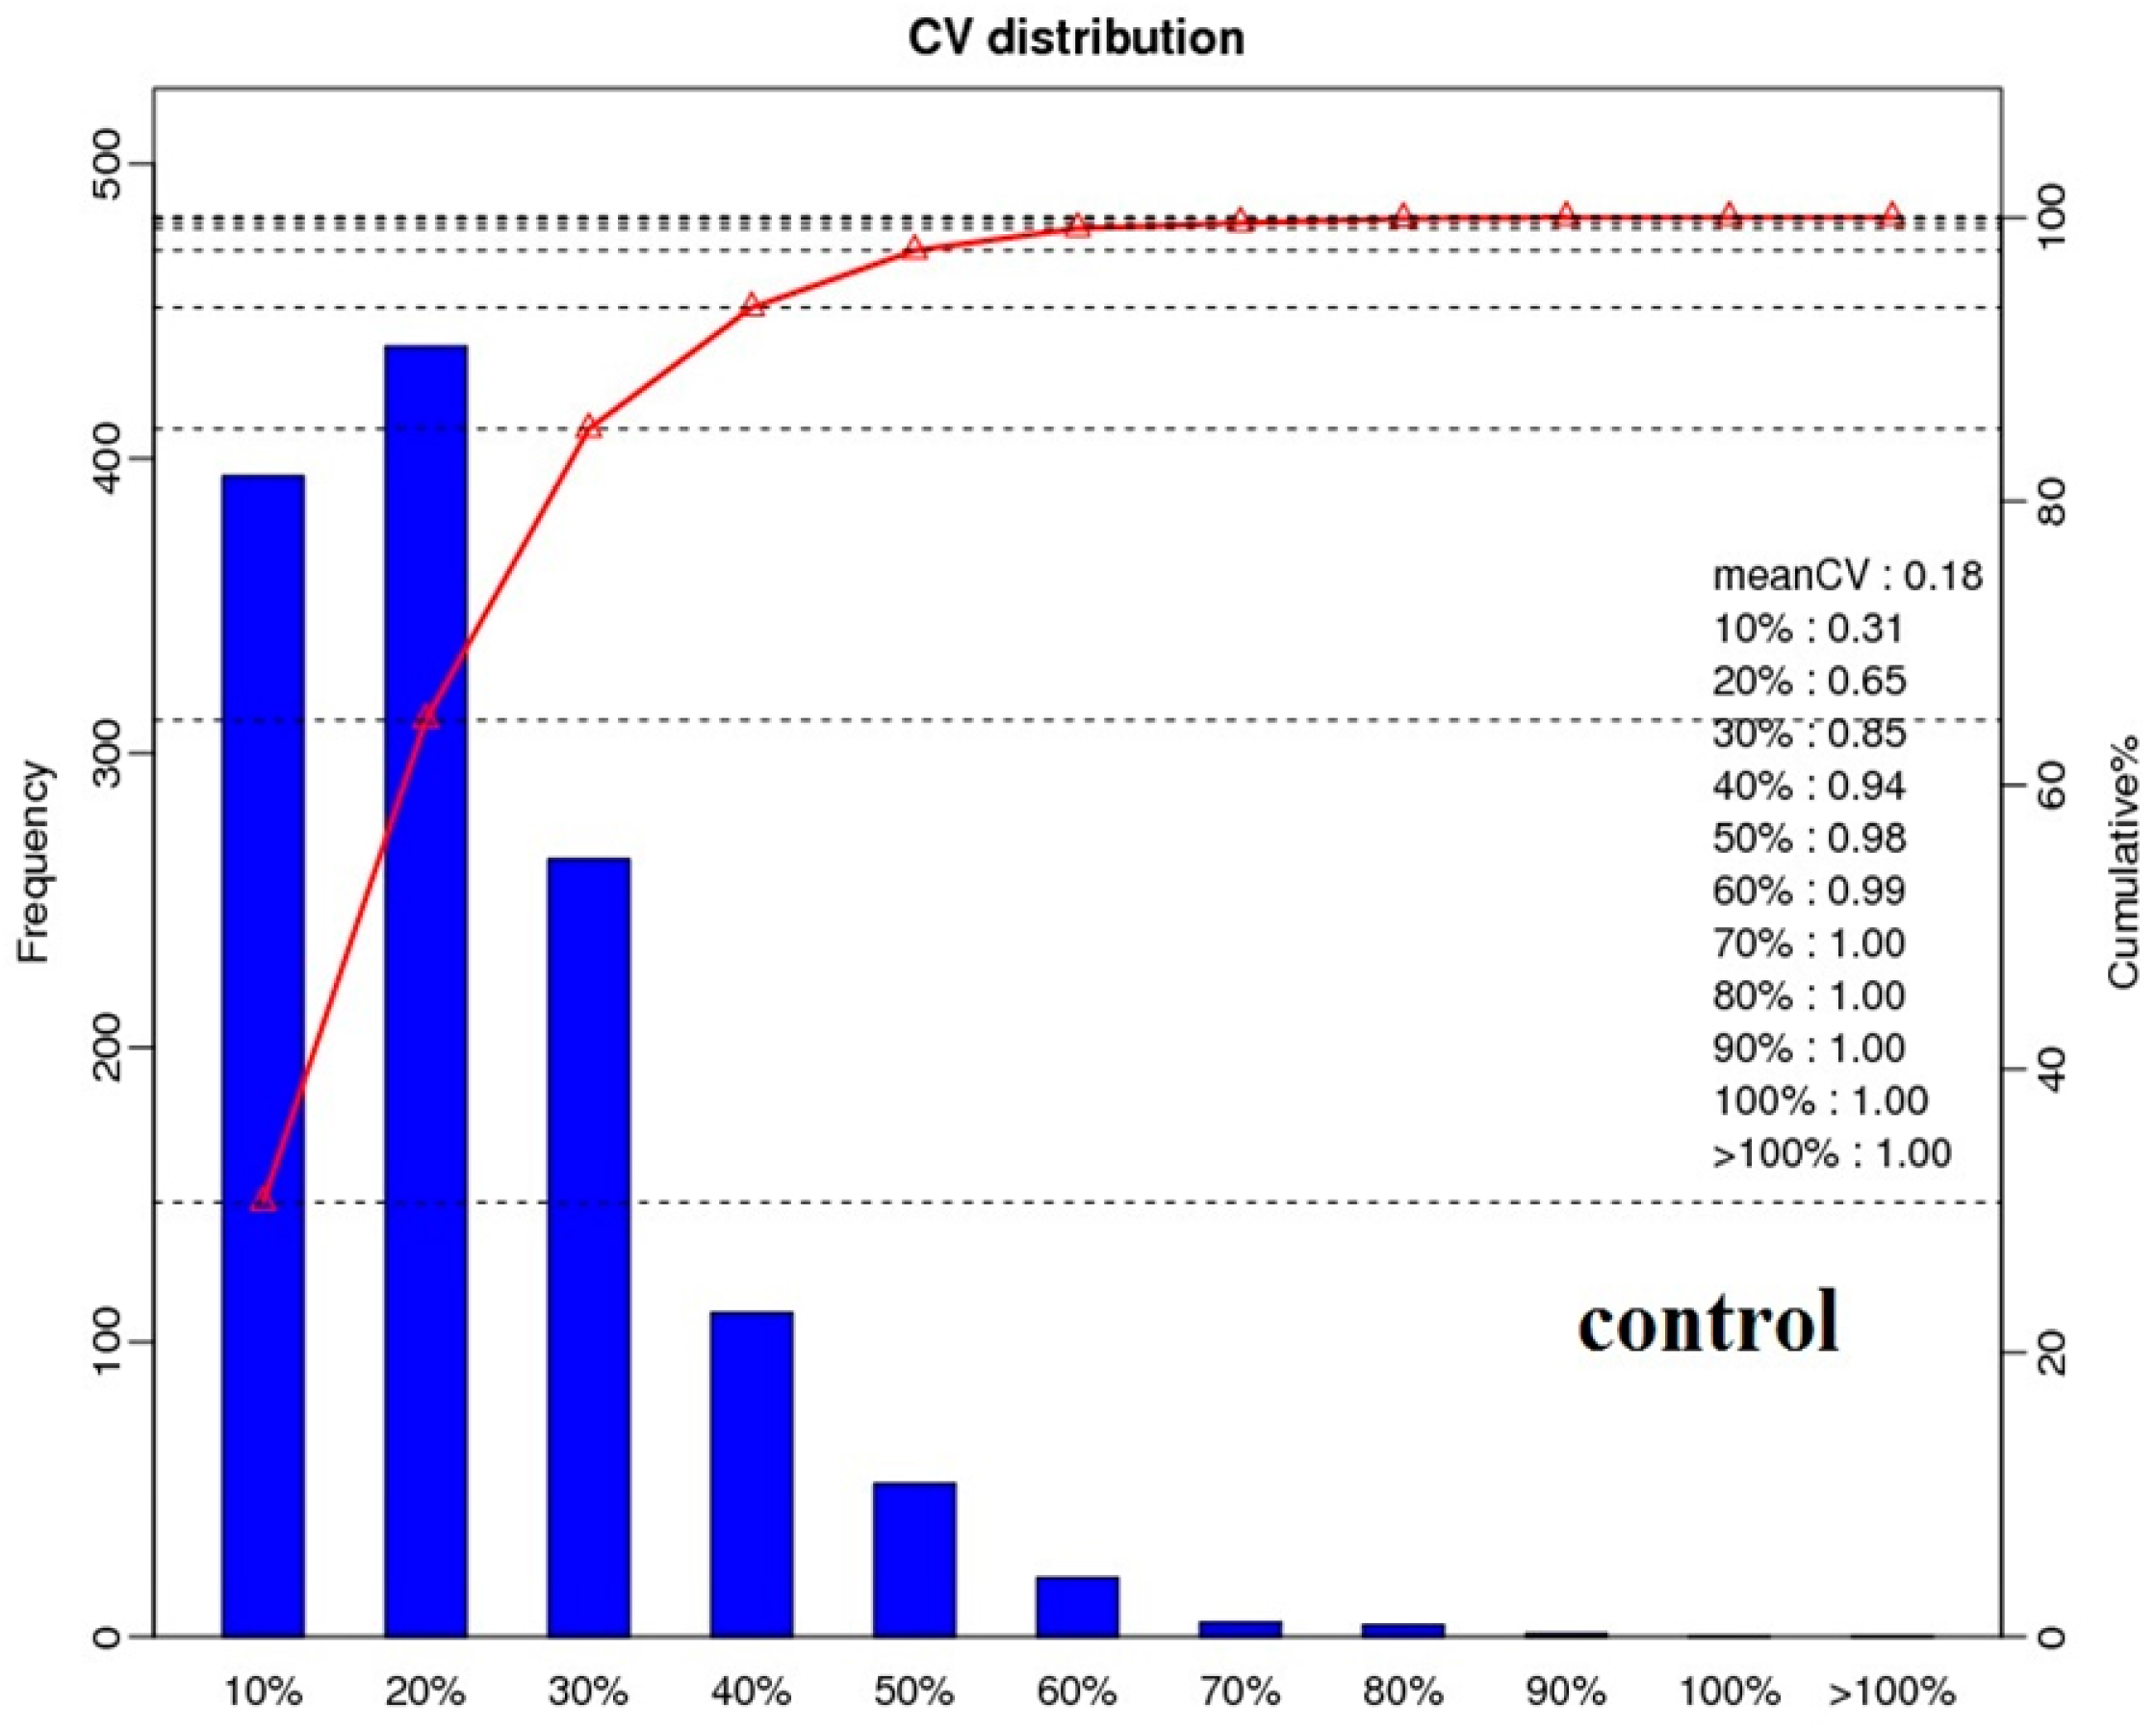
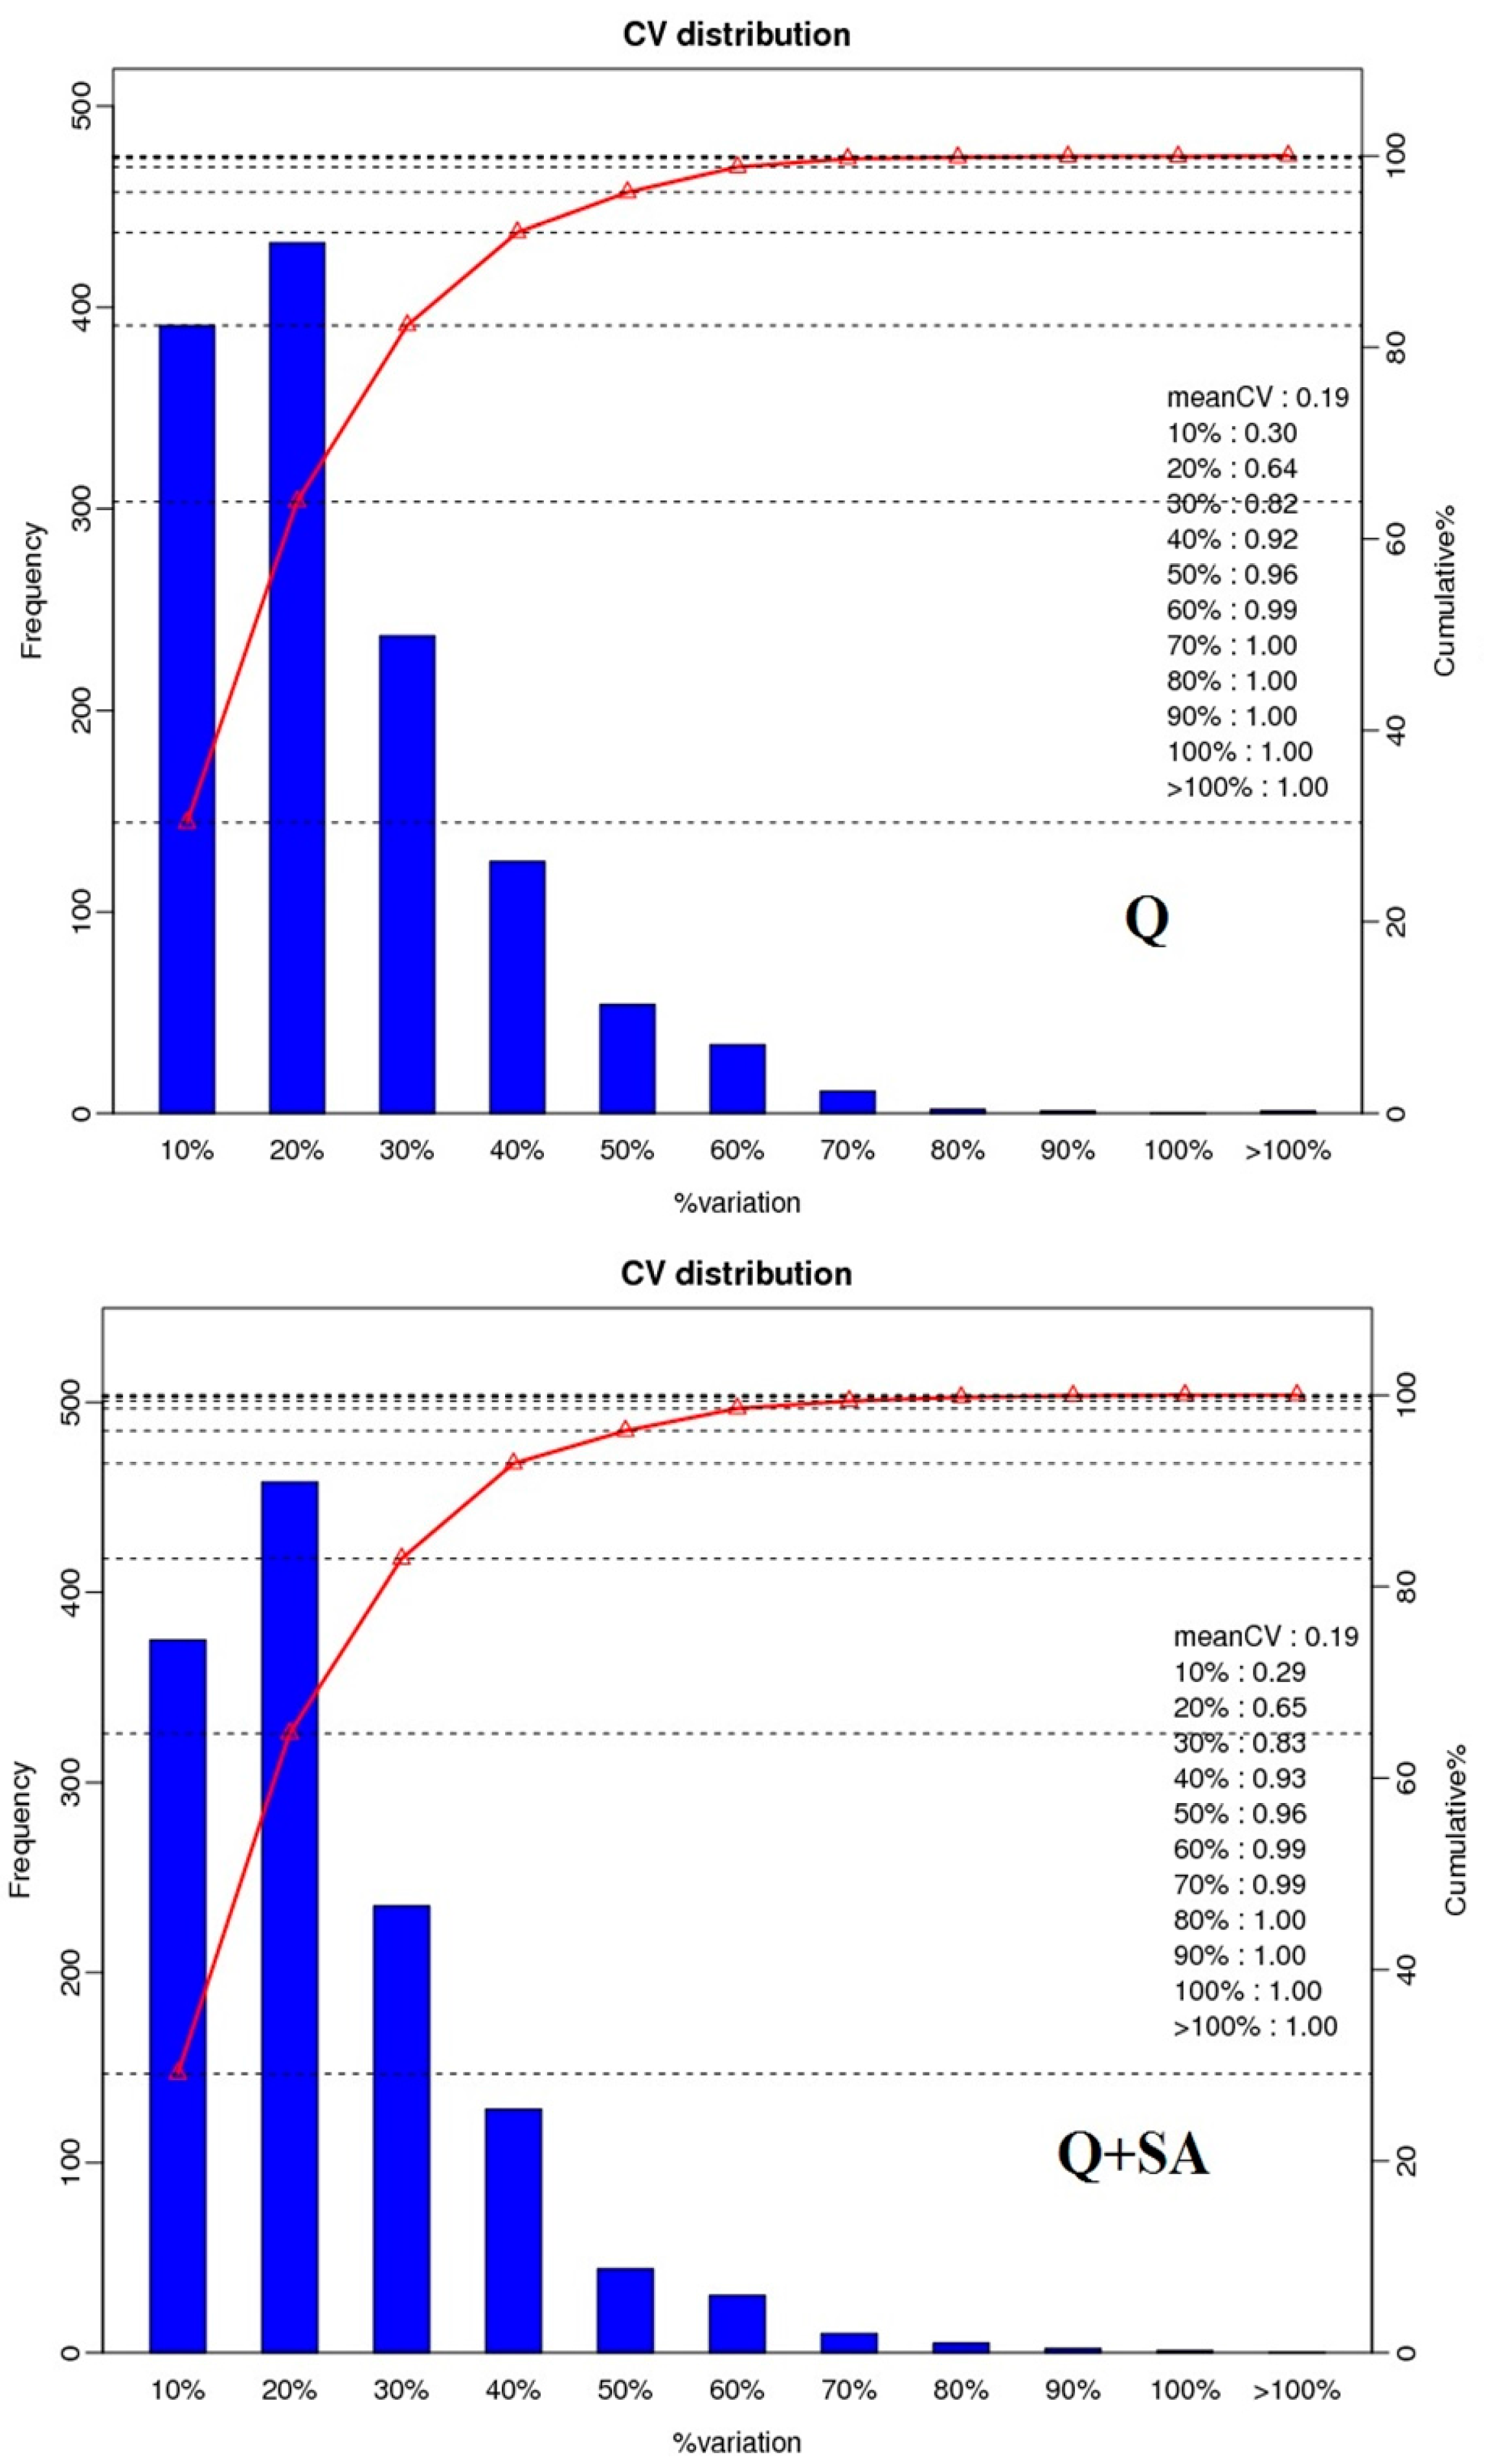
2.2. Protein Identification and Quantitation

A total of 291,605 spectra were produced from the iTRAQ experiment for different sets of treatments. By analyzing these spectra, we identified 17,872 known spectra, 16,184 unique spectra, 5812 peptides, 5453 unique peptides and 2300 proteins, respectively. The distribution of protein mass was summarized in Figure 2A. Proteins with 30–40 kDa accounted for 18%, followed by proteins with 20–30 kDa and 40–50 kDa. Figure 2B showed the numbers of peptide identified into the proteins. Results showed that identified proteins contained less than 10 peptides, and protein quantity decreased with the increase of the peptide. The distribution of peptide length has been shown in Figure 2C. Most of the peptides′ lengths were around nine, and the number of peptide lengths of more than 13 was considered to be relatively low. Additionally, 98% of protein sequence coverage was below 40% (Figure 2D). Meanwhile, the repetitive analysis for proteins is depicted in Figure 3. The results revealed that the CV value of three treatments (control, Q, Q + SA) was less than 0.2. The proportion of variation level between 10%–30% accounted for the major part of the total quantitative protein, which demonstrated the high repetition of each treatment.

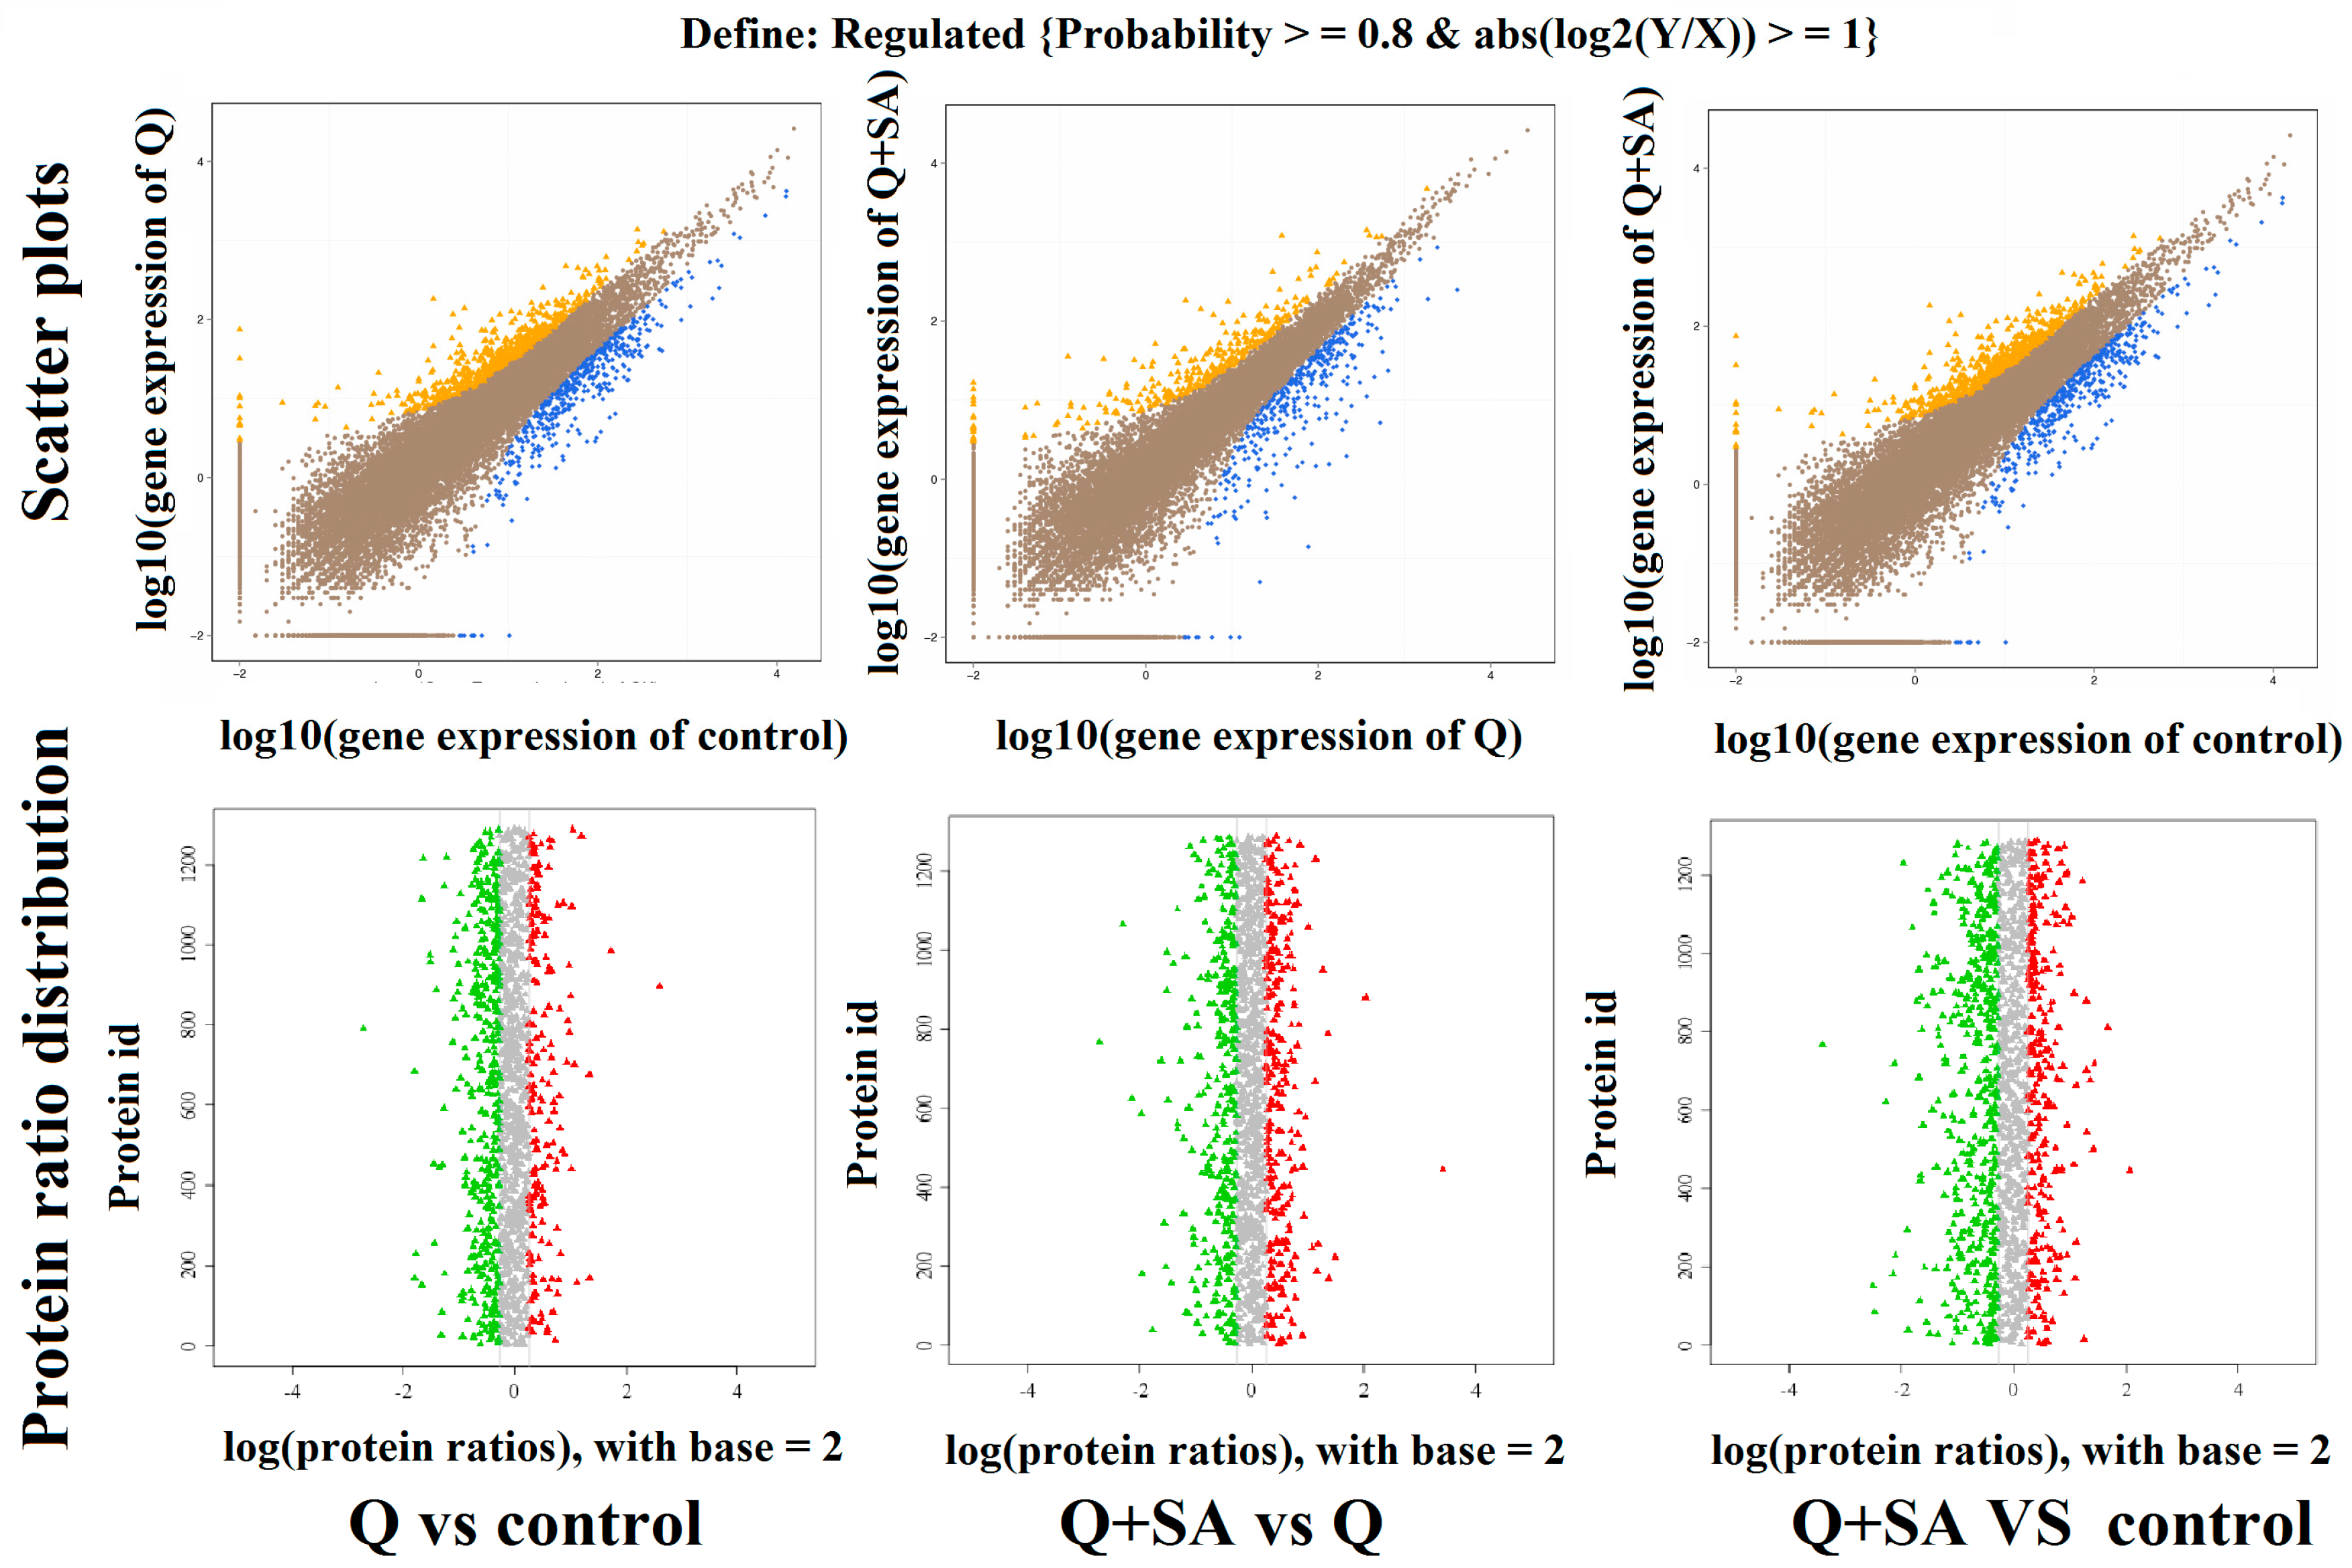
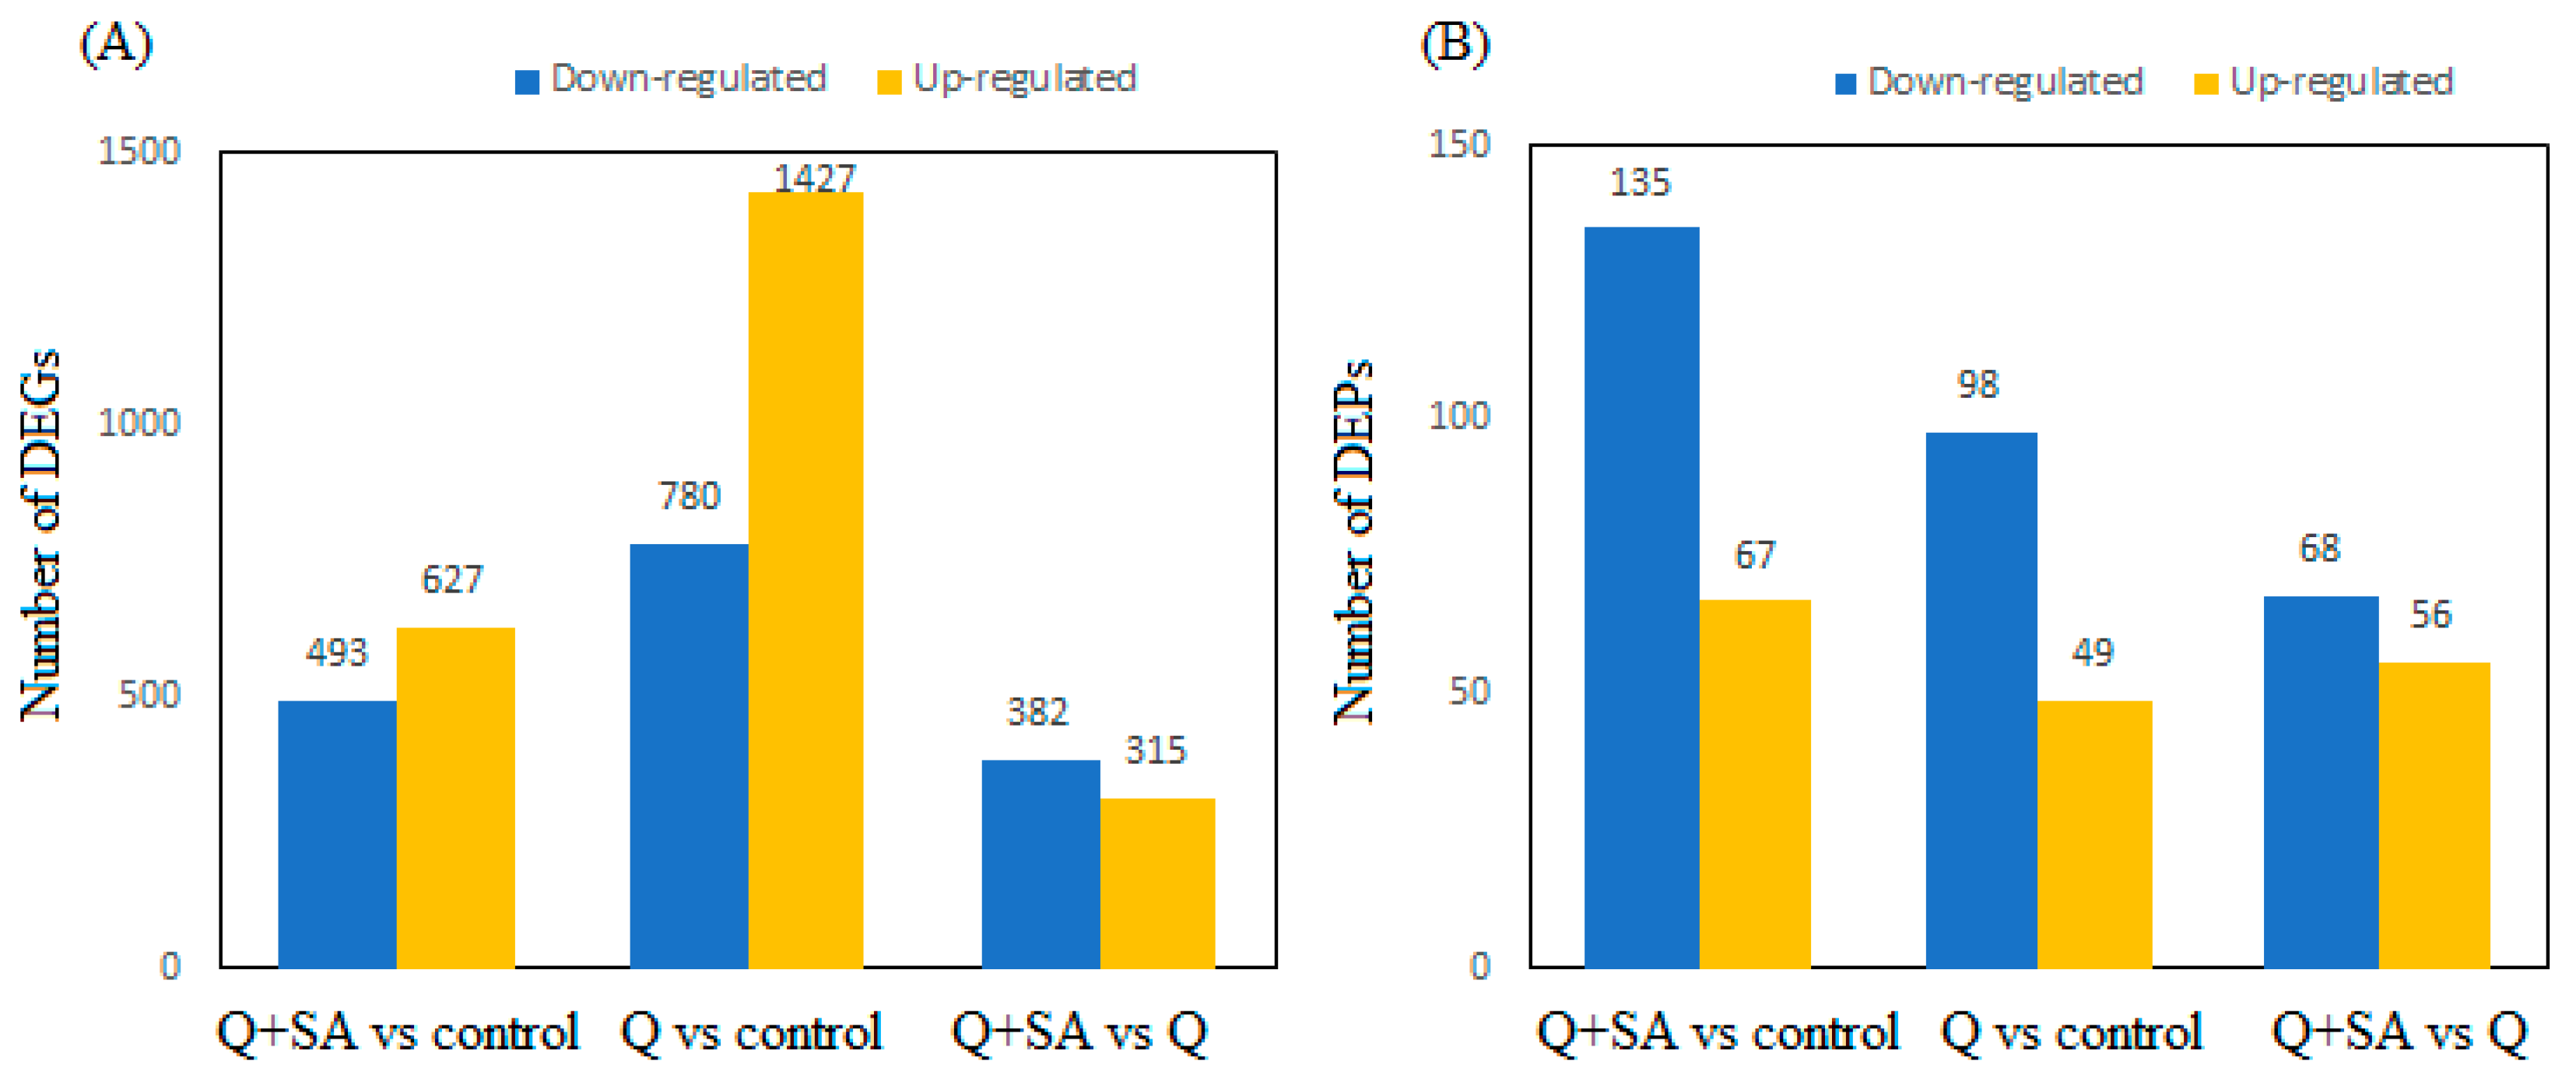
2.3. Screening of DEGs and DEPs

In order to find DEGs in different transcripts, we performed function analysis via the NOISeq, a differential expression algorithm. For the NOISeq method, samples were firstly grouped so a comparison could be performed between every two groups in a pairwise manner. We drew the scatter plot of all expressed genes and protein abundance and distribution, as in Figure 4, to represent the distribution of DEGs and DEPs in screening threshold dimensions. A histogram represented the significant up/down regulation of gene and protein numbers in Figure 5. More genes were expressed under quinclorac stress, including 1427 up-regulated and 780 down-regulated, compared to the control (Figure 5A, Q vs. control). Analysis of the Q + SA vs. Q comparison showed that 315 transcripts were up-regulated, while 382 genes were down-regulated. Exogenous SA pre-treatment up-regulated 627 genes, while 493 were down-regulated. For DEPs, quinclorac inhibited 98 proteins and increased the expression of 49 proteins (Figure 5B, Q vs. control). Moreover, SA pre-treatment stimulated a similar number of proteins including 68 down-regulated proteins and 56 up-regulated proteins (Figure 5B, Q + SA vs. Q).

2.4. GO Functional Classification and Pathway Enrichment Analysis of DEGs

We used Web Gene Ontology (WEGO) software for a Gene Ontology (GO) functional classification to understand the distribution of genes at macro level (Figure S1). Among three comparisons, major processes were “cellular process” and “metabolic process” in the biological process category, “cell” and “cell part” categories were predominant within the cellular component category, and most genes were annotated in the “binding” and “catalytic activity” categories of molecular function (Figure S1). Additionally, we found many genes that were related to “response to stimulus” and “single-organism process” in the biological process area, “membrane” and “organelle” in the cellular component, “transporter activity” and “nucleic acid binding transcription factor activity” in the area of molecular function, whereas few genes were classified into the “positive regulation of biological process”, “cell junction” and “metallochaperone activity” groups as shown in Figure S1. Pathway enrichment analyses of the DEGs based on the Kyoto Encyclopedia of Genes and Genomes (KEGG) database were performed to study the gene interaction with each other in order to play roles in certain biological functions. The whole report for DEGs in each pairwise, respectively, was generated in Table S1. In addition, we drew a scatter plot for the top 20 KEGG enrichment results in Figure S2. Most genes were clustered in metabolic pathways and the biosynthesis of secondary metabolites. The expressions of DEGs related to the ribosome were high in the Q + SA group compared to the control. In comparison with the control, herbicide treatment caused the enrichment of most genes in glutathione metabolism, porphyrin and chlorophyll metabolism, and valine, leucine and isoleucine degradation pathways (Figure S2, Q vs. control). Genes related to glutathione metabolism were also enriched in the Q + SA vs. Q comparison. In addition, SA pre-treatment also modulated phenylpropanoid biosynthesis, tyrosine metabolism and flavonoid biosynthesis. The Q + SA vs. control comparison did not show a similar significant level to the other two comparisons (Q vs. control, Q + SA vs. Q). The main pathways, such as porphyrin and chlorophyll metabolism, carbon fixation in photosynthetic organisms and photosynthesis, played an important role in the comparison. Over the total 16811 annotated genes, quinclorac produced 1289 genes enriched in 121 pathways, while 40 pathways were significantly enriched (p ≤ 0.05) (Table S1.1). SA with quinclorac stress generated 407 genes enriched in 108 pathways, while 31 pathways were significantly enriched (Table S1.2). In the Q + SA vs. control comparison, a total of 649 genes were enriched in 102 pathways with only 16 significant enrichments (Table S1.3).
Within the top five most significantly enriched pathways, glutathione metabolism and biosynthesis of secondary metabolites were found to be the most-enriched pathways under quinclorac stress, which proved that glutathione and secondary metabolites play important roles in herbicide detoxification. Under quinclorac stress, a total of 46 DEGs related to the glutathione pathway were expressed, while 260 DEGs related to secondary metabolites were expressed, whereas SA pre-treatment regulated 27 and 97 DEGs in these two pathways, accounting for 7% and 24% of all expressed DEGs, respectively. In the Q + SA vs. control comparison, DEGs related to ribosomal synthesis/regulation were enriched. Besides this, porphyrin and chlorophyll metabolism, carbon fixation in photosynthetic organisms, aminoacyl-tRNA biosynthesis pathways were also dominated pathways among other expressed pathways.

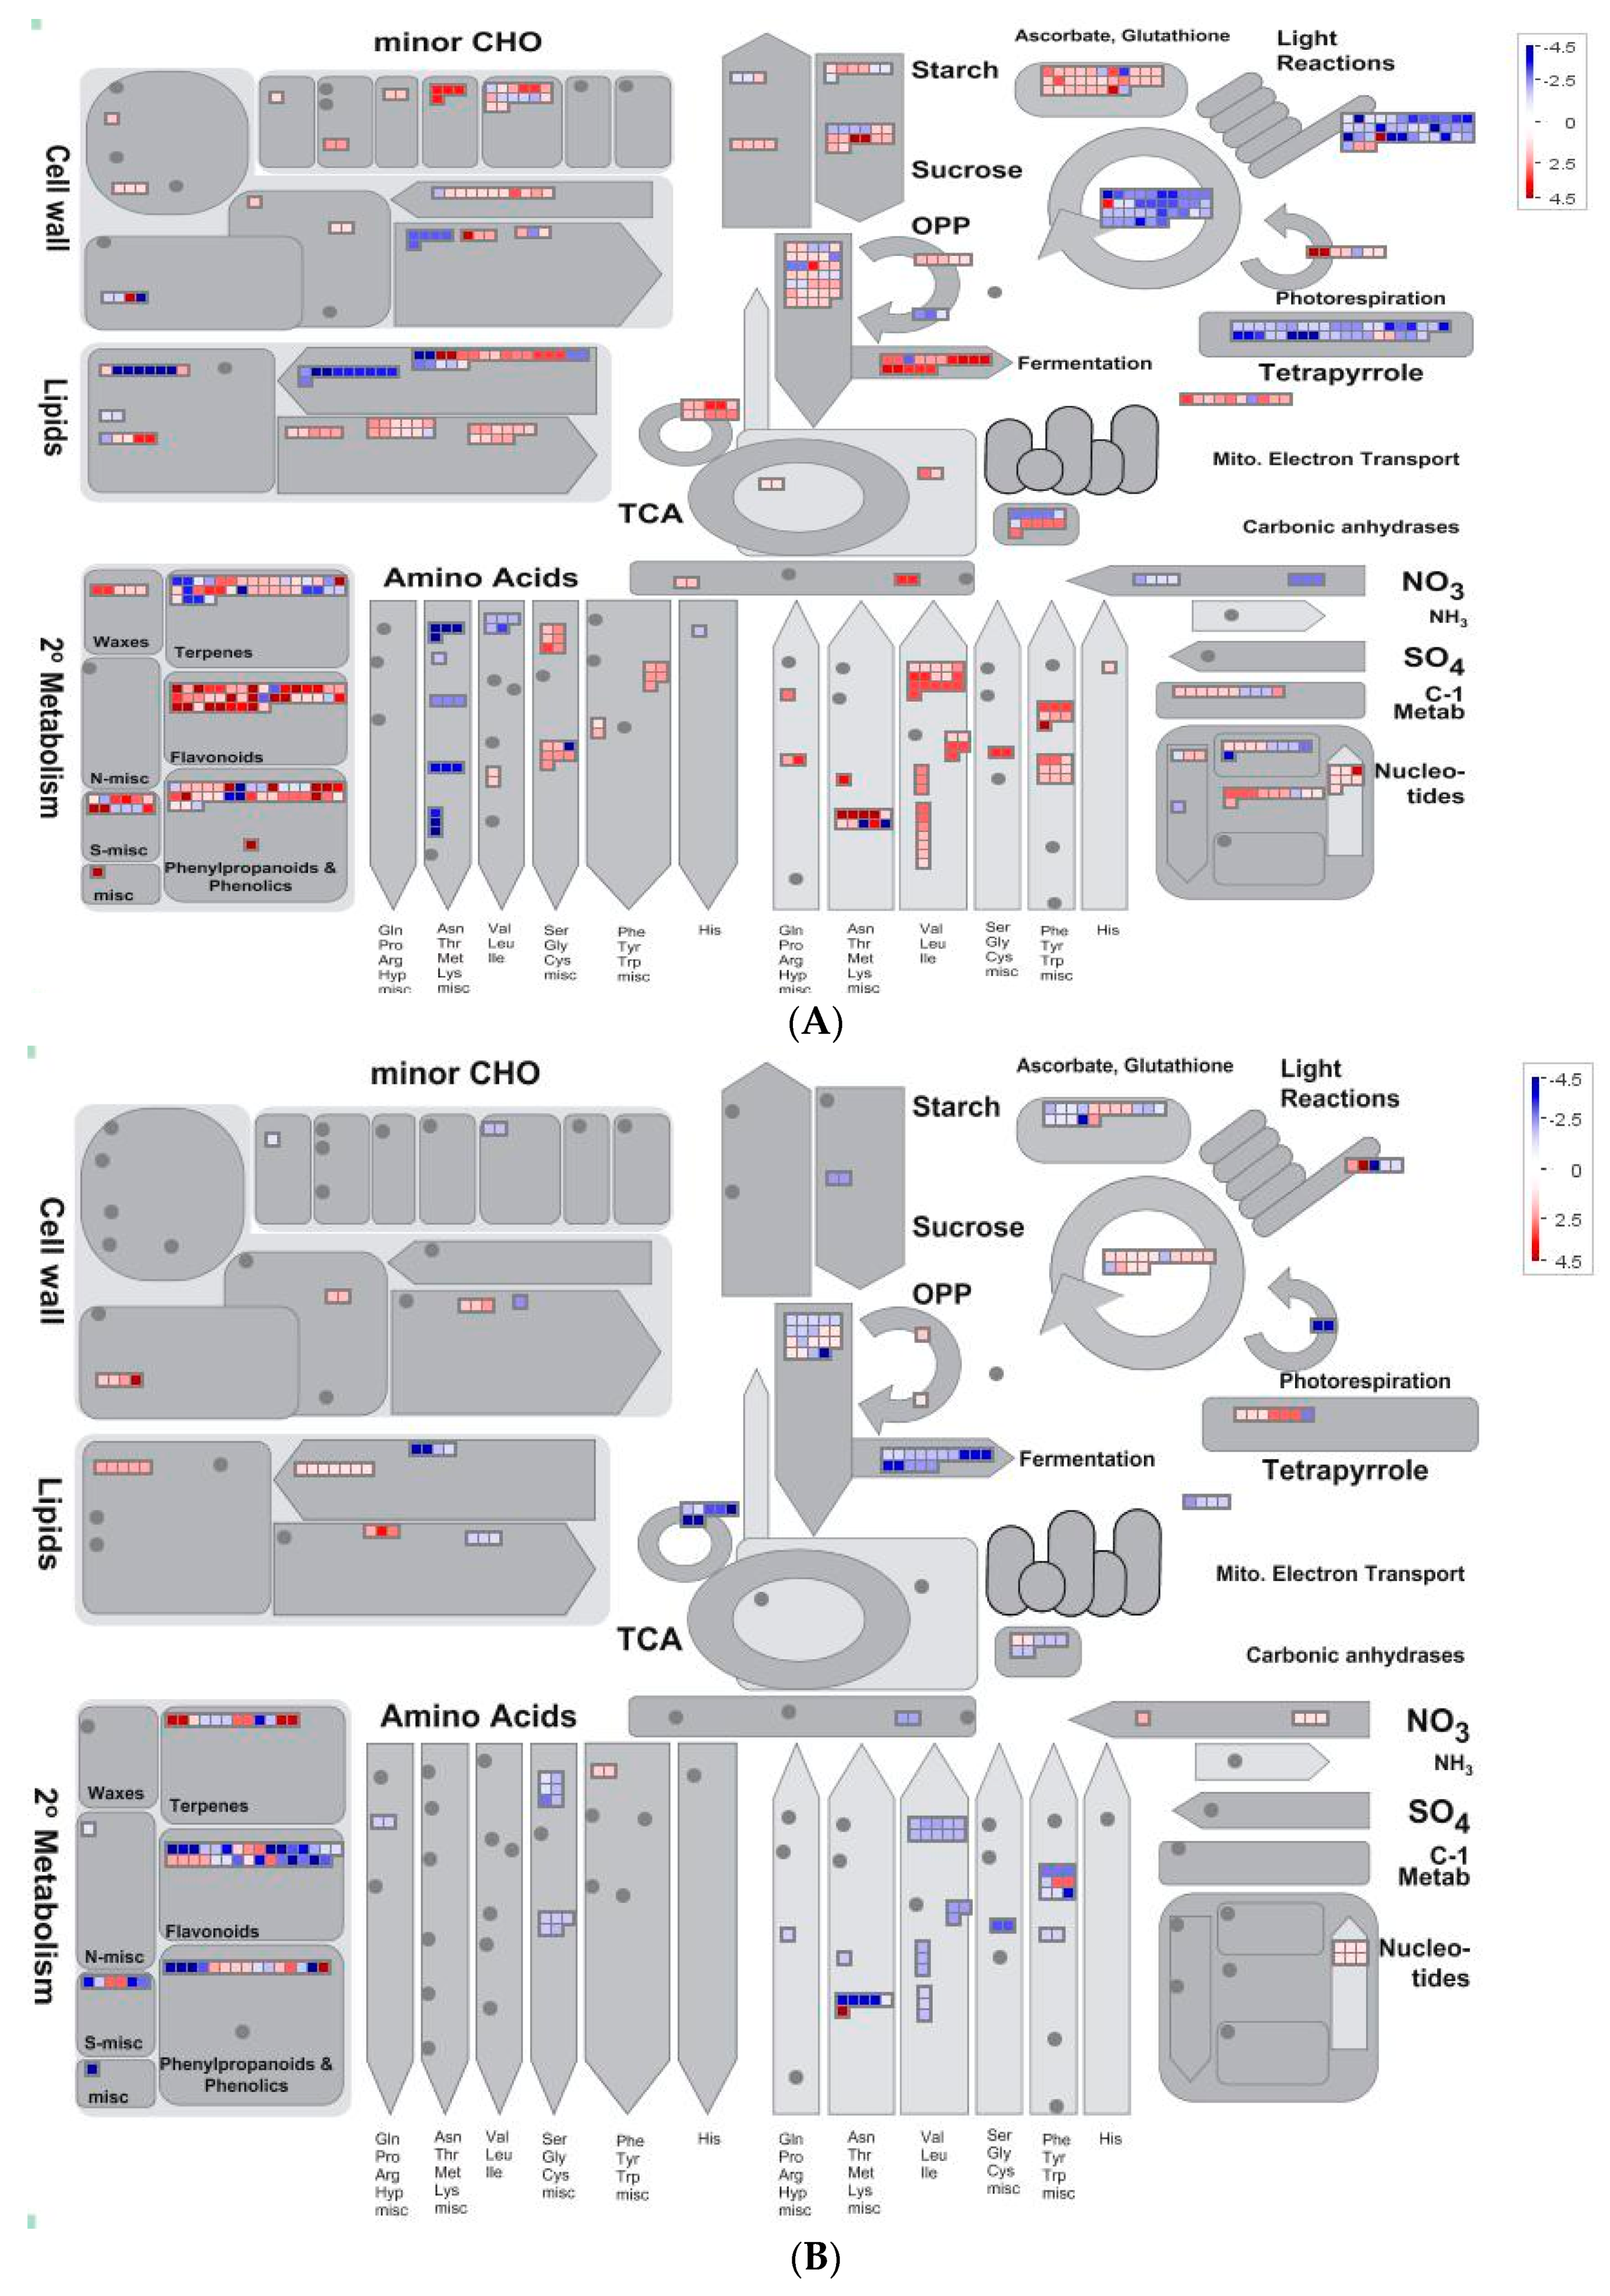
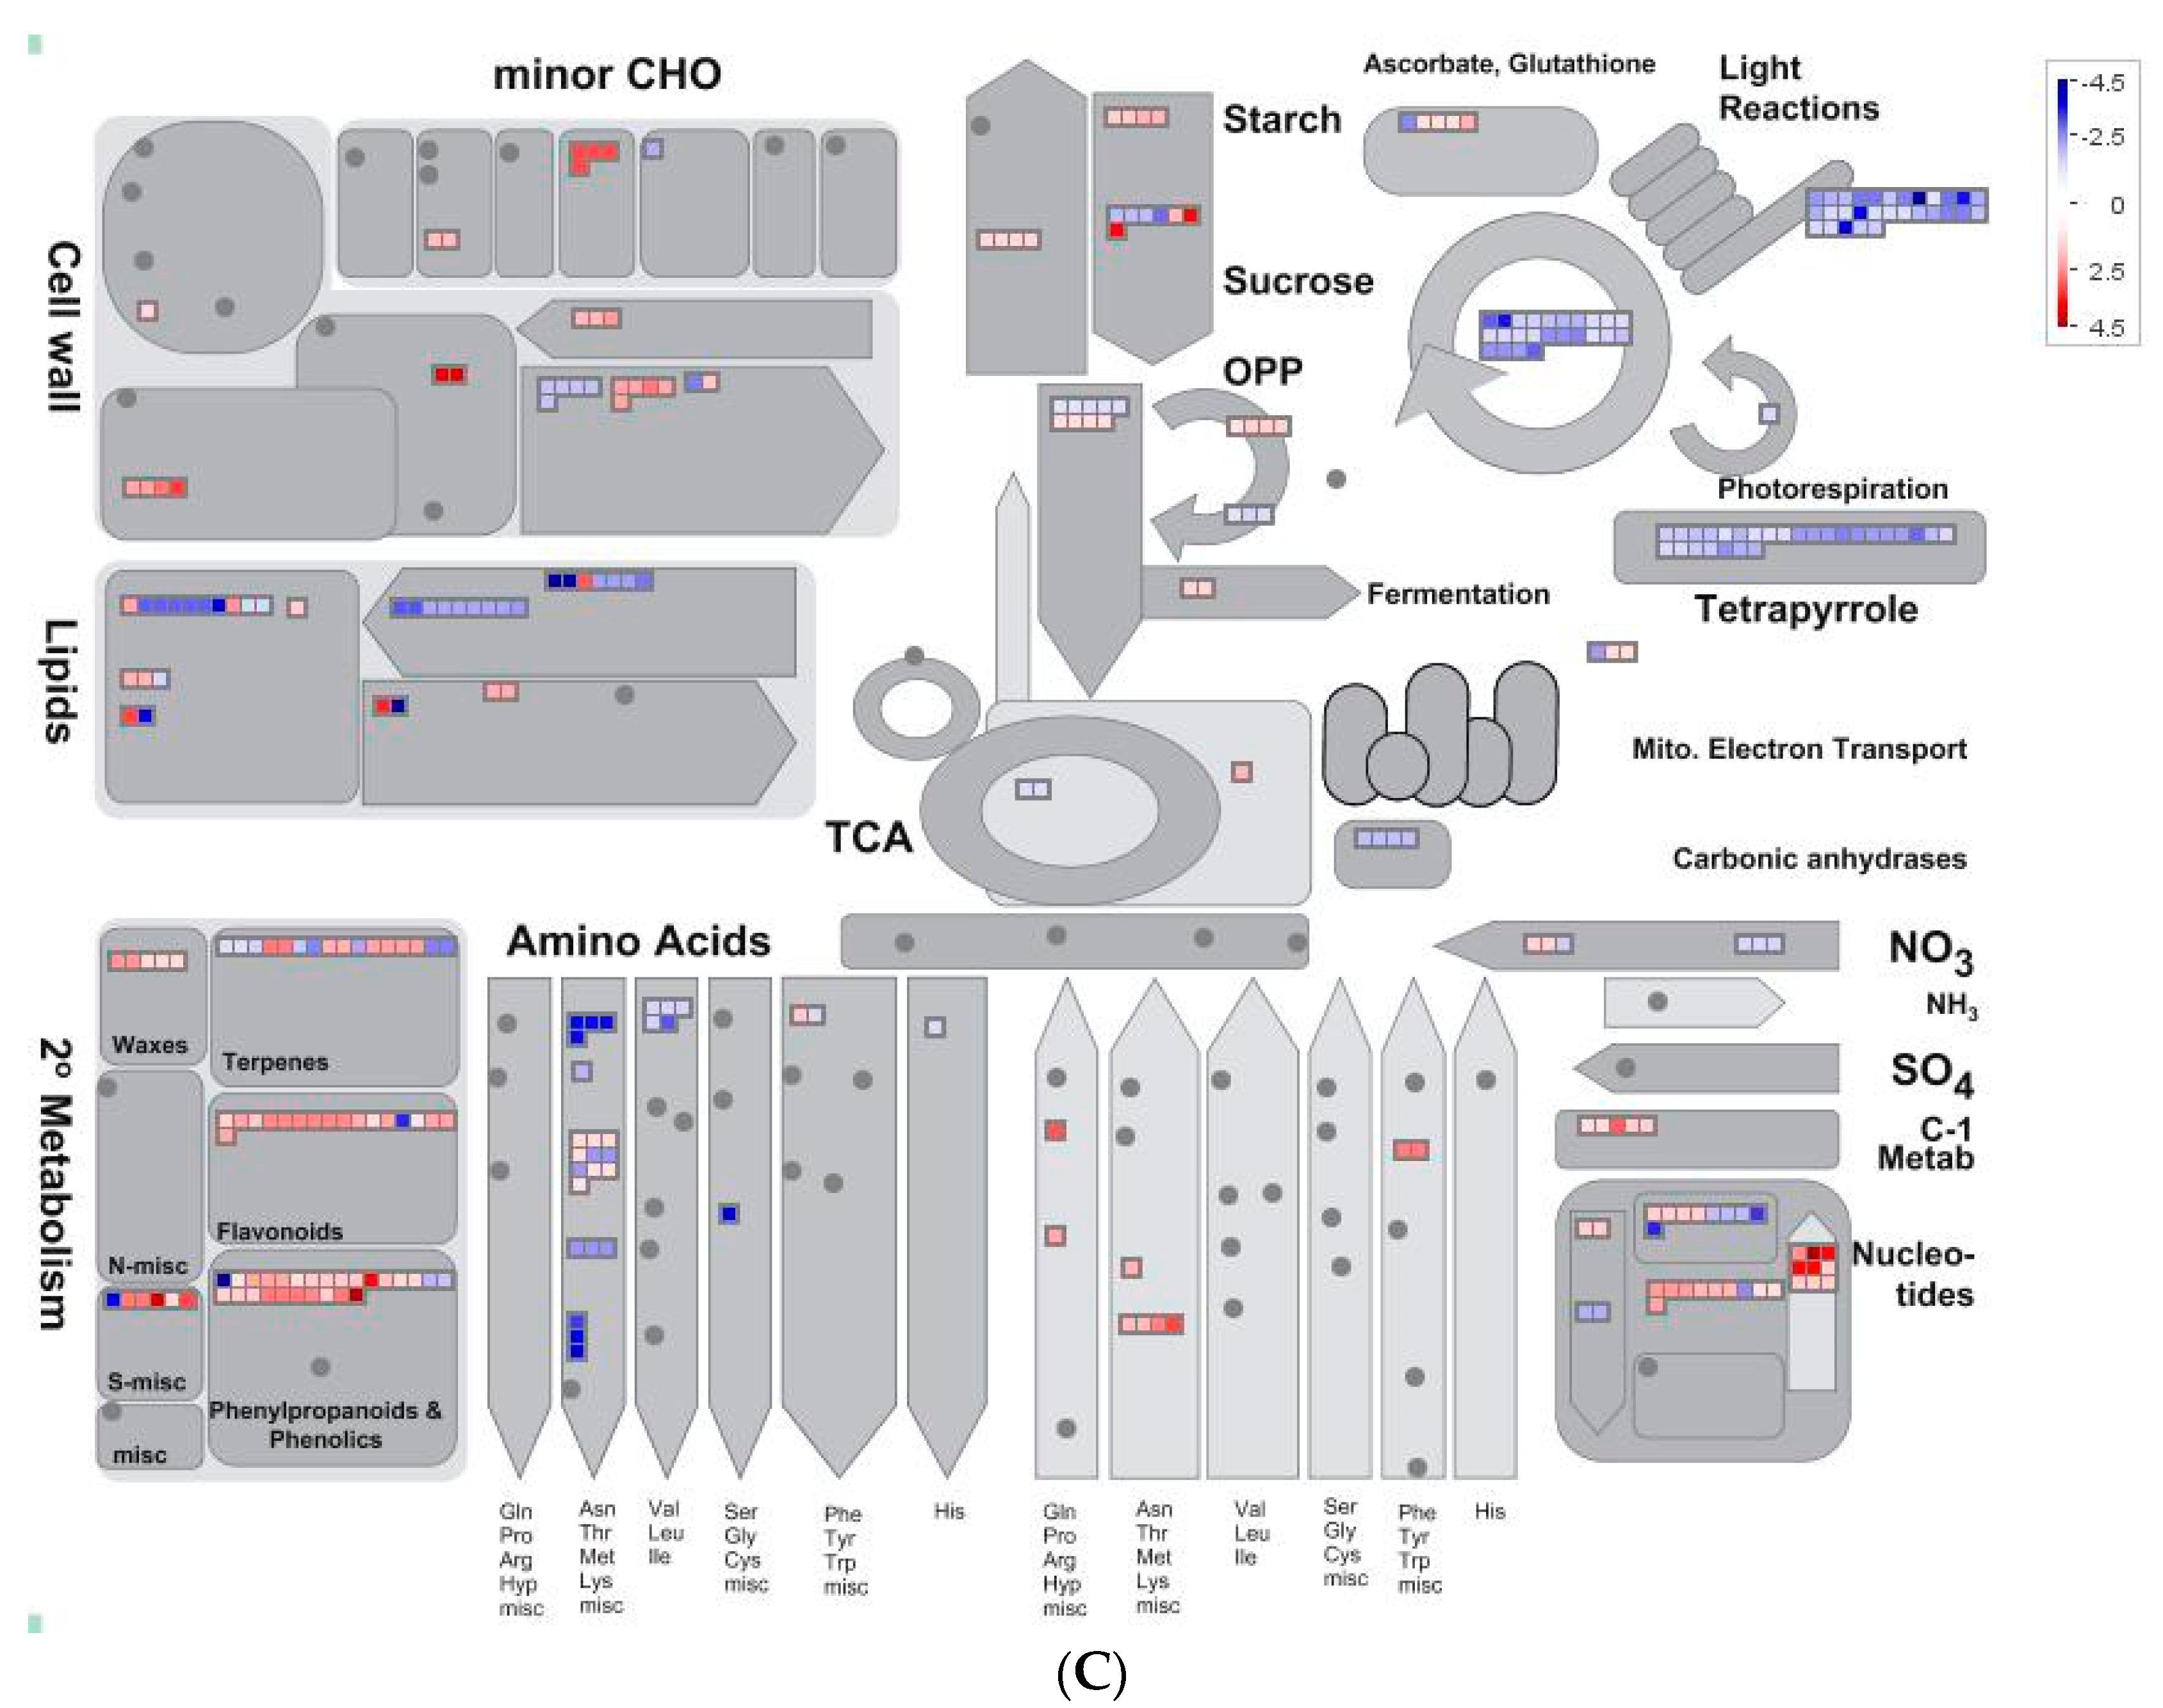
2.5. Overview of Metabolism by Using MapMan

We downloaded MapMan software from the Genome Analysis of the Plant Biological System (GABI) Primary Database and made a visual overview of metabolism (Figure 6). As shown in Figure 6A–C, quinclorac induced genes related to ascorbate and glutathione metabolism and inhibited light reaction and photorespiration to inhibit photosynthesis. The secondary metabolism contained a number of genes participating in the synthesis of flavonoids, phenylpropanoids and phenolics. Genes in the cell wall, lipids, amino acids and starch metabolism varied differently; some were up-regulated and some were down-regulated (Figure 6A). SA further stimulated the expression of ascorbate and glutathione genes. Light reaction and photorespiration were enhanced, and genes in the cell wall and lipid metabolism were increased (Figure 6B). In the Q + SA vs. control comparison, genes related to secondary metabolism were abundantly expressed, particularly in relation to the flavonoids, phenylpropanoids and phenolic metabolism (Figure 6C).

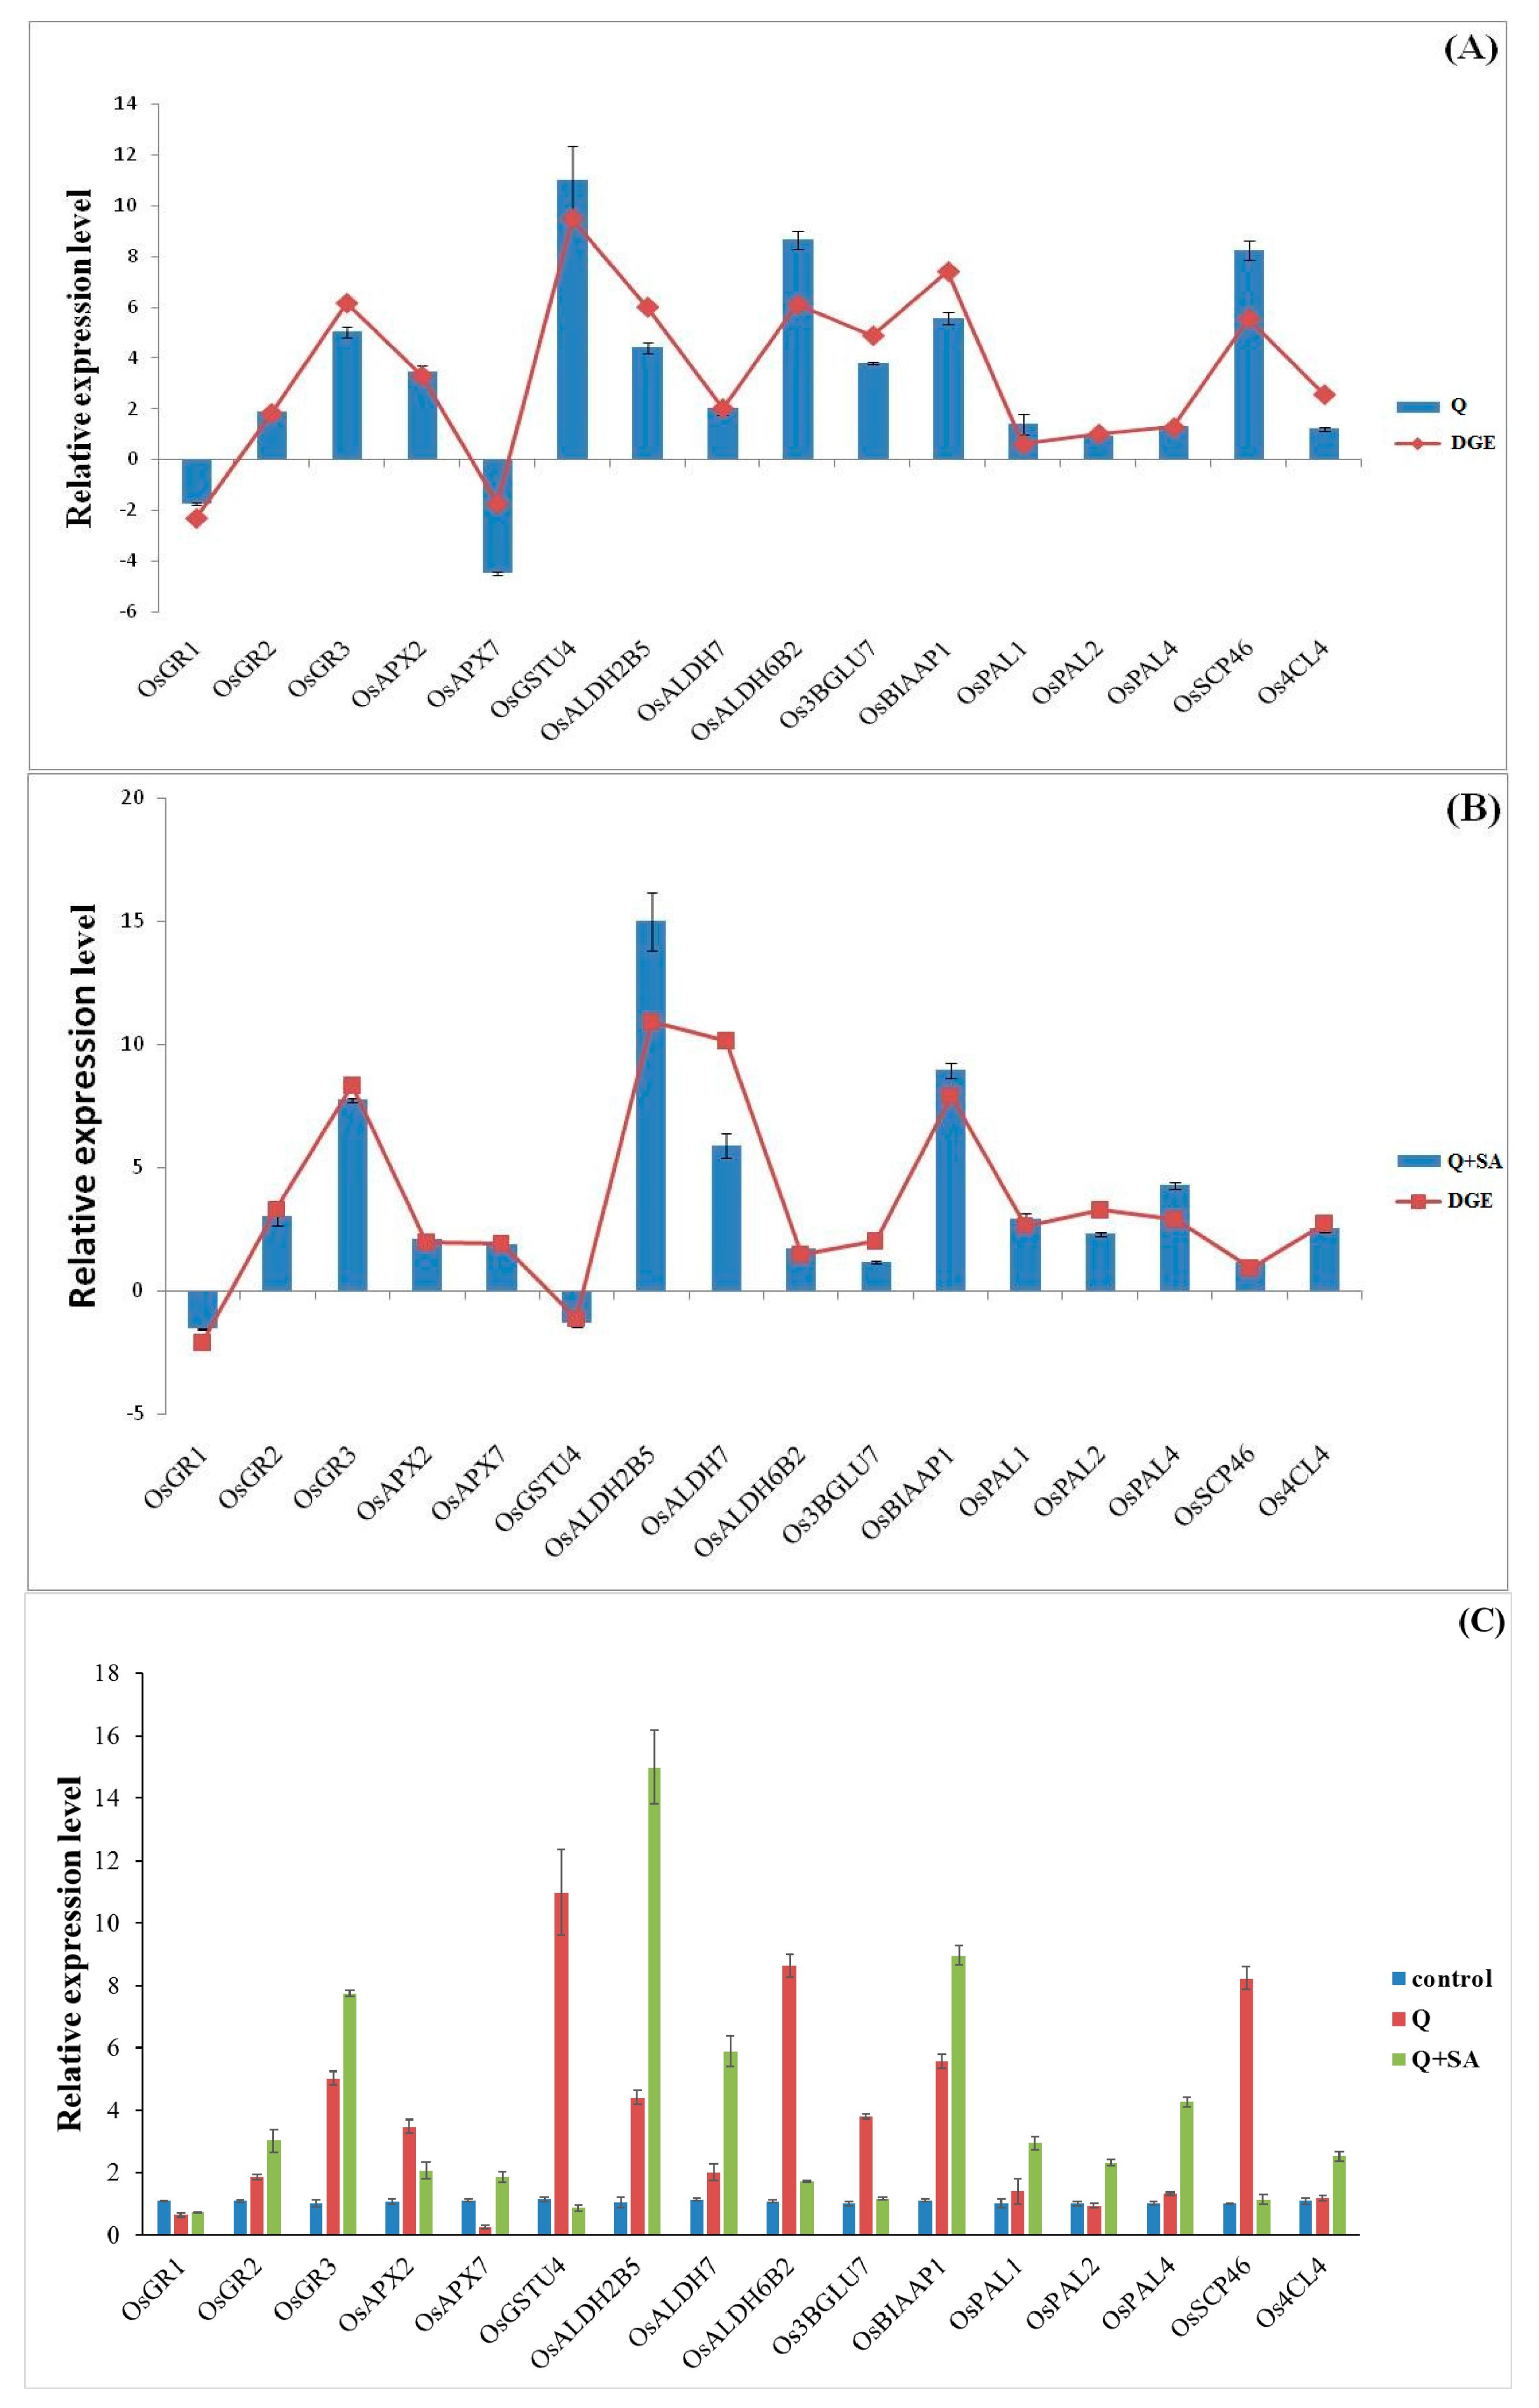
2.6. Quantitative PCR Analysis of Candidate Genes

According to the pathway enrichment analysis of DEGs, we randomly selected some candidate genes from significantly enriched pathways to verify the RNA-Seq data (Figure 7). Moreover, real time-PCR results also confirmed our RNA-Seq data. Glutathione reductase (GR) genes (OsGR2, OsGR3) were largely up-regulated under quinclorac stress, while the expressions of said genes were further enhanced under SA pre-treatment. The expression of OsGSTU4 and Os3BGLU7, which determines glutathione S-transferase (GST) and β-glucosidase respectively, were quite high after quinclorac treatment, while SA had no significant effect on them. Other rice acetaldehyde dehydrogenase (ALDH) genes such as OsALDH2B5, OsALDH7 were also increased under quinclorac stress, and SA pre-treatment further enhanced their expressions. Moreover, SA induced phenylalanine deaminase genes (OsPAL1, OsPAL2, OsPAL4) and 4-coumarate: coenzyme A ligase gene (Os4CL4) were highly expressed (Figure 7).

2.7. Pathway Enrichment Analysis of DEPs

The significantly enriched pathways (p ≤ 0.05) under different treatments are presented in Table 2. Under quinclorac application, 87% of DEPs were enriched in seven pathways. The cysteine and methionine metabolism, glyoxylate and dicarboxylate metabolism, and phenylpropanoid biosynthesis were the most remarkable pathways, while metabolic pathways had the largest number of DEPs (Table 2, Q vs. control). On the other hand, SA + Q treatment regulated 20 proteins in five pathways, including alanine, aspartate and glutamate metabolism, riboflavin metabolism, arginine biosynthesis, terpenoid backbone biosynthesis, and 2-Oxocarboxylic acid metabolism. In Q + SA vs. control, DEPs were involved in the biosynthesis of antenna proteins, amino acids, valine, leucine and isoleucine, and the metabolism of pyrimidine, pentose and glucuronate. In a comprehensive perspective, cysteine is the product of methionine metabolism and an important part of GSH. Simultaneously, it is a crucial component of the DNA-binding domain. The enrichment of proteins in different pathways was consistent with the transcriptome results.

2.8. Transcription Factor Analysis

The transcription factor (TF) is also called the trans-acting factor, a kind of protein which can uniquely bind genes of 5′ upstream specific sequences, thereby ensuring target gene expression with a given rate in a particular time and space. We used hmmsearch to search for the characteristics of the domain in PlantTFDB database (http://plntfdb.bio.uni-potsdam.de/v3.0/), then conversely to predict if a gene can code TF. Meanwhile, TF was aligned from China Rice Data Center (http://www.ricedata.cn/gene/).
In the Q vs. control comparison, we found 14 TF families, mainly distributed in AP2-EREBP, MYB, and WRKY TFs of AP2-EREBP transcription families; the WRKY family were mostly up-regulated, but the MYB family showed mixed expression. It indicated that, under quinclorac stress alone, most genes were up-regulated (Table S2.1). OsDREB2A (LOC_Os01g07120), OsERF922 (LOC_Os01g54890), OsEREBP1 (LOC_Os02g54160) genes were expressed 5.16, 16.35, 2.81 times higher than control. OsPHR3 (LOC_Os02g04640) gene belonging to MYB family was up-regulated more than tenfold. Some TFs from the no apical meristem (NAM), ATAF, and cup-shaped cotyledon (CUC) transcription factor amily, OsNAC10 (LOC_Os11g03300) and ONAC131 (LOC_Os12g03040) were expressed up to 62.64 and 125 times higher, respectively. In the Q + SA vs. Q comparison, we found nine TF families, and SA pre-treatment mainly repressed NAC family TFs (Table S2.2). OsIRO2 (LOC_Os01g72370) gene, an Fe-deficiency-inducible Bhlh family TF involved in Fe homeostasis in rice, was expressed nearly 30 times. ONAC095 (LOC_Os06g51070) gene was found to be up-regulated while the expression of OsNAC10 (LOC_Os11g03300) and ONAC131 (LOC_Os12g03040) genes were inhibited. Some WRKY family TFs, including OsWRKY45 (LOC_Os05g25770) and OsWRKY76 (LOC_Os09g25060), showed decreased transcript abundance. In the SA + Q vs. control comparison, there were also 14 TF families responding the treatment (Table S2.3). Most of TFs were found to be up-regulated, however only MYB-related TFs were inhibited.

2.9. Correlation Analysis of Transcriptome and Proteome Data under Different Treatments

An expression correlation analysis was performed between DEPs and their corresponding transcripts (Table 3). Detailed correlation analysis results have been shown in supplementary data (Table S3). In total, 44 correlated proteins were observed under quinclorac treatment alone; however, exogenous SA pre-treatment only generated five proteins (Table 3). In the Q + SA vs. control, we detected 35 correlated proteins. Among those proteins, 30 proteins which included four up-regulated and 26 down-regulated proteins exhibited the same expression tendency. Proteins which are related to the synthesis of chlorophyll such as Mg-chelatase H subunit (OsChlH, LOC_Os03g20700), catalase (CAT) (OsCATA, LOC_Os02g02400), geranylgeranyl reductase (LYL1, LOC_Os02g51080) and protochlorophyllide oxidoreductase B (OsPORB/FGL, LOC_Os10g35370) were inhibited. Under quinclorac stress, the synthesis of chlorophyll-related DEGs/DEPs were considerably down-regulated. Only cytosolic pyruvate kinase (OsPK1, LOC_Os11g05110), indole-3-glycerol phosphate synthase family protein (LOC_Os08g23150.1|PACid: 24101120), glucose-6-phosphate dehydrogenase 4 (LOC_Os03g20300.1|PACid: 24121754), lactate/malate dehydrogenase 1 (LOC_Os12g43630.1|PACid: 24149304) were expressed at differential levels (Table S3). SA pre-treatment had less significantly correlated proteins including phenylalanine ammonia-lyase (OsPAL1, LOC_Os02g41630), rice ferritin (OsFER2, LOC_Os12g01530), manganese superoxide dismutase 1 (LOC_Os05g25850.1|PACid: 24151755), phosphoenolpyruvate carboxylase family protein (LOC_Os12g08760.1|PACid: 24145205), eukaryotic aspartyl protease family protein (LOC_Os12g39360.1|PACid: 24145239) (Table S3). In the Q + SA vs. control, there were 27 correlated proteins in the same trend, and only rice heat shock protein 70 (LOC_Os03g16860.1|PACid: 24123810) was up-regulated (Table S3). In general, the correlated proteins and genes mostly showed a down-regulation trend.

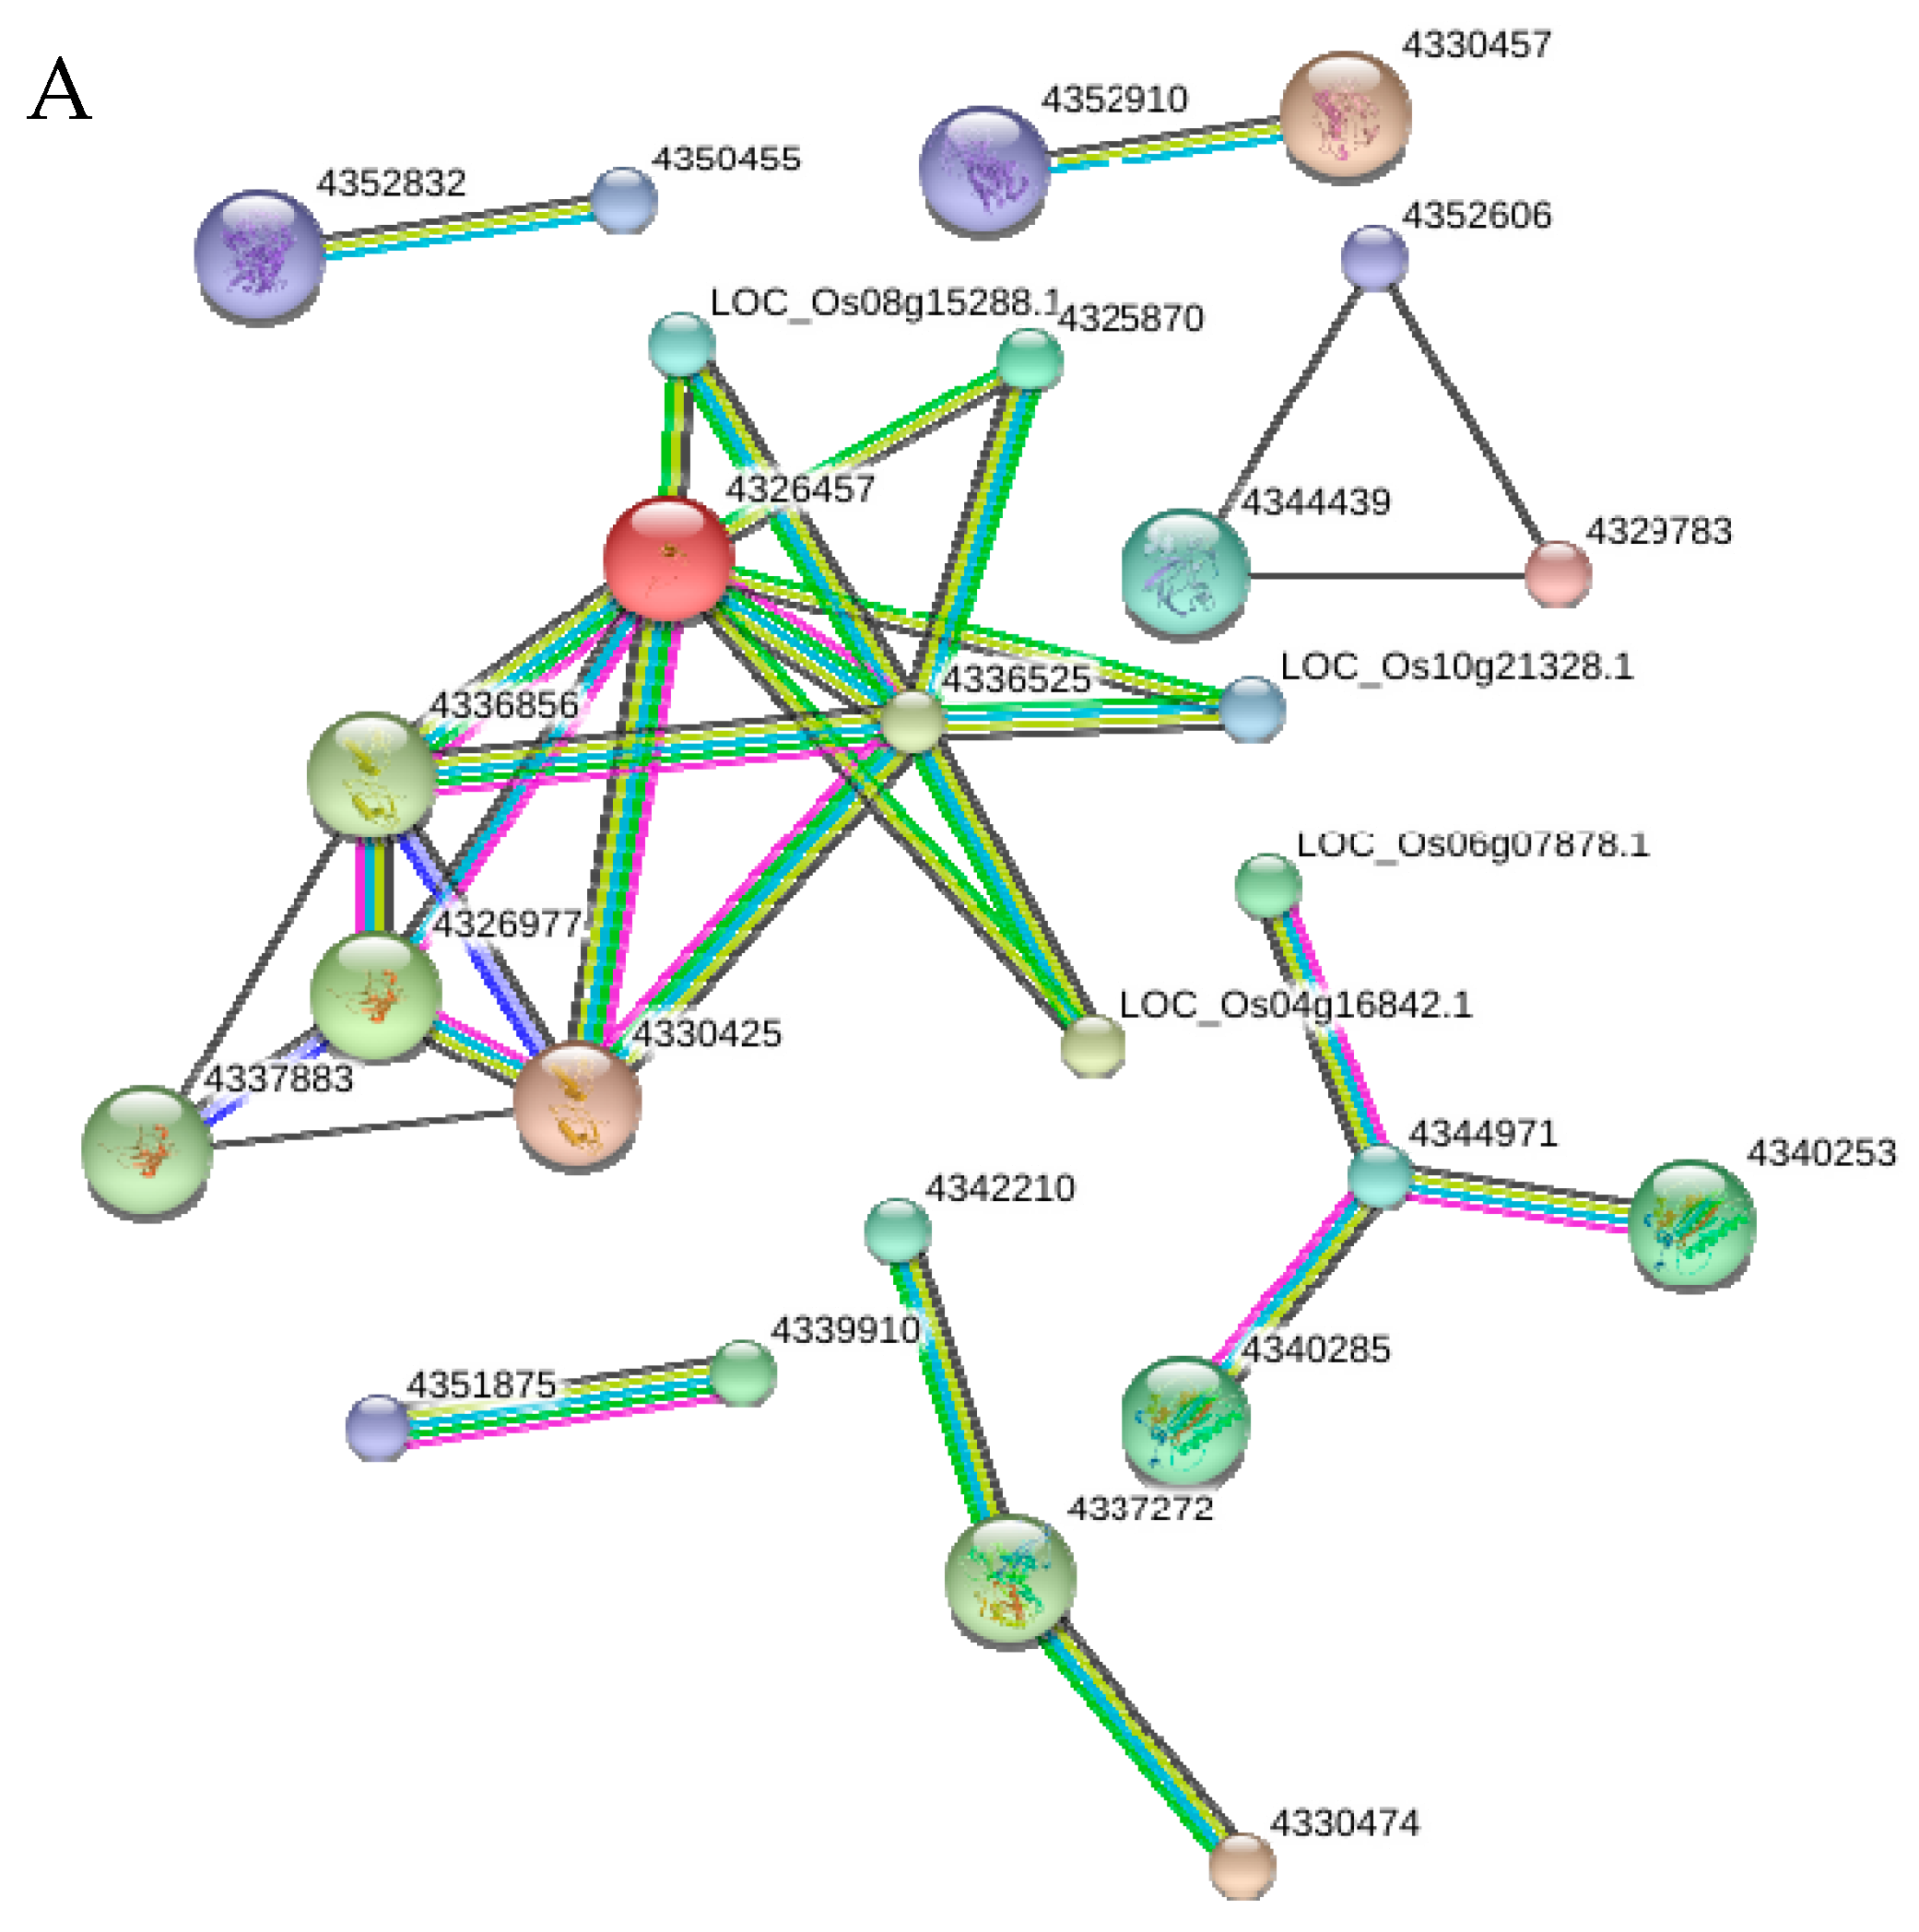
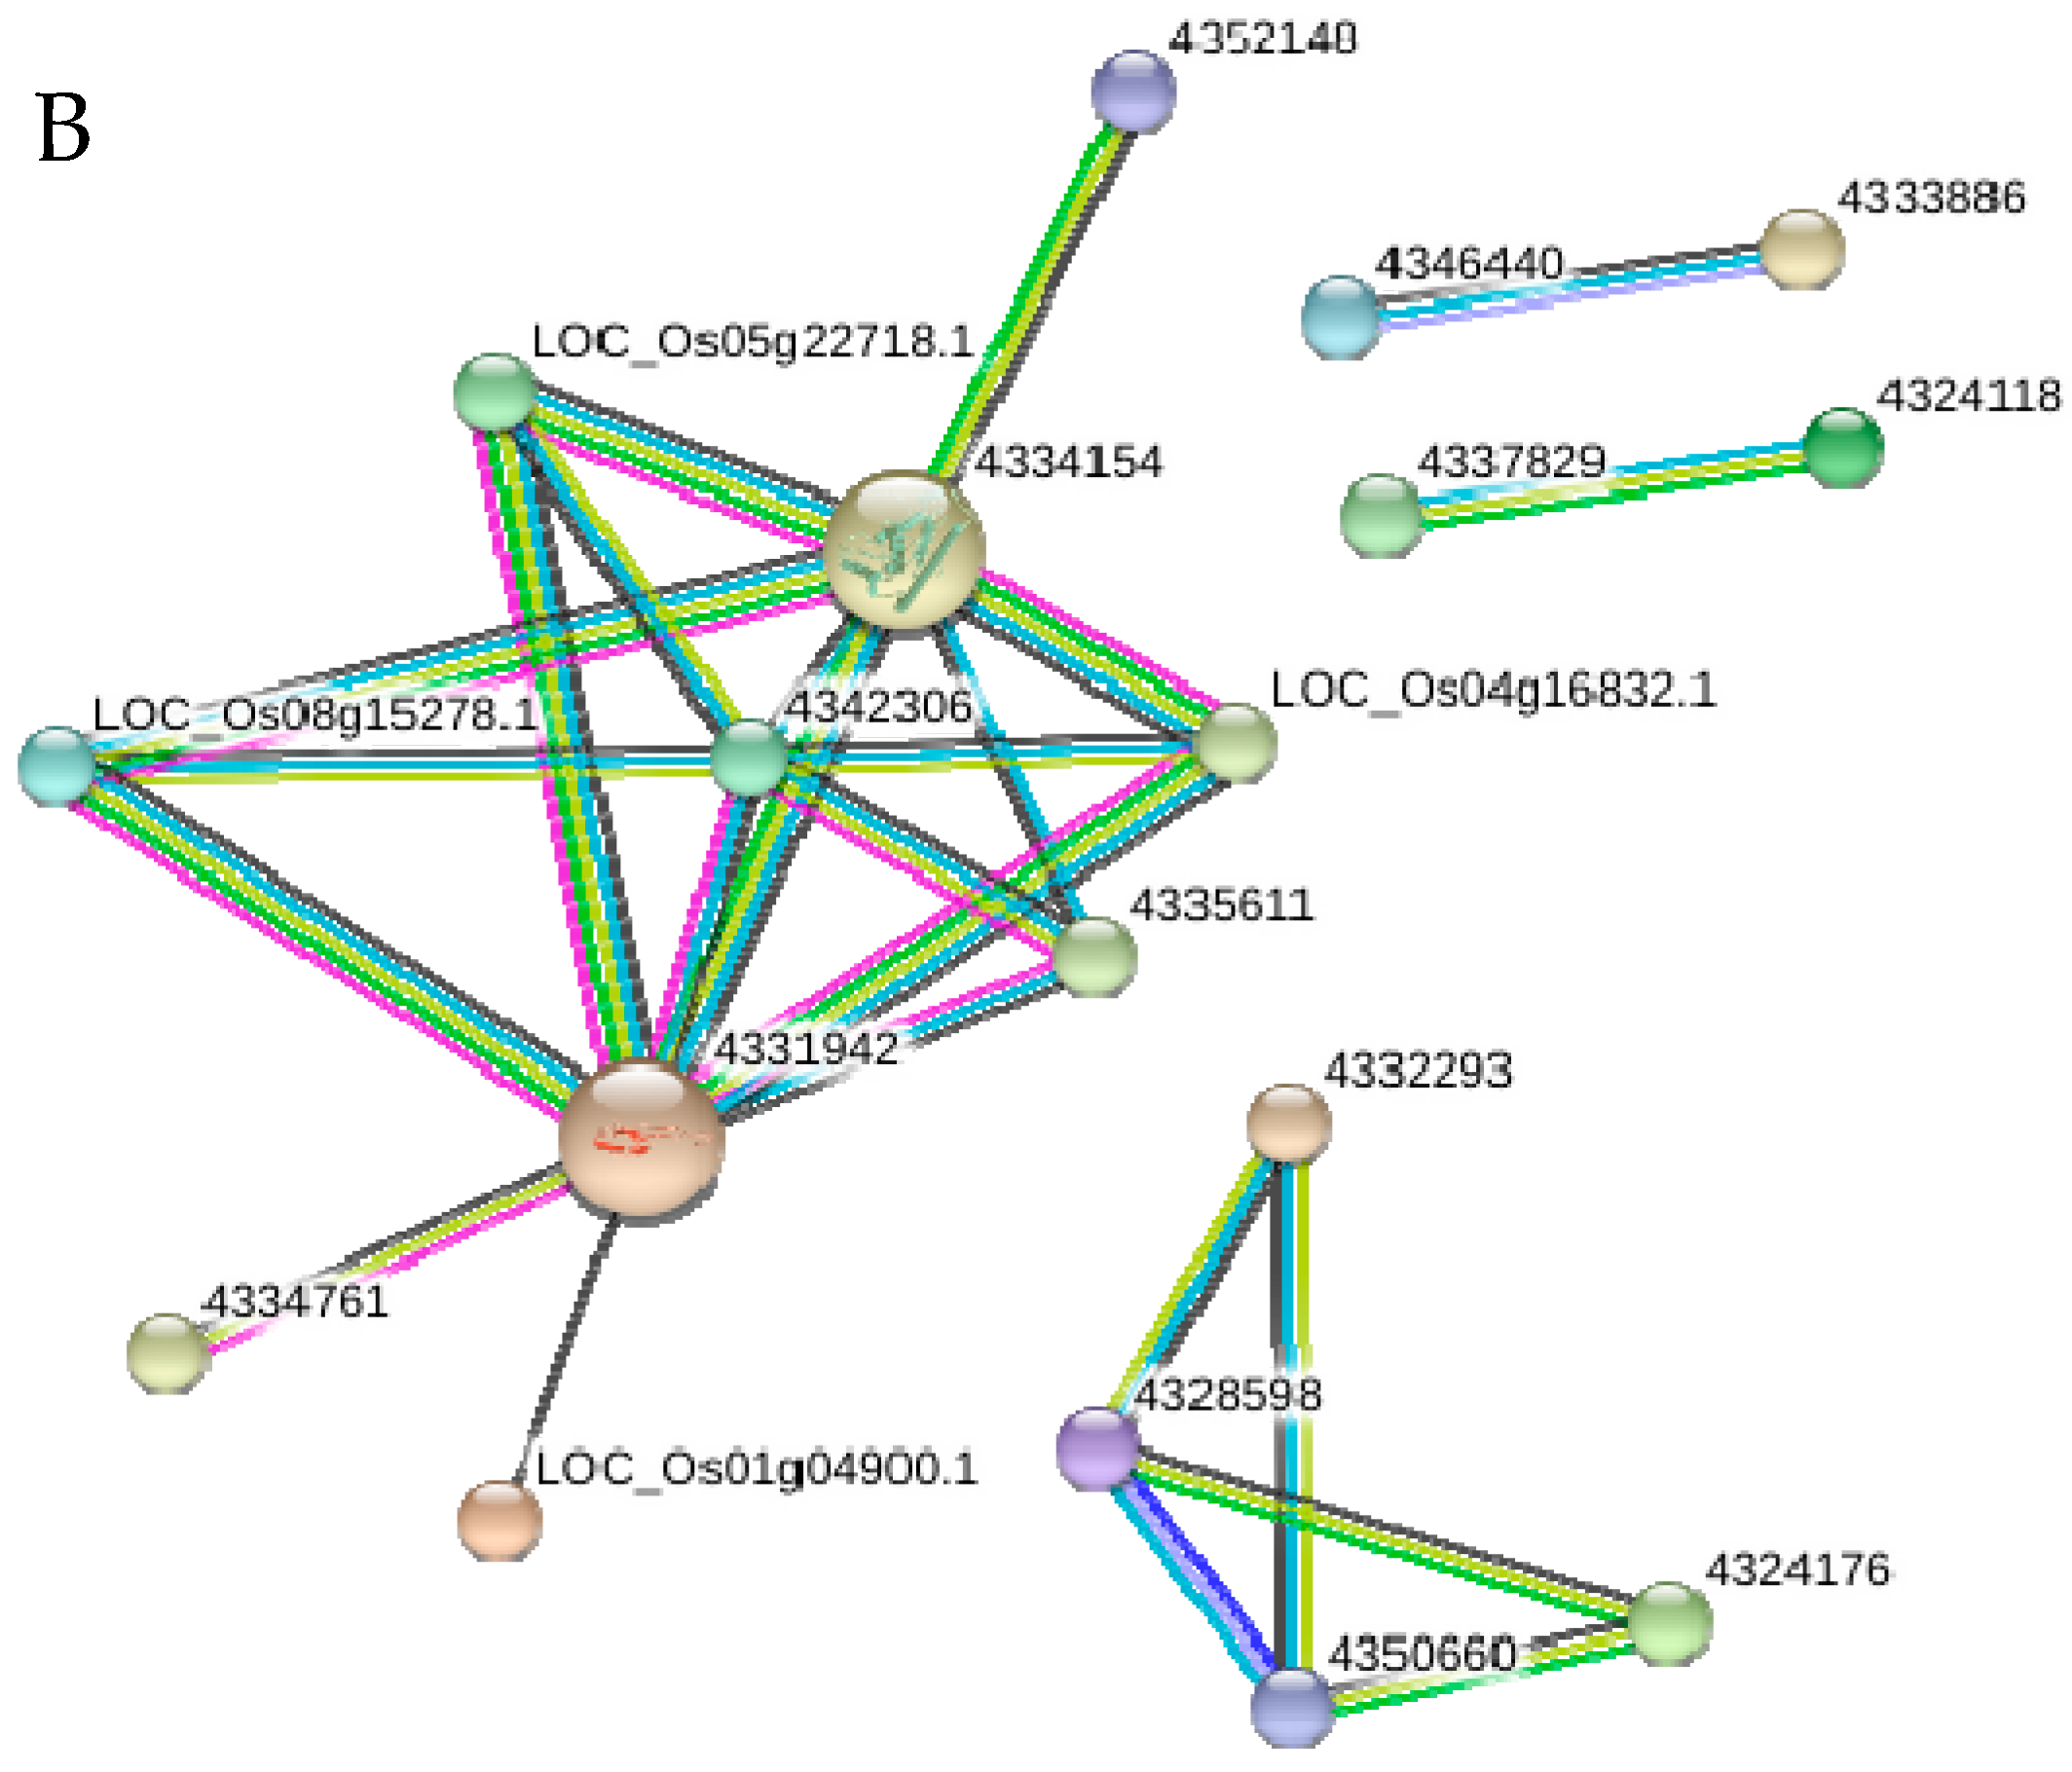
2.10. Functional Networks of the Selected Differentially Regulated Proteins

A Search Tool for the Retrieval of Interacting Genes/Proteins (STRING) database of protein interaction was used to reveal a putative protein association network between herbicide quinclorac-treated alone and SA + quinclorac treatment (Figure 8). The nodes represent the proteins, and the line colors between the nodes indicate protein-protein interaction modes (Figure 8). Under down-regulated proteins, a larger participated protein interaction was found in the ribosomal proteins and RNA polymerase subunits, while other interactions involving photosynthesis and peptidase and glutamine-related proteins had a higher level of co-expression (Figure 8A). Under up-regulated proteins, higher co-expression between ribosomal proteins such as ribosomal protein L13 (LOC_Os03g54890.1), S10/S20 domain containing ribosomal protein (LOC_Os03g10060.1; LOC_Os08g15278.1), eukaryotic translation initiation factor 3 (LOC_Os07g03230.1; LOC_Os04g16832.1), S1 RNA binding domain-containing protein (LOC_Os03g62780.1) and chloroplast ribosomal proteins such as chloroplast 30S ribosomal protein S8 (LOC_Os04g16832.1; LOC_Os05g22718.1) were found. These interacted proteins are involved in tRNA binding and also operated as a transcriptional elongation factor to initiate protein synthesis. In addition to this, the strong co-expression of predicted protein-protein interaction (PPI) revealed strong association between proteins involved in regulation of the citric acid cycle, which includes dehydrogenase (LOC_Os01g46610.1), citrate synthase (LOC_Os02g10070.1), citrate synthase, putative (LOC_Os11g33240.1), and phosphoenolpyruvate carboxykinase (LOC_Os03g15050.1) protein (Figure 8B).

3. Discussion

In our previous experiment, we found that quinclorac considerably arrested rice growth, while SA pre-treatment alleviated quinclorac toxicity effectively [12]. Therefore, to find the changes at transcription/translation levels, we performed RNA-Seq and iTRAQ analyses respectively to investigate the changes in the transcriptome and proteome of rice leaves under quinclorac alone and SA pre-treated quinclorac stressed plants at an early stage (6 h). Under quinclorac stress, there were 2207 DEGs (1427 up-regulated, 780 down-regulated), which were enriched in the metabolic processes of glutathione, porphyrin and chlorophyll, amino acid, ribosome, glyoxylate and carbon fixation. TFs were primarily distributed in AP2-EREBP, MYB, WRKY family. However, SA + Q treatment induced 697 genes and inhibited 382 genes. The pathway analysis of these genes showed that the metabolism of glutathione, phenylpropane, tyrosine, flavonoid, lipids and glyoxylate were significantly enriched pathways. The TF family contained bHLH, MYB, Tify, WRKY and other classes of TF. Proteomic data showed that quinclorac stress induced 49 DEPs, and inhibited the expression of 98 proteins. Pathway enrichment analysis showed that these proteins were related to cysteine and methionine metabolism, glyoxylate and dicarboxylate metabolism and phenylpropanoid biosynthesis. The pre-treatment of SA induced the expression of 56 proteins, while 68 proteins were down-regulated. The most abundant pathways were alanine, aspartate and glutamate metabolism, riboflavin metabolism, arginine biosynthesis, terpenoid backbone biosynthesis, and 2-oxocarboxylic acid metabolism. Correlation analysis between transcriptome and proteomics exhibited that, under quinclorac stress, proteins related to the synthesis of chlorophyll such as Mg-chelatase H subunit, CAT, geranylgeranyl reductase and protochlorophyllide oxidoreductase B were inhibited, whereas SA regulated the expression of phenylalanine ammonia-lyase, rice ferritin and Mn-SOD family proteins.
Glutathione metabolism plays an important role in plant abiotic stress response. Glutathione is a tripeptide with γ-glutamic acid, cysteine and glycine, which is effective in eliminating ROS and exotic hazardous compounds and metabolites [15]. GR, as the only electron donator for using nicotinamide adenine dinucleotide phosphate (NADPH), can catalyze oxidized glutathione (GSSG) to reduced GSH to maintain high GSH/GSSG ratio in the cell [16]. In our study, two important genes (OsGR2 and OsGR3) encoding GR were strongly expressed. Kaminaka et al. [17] and Hong et al. [18] found OsGR2 and mRNA mainly exist in root and callus. Abscisic acid (ABA), low temperature, drought, salinity and other stresses can induce significant expression of OsGR2 [16]. Another gene OsGR3 is primarily expressed in roots at seeding stage and ubiquitously expressed in all tissues except the sheath at heading stage [19]. The results of qPCR demonstrated that the expression of OsGR2 and OsGR3 was higher in SA pre-treatment than in quinclorac alone treatment. Moreover, Dat et al. [20] also demonstrated that SA can elevate the activity of GR in Brassica juncea.
Endogenous aldehyde is a common metabolic intermediate produced from a number of pathways, including the metabolism of amino acids, protein, lipids and carbohydrates [21], meanwhile xenobiotics are important sources of aldehydes production [22]. ALDH is also a common and important detoxifying enzyme in plant tissues, which is responsible for eliminating endogenous and exogenous aldehydes [23]. At present, a number of studies have revealed that ALDH genes can be induced under salinity and drought stress, suggesting possible roles in improving abiotic stress tolerance [24,25]. Under flooding stress, OsALDH2B5 is induced to stimulate the synthesis of ABA [26]. Further, Wu et al. [27] found that OsALDH7 was induced by biotic or abiotic factors such as ultraviolet, blast and mechanical injury in rice leaves. Exogenous plant growth regulators treatment, such as SA, ABA and methyl ester of jasmonic acid (JA) induced the expression of OsALDH7. OsALDH2B5 is located in the mitochondrion and OsALDH7 is located in the cytoplasm [28,29]. In our present study, three ALDH genes (OsALDH2B5, OsALDH6B2, OsALDH7) were significantly expressed under quinclorac stress, whereas exogenous SA pre-treatment further increased the expression of OsALDH2B5 and OsALDH7. The proteomics data also showed that quinclorac induced glycolate oxidase (GLO), which is a crucial enzyme in photorespiration and catalyzes the oxidation of glycolate to glyoxylate, with an equimolar amount of H2O2 production [30]. Noctor et al. [31] found nearly 70% H2O2 content in C3 plants coming from photorespiration via GLO catalysis. Moreover, GLO has been observed in response to abiotic or biotic stresses, such as drought and pathogens [32,33]. In our study, the GLO was significantly induced under quinclorac stress, leading to the overproduction of H2O2 that may inhibit the activity of CAT. Zhang et al. [34] also demonstrated that GLO physically interacts with CAT in rice leaves, and the interaction can be down-regulated by SA. OsSCP46 is a serine carboxypeptidase gene and can be induced by ABA and inhibited by brassinolide [35]. Quinclorac improved OsSCP46 gene expression, which may contribute to overproduction of ABA. 4-Coumarate: coenzyme a ligase is a vital enzyme in the phenylpropanoid metabolic pathways for monolignol and flavonoid biosynthesis. Rice genome has five Os4CL genes without tissue specific expression but with apparent differences in expression levels. The rank in order of transcript abundance was as Os4CL3 > Os4CL5 > Os4CL1 > Os4CL4 > Os4CL2 [36]. SA may influence Os4CL gene expressions to adjust the synthesis of lignin and flavonoid. OsBIABP1 gene is involved in the regulation of AMP-binding protein in rice defense system. Some small molecules such as SA and JA can respectively induce the expression of OsBIABP1 to regulate the defense signaling pathways related to SA and JA/ethylene, respectively [37]. The treatments of quinclorac and SA both enhanced OsBIABP1 gene expression, which suggests that plant responds to different types of stress factors by reprogramming the expression of similar signaling pathways.
TFs almost participate in all of the biochemical reactions and processes. AP2-EREBP TFs are known to be unique in plants and have more than 180 members in rice. According to a number of AP2-EREBP structural domains, this family can be divided into an EREBP subfamily containing one domain and AP2 subfamily containing two domains. The EREBP subfamily includes dehydration responsive element binding (DREB), ethylene responsive element binding factors (ERF) and other subfamilies. Most EREBP subfamily TFs take part in plant stress response [38,39]. Our results showed that OsDREB2A, OsERF922, OsEREBP1 were induced to express under quinclorac stress. Over-expressed OsDREB2A in transgenic soybean can improve salinity stress tolerance [40]. Cui et al. [41] also observed the overexpression of OsDREB2A under drought and salinity stress. ABA and salinity application, as well as blast fungus, strongly induce the expression of OsERF922. Transgenic rice with OsERF922 overexpression down-regulated the expression of defense genes and decreased tolerance to salinity with an increased Na+/K+ ratio [42]. When OsEREBP1 is overexpressed, JA and ABA synthesis and signal pathways are activated to enhance drought and flooding tolerance [43]. NAC TFs, refer to new largest TF family in plants in recent years and they play important roles in the regulation of plant growth and development and participate in defense reactions of several adverse abiotic stresses including drought, high salt, low temperature [44]. Our results showed that OsNAC10, ONAC131 were highly induced by quinclorac application. Jeong et al. [45] found that over-expressed OsNAC10 significantly strengthened stress tolerance. In our experiment, we also found that quinclorac induced bHLH family gene OsIRO2, which has been found to be a key regulatory gene for Fe acquisition. Overexpression of OsIRO2 can increase secretion of mugineic acid family phytosiderophores without any adverse effect on the plant [46,47]. TFs from the NAC family had inconsistent changes with SA pre-treatment, so OsNAC095 was induced while OsNAC10 and ONAC131 were down-regulated. Although OsNAC10 and ONAC131 can be induced, this varies depending on time [48]. Huang et al. [49] found drought, salt, heat and ABA (except cold) enhanced the expression of OsNAC095. TFs from WRKY superfamily also take part in several physiological and resistance reactions [50,51]. Researchers have identified 109 WRKY TFs in rice [52]. OsWRKY45 has two allelic genes (OsWRKY45-1, OsWRKY45-2), these two genes also have different transcriptional responses to ABA and salt stress [53]. OsWRKY45 was expressed under exogenous SA pre-treatment in our study, consistent with the results of Ryu et al. [54]. The overexpression of OsWRKY76 has been documented to suppress the induction of gene expressions involved in disease resistance and phytoalexins synthesis, leading to the increased expression of abiotic stress-associated genes such as peroxidase and lipid metabolism genes [55].
Transcriptome and proteome constantly adjust to each other at the same time when plants are under environmental stresses [56]. The correlation analysis between transcriptome and proteome showed that the majority of proteins correlated under quinclorac stress were inhibited and OsChlH, OsCATA, LYL1, OsPORB/FGL were significantly down-regulated (Table S3). OsChlH encodes the Mg2+-chelatase H subunit, which is involved in chlorophyll biosynthesis [57,58]. LYL1 is a light responsive gene participating in the final step of chlorophyll biosynthesis and prevents the rice from lipid peroxidation and reactive oxygen damage [59]. Yang et al. [60] also found OsPORB/FGL mutant had phenotypically pale-green leaves with significantly decreased chlorophyll (a and b) and carotenoid contents. In addition to this, we observed that quinclorac dramatically repressed the synthesis of chlorophyll (Chl), which may be the reason of stunt growth of rice plants. In the porphyrin and chlorophyll metabolism pathway, 21 DEGs were inhibited, while only six DEGs were induced. Protoporphyrin IX, as the precursor of Chl, is synthesized by 5-aminolevulinate acid [61]. This early enzymatic reaction was suppressed by quinclorac so that the subsequent catalyzed product protoheme was simultaneously restrained. In the last step of Chl biosynthesis, prenylation of chlorophyllide was also affected, which is believed to be catalyzed by Chl synthase with phytyl diphosphate or geranygeranyl diphosphate [62,63]. The final step in converting chlorophyllide to Chl a or Chl b is taken place in the thylakoid membrane, which play important roles in the stabilization of the thylakoid membranes [64]. Recently, Wang et al. [12] observed that quinclorac application damage the thylakoid membranes, which may be due to the reduction in the biosynthesis of Chl in treated rice plants. However, pre-treatment of SA under quinclorac stress prevented the thylakoid membrane disruption by accelerating Chl production and scavenging ROS, indicating a key role in SA-induced oxidative stress tolerance in rice plants [12].

4. Materials and Methods

4.1. Plant Materials

The seeds of quinclorac tolerant japonica variety (Oryza sativa L. cv. Xiushui 134), were obtained from the College of Agriculture and Biotechnology, Zhejiang University, Hangzhou China [12]. It is widely cultivated in southeast China. Seeds were surface sterilized in 0.1% NaClO for 15 min, then rinsed and soaked with distilled water for another 20 min. Seeds were sowed in plastic germination boxes (18 cm × 12 cm × 10 cm) with moistened filter paper. Under dark conditions for two days, germinated seedlings were selected and cultured in a growth chamber with day/night temperatures of 25/20 °C, a 14 h photoperiod, irradiance of 300 µmol m−2 s−1 and relative humidity of 70%–80%. The nutrient solution was replaced after every five days with Hoagland solution. Samples were divided into three groups including the control group, the group treated with quinclorac, and the group pre-treated with SA under quinclorac stress. According to our previous findings [12], the quinclorac herbicide (0.1 mM) was applied in a solution at four-leaf stage. SA at 10 mg/L was applied in a solution, two days before quinclorac treatment. The treatment concentrations were based on pre-experimental studies (data not shown). After 6 h herbicide exposure, leaf tissues were harvested and frozen in liquid nitrogen for RNA extraction. All materials were stored at −80 °C until further processing.

4.2. RNA Isolation and Library Preparation for Transcriptome Analysis

RNA was first extracted and mixed with DNase I to avoid DNA contamination Gill et al. [65]. The oligo (dT) magnetic beads were used to enrich mRNA, and cDNA was synthesized by the fragments of mRNA. After purification with magnetic beads, end reparation and 3′-end single nucleotide A (adenine) addition, sequencing adaptors were ligated to the fragments. Finally, the fragments were amplified by PCR for library construction. The sample library was used for quality and quantity test by Agilent 2100 Bioanaylzer (Agilent, Santa Clara, CA, USA) and ABI StepOnePlus Real-Time PCR System (Applied Biosystems, Foster City, CA, USA). After passing the quality control (QC), the library products were ready for sequencing via Illumina HiSeqTM2000 (Illumina, San Diego, CA, USA).

4.3. Analysis of RNA-Sequencing Data

Primary sequencing data was produced by Illumina HiSeqTM 2000, and raw reads were filtered into clean reads. Because raw data may contain low quality reads, adapters and other useless reads, to guarantee the reliability of analysis, the reads containing adapter, poly-N and low quality were removed from the raw data to obtain clean reads. Bowtie2 [66] and BWA [67] were used to map clean reads to reference gene and reference genome, respectively. The alignment with gene/genome reference included genome alignment visualization, map rate statistics, distribution of reads on gene, sequencing saturation and distribution of reads and genes on genome. With good secondary QC, further gene expression analyses were proceeded. RNA-Seq by Expectation-Maximization (RSEM) [68] was applied to use the modeling of the paired-end, the length of reads, fragment length distributions and quality values to distinguish which transcripts were isoforms of the same gene. The fragments per kilobase of transcript per million mapped fragments (FPKM) method [69] can eliminate the influences of gene expression caused by the length of gene or the size of sequencing. By this method, calculated quantification of gene expression level was used to compare the DEG expression level between different samples. NOISeq method [70] was used to screen DEGs between two groups. DEGs were screened according to the following default criteria: Fold change ≥2 and diverge probability ≥0.8.

4.4. qRT-PCR Analysis

Total RNA of three different groups were extracted from frozen leaf samples with RNAiso Plus (TaKaRa, Japan). Two micrograms total RNA was subjected to reverse transcription using TaKaRa PrimeScript™ RT reagent Kit with gDNA Eraser (Perfect for Real Time). Real-time PCR was carried out by using SYBRs Premix Ex Taq II (Tli RNaseH Plus) (TaKaRa) in CFX96TM Real-Time System (BIO-RAD, USA). All primers used for qRT-PCR are listed in Table S4.

4.5. Protein Extraction

Total leaf proteins were extracted from the same samples for RNA-Sequencing analysis according to Yang et al. [71]. Leaf samples were ground fully in liquid nitrogen and homogenized with 0.1 g of PVPP, 10 mL of Tris-phenol and 1 mL of phenol extraction buffer (with 2% Beta-mercaptoethanol and 1 mM PMSF) at 4 °C. After vortex for 10 s every 5 min with 3 repeats and centrifugation at 6,000 rpm for 20 min, the phenolic phase was collected and precipitated overnight with five volumes of 100 mM ammonium acetate in methanol at −20 °C. The pellet was collected after centrifugation (20 min, 6000 rpm, 4 °C) and suspended in 10 mL of methanol, which was repeated in 10 mL of methanol, 10 mL of acetone and 1 mL of acetone again, respectively. The pellet was collected after centrifugation at 12,000 rpm for 20 min, air-dried and suspended in 150 µL of radioimmunoprecipitation assay (RIPA) lysis buffer containing 0.1% (v/v) TritonX-100, 1% (w/v) sodium deoxycholate, 0.1% (w/v) SDS, 150 mM NaCl and 50 mM Tris-HCl (pH 8.0).

4.6. Trypsin Digestion and iTRAQ Labeling

Proteins were digested with trypsin (Promega, Madison, WI, USA) at 37 °C at a ratio of 1:50 (enzyme/substrate) overnight. The iTRAQ labeling was performed according to the manufacturer’s protocol (Applied Biosystems, Sciex, Foster City, CA, USA). All labeled peptides were pooled together.

4.7. High-pH Reversed-Phase Chromatography

The Ultimate3000 HPLC system (Dionex, Sunnyvale, CA, USA) equipped with a 2.00-mm-inner diameter × 150-mm-long Gemini-NX 3u C18110A columns (Phenomenex, Torrance, CA, USA) was used for High-pH fractionation. Peptides were loaded onto the column and washed isocratically at 95% eluent A (20 mM HCOONH4, 2 M NaOH) (pH 10). Peptide fractionation was performed by using a linear binary gradient from 15% to 50% B (20 mM HCOONH4, 2 M NaOH, 80% acetonitrile ACN) (pH 10) at 0.2 mL/min over 45 min. Finally, the column was washed at 90% B for 10 min and returned to 95% A for 10 min. The UV detector was set at 214/280 nm, and fractions were collected every 1 min. In total, 10 fractions were pooled and dried by vacuum centrifuge for subsequent nano-reversed phase liquid chromatography (nano-LC) fractionation.

4.8. RPLC-MS/MS Analysis

Each fraction was suspended in loading buffer (0.1% FA, 2% ACN) and separated using an Ultimate 3000 nano-LC system equipped with a C18 reverse phase column (100-μm inner diameter, 10-cm long, 3-μm resin from Michrom Bioresources, Auburn, CA, USA). The peptides were separated using the following parameters: (1) mobile phase A: 0.1% FA, 5%ACN, dissolved in water; (2) mobile phase B: 0.1% FA, 95% ACN; (3) flow rate: 300 nL/min; (4) gradient: B-phase increased from 5% to 40%, 70 min. Then, the eluent was transferred to Triple TOF 6600 containing multichannel TDC detector with four-anode channel detect ion (AB SCIEX, Concord, ON, Canada). The machine parameters were as follows: 2.5 kv ion source spray voltage, 30 psi nitrogen curtain gas, 15 psi nebulizer gas, 150 °C interface heater temperature. The mass range was about 400–1250 m/z in high resolution mode (>30,000) with 250 ms accumulation time per spectrum.

4.9. Proteomic Data Analysis

The primary data files (formatted as wiff and wiff. scan) were converted to MGF files using MSConvert and the MGF files were searched. Protein identification was performed by using Mascot search engine (Matrix Science, London, UK; version 2.3.02) against database. The database we selected was Osativa_204 (49061 sequences) with the link http://genome.jgi.doe.gov/pages/dynamicOrganismDownload.jsf?organism = PhytozomeV9.
For protein identification, a mass tolerance of 0.05 Da (50 ppm) was permitted for intact peptide masses and 0.1 Da for fragmented ions, with allowance for one missed cleavages in the trypsin digests. Gln- > pyro-Glu (N-term Q), Oxidation (M), Deamidated (NQ) as the potential variable modifications, and Carbamidomethyl (C), iTRAQ8plex (N-term), iTRAQ8plex (K) as fixed modifications. The charge states of peptides were set to +2 and +3. Specifically, an automatic decoy database search was performed in Mascot by choosing the decoy checkbox in which a random sequence of database is generated and tested for raw spectra as well as the real database. To reduce the probability of false peptide identification, only peptides with significance scores (≥20) at the 99% confidence interval by a Mascot probability analysis greater than “identity” were counted as identified. At least one unique peptide was involved in each confident protein identification.
The peptide data were analyzed using Protein Pilot Software 4.0 (AB SCIEX, Redwood City, CA, USA). Data with a false discovery rate (FDR) of less than 1% were used for the Unused ProtScore measurement. Peptides with scores of over 1.3 (confidence over 95%) were chosen. For quantitative changes, a 2-fold cutoff was set to determine up-regulated and down-regulated. The DEPs were then imported to the clusters of orthologous groups of proteins (COG) database (http://0-www-ncbi-nlm-nih-gov.brum.beds.ac.uk/COG) for phylogenetic classification and the KEGG database (http://www.genome.jp/kegg/pathway.html) for metabolic pathway analysis.

4.10. Correlation Analysis between Transcriptome and Proteome

According to RNA-Sequencing data and proteome analysis, DEGs were identified with the default criteria (Foldchange ≥ 2 and diverge probability ≥ 0.8) by NOISeq method, while DEPs were filtered with the standard (Foldchange ≥ 1.2 and p value < 0.05) by protein abundance level. When one protein is expressed in transcriptome level, it is regarded as correlated.

4.11. Protein-Protein Interaction Analysis

All identified up-regulated/down-regulated, protein-protein interaction (PPI) was searched against the STRING database (version 10.0) for protein-protein interactions. This database contains interaction from previously published interaction studies as well as genomic analysis established in gene neighborhood, domain fusion and phylogenetic profiling methods. PPIs belong to uploaded data set was selected, whereas confidence score of ≥0.9 was selected to minimize false positive/negative interactions. Stronger associations are represented by thicker lines.

5. Conclusions

In summary, we have explored and analyzed the transcriptome and proteomics of Oryza sativa ssp. japonica to identify and annotate transcripts and proteins associated with quinclorac toxicity and its subsequent alleviation by the exogenous application of SA. Our study suggests that multiple pathways are involved in quinclorac-induced toxicity, which resulted in chlorophyll degradation and the accumulation of endogenous aldehyde, glycolate and other reactive oxygen molecules such as H2O2 to affect the redox homeostasis. Genes and proteins involved in the crucial steps of chlorophyll synthesis pathways were significantly repressed under quinclorac stress. However, pre-treatment of SA not only modulated plant defense systems but also triggered detoxifying enzymes such as GSH, ALDH, GLO to degrade herbicide or eliminate xenobiotics. Additionally, SA application maintained the chlorophyll content in rice leaves by preventing chlorophyll breakdown and simultaneously accelerating its de novo synthesis. These findings will contribute to an increased understanding of the SA-mediated stress tolerance in rice and also provide experimental data for the development of herbicide resistance in rice breeding programs.

Supplementary Materials

Supplementary materials can be found at www.mdpi.com/1422-0067/18/9/1975/s1.

Acknowledgments

This study was supported by the Special Fund for Agro-Scientific Research in the Public Interest (201303022), the 111 Project (B17039), National Natural Science Foundation of China (31371581 and 31570434), and the Science and Technology Department of Zhejiang Province (2016C02050-6).

Author contributions

Jian Wang, Weijun Zhou and Faisal Islam conceived and designed the experiments; Jian Wang, Faisal Islam, Lan Li and Meijuan Long performed the experiments; Jian Wang, Meijuan Long, Chong Yang and Basharat Ali analyzed the data; Jian Wang, Faisal Islam, Xiaoli Jin, Bizeng Mao and Weijun Zhou contributed reagents/materials/analysis tools; Jian Wang, Faisal Islam, Bizeng Mao and Weijun Zhou wrote and revised the paper.

Conflicts of Interest

The authors declare no conflict of interest.

References

  1. National Bureau of Statistics of China. China Statistical Yearbook 2016. China Statistics Press. Available online: http://www.stats.gov.cn/tjsj/ndsj/2016/indexeh.htm (accessed on 7 September 2017).
  2. Chauhan, B.S.; Johnson, D.E. Opportunities to improve cultural approaches to manage weeds in direct-seeded rice. In Proceedings of the 17th Australasian Weeds Conference, Christchurch, New Zealand, 26–30 September 2010; New Zealand Plant Protection Society: Christchurch, New Zealand, 2010; pp. 40–43. [Google Scholar]
  3. Grossmann, K. Quinclorac belongs to a new class of highly selective auxin herbicides. Weed Sci. 1998, 46, 707–716. [Google Scholar]
  4. Li, G.; Xu, M.F.; Chen, L.P.; Cai, L.M.; Bai, L.Y.; Wu, C.X. A novel EcGH3 gene with a different expression pattern in quinclorac-resistant and susceptible barnyardgrass (Echinochloa crus-galli). Plant Gene 2016, 5, 65–70. [Google Scholar] [CrossRef]
  5. Hoffmann, O.L. Herbicide Antidotes: From Concept to Practice; National Meeting of the American Chemical Society: New Orleans, LA, USA, 1978; pp. 1–13. [Google Scholar]
  6. Chen, S.; Harmon, A.C. Advances in plant proteomics. Proteomics 2006, 6, 5504–5516. [Google Scholar] [CrossRef] [PubMed]
  7. Ekblom, R.; Galindo, J. Applications of next generation sequencing in molecular ecology of non-model organisms. Heredity 2011, 107, 1–15. [Google Scholar] [CrossRef] [PubMed]
  8. Yang, S.S.; Tu, Z.J.; Cheung, F.; Xu, W.W.; Lamb, J.F.; Jung, H.-J.G.; Vance, C.P.; Gronwald, J.W. Using RNA-Seq for gene identification, polymorphism detection and transcript profiling in two alfalfa genotypes with divergent cell wall composition in stems. BMC Genom. 2011. [Google Scholar] [CrossRef] [PubMed]
  9. Haas, B.J.; Zody, M.C. Advancing RNA-seq analysis. Nat. Biotechnol. 2010, 28, 421–423. [Google Scholar] [CrossRef] [PubMed]
  10. Rakwal, R.; Agrawal, G.K. Rice proteomics: Current status and future perspectives. Electrophoresis 2003, 24, 3378–3389. [Google Scholar] [CrossRef] [PubMed]
  11. Ahsan, N.; Lee, D.; Alam, I.; Kim, P.J.; Lee, J.J.; Ahn, Y.O.; Kwak, S.S.; Lee, I.J.; Bahk, J.D.; Kang, K.Y.; et al. Comparative proteomic study of arsenic-induced differentially expressed proteins in rice roots reveals glutathione plays a central role during As stress. Proteomics 2009, 8, 3561–3576. [Google Scholar] [CrossRef] [PubMed]
  12. Wang, J.; Lv, M.T.; Islam, F.; Gill, R.A.; Yang, C.; Ali, B.; Yan, G.J.; Zhou, W.J. Salicylic acid mediates antioxidant defense system and ABA pathway related gene expression in Oryza sativa against quinclorac toxicity. Ecotoxicol. Environ. Saf. 2016, 133, 146–156. [Google Scholar] [CrossRef] [PubMed]
  13. Yang, C.; Hu, L.Y.; Ali, B.; Islam, F.; Bai, Q.J.; Yun, X.P.; Yoneyama, K.; Zhou, W.J. Seed treatment with salicylic acid invokes defense mechanism of Helianthus annuus against Orobanche cumana. Ann. Appl. Biol. 2016, 169, 408–422. [Google Scholar] [CrossRef]
  14. Gill, R.A.; Zhang, N.; Ali, B.; Farooq, M.A.; Xu, J.X.; Gill, M.B.; Mao, B.Z.; Zhou, W.J. Role of exogenous salicylic acid in regulating physio-morphic and molecular changes under chromium toxicity in black- and yellow-seeded Brassica napus L. Environ. Sci. Pollut. Res. 2016, 23, 20483–20496. [Google Scholar] [CrossRef] [PubMed]
  15. Islam, F.; Ali, S.; Farooq, M.A.; Wang, J.; Gill, R.A.; Zhu, J.; Zhou, W. Butachlor-induced alterations in ultrastructure, antioxidant, and stress-responsive gene regulations in rice cultivars. Clean Water Air Soil 2017. [Google Scholar] [CrossRef]
  16. Islam, F.; Farooq, M.A.; Gill, R.A.; Wang, J.; Chon, Y.; Ali, B.; Wang, G.-X.I.; Zhou, W.J. 2,4-D attenuates salinity-induced toxicity by mediating anatomical changes, antioxidant capacity and cation transporters in the roots of rice cultivars. Sci. Rep. 2017. [Google Scholar] [CrossRef] [PubMed]
  17. Kaminaka, H.; Morita, S.; Nakajima, M.; Masumura, T.; Tanaka, K. Gene cloning and expression of cytosolic glutathione reductase in rice (Oryza sativa L.). Plant Cell Physiol. 1998, 39, 1269–1280. [Google Scholar] [CrossRef] [PubMed]
  18. Hong, C.Y.; Chao, Y.Y.; Yang, M.Y.; Cheng, S.Y.; Cho, S.C.; Kao, C.H. NaCl-induced expression of glutathione reductase in roots of rice (Oryza sativa L.) seedlings is mediated through hydrogen peroxide but not abscisic acid. Plant Soil 2009, 320, 103–115. [Google Scholar] [CrossRef]
  19. Wu, T.M.; Lin, W.R.; Kao, C.H.; Hong, C.Y. Gene knockout of glutathione reductase 3 results in increased sensitivity to salt stress in rice. Plant Mol. Biol. 2015, 87, 555–564. [Google Scholar] [CrossRef] [PubMed]
  20. Dat, J.F.; Foyer, C.H.; Scott, I.M. Changes in salicylic acid and antioxidants during induced thermotolerance in mustard seedlings. Plant Physiol. 1998, 118, 1455–1461. [Google Scholar] [CrossRef] [PubMed]
  21. Vasiliou, V.; Pappa, A.; Petersen, D.R. Role of aldehyde dehydrogenases in endogenous and xenobiotic metabolism. Chem. Biol. Interact. 2000, 129, 1–19. [Google Scholar] [CrossRef]
  22. Lindahl, R. Aldehyde dehydrogenases and their role in carcinogenesis. Crit. Rev. Biochem. Mol. 1992, 27, 283–335. [Google Scholar] [CrossRef] [PubMed]
  23. Yoshida, A.; Rzhetsky, A.; Hsu, L.C.; Chang, C. Human aldehyde dehydrogenase gene family. Eur. J. Biochem. 1998, 251, 549–557. [Google Scholar] [CrossRef] [PubMed]
  24. Kotchoni, S.O.; Bartels, D. Water stress induces the up-regulation of a specific set of genes in plants: Aldehyde dehydrogenase as an example. Bulg. J. Plant Physiol. 2003, 2003, 37–51. [Google Scholar]
  25. Kirch, H.H.; Bartels, D.; Wei, Y.; Schnable, P.S.; Wood, A.J. The ALDH gene superfamily of Arabidopsis. Trends Plant Sci. 2004, 9, 371–377. [Google Scholar] [CrossRef] [PubMed]
  26. Tsuji, H.; Meguro, N.; Suzuki, Y.; Tsutsumi, N.; Hirai, A.; Nakazono, M. Induction of mitochondrial aldehyde dehydrogenase by submergence facilitates oxidation of acetaldehyde during reaeration in rice. FEBS Lett. 2003, 546, 369–373. [Google Scholar] [CrossRef]
  27. Wu, C.; Su, S.; Peng, Y. Molecular cloning and differential expression of an aldehyde dehydrogenase gene in rice leaves in response to infection by blast fungus. Biologia 2007, 62, 523–528. [Google Scholar] [CrossRef]
  28. Shin, J.H.; Kim, S.R.; An, G. Rice aldehyde dehydrogenase7 is needed for seed maturation and viability. Plant Physiol. 2009, 149, 905–915. [Google Scholar] [CrossRef] [PubMed]
  29. Gao, C.; Han, B. Evolutionary and expression study of the aldehyde dehydrogenase (ALDH) gene superfamily in rice (Oryza sativa). Gene 2009, 431, 86–94. [Google Scholar] [CrossRef] [PubMed]
  30. Foyer, C.H.; Bloom, A.J.; Queval, G.; Noctor, G. Photorespiratory metabolism: Genes, mutants, energetics, and redox signaling. Annu. Rev. Plant Biol. 2009, 60, 455–484. [Google Scholar] [CrossRef] [PubMed]
  31. Noctor, G.; Veljovic, J.S.; Driscoll, S.; Novitskaya, L.; Foyer, C.H. Drought and oxidative load in the leaves of C3 plants: A predominant role for photorespiration. Ann. Bot. 2002, 89, 841–850. [Google Scholar] [CrossRef] [PubMed]
  32. Rizhsky, L.; Liang, H.; Mittler, R. The combined effect of drought stress and heat shock on gene expression in tobacco. Plant Physiol. 2002, 130, 1143–1151. [Google Scholar] [CrossRef] [PubMed]
  33. Taler, D.; Galperin, M.; Benjamin, I.; Cohen, Y.; Kenigsbuch, D. Plant eR genes that encode photorespiratory enzymes confer resistance against disease. Plant Cell 2004, 16, 172–184. [Google Scholar] [CrossRef] [PubMed]
  34. Zhang, Z.; Xu, Y.; Xie, Z.; Li, X.; He, Z.H.; Peng, X.X. Association–dissociation of glycolate oxidase with catalase in rice: A potential switch to modulate intracellular H2O2 levels. Mol. Plant 2016, 9, 737–748. [Google Scholar] [CrossRef] [PubMed]
  35. Li, Z.; Tang, L.; Qiu, J.; Zhang, W.; Wang, Y.; Tong, X.; Wei, X.; Hou, Y.; Zhang, J. Serine carboxypeptidase 46 regulates grain filling and seed germination in rice (Oryza sativa L.). PLoS ONE 2016. [Google Scholar] [CrossRef] [PubMed]
  36. Gui, J.; Shen, J.; Li, L. Functional characterization of evolutionarily divergent 4-coumarate: Coenzyme A ligases in rice. Plant Physiol. 2011, 157, 574–586. [Google Scholar] [CrossRef] [PubMed]
  37. Zhang, X.; Yu, X.; Zhang, H.; Song, F.M. Molecular characterization of a defense-related AMP-binding protein gene, OsBIABP1, from rice. J. Zhejiang Univ. Sci. B 2009, 10, 731–739. [Google Scholar] [CrossRef] [PubMed]
  38. Sakuma, Y.; Liu, Q.; Dubouzet, J.G.; Abe, H.; Shinozalri, K.; Yamaguci-Shinozaki, K. DNA binding specificity of the ERF/AP2 domain of Arabidopsis DREBs, transcription factors involved in dehydration- and cold-inducible gene expression. Biochem. Biophys. Res. Commun. 2002, 290, 998–1009. [Google Scholar] [CrossRef] [PubMed]
  39. Nakano, T.; Suzuki, K.; Fujimura, T.; Shin, S.H. Genome wide analysis of the ERF gene family in Arabidopsis and rice. Plant Physiol. 2006, 140, 411–432. [Google Scholar] [CrossRef] [PubMed]
  40. Zhang, X.; Tang, Y.; Ma, Q.; Yang, C.; Mu, Y.; Suo, H.; Luo, L.; Nian, H. OsDREB2A, a rice transcription factor, significantly affects salt tolerance in transgenic soybean. PLoS ONE 2013. [Google Scholar] [CrossRef] [PubMed]
  41. Cui, M.; Zhang, W.; Zhang, Q.; Xu, Z.; Zhu, Z.; Duan, F.; Wu, R. Induced over-expression of the transcription factor OsDREB2A improves drought tolerance in rice. Plant Physiol. Biochem. 2011, 49, 1384–1391. [Google Scholar] [CrossRef] [PubMed]
  42. Liu, D.; Chen, X.; Liu, J.; Ye, J.; Guo, Z. The rice ERF transcription factor OsERF922 negatively regulates resistance to Magnaporthe oryzae and salt tolerance. J. Exp. Bot. 2012, 63, 3899–3911. [Google Scholar] [CrossRef] [PubMed]
  43. Jisha, V.; Dampanaboina, L.; Vadassery, J.; Mithöfer, A.; Kappara, S.; Ramanan, R. Overexpression of an AP2/ERF type transcription factor OsEREBP1 confers biotic and abiotic stress tolerance in rice. PLoS ONE 2015, 10, e0127831. [Google Scholar] [CrossRef] [PubMed]
  44. Olsen, A.N.; Ernst, H.A.; Leggio, L.L.; Skriver, K. NAC transcription factors: Structurally distinct, functionally diverse. Trends Plant Sci. 2005, 10, 79–87. [Google Scholar] [CrossRef] [PubMed]
  45. Jeong, J.S.; Kim, Y.S.; Baek, K.H.; Jung, H.; Ha, S.; Choi, Y.D.; Kim, M.; Reuzeau, C.; Kim, J. Root-specific expression of OsNAC10 improves drought tolerance and grain yield in rice under field drought conditions. Plant Physiol. 2010, 153, 185–197. [Google Scholar] [CrossRef] [PubMed]
  46. Ogo, Y.; Nakanishi, I.R.; Nakanishi, H.; Kobayashi, T.; Takahashi, M.; Mori, S.; Nishizawa, N.K. The rice bHLH protein OsIRO2 is an essential regulator of the genes involved in Fe uptake under Fe-deficient conditions. Plant J. 2007, 51, 366–377. [Google Scholar] [CrossRef] [PubMed]
  47. Ogo, Y.; Itai, R.N.; Kobayashi, T.; Aung, M.S.; Nakanishi, H.; Nishizawa, N.K. OsIRO2 is responsible for iron utilization in rice and improves growth and yield in calcareous soil. Plant Mol. Biol. 2011, 75, 593–605. [Google Scholar] [CrossRef] [PubMed]
  48. Sun, L.; Zhang, H.; Li, D.; Huang, L.; Hong, Y.; Ding, X.S.; Nelson, R.S.; Zhou, X.; Song, F. Functions of rice NAC transcriptional factors, ONAC122 and ONAC131, in defense responses against Magnaporthe grisea. Plant Mol. Biol. 2013, 81, 41–56. [Google Scholar] [CrossRef] [PubMed]
  49. Huang, L.; Hong, Y.; Zhang, H.; Li, D.; Song, F. Rice NAC transcription factor ONAC095 plays opposite roles in drought and cold stress tolerance. BMC Plant Biol. 2016. [Google Scholar] [CrossRef] [PubMed]
  50. Lan, A.; Huang, J.; Zhao, W.; Peng, Y.; Chen, Z.; Kang, D. A salicylic acid-induced rice (Oryza sativa L.) transcription factor OsWRKY77 is involved in disease resistance of Arabidopsis thaliana. Plant Biol. 2013, 15, 452–461. [Google Scholar] [CrossRef] [PubMed]
  51. Chujo, T.; Miyamoto, K.; Shimogawa, T.; Shimizu, T.; Otake, Y.; Yokotani, N.; Nishizawa, Y.; Shibuya, N.; Nojiri, H.; Yamane, H.; et al. OsWRKY28, a PAMP-responsive transrepressor, negatively regulates innate immune responses in rice against rice blast fungus. Plant Mol. Biol. 2013, 82, 23–37. [Google Scholar] [CrossRef] [PubMed]
  52. Qiu, D.; Xiao, J.; Xie, W.; Liu, H.; Li, X.; Xiong, L.; Wang, S. Rice gene network inferred from expression profiling of plants overexpressing OsWRKY13, a positive regulator of disease resistance. Mol. Plant 2008, 1, 538–551. [Google Scholar] [PubMed]
  53. Tao, Z.; Kou, Y.; Liu, H.; Li, X.; Xiao, J.; Wang, S. OsWRKY45 alleles play different roles in abscisic acid signalling and salt stress tolerance but similar roles in drought and cold tolerance in rice. J. Exp. Bot. 2011, 62, 4863–4874. [Google Scholar] [CrossRef] [PubMed]
  54. Ryu, H.S.; Han, M.; Lee, S.K.; Cho, J.I.; Ryoo, N.; Heu, S.; Lee, Y.H.; Bhoo, S.H.; Wang, G.L.; Hahn, T.R.; et al. A comprehensive expression analysis of the WRKY gene superfamily in rice plants during defense response. Plant Cell Rep. 2006, 25, 836–847. [Google Scholar] [CrossRef] [PubMed]
  55. Yokotani, N.; Sato, Y.; Tanabe, S.; Chujo, T.; Shimizu, T.; Okada, K.; Yamane, H.; Shimono, M.; Sugano, S.; Takatsuji, H.; et al. WRKY76 is a rice transcriptional repressor playing opposite roles in blast disease resistance and cold stress tolerance. J. Exp. Bot. 2013, 64, 5085–5097. [Google Scholar] [CrossRef] [PubMed]
  56. Caldana, C.; Degenkolbe, T.; Cuadros-Inostroza, A.; Klie, S.; Sulpice, R.; Leisse, A.; Steinhauser, D.; Fernie, A.R.; Willmitzer, L.; Hannah, M.A. High-density kinetic analysis of the metabolomic and transcriptomic response of Arabidopsis to eight environmental conditions. Plant J. 2011, 67, 869–884. [Google Scholar] [CrossRef] [PubMed]
  57. Goh, C.H.; Satoh, K.; Kikuchi, S.; Kim, S.C.; Ko, S.M.; Kang, H.G.; Jeon, J.S.; Kim, C.S.; Park, Y.I. Mitochondrial activity in illuminated leaves of chlorophyll-deficient mutant rice (OsCHLH) seedlings. Plant Biotechnol. Rep. 2010, 4, 281–291. [Google Scholar] [CrossRef]
  58. Jung, K.H.; Hur, J.; Ryu, C.H.; Choi, Y.; Chung, Y.Y.; Miyao, A.; Hirochika, H.; An, G. Characterization of a rice chlorophyll-deficient mutant using the T-DNA gene-trap system. Plant Cell Physiol. 2003, 44, 463–472. [Google Scholar] [CrossRef] [PubMed]
  59. Sakuraba, Y.; Rahman, M.L.; Cho, S.H.; Kim, Y.S.; Koh, H.J.; Yoo, S.C.; Paek, N.C. The rice faded green leaf locus encodes protochlorophyllide oxidoreductase B and is essential for chlorophyll synthesis under high light conditions. Plant J. 2013, 74, 122–133. [Google Scholar] [CrossRef] [PubMed]
  60. Yang, Y.L.; Xu, J.; Rao, Y.C.; Zeng, Y.J.; Liu, H.J.; Zheng, T.T.; Zhang, G.H.; Hu, J.; Guo, L.B.; Qian, Q.; et al. Cloning and functional analysis of pale-green leaf (PGL10) in rice (Oryza sativa L.). Plant Growth Regul. 2016, 78, 69–77. [Google Scholar] [CrossRef]
  61. Wu, Z.M.; Zhang, X.; He, B.; Diao, L.P.; Sheng, S.L.; Wang, J.L.; Guo, X.P.; Su, N.; Wang, L.F.; Jiang, L.; et al. A chlorophyll-deficient rice mutant with impaired chlorophyllide esterification in chlorophyll biosynthesis. Plant Physiol. 2007, 145, 29–40. [Google Scholar] [CrossRef] [PubMed]
  62. Rüdiger, W.; Benz, J.; Guthoff, C. Detection and partial characterization of activity of chlorophyll synthetase in etioplast membranes. FEBS J. 1980, 109, 193–200. [Google Scholar] [CrossRef]
  63. Soll, J.; Schultz, G.; Rüdiger, W.; Benz, J. Hydrogenation of geranylgeraniol two pathways exist in spinach chloroplasts. Plant Physiol. 1983, 71, 849–854. [Google Scholar] [CrossRef] [PubMed] [Green Version]
  64. Paulsen, H.; Rümler, U.; Rüdiger, W. Reconstitution of pigment-containing complexes from light-harvesting chlorophyll a/b-binding protein overexpressed in Escherichia coli. Planta 1990, 181, 204–211. [Google Scholar] [CrossRef] [PubMed]
  65. Gill, R.A.; Ali, B.; Cui, P.; Shen, E.H.; Farooq, M.A.; Islam, F.; Ali, S.; Mao, B.Z.; Zhou, W.J. Comparative transcriptome profiling of two Brassica napus cultivars under chromium toxicity and its alleviation by reduced glutathione. BMC Genom. 2016. [Google Scholar] [CrossRef] [PubMed]
  66. Langmead, B.; Trapnell, C.; Pop, M.; Salzberg, S.L. Ultrafast and memory-efficient alignment of short DNA sequences to the human genome. Genome Biol. 2009, 10, 25–34. [Google Scholar] [CrossRef] [PubMed]
  67. Li, H.; Durbin, R. Fast and accurate short read alignment with Burrows-Wheeler transform. Bioinformatics 2009, 25, 1754–1760. [Google Scholar] [CrossRef] [PubMed]
  68. Li, B.; Dewey, C.N. RSEM: Accurate transcript quantification from RNA-Seq data with or without a reference genome. BMC Bioinform. 2011. [Google Scholar] [CrossRef] [PubMed]
  69. Mortazavi, A.; Williams, B.A.; McCue, K.; Schaeffer, L.; Wold, B. Mapping and quantifying mammalian transcriptomes by RNA-Seq. Nat. Methods 2008, 5, 621–628. [Google Scholar] [CrossRef] [PubMed]
  70. Sonia, T.; García-Alcalde, F.; Dopazo, J.; Ferrer, A.; Conesa, A. Differential expression in RNA-seq: A matter of depth. Genome Res. 2011, 21, 2213–2223. [Google Scholar]
  71. Yang, C.; Xu, L.; Zhang, N.; Islam, F.; Song, W.J.; Hu, L.Y.; Liu, D.; Xie, X.N.; Zhou, W.J. iTRAQ-based proteomics of sunflower cultivars differing in resistance to parasitic weed Orobanche cumana. Proteomics 2017. [Google Scholar] [CrossRef] [PubMed]
Figure 1. Correlation heatmap of samples. The gradient color barcode at the top-right indicates the minimum value in red and the maximum in green. If one sample is highly similar to another one, the correlation value between them is very close to 1.
Ijms 18 01975 g001
Figure 2. Identification and analysis of the proteome of O. sativa plants. (A) Identified proteins were grouped based on their protein mass; (B) Number of peptides that match to proteins as shown by Protein Pilot 5.0; (C) The percentage of different peptide lengths in total amino acids. (D) Distribution of a protein’s sequence coverage.
Ijms 18 01975 g002
Figure 3. Three plots, one for each group (control, Q and Q + SA), that show the CV values (%) for comparing protein quantifications over the length of identified peptides.
Ijms 18 01975 g003aIjms 18 01975 g003b
Figure 4. Scatter plots of gene expression level and the protein abundance distribution of expressed proteins. In the scatter plot, blue dots represent down-regulated genes, orange dots represent up-regulated genes, and brown dots represent non-regulated genes; whereas, in the protein-abundance distribution figures, green and red dots represent significantly down-regulated and up-regulated proteins, respectively. The grey dots represent insignificant changed proteins.
Ijms 18 01975 g004
Figure 5. The numbers of differentially expressed genes (DEG, A) and proteins (DEP, B). The blue bar denotes down-regulated genes or proteins, and the orange bar shows the up-regulated ones.
Ijms 18 01975 g005
Figure 6. Overview of differentially expressed genes involved in various metabolic processes under different treatments. (A) Q vs. control; (B) Q + SA vs. Q; and (C) Q + SA vs. control. The images were obtained using MapMan, showing different functional categories that passed the cutoff (less than 0.05 q value and greater than two-fold change) for differential expression. The red color represents up-regulated genes, and the blue color represents down-regulated genes.
Ijms 18 01975 g006aIjms 18 01975 g006b
Figure 7. Confirmation of expression levels of selected differentially expressed genes (DEGs) by quantitative real time-PCR assays. (A) herbicide quinclorac treatment; (B) salicylic acid pre-treatment under quinclorac stress; and (C) various genes expression under different treatments. The data show the averages and the standard deviation of three independent samples.
Ijms 18 01975 g007
Figure 8. STRING software predicted differentially accumulated proteins association between herbicide quinclorac-treated only and salicylic acid + quinclorac treatment: (A) down-regulated and (B) up-regulated proteins. Differentially accumulated proteins are represented by node, whereas different color of lines represents different evidences for the predicted functional relationship between proteins; red line: gene fusion evidence; dark blue line: co-occurrence evidence; ml black line: co-expression evidence; yellow line: text-mining evidence; green line: neighborhood genome evidence; light blue line: database evidence; and pink line: experimental evidence. All interactions had a confidence score ≥0.9 (highest confidence) to minimize false positives/negatives.
Ijms 18 01975 g008aIjms 18 01975 g008b
Table 1. Summary of average sequencing data for each group.
GroupTotal Reads Quality Filtered Reads Uniquely Mapped ReadsGenome Mapped Reads (%)Gene Mapped Reads (%)
Control13,127,07413,062,73811,301,93186.5288.71
Q13,126,99113,047,77611,277,17486.4389.12
Q + SA13,127,03213,028,06211,223,00986.1589.83
Average13,127,03213,046,19211,267,37186.3789.22
Clean Data Rate (%) = Clean Reads Number/Raw Reads Number.
Table 2. The significant enrichment pathways with differential expressed proteins.
ComparisonPathwayDifferential Proteins with Pathway Annotation (121)All Proteins with Pathway Annotation (1871)p ValuePathway ID
Q vs. controlCysteine and methionine metabolism9 (7.44%)39 (2.08%)0.0005958267ko00270
Glyoxylate and dicarboxylate metabolism8 (6.61%)47 (2.51%)0.009008489ko00630
Phenylpropanoid biosynthesis9 (7.44%)58 (3.1%)0.01050140ko00940
Carbon metabolism18 (14.88%)159 (8.5%)0.01124338ko01200
C5-Branched dibasic acid metabolism2 (1.65%)5 (0.27%)0.03646180ko00660
Ascorbate and aldarate metabolism4 (3.31%)22 (1.18%)0.04913111ko00053
Metabolic pathways55 (45.45%)710 (37.95%)0.04918179ko01100
Q + SA vs. QAlanine, aspartate and glutamate metabolism5 (5.15%)28 (1.5%)0.01281717ko00250
Riboflavin metabolism3 (3.09%)11 (0.59%)0.01644878ko00740
Arginine biosynthesis4 (4.12%)21 (1.12%)0.02056896ko00220
Terpenoid backbone biosynthesis3 (3.09%)12 (0.64%)0.02111914ko00900
2-Oxocarboxylic acid metabolism5 (5.15%)32 (1.71%)0.02229215ko01210
Q + SA vs. controlPhotosynthesis11 (6.29%)52 (2.78%)0.006954811ko00195
Metabolic pathways82 (46.86%)710 (37.95%)0.007189333ko01100
Photosynthesis-antenna proteins4 (2.29%)13 (0.69%)0.02696767ko00196
Biosynthesis of amino acids18 (10.29%)123 (6.57%)0.03282929ko01230
Pyrimidine metabolism6 (3.43%)27 (1.44%)0.03444194ko00240
Valine, leucine and isoleucine biosynthesis3 (1.71%)9 (0.48%)0.04427594ko00290
Pentose and glucuronate interconversions4 (2.29%)15 (0.8%)0.04442334ko00040
Table 3. Correlation analysis of transcriptomic and proteomic data under different treatments.
ComparisonTypeProteins NumberGenes NumberCorrelations Number
Q vs. controlIdentification230027,3422202
Differ expressed147220744
Q vs. Q+SAIdentification230027,3422205
Differ expressed1246975
Q+SA vs. controlIdentification230027,3422205
Differ expressed202112035

