Article

Microgravity Affects Thyroid Cancer Cells during the TEXUS-53 Mission Stronger than Hypergravity

1
Clinic for Plastic, Aesthetic and Hand Surgery, Otto von Guericke University Magdeburg, Leipziger Str. 44, D-39120 Magdeburg, Germany
2
Max Planck Institute of Biochemistry, D-82152 Martinsried, Germany
3
Department of Biomedicine, Aarhus University, Wilhelm Meyers Allé 4, DK-8000 Aarhus C, Denmark
4
Department of Ophthalmology, Aarhus University Hospital, Aarhus, 8000 Aarhus C, Denmark
5
Cologne Center for Genomics, University of Cologne, D-50931 Cologne, Germany
6
Airbus Defence and Space GmbH, Airbus-Allee 1, D-28199 Bremen, Germany
7
Gravitational Biology and Translational Regenerative Medicine, Faculty of Medicine and Mechanical Engineering, Otto-von-Guericke-University Magdeburg, D-39120 Magdeburg, Germany
*
Author to whom correspondence should be addressed.
Int. J. Mol. Sci. 2018, 19(12), 4001; https://0-doi-org.brum.beds.ac.uk/10.3390/ijms19124001
Submission received: 15 November 2018 / Revised: 6 December 2018 / Accepted: 9 December 2018 / Published: 12 December 2018
(This article belongs to the Special Issue Adaptation of Living Organisms in Space: From Mammals to Plants)

Abstract

:
Thyroid cancer is the most abundant tumor of the endocrine organs. Poorly differentiated thyroid cancer is still difficult to treat. Human cells exposed to long-term real (r-) and simulated (s-) microgravity (µg) revealed morphological alterations and changes in the expression profile of genes involved in several biological processes. The objective of this study was to examine the effects of short-term µg on poorly differentiated follicular thyroid cancer cells (FTC-133 cell line) resulting from 6 min of exposure to µg on a sounding rocket flight. As sounding rocket flights consist of several flight phases with different acceleration forces, rigorous control experiments are mandatory. Hypergravity (hyper-g) experiments were performed at 18g on a centrifuge in simulation of the rocket launch and s-µg was simulated by a random positioning machine (RPM). qPCR analyses of selected genes revealed no remarkable expression changes in controls as well as in hyper-g samples taken at the end of the first minute of launch. Using a centrifuge initiating 18g for 1 min, however, presented moderate gene expression changes, which were significant for COL1A1, VCL, CFL1, PTK2, IL6, CXCL8 and MMP14. We also identified a network of mutual interactions of the investigated genes and proteins by employing in-silico analyses. Lastly, µg-samples indicated that microgravity is a stronger regulator of gene expression than hyper-g.

1. Introduction

Thyroid cancer (TC) is one of the most abundant neoplasms of the endocrine organs [1]. Thyroid carcinomas are malignant tumors of the thyroid gland and are classified into differentiated TC (papillary TC, follicular TC and Hürthle cell cancer), medullary TC; and anaplastic TC. The American Cancer Society recently estimated that in the US in 2018 about 2,060 persons died from TC [1].
Thyroid cells as well as differentiated TC cells are capable of taking up iodine [2]. When radioactive iodine (RAI; 131I) is given, it concentrates in the thyroid. The radiation will destroy the thyroid gland and any other benign and malignant thyroid cells. RAI-treatment is used to ablate any thyroid tissue in the organism. Unfortunately, undifferentiated TC cells lost the ability to take up iodine which increases the need to find new therapeutically valuable treatments [3], for example by targeting tumor angiogenesis [2,4].
Microgravity (µg) offers a very special culture environment for cells enabling three-dimensional (3D) growth. This environment is suitable for tissue engineering purposes, while exposing cells to an unknown stress and thereby forcing them to react and adapt to this new condition [5,6,7].
Normal and benign thyroid cells have been examined after cultivation on a random positioning machine (RPM) at various time-points [8,9,10]. The results suggest that RPM-exposure changed differentiation and growth behavior of poorly differentiated malignant FTC-133 cells after long-term RPM-exposure [8]. Comparable results were obtained from the Simbox/Shenzhou-8 mission, when FTC-133 cells were cultured on an unmanned spacecraft for 10 days [11].
Furthermore, the cytoskeleton underwent changes in structure and organization by exposure to µg. This was demonstrated during parabolic flights as well as a TEXUS (TX) sounding rocket mission, where a novel live-cell imaging approach using the FLUMIAS microscope revealed the occurrence of “holes” in the F-actin-network and in lamellipodia- and filopodia-like structures [12]. According to the tensegrity model, meaning that cells gain their structure through a pervasive tensional force, the cytoskeleton might play an important role in the mechano- and gravisensing process of human cells [13,14]. It is proposed that the cytoskeleton acts as a mediator and conductor of signals from the extracellular space into the nucleus due to it being hardwired to specific cell surface proteins, such as integrins, which are involved in focal adhesion formation and cell-cell interaction [15,16], as well as to cytoplasmic transduction molecules [13]. Proteins involved in the linkage of the cytoskeleton to membrane proteins and the ECM are most prominently talin, vinculin or the ERM proteins [17,18,19].
To determine the impact of r-µg on the cells after the 1-min long hyper-g phase during launch-, FTC-133 cells were exposed to 6 min of r-µg during the TEXUS-(TX) 53 mission [20] and in parallel to 1 min of 18g on a centrifuge (see Figure 1 of [20]). In addition, we compared the effects of the short-term r-µg with a 6-min cultivation on the RPM (s-µg), focusing on extracellular matrix (ECM) proteins, the cytoskeleton, cell adhesion, focal adhesion and cytokines.
The expression of genes and the accumulation of proteins, which were known to be highly sensitive to altered gravity conditions were analyzed. Furthermore, we have conducted an in-silico analysis including data from the literature to identify possible mutual interaction networks between the analyzed proteins, as successfully practiced earlier [21,22].

2. Results

After the samples’ return to the laboratory, quantitative real-time PCR (qPCR) and pathway analyses were performed. The studies were done on the samples collected during the TX53 mission as described in [20] as well as on samples exposed to 18g (worst case) hyper-g on a centrifuge, or cultured for 6-min of s-µg exposure on an RPM. We focused on the F-actin cytoskeleton, the ECM, focal adhesion, cell adhesion molecules, and cytokines. Various genes belonging to these groups and recently found to be differentially expressed during long-term spaceflights and RPM-experiments (Table 1) were investigated.
The genes listed in Table 1 were complemented with a number of additional genes known to be involved in cell-cell and cell-substrate adhesion. The in-silico evaluation of the selected genes revealed a self-contained network. These genes, indicated by a green or blue rim, form a network of mutual influence (Figure 1, icons with red rim), with TGFB1, ITGB1, SPP1, IL-6, IL8, FN1, COL1A1, CDH1, and MMP14 being nodal points of this network. Additionally, many arrows start at TGFB1, LOX and PTK2, meaning that these entities are effectors in the system. Interestingly, the 6 genes marked with a yellow rim fit rather well into the network. These genes caught our attention during a preliminary evaluation of the microarray analysis of the two µg-samples available, because they were at least 1.7-fold enhanced in comparison to the controls.
Regarding the products of these genes (Figure 2), three groups can be distinguished: There are extracellular proteins, membrane proteins and intracellular proteins. As indicated above, the proteins whose icons are marked with a green or blue rim, are gene products found in recent studies referenced or mentioned in the preceding paper [20], respectively. On the protein level, however, the most important nodal points are fibronectin and integrin β 1. Intracellularly, they are connected to VCL, MSN and ACTB, which are involved in forwarding signals, generated by cells’ binding to the ECM, towards the nucleus.

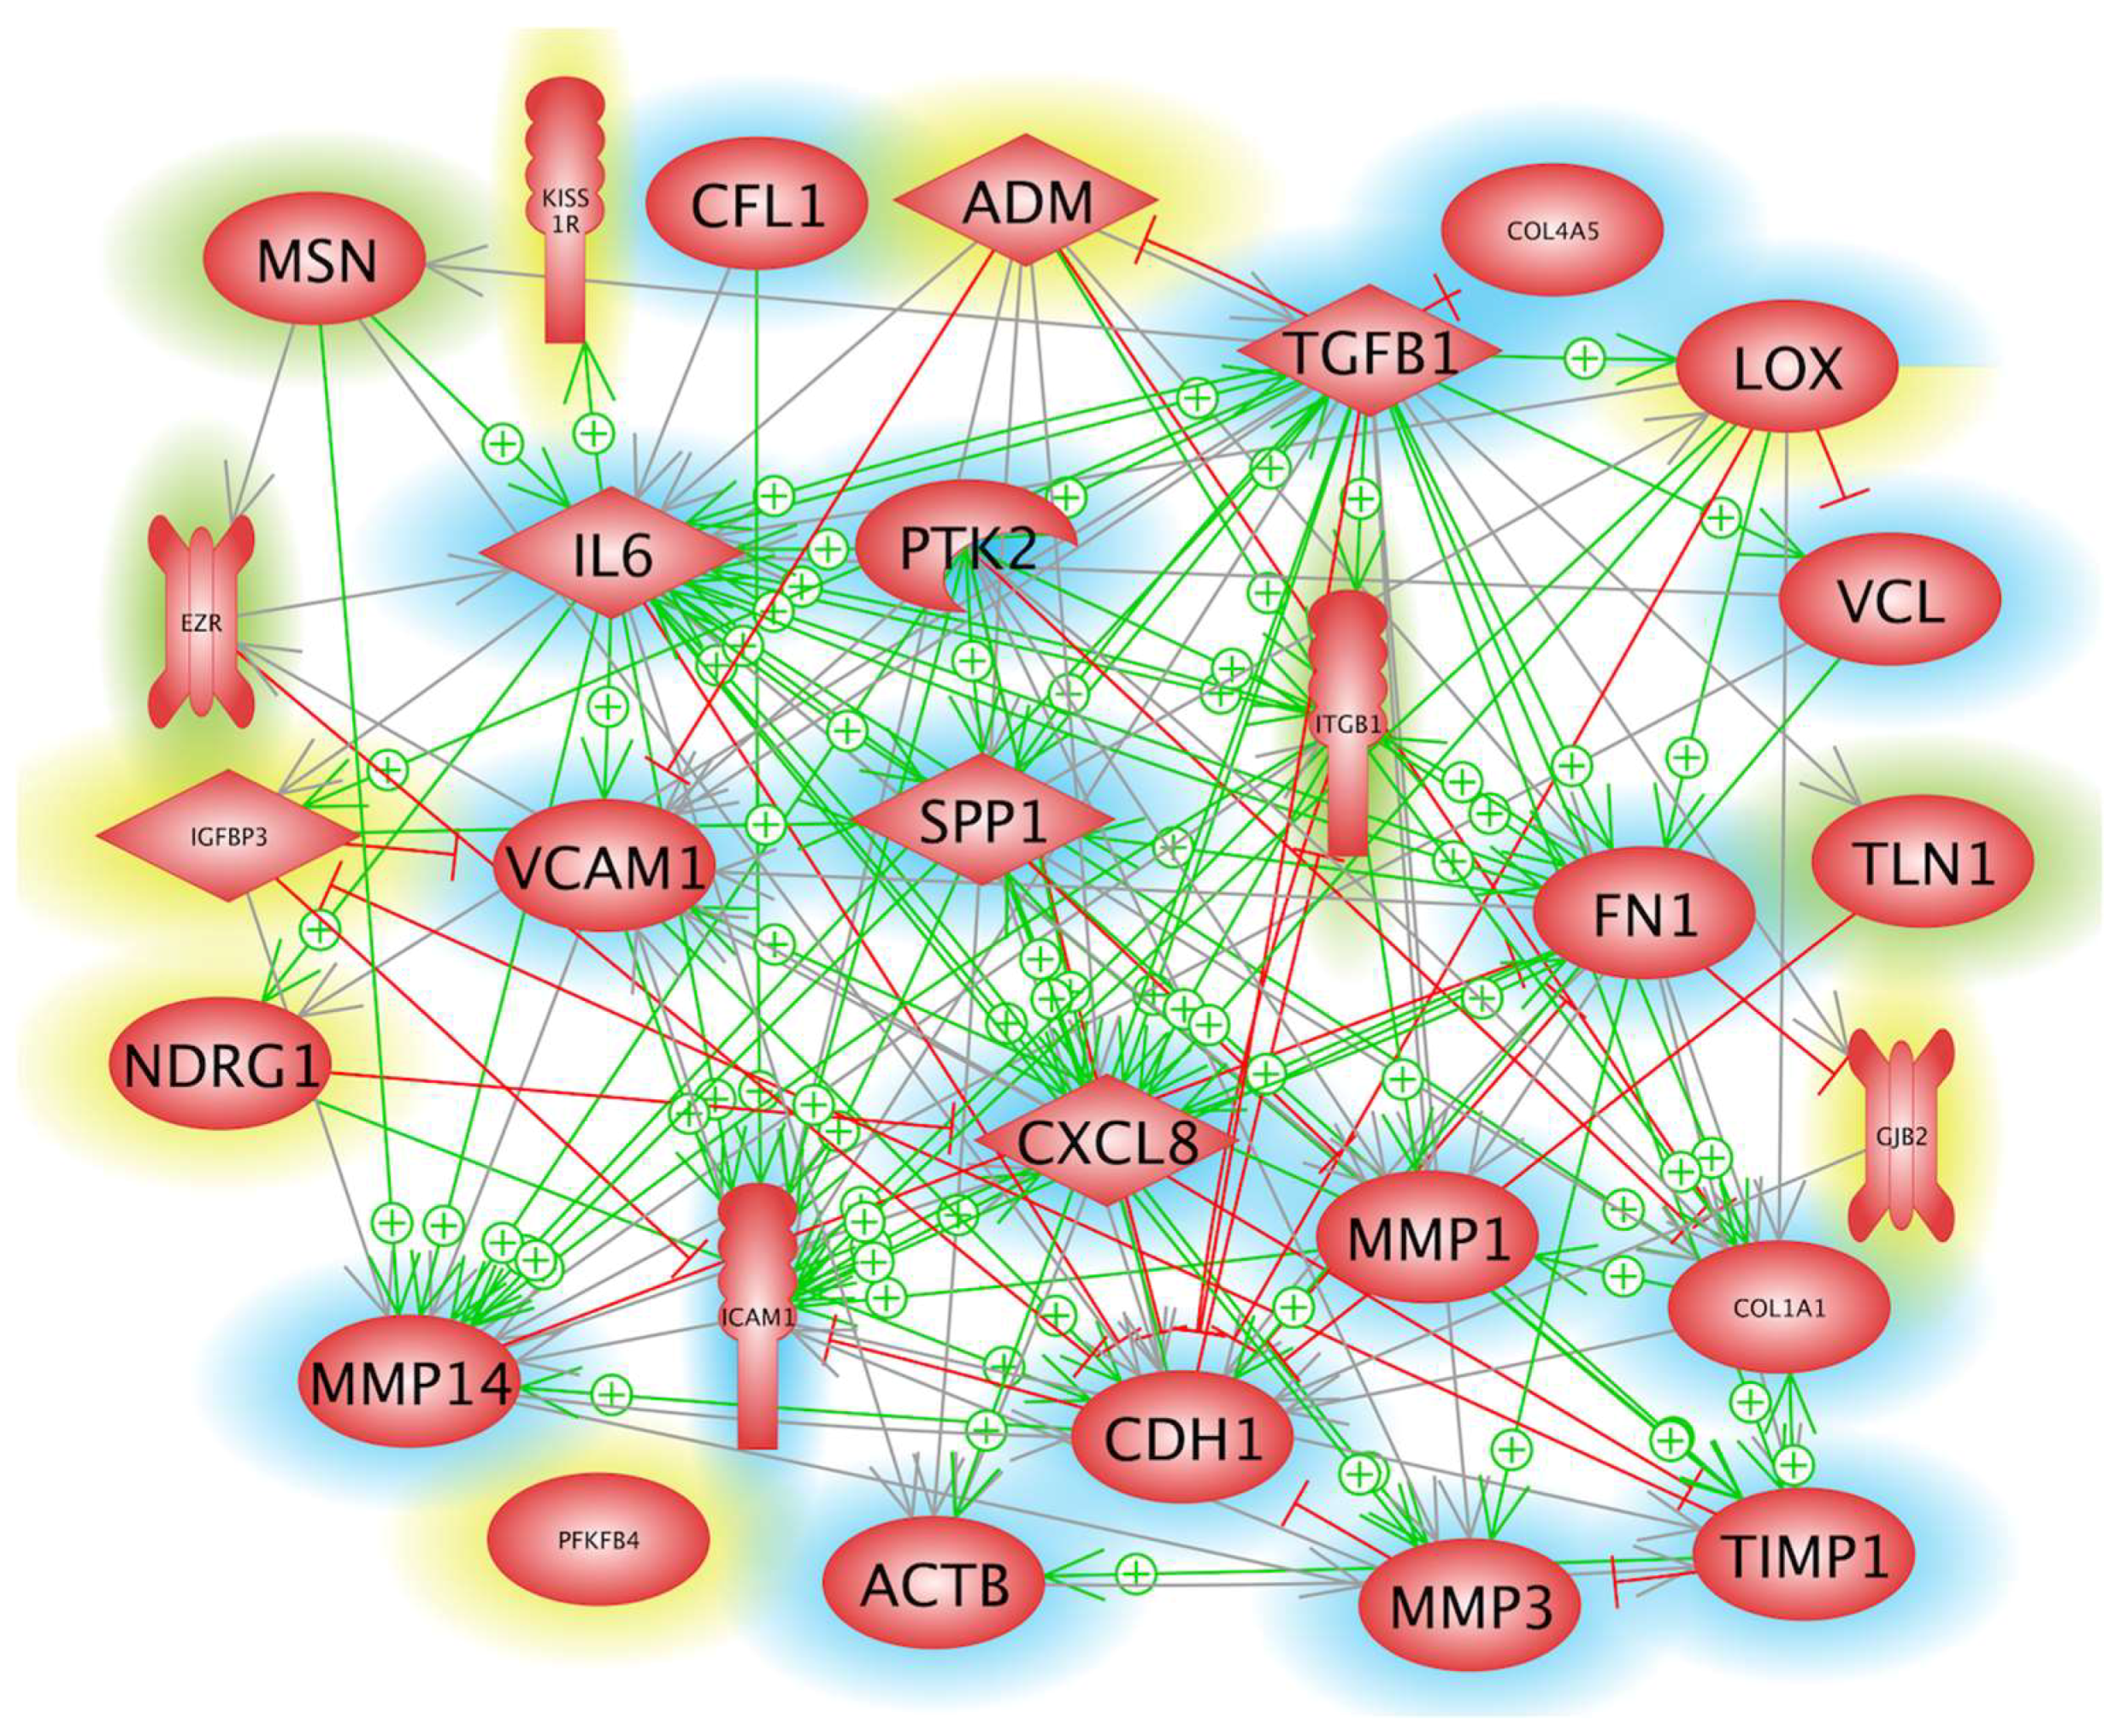
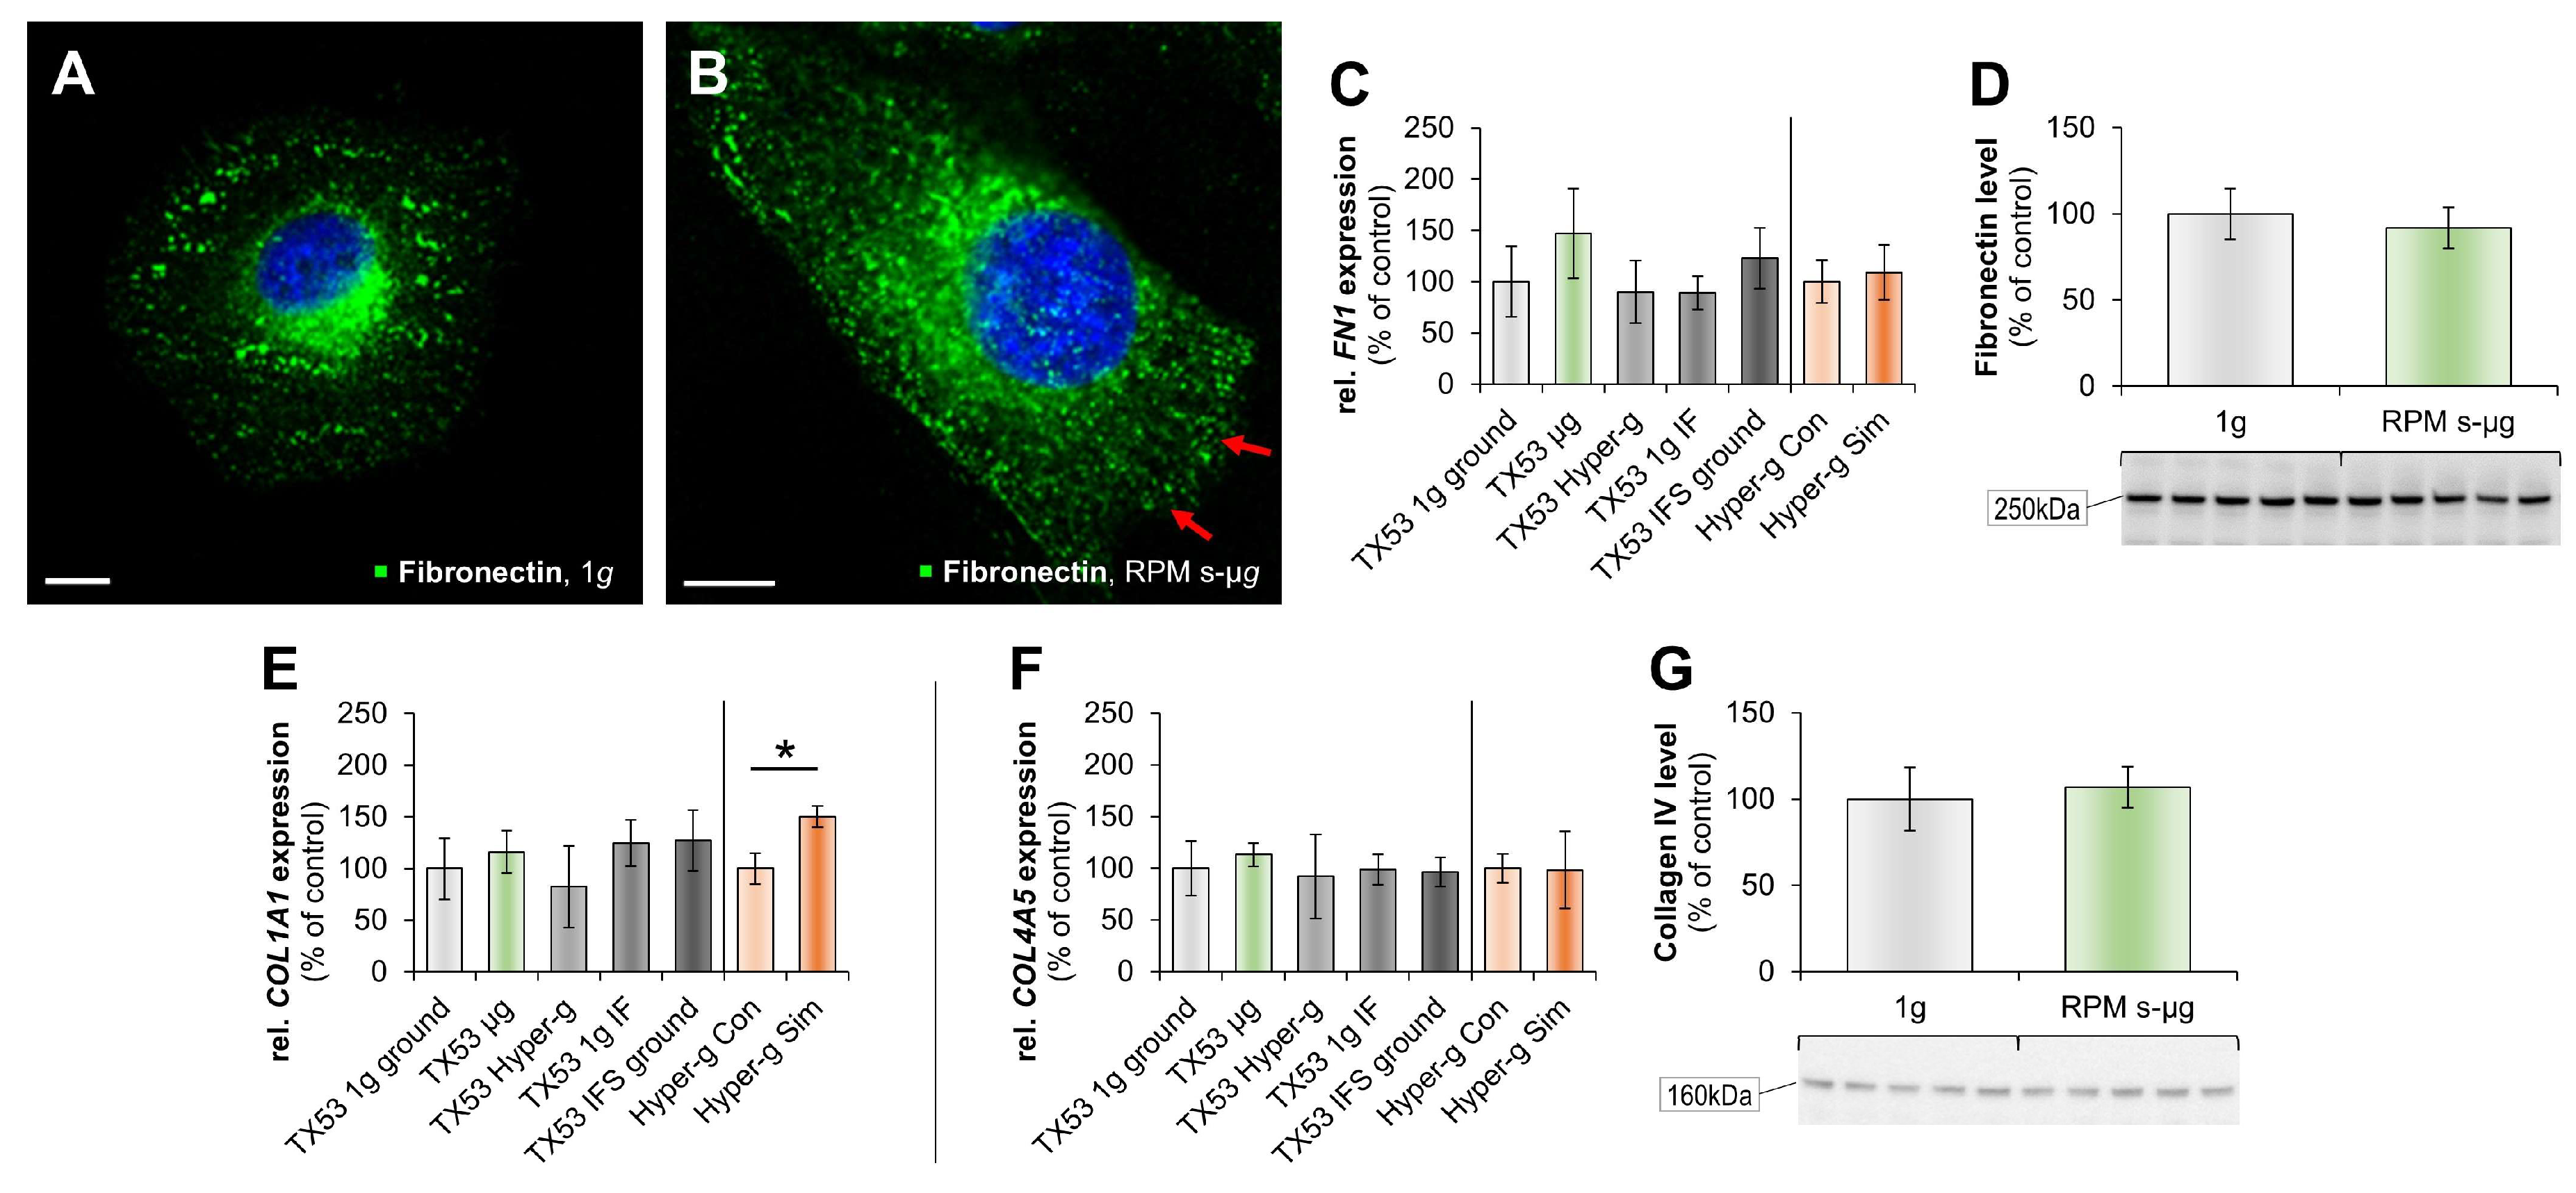
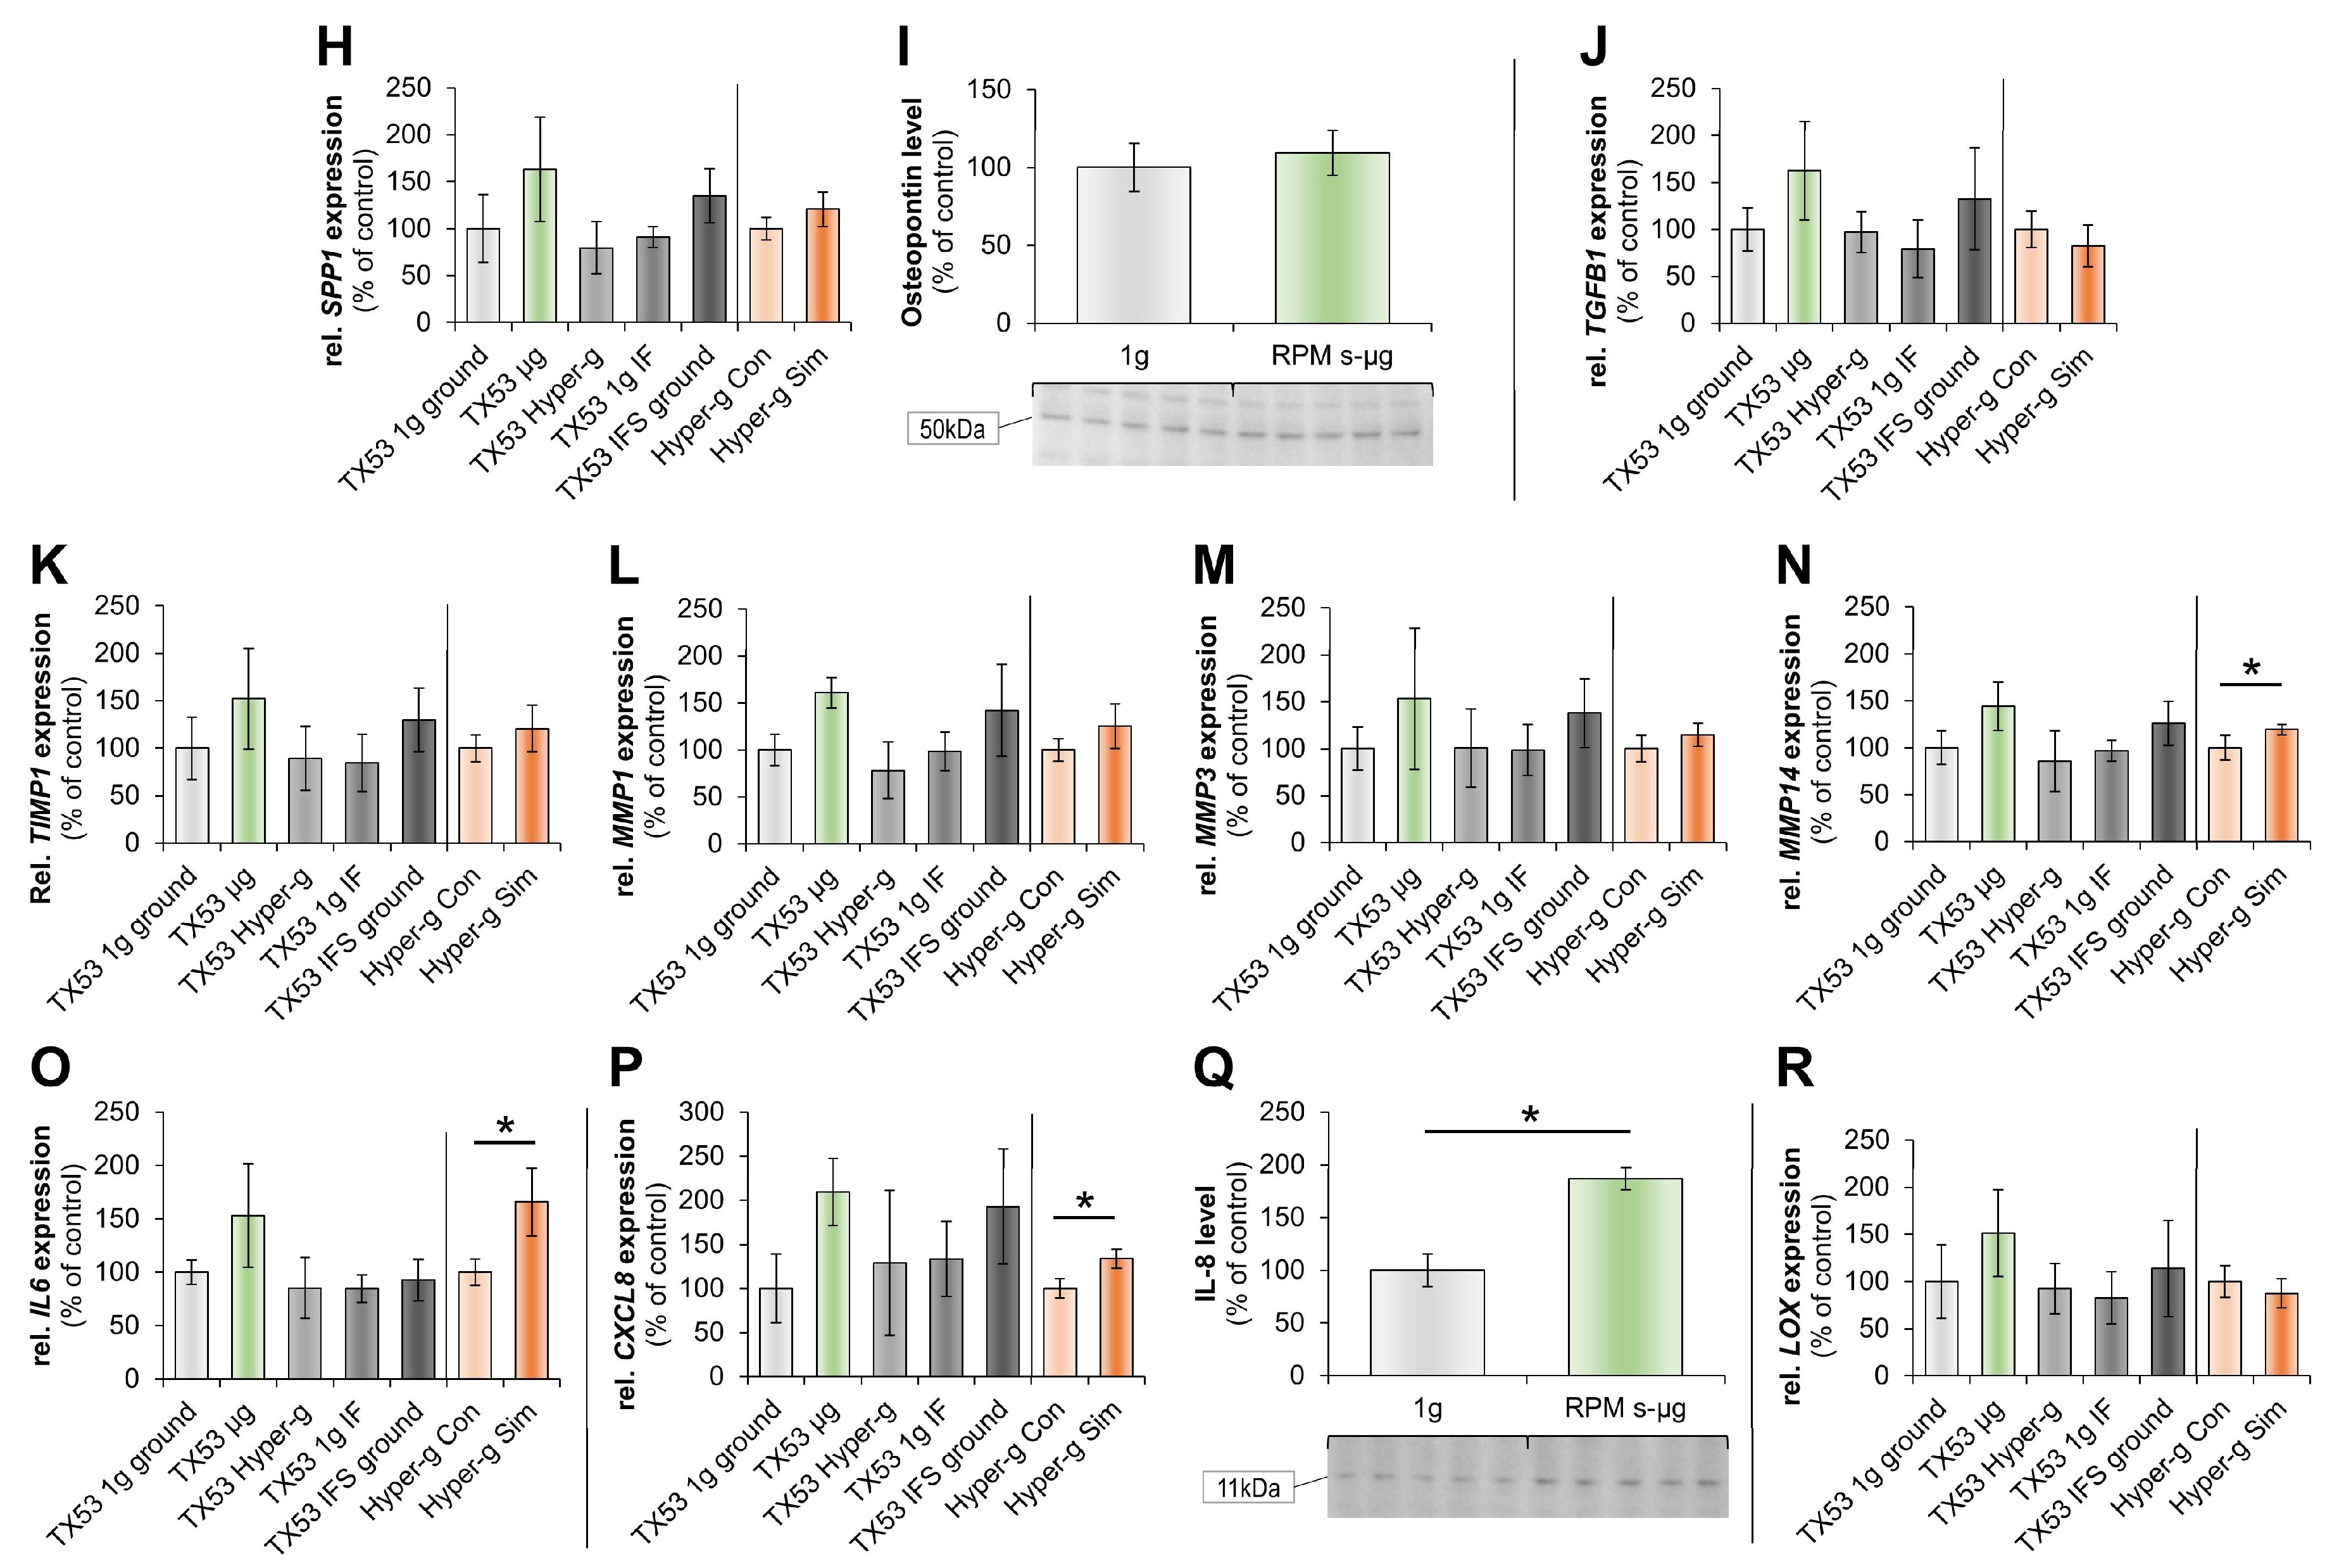
2.1. Impact of Microgravity on the Regulation of Genes Whose Products Act Extracellularly

Immunofluorescence staining (IFS) showed that the ECM protein fibronectin was redistributed in RPM-samples compared to control cells (Figure 3A,B). The FN1 gene expression was not significantly altered (Figure 3C). In addition, fibronectin expression did not change in FTC-133 cells exposed to the RPM for 6 min (Figure 3D). COL1A1 mRNA, however, was significantly upregulated in hyper-g samples compared with corresponding controls (Figure 3E), whereas the COL4A5 mRNA remained stable in all groups (Figure 3F). The expression of the structural protein collagen IV was not significantly changed by short-term µg as compared to the corresponding control (Figure 3G).
Moreover, we studied the ECM protein and cell adhesion molecule osteopontin. The secreted phosphoprotein 1 (SPP1) gene expression, determined in post-flight and hyper-g samples was slightly, but not significantly elevated (Figure 3H). RPM-exposure of the FTC-133 cells did not induce significant changes in the amount of protein in both groups (Figure 3I). qPCR of TGFB1 mirrored these findings (Figure 3J).
Finally, we determined the gene expression patterns of tissue inhibitor of metalloproteinase 1 (TIMP1) and matrix metalloproteinases MMP1, MMP3 and MMP14 (Figure 3K-N). TIMP1, MMP1, and MMP3 genes were slightly elevated in r-µg, whereas the MMP14 mRNA was elevated in r-µg and significantly elevated in hyper-g samples (Figure 3N).
Earlier studies investigating the impact of µg on human cells and the synthesis and secretion of the two cytokines interleukin-6 (IL-6) and interleukin-8 (IL-8 or synonymous CXC-motif-chemokine 8, (CXCL8)) have shown their involvement in 3D spheroid formation [24]. The release and expression of both cytokines was altered in space in FTC-133 cells [24]. Here we show that both, the IL6 and CXCL8 mRNA are elevated in the r-µg and 18g centrifugation groups compared to controls (Figure 3O,P), while the IL8 protein expression was significantly enhanced during 6 min on the RPM (Figure 3Q). The LOX mRNA expression was elevated in r-µg samples, but remained unaltered in all other groups (Figure 3R).

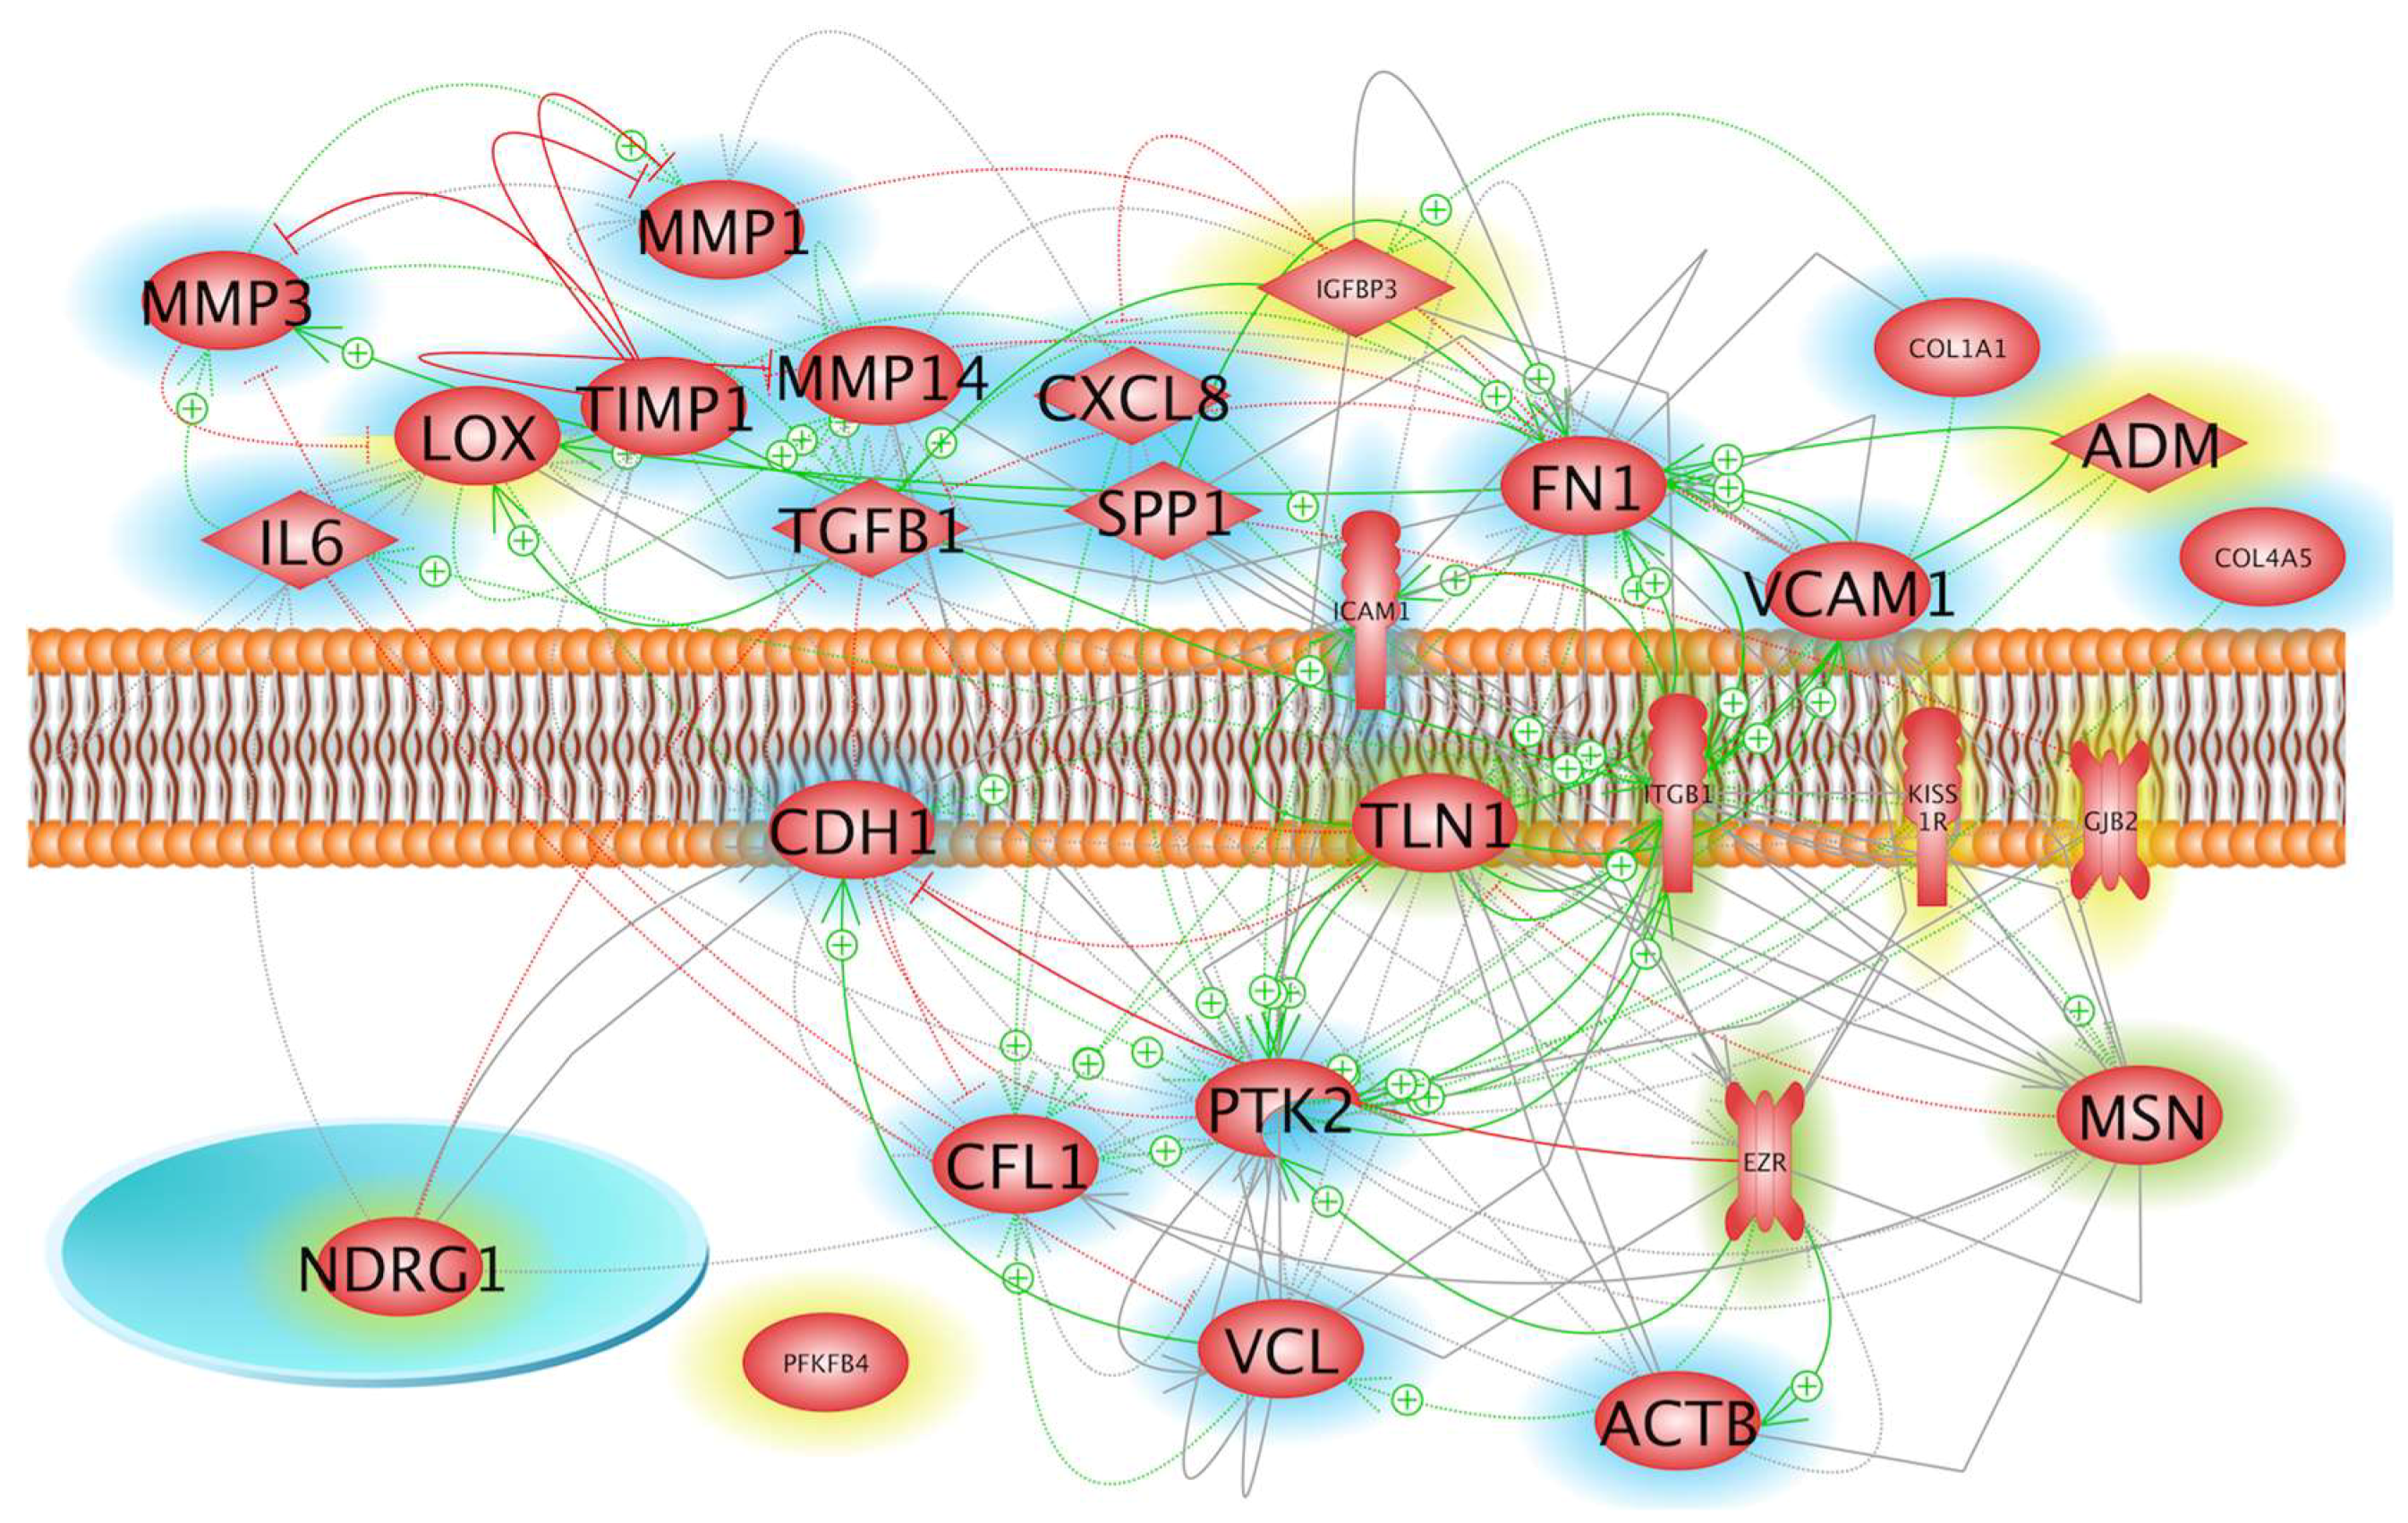
2.2. Influence of Microgravity on Genes of Membrane Proteins and Their Accumulation

The F-actin staining of RPM-exposed FTC-133 cells revealed stress fibers (yellow arrows) and lamellipodia together with filopodia (blue arrows) compared to controls (Figure 4A,B). In addition, F-actin accumulated at the cell membrane (Figure 4B). The beta-actin protein was reduced in RPM-samples compared to static 1g-controls (Figure 4C).
In a further step, we found a reduction for the protein ezrin in s-µg (Figure 4D), but no significant changes for moesin (Figure 4E) [20].
Immunofluorescence staining of vinculin showed a normal distribution of this cytoskeletal protein, present in adherence-type cell junctions in the FTC-133 cells, at 1g (Figure 4F). A clear disorganization of vinculin was visible in RPM-exposed FTC-133 cells (Figure 4G). VCL was not changed in the flight samples, but significantly elevated by 18g centrifugation (Figure 4H). Vinculin expression was not changed after RPM-exposure compared to 1g (Figure 4I). Vinculin regulates the E-cadherin expression and is involved in mechanosensing by the E-cadherin complex. Therefore, we evaluated the CDH1 mRNA expression, which was not altered in any of the samples (Figure 4J).
Vinculin and E-cadherin are known to be involved in cell morphology and locomotion. Another F-actin-binding protein is cofilin. The CFL1 gene was elevated in r-µg, and significantly enhanced in hyper-g samples (Figure 4K), indicating its role in the dynamics and organization of the F-actin cytoskeletal network. Western blot analysis of cofilin revealed a significant reduction in the RPM sample (Figure 4L). Focal adhesions are multiprotein structures connecting the ECM and the cytoskeleton.
Focal adhesion kinase 1 (FAK1 or protein tyrosine kinase 2 (PTK2)) is important for cell migration and its inhibition decreases mobility and metastasis. The PTK2 mRNA was not altered in the TEXUS samples, but elevated by 18g centrifugation compared to the corresponding control (Figure 4M). The FAK1 protein content was significantly reduced in RPM samples (Figure 4N)
Finally, we measured the gene expression of the cell adhesion molecules vascular cell adhesion molecule 1 (VCAM1) (Figure 4O) and intercellular adhesion molecule 1 (ICAM1) (Figure 4R). Both proteins were upregulated in r-µg, but not significantly changed in hyper-g (Figure 4O,R). ICAM-IFS visualized changes between the two groups (1g vs. RPM-exposure) (Figure 4P,Q). In RPM-samples ICAM1 IFS revealed holes and a lower density of ICAM-positive areas (Figure 4Q), but the ICAM1 protein concentration remained stable during 6 min on the RPM (Figure 4S).
Due to a kink in a fixative tubing one culture chamber was not filled with fixative, meaning that one µg-chamber was not fixed with RNAlater at the end of the 6-min µg-phase [20]. Therefore, the cells harvested from the residual two μg-samples did not allow a significant microarray gene analysis. In order to obtain preliminary hints on possible gene regulation within the six early minutes of µg, we compared the result of microarray analysis of the three 1g-samples with the average values of two measurements of the µg-samples. Of the 27,600 genes analyzed, eight genes appeared to be down-regulated, while seven seemed to be upregulated. While no further indication was found for the relevance of the apparent down-regulation, the comparison pointed to the possibility that LOX, ADM, IGFBP3, NDRG1, KISS1R, GJB2, PFKFB4 genes could at least be upregulated1.7-fold after 6 min of µg. The speculation is supported by the result that besides PFKFB4 these genes and their products are members of the networks shown in Figure 1 and Figure 2. In addition, several earlier studies have shown that all these genes or their products are gravisensitive and are downregulated during a prolonged stay in weightlessness [11,24,25,26].

3. Discussion

The exposure of thyroid cells to r- and s-µg led to promising results in regard to re-differentiation of TC cells [8,11,23,27,28,29]. Especially a 10-day long-term sojourn in µg during an unmanned space mission revealed gene expression changes suggesting a re-differentiation of the TC cells compared to their ground controls [11]. In this study, we could advance this theory and learned that up- and downregulation of a given gene may be a time-dependent process.

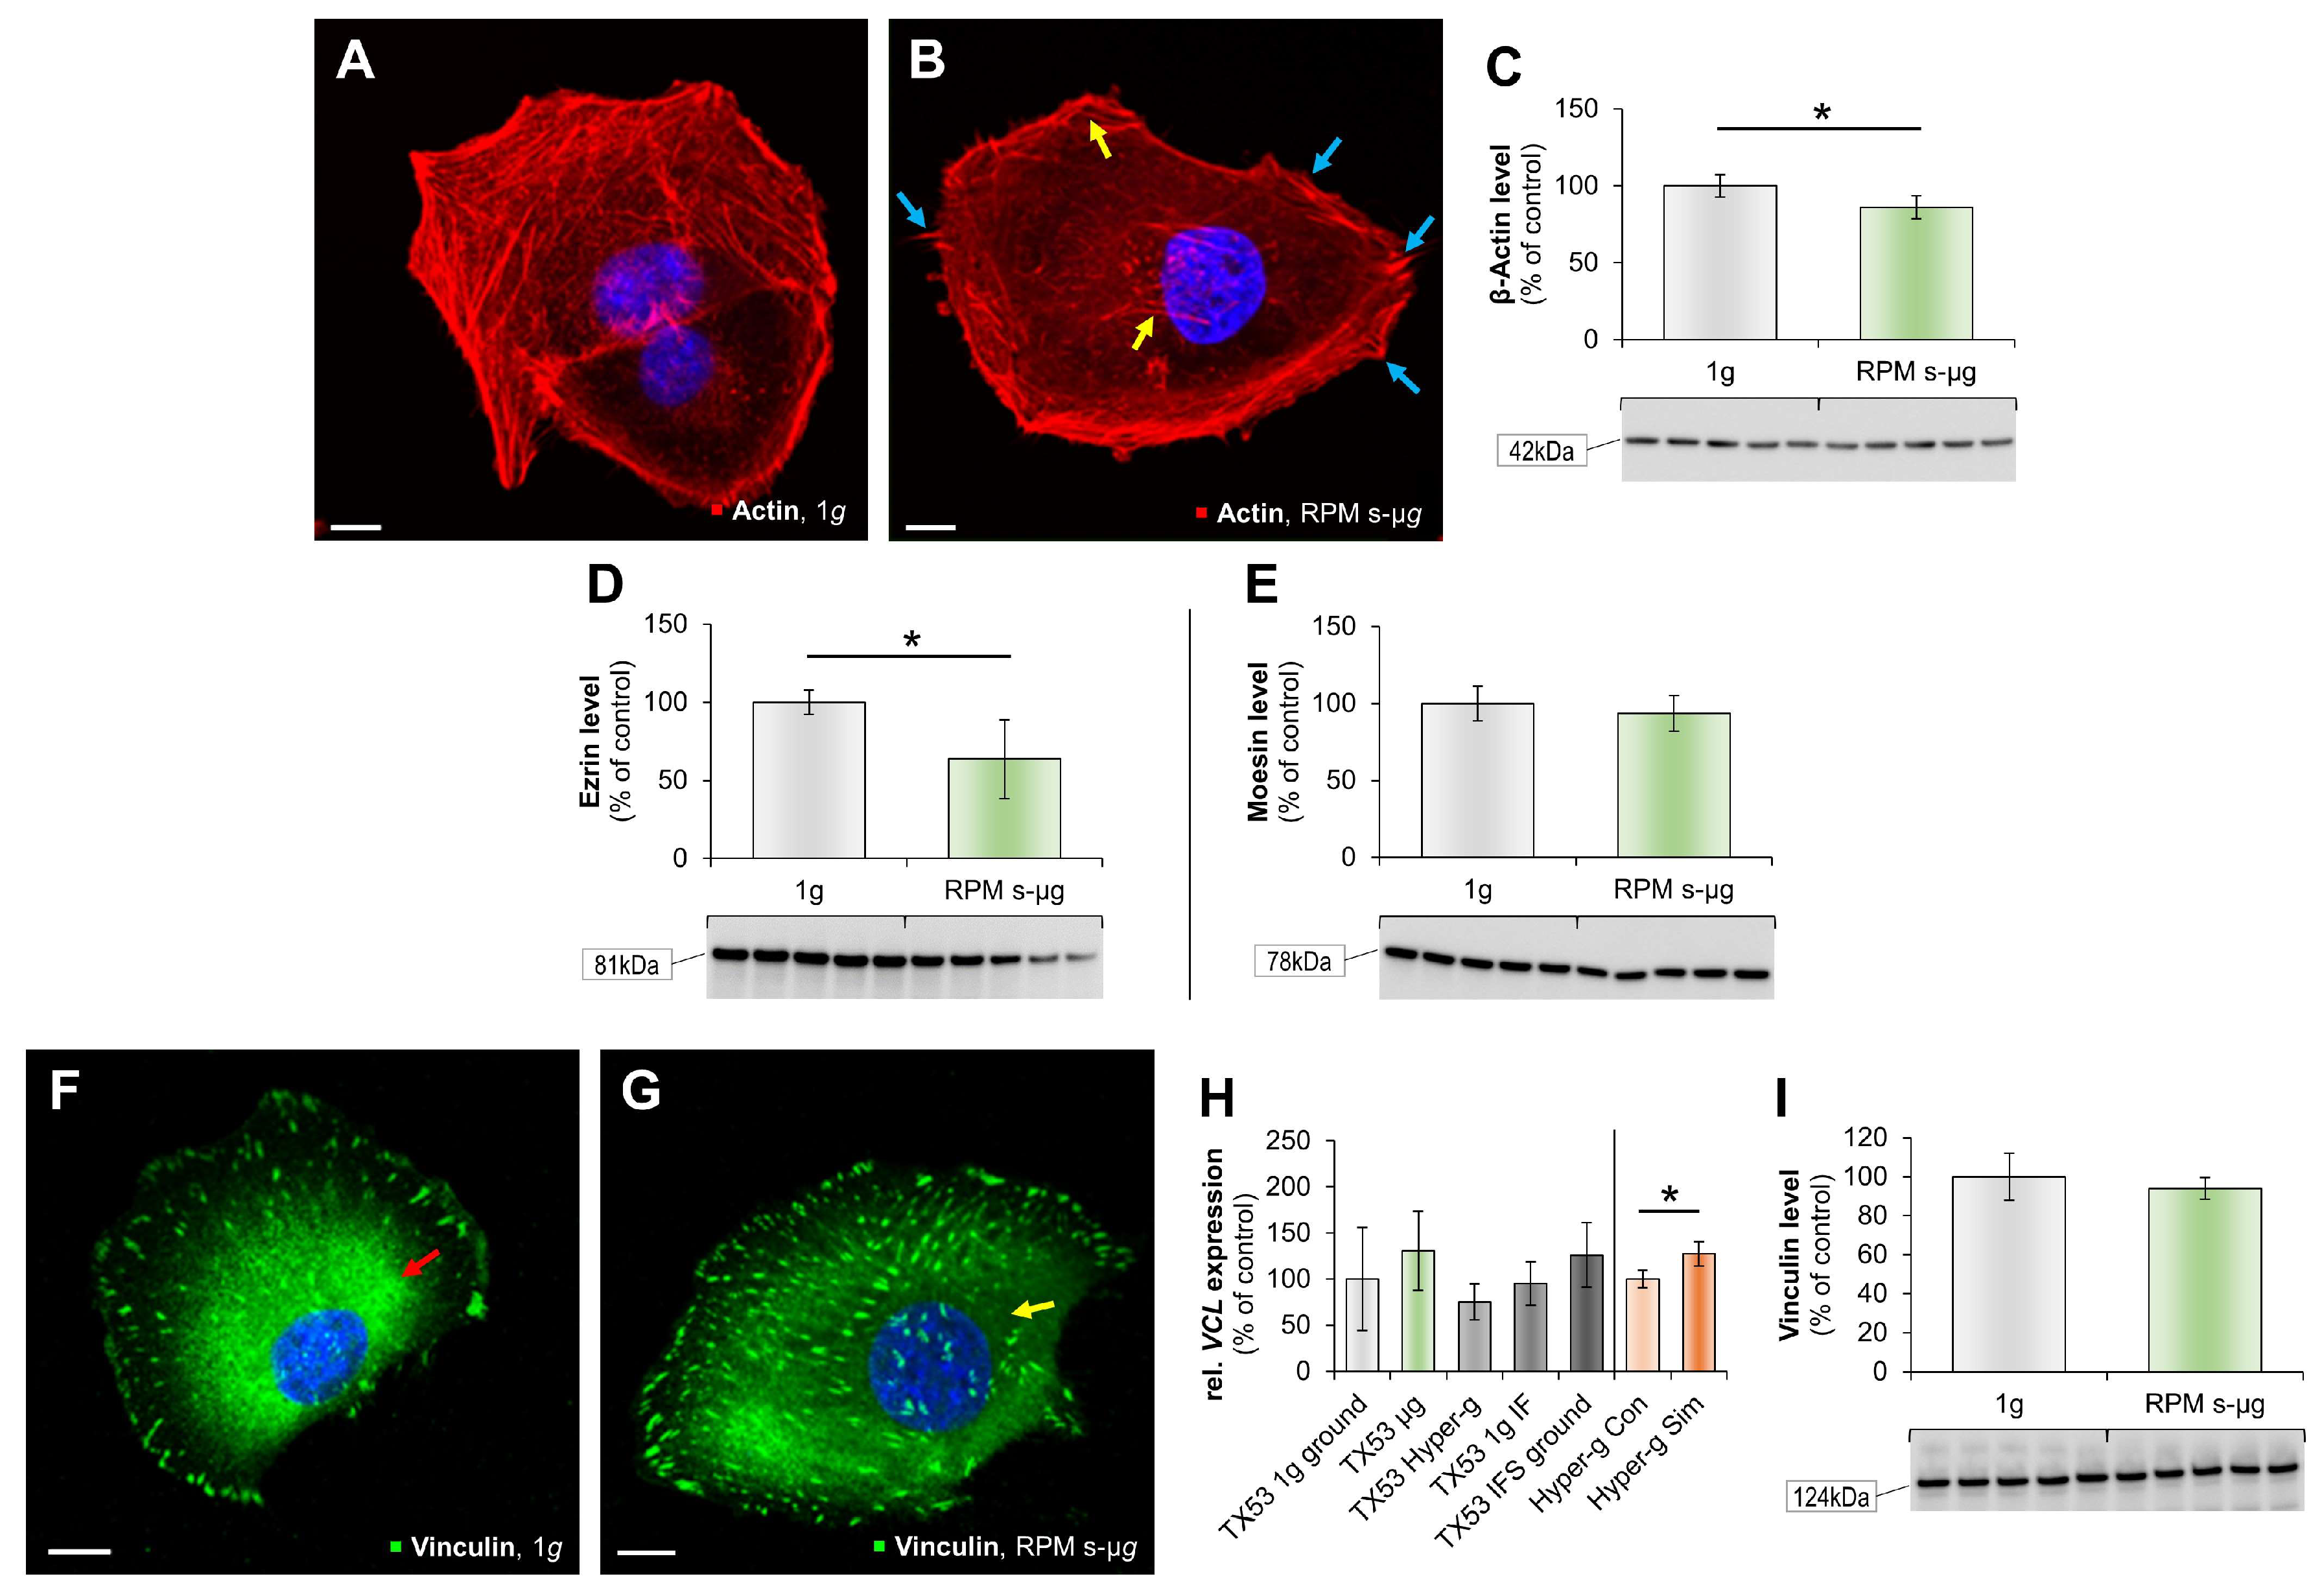
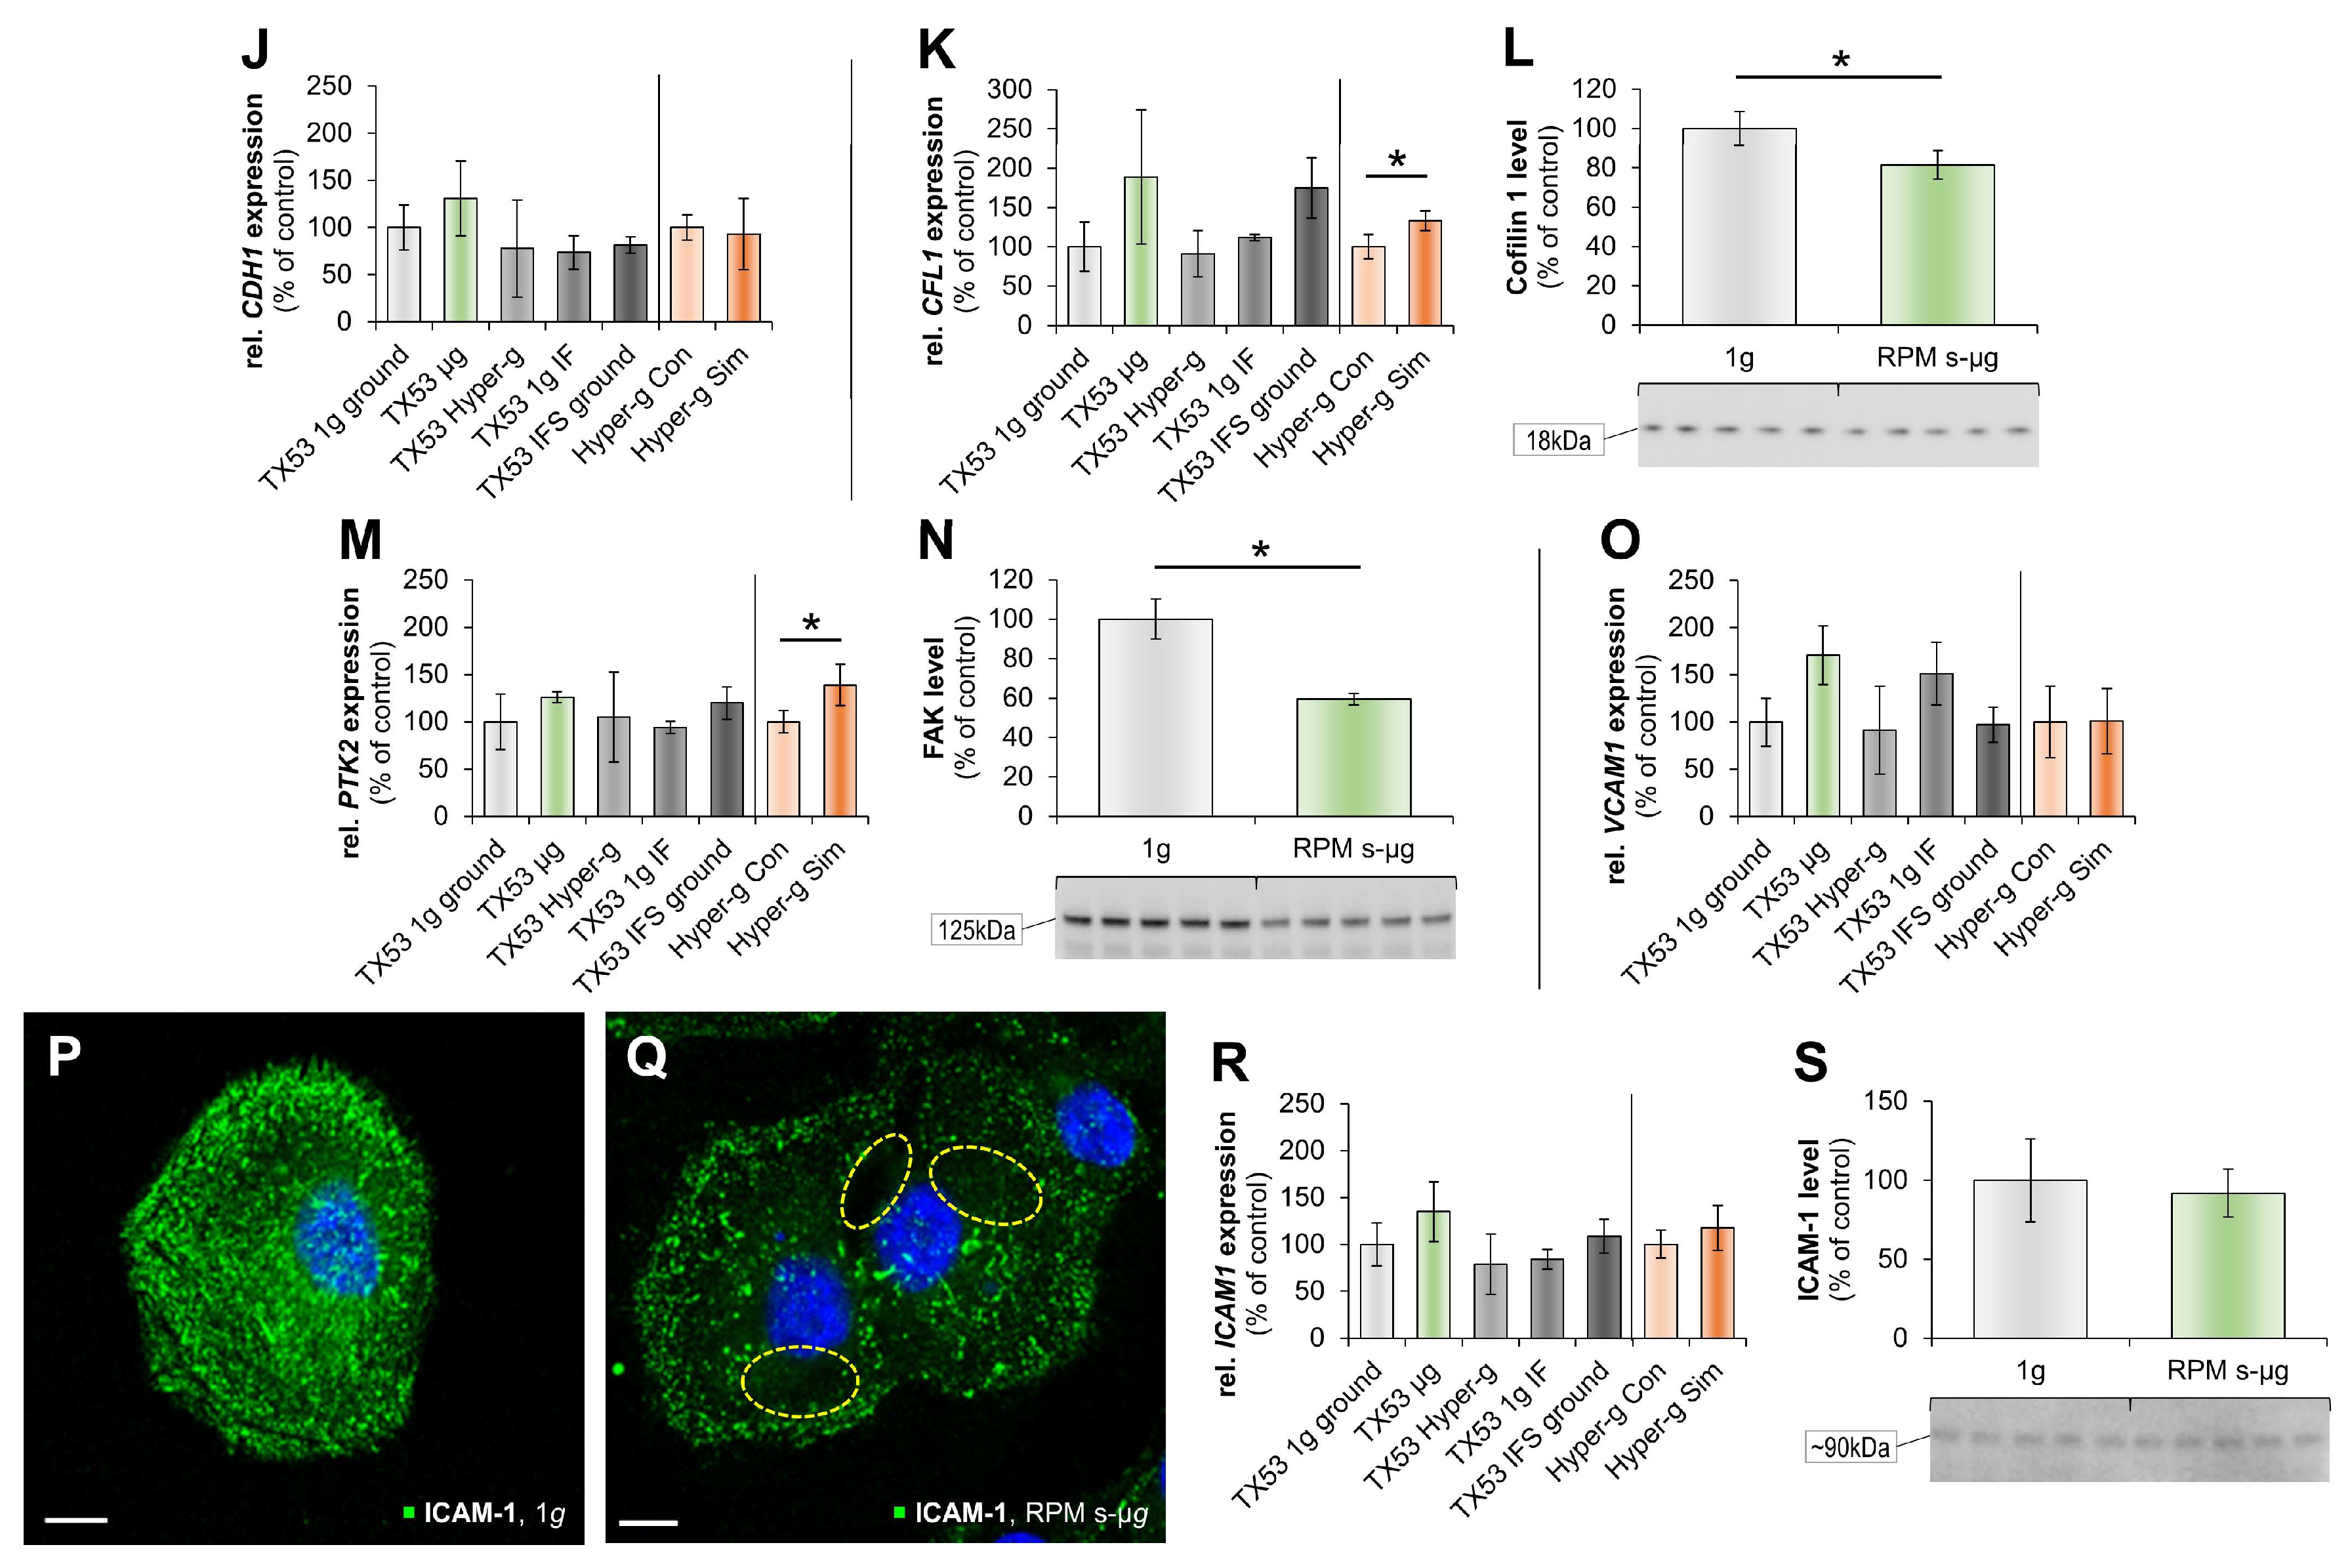
3.1. Impact of Microgravity on the Cytoskeleton

It is still unknown how cells are able to sense µg. An interesting and often discussed candidate for sensing and conduction of µg is the cellular cytoskeleton [30,31,32,33]. For this reason, we focused here on important cytoskeletal factors, associated focal adhesion complex molecules, and actin-binding proteins, which are all interconnected at the protein level (Figure 2).
The actin cytoskeleton network is one of the most intensively investigated structures in µg. It is involved in cell shape, migration and stress response, among others [34]. In previous studies we found that the β-actin expression in TC cells as well as in other cell types is remarkably regulated during short- and long-term exposure to s-µg and r-µg [8,11,23,27]. Following short-term r-µg the ACTB gene expression was upregulated in a matter of seconds, for example [27]. These findings were emphasized by live-cell imaging during a sounding rocket flight, where F-actin cytoskeleton re-arrangements were monitored immediately after entering the µg-phase [12]. Here, we investigated FTC-133 follicular TC cells exposed to a 6-min RPM-exposure and found similar changes which support the findings from the previous rocket mission TX52.
During the TEXUS mission, the ACTB gene expression was constant in all controls as well as after 1 min of hyper-g, either on the rocket or in the control-experiment [20]. However, the µg-samples presented a distinct downregulation of ACTB, which is in line with findings from short-term experiments during a parabolic flight mission [12]. In contrast, after 7-day and 14-day-exposure of FTC-133 cells on the RPM, ACTB was found to be highly upregulated [8]. This indicates a strong regulatory effect on the cells as they start to form 3D cell aggregates [8].
Ezrin (EZR) and moesin (MSN) are part of a focal adhesion complex and interconnect the plasma membrane to the cytoskeleton [35]. Moesin forms a complex with ezrin and is able to bind to actin [36,37]. These proteins are strikingly involved in the surface structure adhesion, migration and have been associated with some human cancers [38,39]. Ezrin and moesin have also been found to be modulated in previous µg-experiments with thyroid cells [12,28]. During a 24 h-exposure study on the RPM with the thyroid cancer cell line UCLA RO82-W-1, the EZR gene expression was significantly downregulated [28]. That is in alignment with the findings from the TEXUS flight, as only the expression in µg-samples was downregulated while controls and hyper-g probes were not affected [20] and corresponds to the reduction of ezrin protein during 6 min on the RPM (Figure 4D). Interestingly, the MSN gene expression was slightly downregulated in µg-samples and upregulated in hyper-g experiments. MSN was not found to be modulated during parabolic flights using microarray analyses [27]. However, a 24 h exposure on the RPM presented a downregulation in adherently growing cells, comparable to the present study [28].

3.2. Real Microgravity Changes the Extracellular Matrix

Furthermore, we investigated the ECM with a focus on fibronectin. Earlier detailed proteomic analyses have shown that FTC-133 cells express surface proteins that bind fibronectin, strengthening 3D growth [40]. These results are in agreement with our current data. We observed upregulated FN1 mRNA in r-µg samples. In a former study, ML1 follicular TC cells were exposed to parabolic flight conditions. It was demonstrated that the COL4A5 mRNA was downregulated under r-µg, whereas OPN and FN1 were significantly upregulated after 31 parabolas [27]. After six min r-µg the SPP1 gene expression was clearly elevated in r-µg samples (Figure 3H), but the COL4A5 mRNA kept a stable expression during the TEXUS flight (Figure 3F), indicating that the duration of µg exposure might play a role in the upregulation of this basement membrane gene. In addition, ML1 TC cells exposed to the RPM revealed an increased synthesis of collagen type I and III, fibronectin, laminin and chondroitin sulfate [41].
Lysyl oxidase (LOX; protein-lysine 6-oxidase), is a protein that is encoded by the LOX gene. LOX upregulation in cancer cells is of importance in tumorigenesis and may promote progression of the primary tumor. qPCR analysis displayed a LOX upregulation in the TEXUS r-µg group compared to all other groups (Figure 3R), the findings were confirmed by microarray technology. The LOX enzyme supports the cross-linking of collagen and elastin, which are both ECM components [42] and LOX gene expression was identified as promoting culture flask adherence of EA.hy926 cells [25]. During the Sino/German Simbox/Shenzhou-8 spaceflight mission, where the ECM linker LOX was virtually switched off, very large multicellular spheroids were formed [43].
The collagen homeostasis is maintained via collagen synthesis and degradation by the TC cells and is influenced by matrix metalloproteinases (MMPs). The MMPs themselves are regulated by TIMPs [44]. Little is known about matrix metalloproteinases and follicular TC. TIMP-1 was identified as a biomarker candidate for papillary TC [45]. Recently, the TIMP-1 secretion of space-flown FTC-133 cells was measured as 2.8-fold elevated. In parallel, the MMP-3 release was 5.94-fold elevated in ISS space samples compared to 1g-samples [46]. These results contradict earlier results. Following the SimBox/Shenzhou-8 space mission we detected a reduced MMP-3 secretion in both, RPM-samples and in space-flown samples [11]. The ECM plays a key role in tissue maintenance and integrity [47]. MMPs degrade the ECM and are involved in cancer progression and MMP activity is regulated by TIMPs [48]. The mode of action of TIMPs in cancer is yet not known, but there are reports about tumor suppression and tumor progression properties [49]. Here we found an increase in TIMP1, MMP1, MMP3 and MMP14 mRNA expression in r-µg-samples (Figure 3K–N), indicating an activation in orbit. These results support the data obtained from the ISS spaceflight in 2014 [46].
We detected an upregulation of the TGFB1 gene expression in the r-µg group as compared to 1g-control cells (Figure 3J). No change was found after centrifugation. TGF-β1 is a growth factor and a multifunctional cytokine. It is involved in biological processes like cell proliferation, adhesion and differentiation, and is therefore, a target in cancer therapy [50].

3.3. Alteration of Focal Adhesion Proteins

Focal adhesions or cell–matrix adhesions mediate cell signaling in response to ECM adhesion and serve as mechanical linkages to the ECM. Focal adhesions are known to be important gravisensors [51,52]. To determine alterations in focal adhesion proteins, we focused on vinculin as a first point of interest. Vinculin has a vital role in mechanotransduction with integrins at focal adhesion sites [53]. Vinculin also directly interacts with talin, integrins and actin, hence allowing a proper cellular migration and orchestrating focal adhesion [54]. In addition, vinculin is a component of the adherence junctions and mediates cellular and extracellular signals. The VCL gene expression was not altered by µg, but elevated by centrifugation (Figure 4H). Structure and morphology of vinculin was visualized by IFS (Figure 4F,G). Interesting changes were visible by RPM-exposure (Figure 4G). Vinculin was disarranged in s-µg, indicating a clear reaction to the low-gravity condition.
Another important focal adhesion factor is the cytosolic and mechanosensitive protein talin-1 (TLN1). It links integrin directly and indirectly via vinculin to the cytoskeleton. Integrins bind to talin and talin binds to vinculin and thus influence cell adhesion. In addition, the integrin receptors are involved in the attachment of adherent cells to the ECM. Talin is a mechanosensitive protein and is connecting integrins and the actin-cytoskeleton. It links actin to the integrin-β1, which is inserted in the plasma membrane [55]. It is especially enriched in regions of cell-cell contacts and adhesion to substrate [56]. Because of its function, it is of high interest when cells transit from a two-dimensional (2D) cell growth to a 3D cell growth in µg. These 3D-aggregates or multicellular spheroids resemble the in vivo situation much closer than conventional cell cultures, making them extremely valuable for cancer research [6,57]. A downregulation of TLN1 in the early state of µg might be an indication for detachment of the cells from the substrate [20]. On the background that talin has a vinculin-binding site and can recruit vinculin, it forms a complex with integrins and is thus inducing cell adhesion.
Integrin-β1 (ITGB1) is a subunit of a plasma membrane associate receptor family which primarily detects ECM components [58]. It is bound to and activated by talin [59]. ITGB1 was not regulated in any experimental condition [20]. This is in in alignment with findings from short-term µg-experiments conducted during parabolic flight missions as ITGB1 was not regulated as well [27]. Interestingly, ITGB1 was regulated when human Nthy-ori-3-1 cells were exposed to a RPM for 24 h suggesting that the regulation is cell type-, time- or µg-origin-dependent [29].
In a next step, we focused on E-cadherin. Cadherins are Ca2+ -dependent cell adhesion molecules in the cell-cell adherence junction, which belongs to the plasma membrane and is connected to cytoskeletal actin filaments [60]. E-cadherin’s intracellular domains are connected to the cytoskeleton and its stability is regulated by catenin D1 [61], which can affect cell-cell adhesion [62]. E-cadherin is downregulated in tumors and multicellular MCF-7 breast cancer spheroids engineered by a 14-day RPM exposure and are known to be involved in metastasis [63]. The loss of E-cadherin expression in association with the epithelial–mesenchymal transition occurs frequently during tumor metastasis. The regulation of the adhesive activity of E-cadherin present at the cell surface by an inside-out signaling mechanism is important in cancer [64]. In this experiment, we found a slight increase in CDH1 mRNA in the r-µg group, but no changes in all other groups (Figure 4J). This is an interesting finding because the E-cadherin (CDH1) expression in cancer cells exposed to r-µg is an unknown area. Proteomic pathway analyses demonstrated changes in papillary TC which were associated with the disruption of cell contacts (loss of E-cadherin), actin cytoskeleton dynamics and loss of differentiation markers, all hallmarks of an invasive phenotype [65].
We focused on the actin-binding protein cofilin, which disassembles actin filaments and influences the actin dynamics [66]. We determined the CFL1 gene expression and found an elevation in the r-µg group compared with the respective controls (Figure 4K). In addition, the gene was upregulated by 18g-centrifugation, while the protein concentration was reduced after 6 min on the RPM (Figure 4L). Little is known concerning the impact of cofilin in follicular TC. An interesting proteomic analysis was published recently [66]. The authors investigated the fine needle aspiration fluid protein patterns of papillary thyroid carcinomas. A statistically significant upregulation of cofilin-1 was detected among others [67]. Cofilin-1 is determining the direction of cell migration and has importance for metastasis in papillary thyroid cancer [68]. Future experiments will be necessary to study cofilin-1 in follicular thyroid cancer in detail.
Furthermore, we studied focal adhesion kinase 1 (protein tyrosine kinase 2, PTK2), which plays an important part during cell migration. Interestingly, FAK1/PTK2 gene expression did not change by the sounding rocket flight, but it was upregulated by centrifugation. Recently, we showed that FTC-133 cells growing in monolayers or in spheroids after RPM-exposure incorporate vinculin, paxillin, focal adhesion kinase 1, and adenine diphosphate (ADP)-ribosylation factor 6 in different ways into the focal adhesion complex [69].
In summary, we were able show that focal adhesion proteins are important gravi-sensors and link the information to the ECM and the cytoskeleton.
In addition, we investigated the cell adhesion molecules ICAM-1 and VCAM-1. We had learned from the ISS CellBox-1 space mission that VCAM-1, TIMP1, protein kinase Cα and others are involved in the inhibition of spheroid formation under r-µg [46]. Interestingly, both ICAM1 and VCAM1 mRNA expressions were slightly elevated in r-µg-samples. They were not significantly altered after 18g-centrifugation or RPM-exposure. This finding might be due to the short µg-exposure time.

3.4. Impact of altered gravity on cytokines

Centrifugation with 18g hyper-g and simulating the 31 parabolas of a parabolic flight induced the gene expression of IL6 and CXCL8 in ML1 TC cells [26]. Here, we found a similar result. Short-term 18g-centrifugation upregulated both IL6 and CXCL8 mRNAs. In addition, there was an increase detectable in both genes in the r-µg group. These results confirmed earlier data, when TC cells were exposed to the RPM. We did observe that the IL6 gene expression was enhanced in FTC-133 thyroid cancer cells, which remained adherent for 24 h on the RPM [23]. Similar results were obtained when human follicular epithelial thyroid Nthy-ori 3-1 cells were incubated for up to 72 h on the RPM [9]. Both cytokines have shown to have a 3D growth-promoting effect on follicular cancer spheroids [24]. In summary, the cytokines IL-6 and IL-8 are involved in migration and growth in thyroid cancer, and both are sensitive to altered gravity conditions. They seem to be involved in the initiation of MCS formation via focal adhesion proteins of benign cells [9] and cancer cells.
Taken together, our findings suggest that µg is a much stronger trigger for gene expression changes than hyper-g. This enables us to adjust some controls in favor of µg-samples in future space missions, which will result in increased scientific output and saves resources.

4. Materials and Methods

4.1. Cell Cultures

Cell culture and preparation of the experiments were performed as previously described in detail [20]. In short, FTC-133 poorly differentiated follicular thyroid cancer cells (Sigma Aldrich, St. Louis, MO, USA) were seeded into cell culture chambers at a defined density of 106 cells/chamber one day prior to the rocket launch (Figure 5A). These cell culture chambers were placed into late access unites, which ensured introduction into the rocket very close to launch (Figure 5B). During flight the cells were exposed to a variety of stressors, besides an on-flight 1g-centrifuge (Figure 5C). To discriminate between effects of µg and the different stressors the cell culture chambers were fled with RNAlater (Thermofisher Scientific, Waltham, MA, USA) fixative at defined time points (Figure 5D), resulting in samples to be analyzed for gene expression changes back in the home laboratory. Furthermore, FTC-133 cells were exposed to worst case-hyper-g on a centrifuge for 1 min which could have been the case during sounding rocket launch [20].

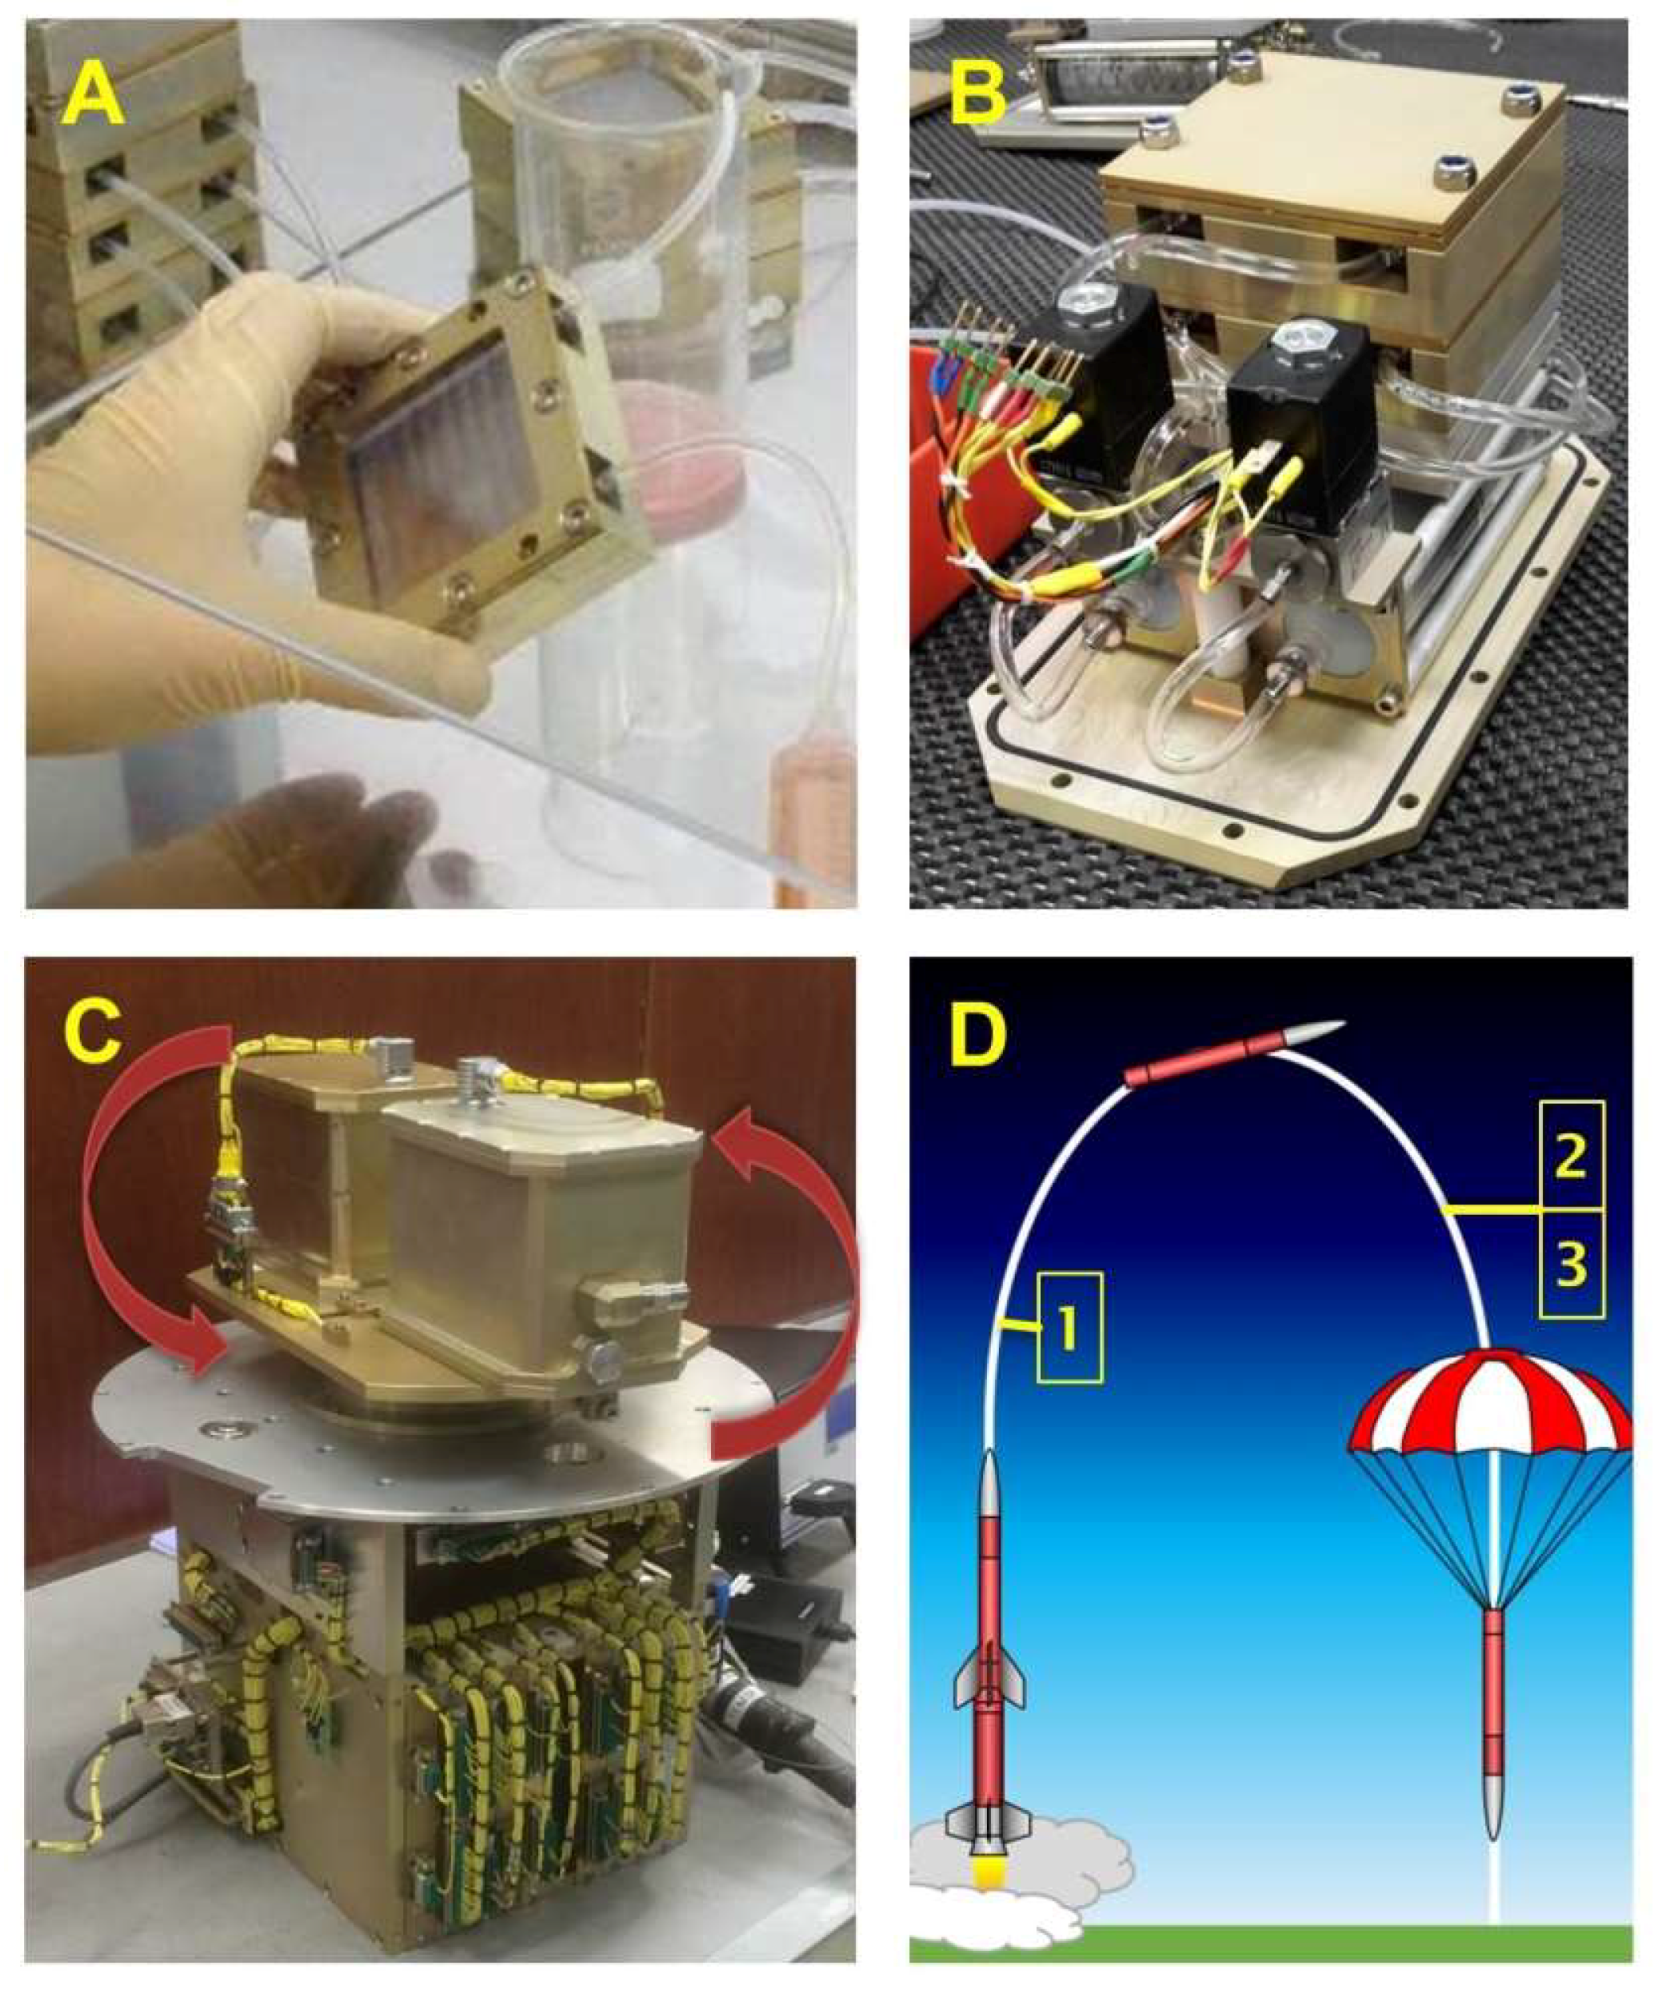
4.2. TEXUS Sounding Rocket Mission

Investigated conditions ranged from different 1g-controls, to hyper-g- and µg-samples as described before [20]. In short, during a sounding rocket flight the launch phase of 1 min can reach an acceleration of up to 12g which could have an effect on the cells (sample: TX53 Hyper-g). After the launch, the payload enters a 6 min µg-phase during which one part of the samples are kept on a 1g-centrifuge (sample: In-flight 1g-centrifuge), as a control, while the other part is exposed to µg (sample: TX53 µg). Shortly before re-entering the Earth atmosphere samples are fixed as described before. In addition to the flight samples, on ground 1g controls were performed with the cells kept horizontal (sample: TX53 Ground Control) and vertical (sample: TX53 In-flight 1g sim.). The vertical control was done due to the special arrangement of the cells on the in-flight centrifuge. Finally, a worst-case hyper-g experiment was performed keeping the cells on a centrifuge with 18g for 1 min (sample: Hyper-g 1 min).

4.3. Random Positioning Machine

Simulated µg (s-µg) was performed on the desktop RPM (Airbus Defence and Space (ADS), Leiden, The Netherlands) located in a standard incubator (37 °C and 5% CO2) as previously described [70].
In brief, the RPM was operated in real random mode with random interval and direction with a maximum speed of 12.5 revolutions per minute. In each case sample flasks were placed onto the middle frame with a maximum distance of 7 cm to the center of rotation providing a µg quality in the range of 10−4–10−2 g (n = 5 samples each group/run) [10,71]. Samples were run on the RPM for 6 min to mimic the µg-phase of the sounding rocket flight. The RPM-samples and the corresponding static 1g-control flasks were completely filled with medium. The 1g-samples were placed in the incubator next to the RPM (n = 5 samples each group/run).

4.4. F-actin Staining

F-actin was visualized by means of rhodamine-phalloidin staining (Molecular Probes®, Eugene, OR, USA). The nuclei were stained with Hoechst 33342 (Molecular Probes®). The method was published earlier [72,73].

4.5. Confocal Laser Scanning Microscopy (CLSM)

The stained samples were examined using a confocal laser scanning microscope (LSM 780, Zeiss, Jena, Germany) using 40× oil-immersion objective with a NA of 1.3 [74].

4.6. Immunofluorescence of Fibronectin, Vinculin and ICAM-1

Immunofluorescence staining was performed to visualize changes in fibronectin, vinculin and ICAM-1 proteins. After the experiments, the cells were washed three times with PBS and afterwards fixed in 4% PFA (Sigma-Aldrich) for 30 min at room temperature. The primary antibodies (fibronectin, (Invitrogen, Carlsbad, CA, USA), mouse, dilution 1:100, vinculin (Abcam, Cambridge, UK), mouse, dilution 1:200, ICAM1, (Cell Signaling Technology, Danvers, MA, USA), rabbit, dilution 1:200) were applied for 24 h. Then the slides were washed three times with PBS before incubation with secondary antibodies (AF488 conjugated anti-mouse/rabbit: 1:500, both Cell Signaling Technology) for 2 h. Nuclei were stained with DAPI (4′,6-diamidino-2-phenylindole) (Invitrogen) and mounted with Vectashield. Afterwards the slides were investigated by CLSM (LSM 780, Zeiss, Jena, Germany).

4.7. Western Blot Analysis

Western blotting was performed as described earlier [72,73]. In each experiment (performed three times) five different culture flasks were subjected to either s-µg or 1g. At the end of the experiment cells were collected and solubilized in lysis buffer. Following lysis and centrifugation, aliquots of 30 µg were subjected to SDS-PAGE and Western blotting. For the RPM-samples five lanes representing the AD cells and five lanes representing AD static 1g-control cells were loaded. The samples were loaded on Criterion XT 4–12% precast gels (BioRad, Hercules, CA, USA) and run for 1h at 150 volts. Proteins were then transfer with a TurboBlot (Biorad) (100 V, 30 min) to a PVDF membrane. Glycerine aldehyde-3-phosphate-dehydrogenase (GAPDH) was used as a loading control.
Membranes were then blocked 2 h in TBS-T containing 0.3% I-Block (Applied Biosystems, Foster City, CA, USA). For detection of the selected antigens (see Table 2) the membranes were incubated overnight at room temperature in TBS-T and 0.3% I-Block solutions of the antibodies. Following three washing steps of 5 min membranes were incubated additionally 2 h at room temperature secondary with a Horseradish peroxidase (HRP)-linked antibody (Cell Signaling Technology Inc., Danvers, MA, USA) diluted 1:4000 in TBS-T and 0.3% I-Block. The respective protein bands were visualized using BioRad Clarity Western ECL (BioRad) and images were captured with Image Quant LAS 4000 mini (GE Healthcare Life Science, Freiburg, Germany). Images of stained membranes were captured on Syngene PXi 4EZ image analysis system (Synoptics, Cambridge, UK) and analyzed using the ImageJ software (U.S. National Institutes of Health, Bethesda, MD, USA; http://rsb.info.nih.gov/ij/) for densitometric quantification of the respective bands and total protein load.

4.8. Postflight qPCR Analysis

qPCR analysis was performed as previously described [42]. In short, samples from the mission were transported and stored in RNAlater. In addition, samples from hyper-g experiments were investigated. RNA was isolated from cells using the RNAeasy kit (Qiagen, Venlo, The Netherlands) following the manufactures instructions. After concentration determination via Nanodrop 2000, cDNA was produced using the first strand cDNA kit (Thermo Scientific, Waltham, MA, USA). qPCR was performed using the FAST SYBR® Select Master Mix (Applied Biosystem) and the 7500 Fast Real-Time PCR System (Applied Biosystems) to determine the expression levels of the target genes (Table 3). The selected primers were designed to span exon-exon junctions and to have a Tm of 60 °C using NCBI Primer Blast and were synthesized by TIB Molbiol (Berlin, Germany). Samples were normalized to 18S rRNA and measured in triplicates. We used the comparative threshold cycle (ΔΔCT) method for relative quantification of transcription levels, with “TX53 Ground Control” set as 100%.

4.9. In-silico Analyses

In-silico analyses were performed as described by Bauer et al. [22]. To investigate the mutual interactions of detected proteins, the UniProt accession numbers of the selected targets were induced in a Pathway Studio v.11 software (Elsevier Research Solutions, Amsterdam, The Netherlands) [63,69].

4.10. Microarray Analysis

Microarray analyses were performed as described by Kopp et al. [20].

4.11. Statistics

Statistical evaluation was performed using SPSS 15.0 (SPSS, Inc., Chicago, IL, USA). The Mann-Whitney-U-Test was used to compare the different conditions. All data is presented as mean ± standard deviation (SD) with a significance level of * p <  0.05.

5. Conclusions

Taken together, simulated hyper-g induced the gene expression of COL1A1, VCL, CFL1, PTK2, IL6, CXCL8 and MMP14.
Unfortunately, after the TX53 mission, we noticed that only two r-µg samples were fixed with RNAlater [20], so that no statistical evaluation was possible. qPCR measured elevated mRNA of the ECM genes FN1, SPP1, TGFB1, TIMP1, MMP1, MMP3, MMP14. In addition, the cell adhesion genes ICAM1 and VCAM1, the focal adhesion factors CFL1 and CDH1 as well as cytokines IL6 and CXCL8 were upregulated in r-µg samples. All these factors have demonstrated their gravi-sensitivity. FN1 and TIMP1 are recently proposed as potential target genes in papillary TC [75]. Downregulation of E-cadherin plays a role in metastasis, and the restoration of E-cadherin inhibits tumor growth. Antibodies reducing E-cadherin activity favor MCS formation, and PP2, blocking the E-cadherin reducer SRC prevents MCS formation in vitro [63]. Therefore, E-cadherin seems to be an interesting target in follicular TC. Future detailed investigations focusing on E-cadherin/β-catenin signaling will be performed.
Furthermore, we were able to show that µg achieved by a sounding rocket flight is a strong trigger for gene expression changes in FTC-133 cells. Future studies during TEXUS sounding rocket missions will be performed in order to increase the number of samples.

Author Contributions

Sounding rocket flight, A.S., B.S., H.O., and S.F.; Conceptualization, D.G. and J.B.; methodology, S.K., M.Z.N., J.S., T.J.B., and D.M.; Software, H.S. and J.B.; Validation, D.G., T.J.C., S.K., M.K. and D.M.; Formal analysis, S.K., J.S., and M.W.; Investigation, S.K.; Resources, M.I.; Writing—Original draft preparation, S.K., T.J.C, M.K., D.G., J.B.; Project administration, D.G.; funding acquisition, D.G. and M.I..

Funding

This research was funded by the German Space Agency (DLR; BMWi project 50WB1524).

Acknowledgments

We like to thank Otfried Joop and Markus Braun (German Space Agency DLR, Bonn) for their support and for giving us the possibility to attend the TEXUS mission in Kiruna, Sweden. This paper was presented at the 69th International Astronautical Congress, 1–5 October 2018, Bremen, Germany. www.iafastro.org.

Conflicts of Interest

The authors declare no conflict of interest. The funders had no role in the design of the study; in the collection, analyses, or interpretation of data; in the writing of the manuscript, or in the decision to publish the results.

Abbreviations

µgMicrogravity
2Dtwo-dimensional
3Dthree-dimensional
ADadherently growing
ADSAirbus Defence and Space
CDH1Cadherin-1/E-cadherin
CFL1Cofilin
COL1A1/COL4A5Collagen 1A1/Collagen 4A5
CXCL8Interleukin 8
ECMExtracellular Matrix
ERMEzrin-Radixin-Moesin
FN1Fibronectin 1
ICAM1Intercellular adhesion molecule 1
IL6Interleukin 6
IMSImmunofluorescence staining
ITGB1Integrin beta-1
LOXProtein-lysine 6-oxidase
MCSMulticellular spheroids
MMPsMatrix metalloproteinases
PTK2/FAK1Focal adhesion kinase 1
qPCRQuantitative PCR
r-real-
RAIRadioiodine therapy
RPMRandom Positioning Machine
s-simulated-
SPP1Secreted Phosphoprotein 1 / Osteopontin
TCThyroid cancer
TGFB1Transforming growth factor beta-1
TIMP1Metallopeptidase (proteinase) inhibitor 1
TXTEXUS
VCAM1Vascular cell adhesion protein 1
ADMAdrenomedullin
GJB2Gap junction beta-2 protein
PFKFB46-phosphofructo-2-kinase/fructose-2,6-biphospatase 4
KISS1RKiSS-1 receptor
NDRG1Protein NDRG1
IGFBP3Insulin-like growth factor-binding protein 3

References

  1. Bray, F.; Ferlay, J.; Soerjomataram, I.; Siegel, R.L.; Torre, L.A.; Jemal, A. Global cancer statistics 2018: Globocan estimates of incidence and mortality worldwide for 36 cancers in 185 countries. CA Cancer J. Clin. 2018, 68, 394–424. [Google Scholar] [CrossRef] [PubMed]
  2. Ancker, O.V.; Wehland, M.; Bauer, J.; Infanger, M.; Grimm, D. The adverse effect of hypertension in the treatment of thyroid cancer with multi-kinase inhibitors. Int. J. Mol. Sci. 2017, 18, 625. [Google Scholar] [CrossRef] [PubMed]
  3. Omur, O.; Baran, Y. An update on molecular biology of thyroid cancers. Crit. Rev. Oncol. Hematol. 2014, 90, 233–252. [Google Scholar] [CrossRef] [PubMed] [Green Version]
  4. Laursen, R.; Wehland, M.; Kopp, S.; Pietsch, J.; Infanger, M.; Grosse, J.; Grimm, D. Effects and role of multikinase inhibitors in thyroid cancer. Curr. Pharm. Des. 2016, 22, 5915–5926. [Google Scholar] [CrossRef] [PubMed]
  5. Grimm, D.; Egli, M.; Kruger, M.; Riwaldt, S.; Corydon, T.J.; Kopp, S.; Wehland, M.; Wise, P.; Infanger, M.; Mann, V.; et al. Tissue engineering under microgravity conditions-use of stem cells and specialized cells. Stem Cells Dev. 2018, 27, 787–804. [Google Scholar] [CrossRef] [PubMed]
  6. Grimm, D.; Wehland, M.; Pietsch, J.; Aleshcheva, G.; Wise, P.; van Loon, J.; Ulbrich, C.; Magnusson, N.E.; Infanger, M.; Bauer, J. Growing tissues in real and simulated microgravity: New methods for tissue engineering. Tissue Eng. Part B Rev. 2014, 20, 555–566. [Google Scholar] [CrossRef] [PubMed]
  7. Strauch, S.M.; Grimm, D.; Corydon, T.J.; Krüger, M.; Bauer, J.; Lebert, M.; Wise, P.; Infanger, M.; Richter, P. Current knowledge about the impact of microgravity on the proteome. Expert Rev. Proteom. 2018, 1–12. [Google Scholar] [CrossRef] [PubMed]
  8. Kopp, S.; Warnke, E.; Wehland, M.; Aleshcheva, G.; Magnusson, N.E.; Hemmersbach, R.; Corydon, T.J.; Bauer, J.; Infanger, M.; Grimm, D. Mechanisms of three-dimensional growth of thyroid cells during long-term simulated microgravity. Sci. Rep. 2015, 5, 16691. [Google Scholar] [CrossRef] [PubMed] [Green Version]
  9. Warnke, E.; Pietsch, J.; Kopp, S.; Bauer, J.; Sahana, J.; Wehland, M.; Krüger, M.; Hemmersbach, R.; Infanger, M.; Lützenberg, R.; et al. Cytokine release and focal adhesion proteins in normal thyroid cells cultured on the random positioning machine. Cell. Physiol. Biochem. 2017, 43, 257–270. [Google Scholar] [CrossRef] [PubMed]
  10. Warnke, E.; Pietsch, J.; Wehland, M.; Bauer, J.; Infanger, M.; Görög, M.; Hemmersbach, R.; Braun, M.; Ma, X.; Sahana, J.; et al. Spheroid formation of human thyroid cancer cells under simulated microgravity: A possible role of CTGF and CAV1. Cell Commun. Signal. 2014, 12, 32. [Google Scholar] [CrossRef]
  11. Ma, X.; Pietsch, J.; Wehland, M.; Schulz, H.; Saar, K.; Hübner, N.; Bauer, J.; Braun, M.; Schwarzwälder, A.; Segerer, J.; et al. Differential gene expression profile and altered cytokine secretion of thyroid cancer cells in space. FASEB J. 2014, 28, 813–835. [Google Scholar] [CrossRef] [PubMed] [Green Version]
  12. Corydon, T.J.; Kopp, S.; Wehland, M.; Braun, M.; Schütte, A.; Mayer, T.; Hulsing, T.; Oltmann, H.; Schmitz, B.; Hemmersbach, R.; et al. Alterations of the cytoskeleton in human cells in space proved by life-cell imaging. Sci. Rep. 2016, 6, 20043. [Google Scholar] [CrossRef] [PubMed] [Green Version]
  13. Ingber, D. How cells (might) sense microgravity. FASEB J. 1999, 13, S3–S15. [Google Scholar] [CrossRef] [PubMed]
  14. Ingber, D.E.; Wang, N.; Stamenovic, D. Tensegrity, cellular biophysics, and the mechanics of living systems. Rep. Prog. Phys. 2014, 77, 046603. [Google Scholar] [CrossRef] [PubMed] [Green Version]
  15. Schoenwaelder, S.M.; Burridge, K. Bidirectional signaling between the cytoskeleton and integrins. Curr. Opin. Cell Biol. 1999, 11, 274–286. [Google Scholar] [CrossRef]
  16. Yamada, K.M.; Geiger, B. Molecular interactions in cell adhesion complexes. Curr. Opin. Cell Biol. 1997, 9, 76–85. [Google Scholar] [CrossRef]
  17. Calderwood, D.A.; Shattil, S.J.; Ginsberg, M.H. Integrins and actin filaments: Reciprocal regulation of cell adhesion and signaling. J. Biol. Chem. 2000, 275, 22607–22610. [Google Scholar] [CrossRef] [PubMed]
  18. McClatchey, A.I. Erm proteins at a glance. J. Cell Sci. 2014, 127, 3199–3204. [Google Scholar] [CrossRef] [PubMed]
  19. Schwartz, M.A. Integrins and extracellular matrix in mechanotransduction. Cold Spring Harb. Perspect. Biol. 2010, 2, a005066. [Google Scholar] [CrossRef]
  20. Kopp, S.; Krüger, M.; Feldmann, S.; Oltmann, H.; Schütte, A.; Schmitz, B.; Bauer, J.; Schulz, H.; Saar, K.; Huebner, N.; et al. Thyroid cancer cells in space during the texus-53 sounding rocket mission—The thyroid project. Sci. Rep. 2018, 8, 10355. [Google Scholar] [CrossRef]
  21. Bauer, J.; Grimm, D.; Gombocz, E. Semantic analysis of thyroid cancer cell proteins obtained from rare research opportunities. J. Biomed. Inform. 2017, 76, 138–153. [Google Scholar] [CrossRef] [PubMed]
  22. Bauer, J.; Wehland, M.; Infanger, M.; Grimm, D.; Gombocz, E. Semantic analysis of posttranslational modification of proteins accumulated in thyroid cancer cells exposed to simulated microgravity. Int. J. Mol. Sci. 2018, 19, 2257. [Google Scholar] [CrossRef] [PubMed]
  23. Grosse, J.; Wehland, M.; Pietsch, J.; Schulz, H.; Saar, K.; Hubner, N.; Eilles, C.; Bauer, J.; Abou-El-Ardat, K.; Baatout, S.; et al. Gravity-sensitive signaling drives 3-dimensional formation of multicellular thyroid cancer spheroids. FASEB J. 2012, 26, 5124–5140. [Google Scholar] [CrossRef] [PubMed]
  24. Svejgaard, B.; Wehland, M.; Ma, X.; Kopp, S.; Sahana, J.; Warnke, E.; Aleshcheva, G.; Hemmersbach, R.; Hauslage, J.; Grosse, J.; et al. Common effects on cancer cells exerted by a random positioning machine and a 2d clinostat. PLoS ONE 2015, 10, e0135157. [Google Scholar] [CrossRef] [PubMed]
  25. Ma, X.; Wehland, M.; Schulz, H.; Saar, K.; Hübner, N.; Infanger, M.; Bauer, J.; Grimm, D. Genomic approach to identify factors that drive the formation of three-dimensional structures by ea.Hy926 endothelial cells. PLoS ONE 2013, 8, e64402. [Google Scholar] [CrossRef]
  26. Ma, X.; Wehland, M.; Aleshcheva, G.; Hauslage, J.; Wasser, K.; Hemmersbach, R.; Infanger, M.; Bauer, J.; Grimm, D. Interleukin-6 expression under gravitational stress due to vibration and hypergravity in follicular thyroid cancer cells. PLoS ONE 2013, 8, e68140. [Google Scholar] [CrossRef]
  27. Ulbrich, C.; Pietsch, J.; Grosse, J.; Wehland, M.; Schulz, H.; Saar, K.; Hubner, N.; Hauslage, J.; Hemmersbach, R.; Braun, M.; et al. Differential gene regulation under altered gravity conditions in follicular thyroid cancer cells: Relationship between the extracellular matrix and the cytoskeleton. Cell. Physiol. Biochem. 2011, 28, 185–198. [Google Scholar] [CrossRef]
  28. Riwaldt, S.; Bauer, J.; Wehland, M.; Slumstrup, L.; Kopp, S.; Warnke, E.; Dittrich, A.; Magnusson, N.E.; Pietsch, J.; Corydon, T.J.; et al. Pathways regulating spheroid formation of human follicular thyroid cancer cells under simulated microgravity conditions: A genetic approach. Int. J. Mol. Sci. 2016, 17, 528. [Google Scholar] [CrossRef]
  29. Warnke, E.; Kopp, S.; Wehland, M.; Hemmersbach, R.; Bauer, J.; Pietsch, J.; Infanger, M.; Grimm, D. Thyroid cells exposed to simulated microgravity conditions—Comparison of the fast rotating clinostat and the random positioning machine. Microgravity Sci. Technol. 2016, 28, 247–260. [Google Scholar] [CrossRef]
  30. Buravkova, L.B.; Romanov, Y.A. The role of cytoskeleton in cell changes under condition of simulated microgravity. Acta Astronaut. 2001, 48, 647–650. [Google Scholar] [CrossRef]
  31. Crawford-Young, S.J. Effects of microgravity on cell cytoskeleton and embryogenesis. Int. J. Dev. Biol. 2006, 50, 183–191. [Google Scholar] [CrossRef] [PubMed] [Green Version]
  32. Hughes-Fulford, M. Function of the cytoskeleton in gravisensing during spaceflight. Adv. Space Res. 2003, 32, 1585–1593. [Google Scholar] [CrossRef]
  33. Vorselen, D.; Roos, W.H.; MacKintosh, F.C.; Wuite, G.J.; van Loon, J.J. The role of the cytoskeleton in sensing changes in gravity by nonspecialized cells. FASEB J. 2014, 28, 536–547. [Google Scholar] [CrossRef] [PubMed] [Green Version]
  34. Huber, F.; Schnauss, J.; Ronicke, S.; Rauch, P.; Muller, K.; Futterer, C.; Kas, J. Emergent complexity of the cytoskeleton: From single filaments to tissue. Adv. Phys. 2013, 62, 1–112. [Google Scholar] [CrossRef] [PubMed]
  35. Tsukita, S.; Yonemura, S.; Tsukita, S. Erm proteins: Head-to-tail regulation of actin-plasma membrane interaction. Trends Biochem. Sci. 1997, 22, 53–58. [Google Scholar] [CrossRef]
  36. Neisch, A.L.; Fehon, R.G. Ezrin, radixin and moesin: Key regulators of membrane-cortex interactions and signaling. Curr. Opin. Cell Biol. 2011, 23, 377–382. [Google Scholar] [CrossRef]
  37. Pearson, M.A.; Reczek, D.; Bretscher, A.; Karplus, P.A. Structure of the erm protein moesin reveals the ferm domain fold masked by an extended actin binding tail domain. Cell 2000, 101, 259–270. [Google Scholar] [CrossRef]
  38. Barros, F.B.A.; Assao, A.; Garcia, N.G.; Nonogaki, S.; Carvalho, A.L.; Soares, F.A.; Kowalski, L.P.; Oliveira, D.T. Moesin expression by tumor cells is an unfavorable prognostic biomarker for oral cancer. BMC Cancer 2018, 18, 53. [Google Scholar] [CrossRef]
  39. Bartova, M.; Hlavaty, J.; Tan, Y.; Singer, C.; Pohlodek, K.; Luha, J.; Walter, I. Expression of ezrin and moesin in primary breast carcinoma and matched lymph node metastases. Clin. Exp. Metastasis 2017, 34, 333–344. [Google Scholar] [CrossRef]
  40. Pietsch, J.; Sickmann, A.; Weber, G.; Bauer, J.; Egli, M.; Wildgruber, R.; Infanger, M.; Grimm, D. A proteomic approach to analysing spheroid formation of two human thyroid cell lines cultured on a random positioning machine. Proteomics 2011, 11, 2095–2104. [Google Scholar] [CrossRef]
  41. Grimm, D.; Bauer, J.; Kossmehl, P.; Shakibaei, M.; Schöberger, J.; Pickenhahn, H.; Schulze-Tanzil, G.; Vetter, R.; Eilles, C.; Paul, M.; et al. Simulated microgravity alters differentiation and increases apoptosis in human follicular thyroid carcinoma cells. FASEB J. 2002, 16, 604–606. [Google Scholar] [CrossRef] [PubMed]
  42. Levene, C.I.; Carrington, M.J. The inhibition of protein-lysine 6-oxidase by various lathyrogens. Evidence for two different mechanisms. Biochem. J. 1985, 232, 293–296. [Google Scholar] [CrossRef] [PubMed] [Green Version]
  43. Bauer, J.; Wehland, M.; Pietsch, J.; Sickmann, A.; Weber, G.; Grimm, D. Annotated gene and proteome data support recognition of interconnections between the results of different experiments in space research. Microgravity Sci. Technol. 2016, 28, 357–365. [Google Scholar] [CrossRef]
  44. Arpino, V.; Brock, M.; Gill, S.E. The role of timps in regulation of extracellular matrix proteolysis. Matrix Biol. 2015, 44–46, 247–254. [Google Scholar] [CrossRef]
  45. Hawthorn, L.; Stein, L.; Varma, R.; Wiseman, S.; Loree, T.; Tan, D. TIMP1 and SERPIN-A overexpression and TFF3 and CRABP1 underexpression as biomarkers for papillary thyroid carcinoma. Head Neck 2004, 26, 1069–1083. [Google Scholar] [CrossRef]
  46. Riwaldt, S.; Bauer, J.; Pietsch, J.; Braun, M.; Segerer, J.; Schwarzwälder, A.; Corydon, T.J.; Infanger, M.; Grimm, D. The importance of caveolin-1 as key-regulator of three-dimensional growth in thyroid cancer cells cultured under real and simulated microgravity conditions. Int. J. Mol. Sci. 2015, 16, 28296–28310. [Google Scholar] [CrossRef]
  47. Marastoni, S.; Ligresti, G.; Lorenzon, E.; Colombatti, A.; Mongiat, M. Extracellular matrix: A matter of life and death. Connect. Tissue Res. 2008, 49, 203–206. [Google Scholar] [CrossRef]
  48. Chaudhary, A.K.; Pandya, S.; Ghosh, K.; Nadkarni, A. Matrix metalloproteinase and its drug targets therapy in solid and hematological malignancies: An overview. Mutat. Res. 2013, 753, 7–23. [Google Scholar] [CrossRef]
  49. Kraiem, Z.; Korem, S. Matrix metalloproteinases and the thyroid. Thyroid 2000, 10, 1061–1069. [Google Scholar] [CrossRef]
  50. Kingsley, D.M. The TGF-β superfamily: New members, new receptors, and new genetic tests of function in different organisms. Genes Dev. 1994, 8, 133–146. [Google Scholar] [CrossRef]
  51. Geiger, B.; Spatz, J.P.; Bershadsky, A.D. Environmental sensing through focal adhesions. Nat. Rev. Mol. Cell Biol. 2009, 10, 21–33. [Google Scholar] [CrossRef] [PubMed]
  52. Zhao, T.; Li, R.; Tan, X.; Zhang, J.; Fan, C.; Zhao, Q.; Deng, Y.; Xu, A.; Lukong, K.E.; Genth, H.; et al. Simulated microgravity reduces focal adhesions and alters cytoskeleton and nuclear positioning leading to enhanced apoptosis via suppressing FAK/RhoA-mediated mTORC1/NF-κB and ERK1/2 pathways. Int. J. Mol. Sci. 2018, 19, 1994. [Google Scholar] [CrossRef] [PubMed]
  53. Spanjaard, E.; de Rooij, J. Mechanotransduction: Vinculin provides stability when tension rises. Curr. Biol. 2013, 23, R159–R161. [Google Scholar] [CrossRef] [PubMed]
  54. Humphries, J.D.; Wang, P.; Streuli, C.; Geiger, B.; Humphries, M.J.; Ballestrem, C. Vinculin controls focal adhesion formation by direct interactions with talin and actin. J. Cell Biol. 2007, 179, 1043–1057. [Google Scholar] [CrossRef] [PubMed] [Green Version]
  55. Tadokoro, S.; Shattil, S.J.; Eto, K.; Tai, V.; Liddington, R.C.; de Pereda, J.M.; Ginsberg, M.H.; Calderwood, D.A. Talin binding to integrin β tails: A final common step in integrin activation. Science 2003, 302, 103–106. [Google Scholar] [CrossRef] [PubMed]
  56. Critchley, D.R. Biochemical and structural properties of the integrin-associated cytoskeletal protein talin. Annu. Rev. Biophys. 2009, 38, 235–254. [Google Scholar] [CrossRef] [PubMed]
  57. Aleshcheva, G.; Bauer, J.; Hemmersbach, R.; Slumstrup, L.; Wehland, M.; Infanger, M.; Grimm, D. Scaffold-free tissue formation under real and simulated microgravity conditions. Basic Clin. Pharmacol. Toxicol. 2016, 119 (Suppl. 3), 26–33. [Google Scholar] [CrossRef]
  58. Goodfellow, P.J.; Nevanlinna, H.A.; Gorman, P.; Sheer, D.; Lam, G.; Goodfellow, P.N. Assignment of the gene encoding the β-subunit of the human fibronectin receptor (β-FNR) to chromosome 10p11.2. Ann. Hum. Genet. 1989, 53, 15–22. [Google Scholar] [CrossRef]
  59. Bouaouina, M.; Lad, Y.; Calderwood, D.A. The N-terminal domains of talin cooperate with the phosphotyrosine binding-like domain to activate β1 and β3 integrins. J. Biol. Chem. 2008, 283, 6118–6125. [Google Scholar] [CrossRef]
  60. Van Roy, F.; Berx, G. The cell–cell adhesion molecule E-cadherin. Cell. Mol. Life Sci. 2008, 65, 3756–3788. [Google Scholar] [CrossRef]
  61. Reynolds, A.B. P120-catenin: Past and present. Biochim. Biophys. Acta 2007, 1773, 2–7. [Google Scholar] [CrossRef] [PubMed]
  62. Ishiyama, N.; Ikura, M. The three-dimensional structure of the cadherin-catenin complex. In Adherens Junctions: From Molecular Mechanisms to Tissue Development and Disease; Subcellular Biochemistry; Springer: Dordrecht, The Netherlands, 2012; Volume 60, pp. 39–62. [Google Scholar]
  63. Sahana, J.; Nassef, M.Z.; Wehland, M.; Kopp, S.; Krüger, M.; Corydon, T.J.; Infanger, M.; Bauer, J.; Grimm, D. Decreased E-cadherin in MCF7 human breast cancer cells forming multicellular spheroids exposed to simulated microgravity. Proteomics 2018, 18, e1800015. [Google Scholar] [CrossRef] [PubMed]
  64. Petrova, Y.I.; Schecterson, L.; Gumbiner, B.M. Roles for E-cadherin cell surface regulation in cancer. Mol. Biol. Cell 2016, 27, 3233–3244. [Google Scholar] [CrossRef] [PubMed] [Green Version]
  65. Martinez-Aguilar, J.; Clifton-Bligh, R.; Molloy, M.P. Proteomics of thyroid tumours provides new insights into their molecular composition and changes associated with malignancy. Sci. Rep. 2016, 6, 23660. [Google Scholar] [CrossRef] [PubMed]
  66. McGough, A.; Pope, B.; Chiu, W.; Weeds, A. Cofilin changes the twist of F-actin: Implications for actin filament dynamics and cellular function. J. Cell Biol. 1997, 138, 771–781. [Google Scholar] [CrossRef]
  67. Giusti, L.; Iacconi, P.; Ciregia, F.; Giannaccini, G.; Donatini, G.L.; Basolo, F.; Miccoli, P.; Pinchera, A.; Lucacchini, A. Fine-needle aspiration of thyroid nodules: Proteomic analysis to identify cancer biomarkers. J. Proteome Res. 2008, 7, 4079–4088. [Google Scholar] [CrossRef]
  68. Maimaiti, Y.; Jie, T.; Jing, Z.; Changwen, W.; Pan, Y.; Chen, C.; Tao, H. Aurora kinase a induces papillary thyroid cancer lymph node metastasis by promoting cofilin-1 activity. Biochem. Biophys. Res. Commun. 2016, 473, 212–218. [Google Scholar] [CrossRef]
  69. Bauer, J.; Kopp, S.; Schlagberger, E.M.; Grosse, J.; Sahana, J.; Riwaldt, S.; Wehland, M.; Luetzenberg, R.; Infanger, M.; Grimm, D. Proteome analysis of human follicular thyroid cancer cells exposed to the random positioning machine. Int. J. Mol. Sci. 2017, 18, 546. [Google Scholar] [CrossRef]
  70. Kopp, S.; Sahana, J.; Islam, T.; Petersen, A.G.; Bauer, J.; Corydon, T.J.; Schulz, H.; Saar, K.; Huebner, N.; Slumstrup, L.; et al. The role of NFκB in spheroid formation of human breast cancer cells cultured on the Random Positioning Machine. Sci. Rep. 2018, 8, 921. [Google Scholar] [CrossRef] [Green Version]
  71. Wuest, S.L.; Richard, S.; Kopp, S.; Grimm, D.; Egli, M. Simulated microgravity: Critical review on the use of random positioning machines for mammalian cell culture. BioMed Res. Int. 2015, 2015, 971474. [Google Scholar] [CrossRef]
  72. Aleshcheva, G.; Sahana, J.; Ma, X.; Hauslage, J.; Hemmersbach, R.; Egli, M.; Infanger, M.; Bauer, J.; Grimm, D. Changes in morphology, gene expression and protein content in chondrocytes cultured on a random positioning machine. PLoS ONE 2013, 8, e79057. [Google Scholar] [CrossRef] [PubMed]
  73. Aleshcheva, G.; Wehland, M.; Sahana, J.; Bauer, J.; Corydon, T.J.; Hemmersbach, R.; Frett, T.; Egli, M.; Infanger, M.; Grosse, J.; et al. Moderate alterations of the cytoskeleton in human chondrocytes after short-term microgravity produced by parabolic flight maneuvers could be prevented by up-regulation of BMP-2 and SOX-9. FASEB J. 2015, 29, 2303–2314. [Google Scholar] [CrossRef] [PubMed] [Green Version]
  74. Nyegaard, M.; Rendtorff, N.D.; Nielsen, M.S.; Corydon, T.J.; Demontis, D.; Starnawska, A.; Hedemand, A.; Buniello, A.; Niola, F.; Overgaard, M.T.; et al. A novel locus harbouring a functional CD164 nonsense mutation identified in a large danish family with nonsyndromic hearing impairment. PLoS Genet. 2015, 11, e1005386. [Google Scholar] [CrossRef] [PubMed]
  75. Zhang, K.; Liu, J.; Li, C.; Peng, X.; Li, H.; Li, Z. Identification and validation of potential target genes in papillary thyroid cancer. Eur. J. Pharmacol. 2018, 843, 217–225. [Google Scholar] [CrossRef] [PubMed]
Figure 1. Network of interaction and mutual influence of the identified entities on a gene expression level. The genes, whose icons are marked with a green or blue rim have been found in recent studies referenced or mentioned in the preceding paper [20], respectively. The genes displayed with yellow icons attracted our attention when the two µg-samples were investigated by gene array analysis, although the result lacked significance due to the fact of only two samples being available per experiments. Green arrows with a plus sign indicate expression or enhanced expression of a gene to which an arrow points to and red lines with a terminal crossbar show suppression or reduced expression of the gene near the crossbar. Grey arrows point to interaction with unknown effects as of now.
Ijms 19 04001 g001
Figure 2. Localization and interaction of the products of genes mentioned above. The icons of genes products found in recent studies referenced or mentioned in the preceding paper [20], are marked with a green or blue rim, respectively. The genes products marked by yellow icons attracted our attention when the µg samples (2) were evaluated by gene array analysis, although the results lacked significance due to the fact that only two samples per experiments were available. Green arrows with plus sign indicate stimulation and red lines with terminal crossbar show inhibition. Grey arrows indicate direct (solid line) or indirect (dashed line) interaction with unknown effect. Grey lines show protein–protein complex formation.
Ijms 19 04001 g002
Figure 3. IFS of fibronectin (green) and nucleus (blue) (A,B); scale bar 10 µm; red arrow redistributed fibronectin, qPCR analyses of FN1 (C), Col1A1 (E), Col4A5 (F), SPP1 (H), TGB1 (J), TIMP1 (K), MMP1 (L), MMP3 (M), MMP14 (N), IL-6 (O), CXCL8 (P) and LOX (R), and WB of fibronectin (D), collagen IV (G), osteopontin (I), and IL-8 (Q). “TX53” indicates samples collected from the sounding rocket mission, whereas “Hyper-g” presents data from a parallel experiment simulating the worst case-possible launch acceleration. IF: in-flight; Con: control; Sim: simulated; RPM: random positioning machine; 6min s-µg; * p < 0.05 vs.1g.
Ijms 19 04001 g003aIjms 19 04001 g003b
Figure 4. Histological staining of F-actin (red) and the nucleaus (blue) (A,B); yellow arrows: stress fibers and blue arrows: filopodia and lamellipodia; IFS of vinculin (green) and nucleus (blue) (F,G); red arrow: compact vinculin in 1g around the nucleus and yellow arrow: redistributed vinculin in RPM-samples; ICAM-1 (green) and nucleus (blue); yellow circles: areas with no ICAM1-positivity in RPM-samples (P,Q); scale bar 10 µm. qPCR analyses of VCL (H), CDH1 (J), CFL1 (K), PTK2 (M), VCAM1 (O), ICAM1 (R), and WB of ACTB (C), ezrin (D), moesin (E), VCL (I), cofilin (L), FAK (N), ICAM1 (S). “TX53” indicates samples collected during the sounding rocket mission, whereas “Hyper-g” presents data from a parallel experiment aiming on the worst case-possible launch acceleration. IF: in-flight; Con: control; Sim: simulated; RPM: random positioning machine; 6min s-µg; * p < 0.05 vs.1g, scale bars: 10 µm.
Ijms 19 04001 g004aIjms 19 04001 g004b
Figure 5. Workflow during the TEXUS-53 mission. Cell culture chamber were filled with cells (A) and afterwards placed into the late access unite (B). During flight a 1g-centrifuge (C) served as one control besides others. Red arrows indicate the rotation direction of the centrifuge. The cells were fixed at defined time points 1, 2, 3 (D).
Ijms 19 04001 g005
Table 1. Summary of previously found regulations in selected molecular targets due to gravitational alterations. ↑ indicates upregulation; ↓ indicates downregulation; double arrow indicates significant alterations; → indicates no regulation, blank was not examined.
Cell Lineg-ConditionFN1COL1A1COL4A5SPP1Reference
FTC-133Space10 days [11]
RPM1 day AD↑↑ MCS↑[23]
7 days ↑↑[8]
14 days ↑↑[8]
PFC31P WT↑↑[11]
hyper-g2 h [11]
Nthy-ori 3-1RPM4 hAD↑ [9]
1 dayAD↑ MCS↓ [9]
3 daysAD→ MCS→ [9]
7 days ↑↑ [8]
14 days ↑↑ ↑↑[8]
Cell lineg-ConditionICAM1VCAM1IL6CXCL8Reference
FTC-133Space10 days [11]
RPM1 day AD↑↑ MCS↓↓AD↑↑ MCS↑[23]
7 days ↑↑AD↑↑ MCS↓↓[8]
14 days ↑↑AD↑↑ MCS→[8]
PFC31 P WT↑↑WT↑↑[11]
hyper-g2 h [11]
Nthy-ori 3-1RPM4 h [9]
1 day [9]
3 days [9]
7 days ↑↑AD↑↑ MCS↓↓[8]
14 days ↑↑AD↑↑ MCS↑↑[8]
Table 2. Antibodies for Western blot analyses.
AntibodiesCompany/NoSpeciesMW (kDa)Dilution
Collagen type ISigma/C2456Ms~1301:500
B-actinSigma/A5316Ms421:2000
FibronectinInvitrogen/MA1198Ms2501:1000
OsteopontinSigma/07264Rb501:1000
Cofilin#ab 42824Rb201:2000
IL-8Abcam/ab7747Rb111:500
Collagen type IVAbcam/ab52235Rb1601:1000
EzrinCell Signaling #3145Rb811:500
MoesinCell Signaling #3150Rb781:500
VinculinAbcam/ab18058Ms1241:1000
ICAM 1Cell Signaling #4915SRb89–921:500
GAPDHAbcam/ab9384Rb371: 1000
Table 3. Primer sequences for qPCR.
GenePrimer NameSequence
18S-rRNA18S-FGGAGCCTGCGGCTTAATTT
18S-RCAACTAAGAACGGCCATGCA
ACTBACTB-FTGCCGACAGGATGCAGAAG
ACTB-RGCCGATCCACACGGAGTACT
CDH1CDH1-FGCTGGACCGAGAGAGTTTCC
CDH1-RCAGCTGTTGCTGTTGTGCTT
CFLCFL-FGAAGGAGGATCTGGTGTTTATCTTCT
CFL-RCCTTGGAGCTGGCATAAATCAT
COL1A1COL1A1-FACGAAGACATCCCACCAATCAC
COL1A1-RCGTTGTCGCAGACGCAGAT
COL4A5COL4A5-FGGTACCTGTAACTACTATGCCAACTCCTA
COL4A5-RCGGCTAATTCGTGTCCTCAAG
EZREZR-FGCAATCCAGCCAAATACAACTG
EZR-RCCACATAGTGGAGGCCAAAGTAC
FAK1/PTK2FAK1-FTGTGGGTAAACCAGATCCTGC
FAK1-RCTGAAGCTTGACACCCTCGT
FN1FN1-FAGATCTACCTGTACACCTTGAATGACA
FN1-RCATGATACCAGCAAGGAATTGG
ICAM-1ICAM1-FCGGCTGACGTGTGCAGTAAT
ICAM1-RCTTCTGAGACCTCTGGCTTCGT
IL6IL6-FCGGGAACGAAAGAGAAGCTCTA
IL6-RGAGCAGCCCCAGGGAGAA
IL8/CXCL8IL8-FTGGCAGCCTTCCTGATTTCT
IL8-RGGGTGGAAAGGTTTGGAGTATG
ITGB1ITGB1-FGAAAACAGCGCATATCTGGAAATT
ITGB1-RCAGCCAATCAGTGATCCACAA
LOXLOX-FTGGGAATGGCACAGTTGTCA
LOX-RAGCCACTCTCCTCTGGGTGTT
MMP1MMP1-FGTCAGGGGAGATCATCGGG
MMP1-RGAGCATCCCCTCCAATACCTG
MMP3MMP3-FACAAAGGATACAACAGGGACCAA
MMP3-RTAGAGTGGGTACATCAAAGCTTCAGT
MMP14MMP14-FACTTTATGGGGGTGAGTCAGG
MMP14-RGATGTTGGGCCCATAGGTGG
MSNMSN-FGAAATTTGTCATCAAGCCCATTG
MSN-RCCATGCACAAGGCCAAGAT
PFN1PFN-FGGGAATTTAGCATGGATCTTCGT
PFN-RACCGTGGACACCTTCTTTGC
SSP1SSP1-FCGAGGTGATAGTGTGGTTTATGGA
SSP1-RCGTCTGTAGCATCAGGGTACTG
TGFB1TGFB1-FCACCCGCGTGCTAATGGT
TGFB1-RAGAGCAACACGGGTTCAGGTA
TIMP1TIMP1-FGCCATCGCCGCAGATC
TIMP1-RGCTATCAGCCACAGCAACAACA
TLN1TLN1-FGATGGCTATTACTCAGTACAGACAACTGA
TLN1-RCATAGTAGACTCCTCATCTCCTTCCA
VCAM-1VCAM1--FCATGGAATTCGAACCCAAACA
VCAM1-RGGCTGACCAAGACGGTTGTATC
VCLVCL-FGTCTCGGCTGCTCGTATCTT
VCL-RGTCCACCAGCCCTGTCATTT
All sequences are given in 5′–3′ direction.

