Synonymous Codon Usages as an Evolutionary Dynamic for Chlamydiaceae

1
State Key Laboratory of Veterinary Etiological Biology, Lanzhou Veterinary Research Institute, Chinese Academy of Agricultural Sciences, Lanzhou 730046, China
2
Gansu Police Vocational College, Lanzhou 730046, China
3
Biomedical Research Center, Northwest Minzu University, Lanzhou 730030, China
*
Authors to whom correspondence should be addressed.
†
These authors contribute equally to this work.
Int. J. Mol. Sci. 2018, 19(12), 4010; https://0-doi-org.brum.beds.ac.uk/10.3390/ijms19124010
Submission received: 4 December 2018
/
Revised: 6 December 2018
/
Accepted: 10 December 2018
/
Published: 12 December 2018
(This article belongs to the Section Biochemistry)
Abstract
:The family of Chlamydiaceae contains a group of obligate intracellular bacteria that can infect a wide range of hosts. The evolutionary trend of members in this family is a hot topic, which benefits our understanding of the cross-infection of these pathogens. In this study, 14 whole genomes of 12 Chlamydia species were used to investigate the nucleotide, codon, and amino acid usage bias by synonymous codon usage value and information entropy method. The results showed that all the studied Chlamydia spp. had A/T rich genes with over-represented A or T at the third positions and G or C under-represented at these positions, suggesting that nucleotide usages influenced synonymous codon usages. The overall codon usage trend from synonymous codon usage variations divides the Chlamydia spp. into four separate clusters, while amino acid usage divides the Chlamydia spp. into two clusters with some exceptions, which reflected the genetic diversity of the Chlamydiaceae family members. The overall codon usage pattern represented by the effective number of codons (ENC) was significantly positively correlated to gene GC3 content. A negative correlation exists between ENC and the codon adaptation index for some Chlamydia species. These results suggested that mutation pressure caused by nucleotide composition constraint played an important role in shaping synonymous codon usage patterns. Furthermore, codon usage of T3ss and Pmps gene families adapted to that of the corresponding genome. Taken together, analyses help our understanding of evolutionary interactions between nucleotide, synonymous codon, and amino acid usages in genes of Chlamydiaceae family members.
1. Introduction
Chlamydia spp. are a group of obligate intracellular bacteria that are widely distributed throughout the world, causing a variety of diseases in humans and animals [1]. To date, 12 species have been identified in the single genus of the family Chlamydiaceae: C. trachomatis, C. pneumoniae, C. muridarum, C. suis, C. psittaci, C. pecorum, C. abortus, C. felis, C. caviae, C. avium, C. gallinacea, and C. ibidis [2,3]. Among these species, C. trachomatis and C. pneumonia mainly cause diseases in humans, while other species often cause animal diseases and most have zoonotic potential [4]. C. trachomatis infects the ocular and genital mucosa. It is the leading cause of infectious preventable blindness in developing countries and contributes to the most prevalent bacterial sexually transmitted diseases (STDs) throughout the world [5,6]. Urogenital infection of C. trachomatis may cause serious sequelae including pelvic inflammatory disease (PID), infertility, and ectopic pregnancy [6]. The mouse pathogen C. muridarum is usually used as a model for understanding of C. trachomatis genital tract infections [7]. C. pneumoniae is an important respiratory pathogen that causes approximately 5% of all cases of bronchitis and is believed to be responsible for about 10% of community-acquired pneumonia cases [8]. C. psittaci has widespread occurrence in poultry and wild birds causing psittacosis or ornithosis or developing non-specific symptoms and has undisputable zoonotic character, causing severe flu-like infections in humans [9]. Infection with other chlamydial species also affects mucosal membranes, leading to fertility disorders, severe conjunctivitis, or pneumonia. For instance, C. abortus is the causative agent of abortion in sheep, goat, cattle, pig, and other mammals [10], and C. pecorum is known to cause disorders of the intestinal and genital tracts, as well as arthritis, in ruminants and pigs [11]. C. suis is found to be the most prevalent chlamydial species in pigs while C. felis and C. caviae are distinguished by their high host specificity having adapted to cats or guinea pigs, respectively. C. avium, C. gallinacea, and C. ibidis are newly identified chlamydial species from birds with unclear pathogenicity [3,12,13].
All the Chlamydia spp. share a common but unique biphasic developmental cycle, involving an infectious, but metabolically inactive elementary body (EB), which invades host cells, and a noninfectious metabolically active reticulate body (RB), which resides and multiplies within an intracellular non-fusogenic vacuole-like cytoplasmic inclusion [14]. Although many aspects of virulence and pathogenic mechanisms for most species are not clear yet, several common toxic factors have been identified. For instance, the polymorphic membrane proteins (Pmps) of Chlamydia are thought to be involved in the process of chlamydial adhesion, tissue tropism, and immune responses induction [15,16,17]. Type III secretion system plays a vital role in the formation and development of chlamydial inclusion by delivering effector proteins into their target host cells [18,19]. The effectors interfere with diverse host cellular processes including signaling, cytoskeletal rearrangements, and vesicle trafficking to enhance bacterial entry, establish a replicative niche and evade innate immunity [20,21].
As obligate intracellular microorganisms, co-evolution between Chlamydiae and their hosts enables them to adapt for extracellular infectious and intracellular reproductive life cycle to their host. These are closely related to the pathogenicity of Chlamydiae [22]. With the development of sequencing technology, complete genomes of members of Chlamydiaceae are available for investigating their pathogenic mechanisms as well as phyletic evolution. Chlamydia spp. like other endocellular bacteria such as Rickettsia spp., have substantially reduced, A/T rich genomes (1.04 Mb with 58.7% of A+T, encoding 895 open reading frames for C. trachomatis) [23,24]. The lack of many metabolic enzymes makes them reliant on the hosts for many of their metabolic requirements [25]. It is evident that the endocellular lifestyle is the base of pathogenicity of these bacteria. Study on the evolutionary strategy of genomes may supply some information about their pathogenic mechanisms. The genetic information about interplay between nucleotide, synonymous codon, and amino acid usages could reflect evolutionary dynamics of Chlamydia spp. However, evolutionary drivers proper to Chlamydia themselves at nucleotide and amino acid usage levels have not been investigated yet. Nucleotide usage variation was considered as an important evolutionary dynamic, however, synonymous codon usages were able to minimize error impacts by increasing tolerance for some point mutations to stabilize amino acid usages [26,27,28,29,30]. Investigations of synonymous codon usage identified several evolutionary dynamics which impact overall codon usage patterns, including natural/translation selection, mutation pressure, hydrophobicity and hydrophilicity of the protein, protein folding, and host preferences [31,32,33,34,35,36]. Depending on the information about nucleotide, synonymous codon, and amino acid usage from the available genomes of Chlamydia spp., we tried to identify the evolutionary dynamics in shaping the unique genetic features of these bacteria in the family of Chlamydiaceae.
2. Results
2.1. Bias A/T versus G/C in Chlamydia spp. Genes
To better clarify the organization of nucleotide usages at gene levels of Chlamydia spp., the nucleotide contents of genes in each species were calculated. The average contents of the four nucleotides represented similar patterns in the 12 species, namely bias for high AT content versus low GC content (Table 1). Furthermore, nucleotide usages at third codon positions strongly influenced the organization at gene levels (Table 1). Generally, the overall nucleotide usages at gene levels had an obvious effect on the organization of nucleotide usages at third codon positions, suggesting synonymous codon usages could be influenced by the stable organization of nucleotide usages at gene levels of Chlamydia spp.
2.2. Nucleotide Usage Bias at Gene Levels of Chlamydia spp.
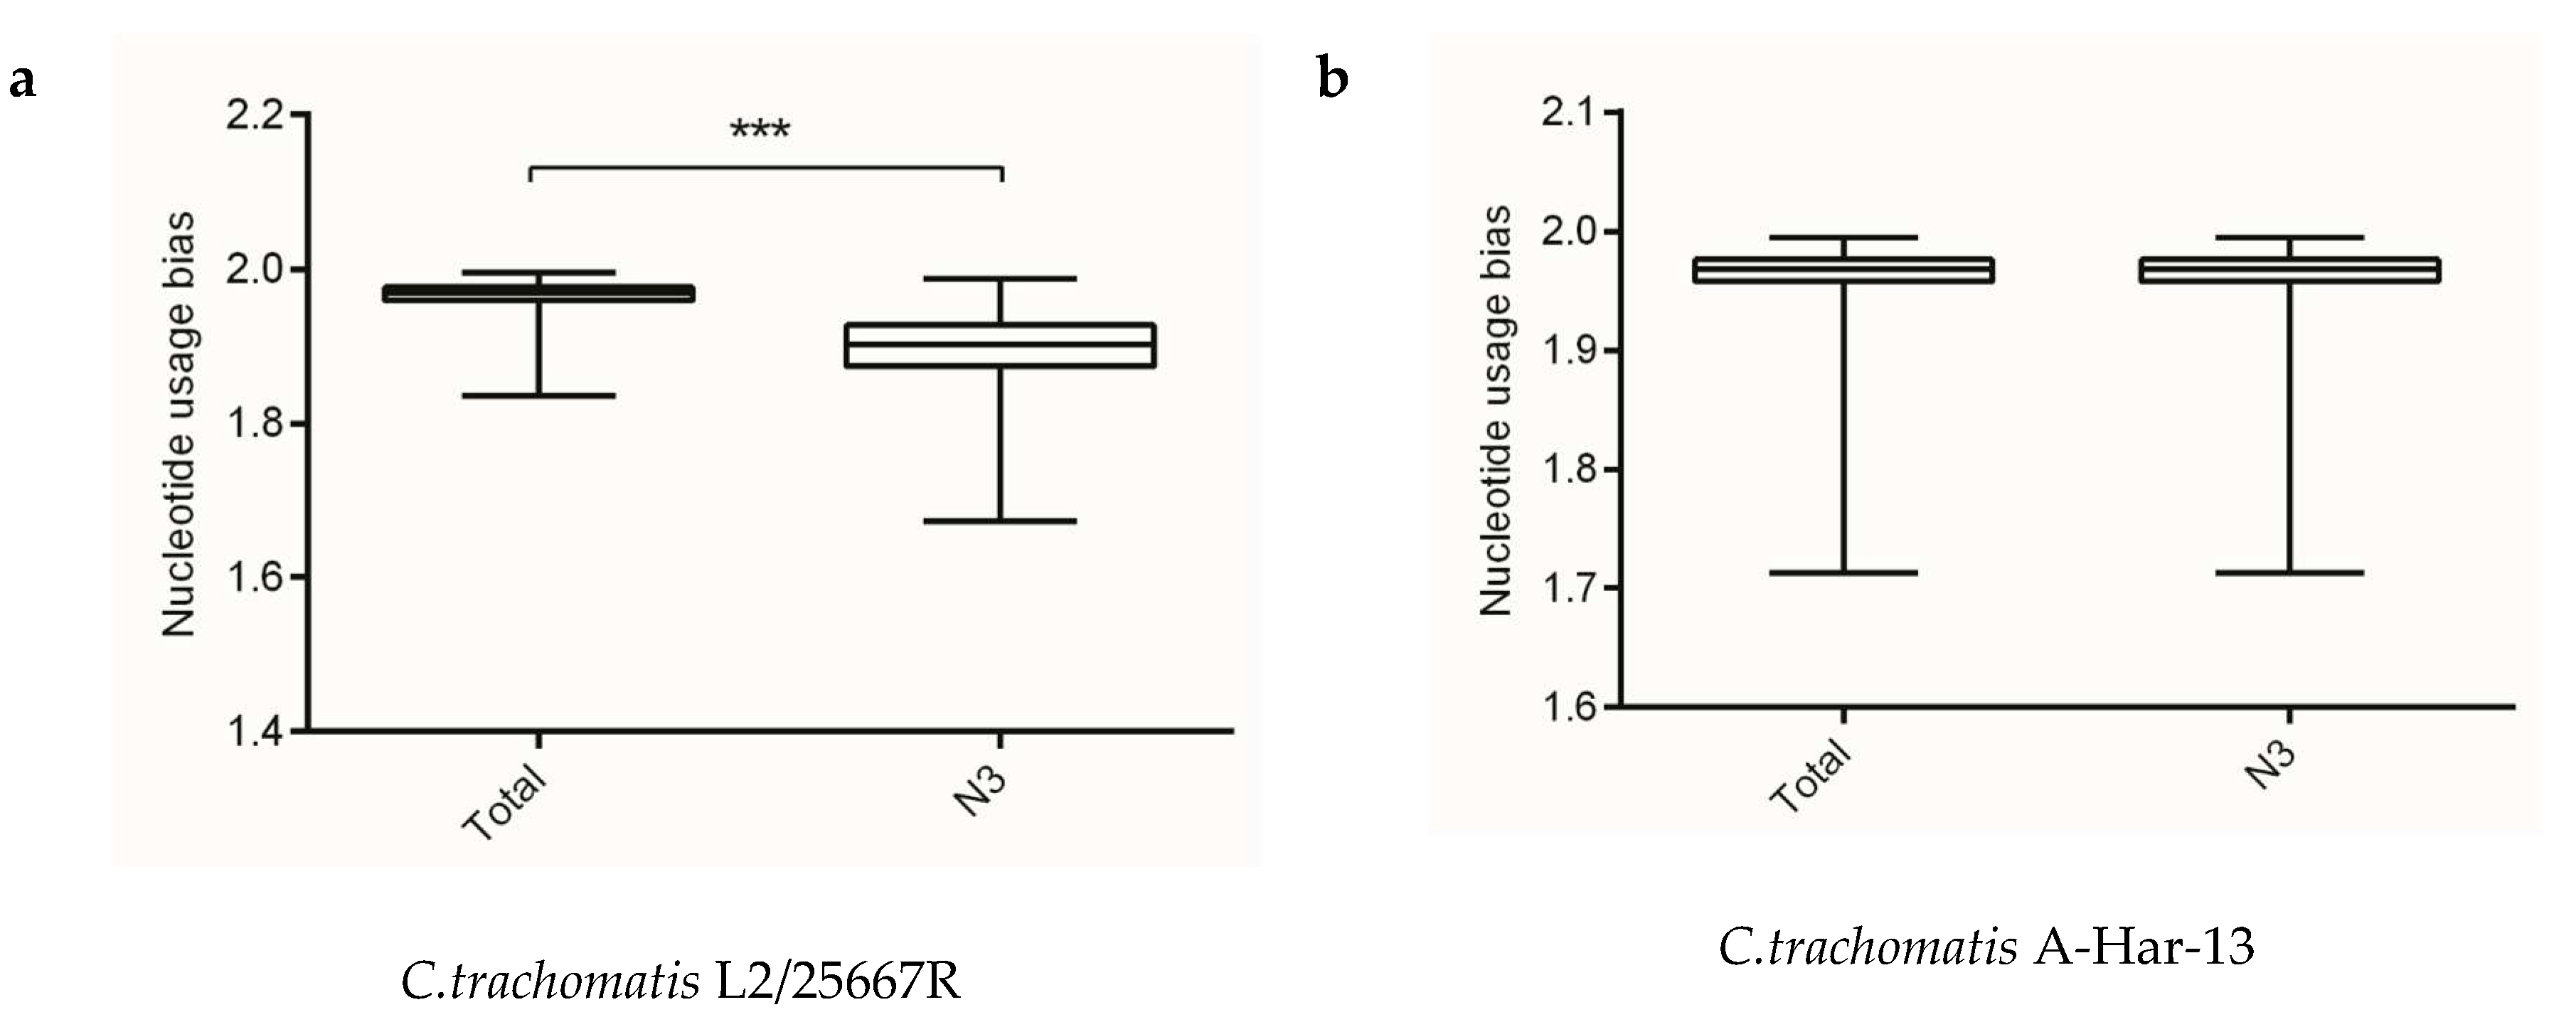
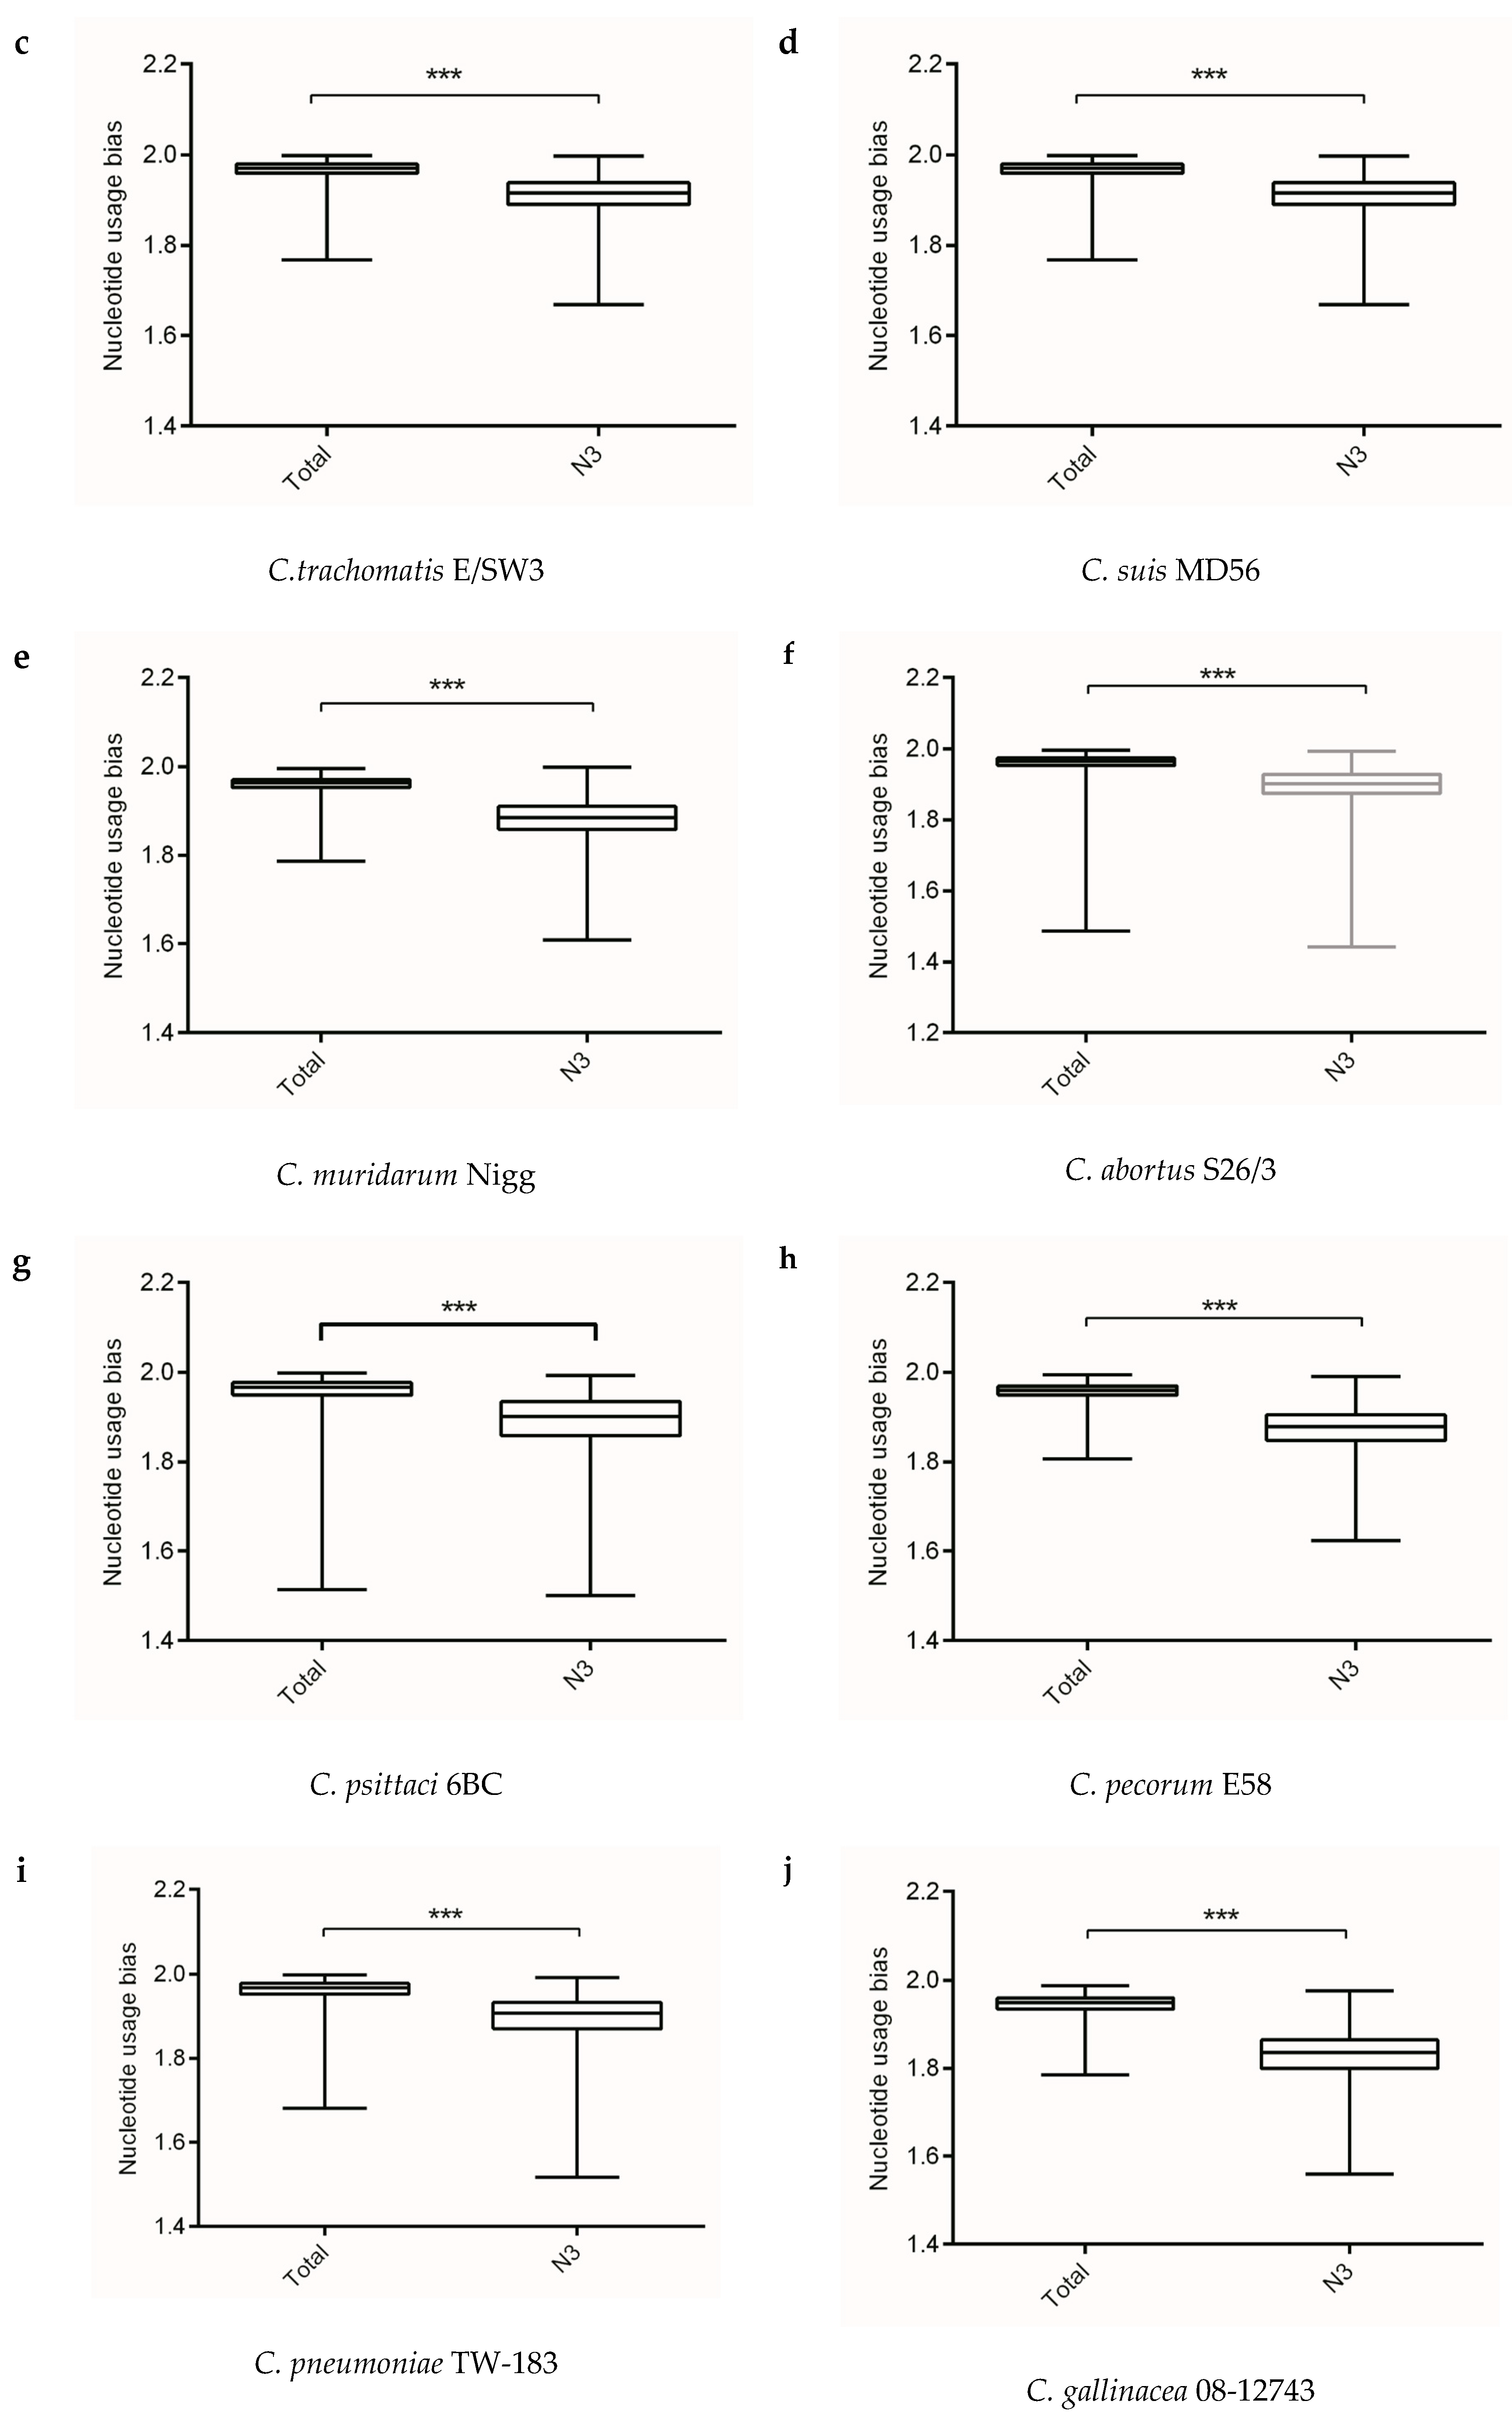
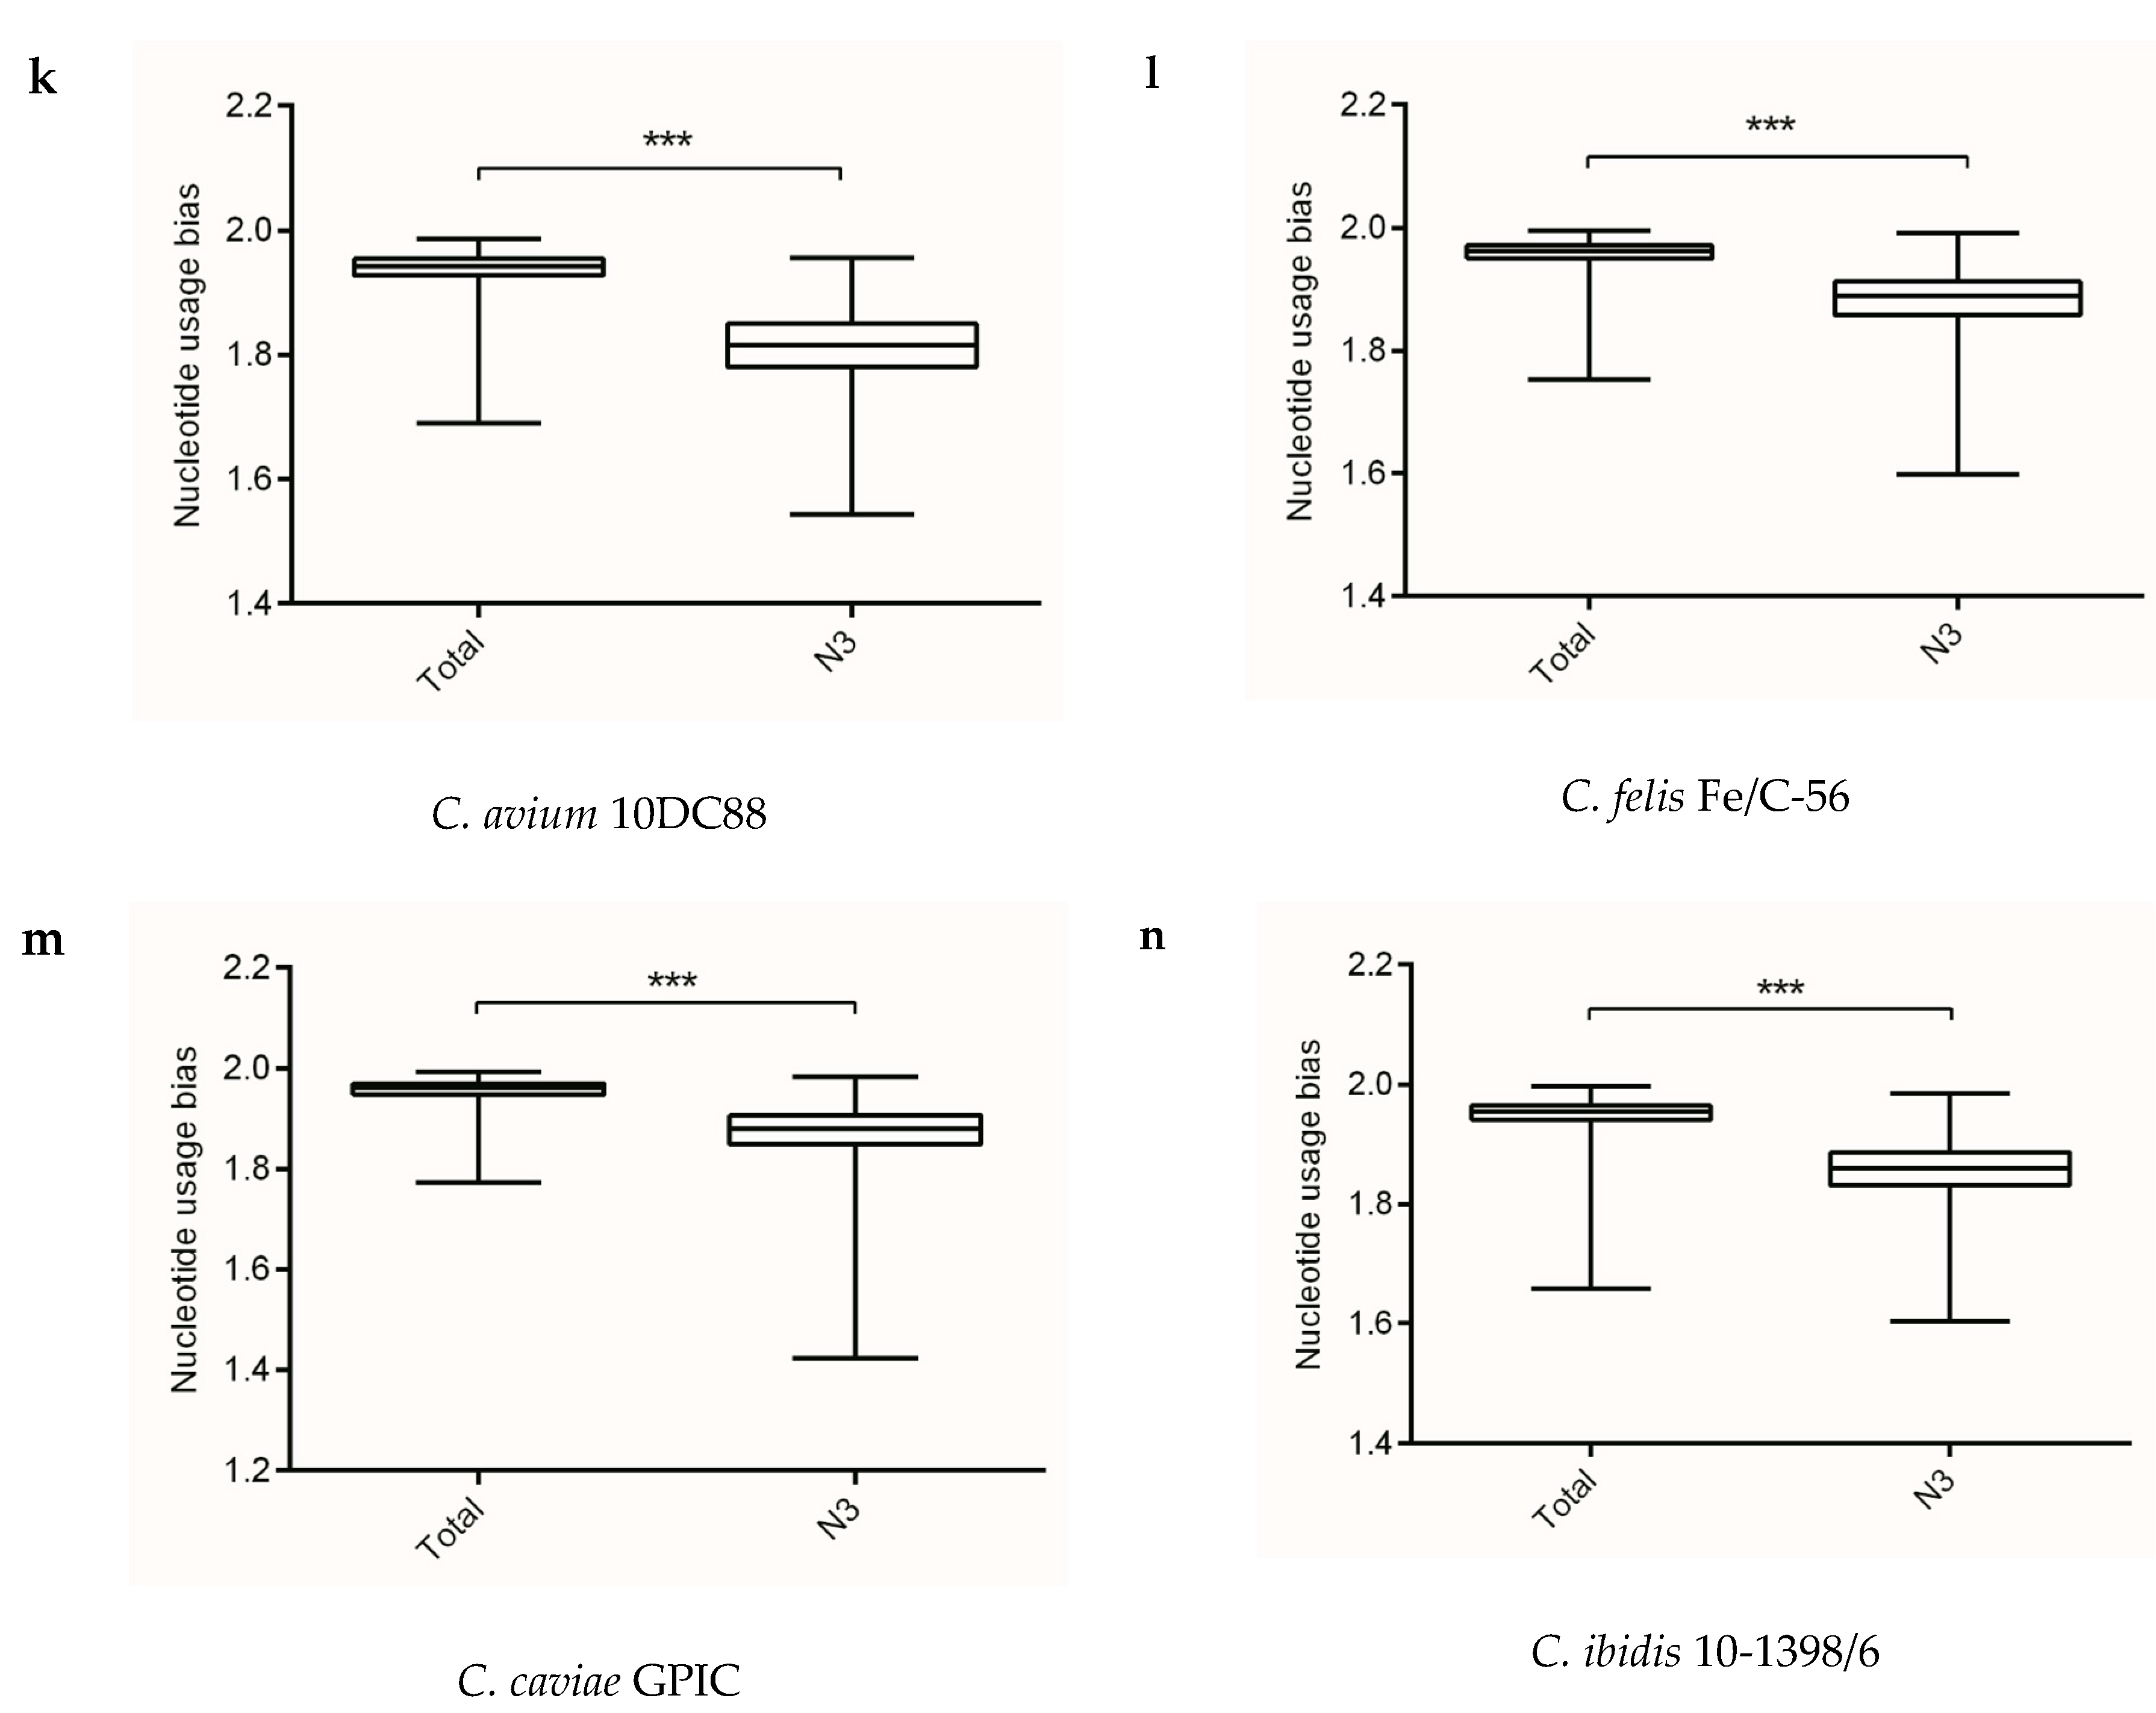
Analysis of information entropy showed an overall nucleotide usage bias derived from the four nucleotide contents (Table 1). Figure 1 showed that extents of nucleotide usage bias at third codon positions was generally stronger than the overall nucleotide usage bias in genes of Chlamydia spp. This result implied that mutation pressure caused by nucleotide composition played an important role in shaping synonymous codon usages in Chlamydia spp. In addition, the three biovars of C. trachomatis exhibited different nucleotide usage biases at third codon positions, with C. trachomatis lymphogranuloma venereum biovar strain L2/25567R significantly different from C. trachomatis trachoma biovar strain A-HAR-13 and C. trachomatis genital tract infection biovar strain E/SW3 (Figure 1). This result might suggest that mutation pressure functioned as a regulator for different biovars in the C. trachomatis.
2.3. Nucleotide Usage Influencing Codon Usage
We quantified bias in synonymous codon usage using relative synonymous codon usage (RSCU). All over-represented synonymous codons ended with A or T, while all under-represented synonymous codons ended with G or C (Table S2). These genetic features strongly reflected obvious constraints on nucleotide composition shaping synonymous codon usage biases in Chlamydia. Note that despite the dominating evolutionary dynamic of nucleotide usage patterns on codon usages and their variation in Chlamydia, some synonymous codons usage patterns showed that constraints on nucleotide composition were not the only constraints affecting the evolutionary dynamics of Chlamydia gene contents. In Table S2, although the four dominant synonymous codons (CTA for Leu, ATA for Ile, AGT for Ser and CCA for Pro) ended with A or T, corresponding RSCU values were less than 1.0 in the 12 species, suggesting that usage of the four synonymous codons was suppressed. Similar genetic features were also found in stop codons usages. In Table S3, despite bias for stop codon TAA in all 12 Chlamydia, stop codon TGA was less used than stop codon TAG, despite their identical nucleotide contents. These findings implied that translational constraints modified usages of specific synonymous codons and stop codons.
Compositional asymmetry of nucleotide contents between the replicational leading and lagging strands is common in bacteria [37] including Chlamydiae. To quantify the synonymous codon usage variations in the leading and lagging strand of each Chlamydia spp., we used PCA to reflect overall codon usage pattern. The results showed different codon usages of genes located on the leading and lagging strands for most of the Chlamydia spp. (Figure S1), which was consistent with the previous reports [38,39]. However, the codon usages in C. avium and C. abortus did not show separation between leading and lagging strands.
2.4. Genetic Diversity of Chlamydia spp. in Codon and Amino Acid Usage
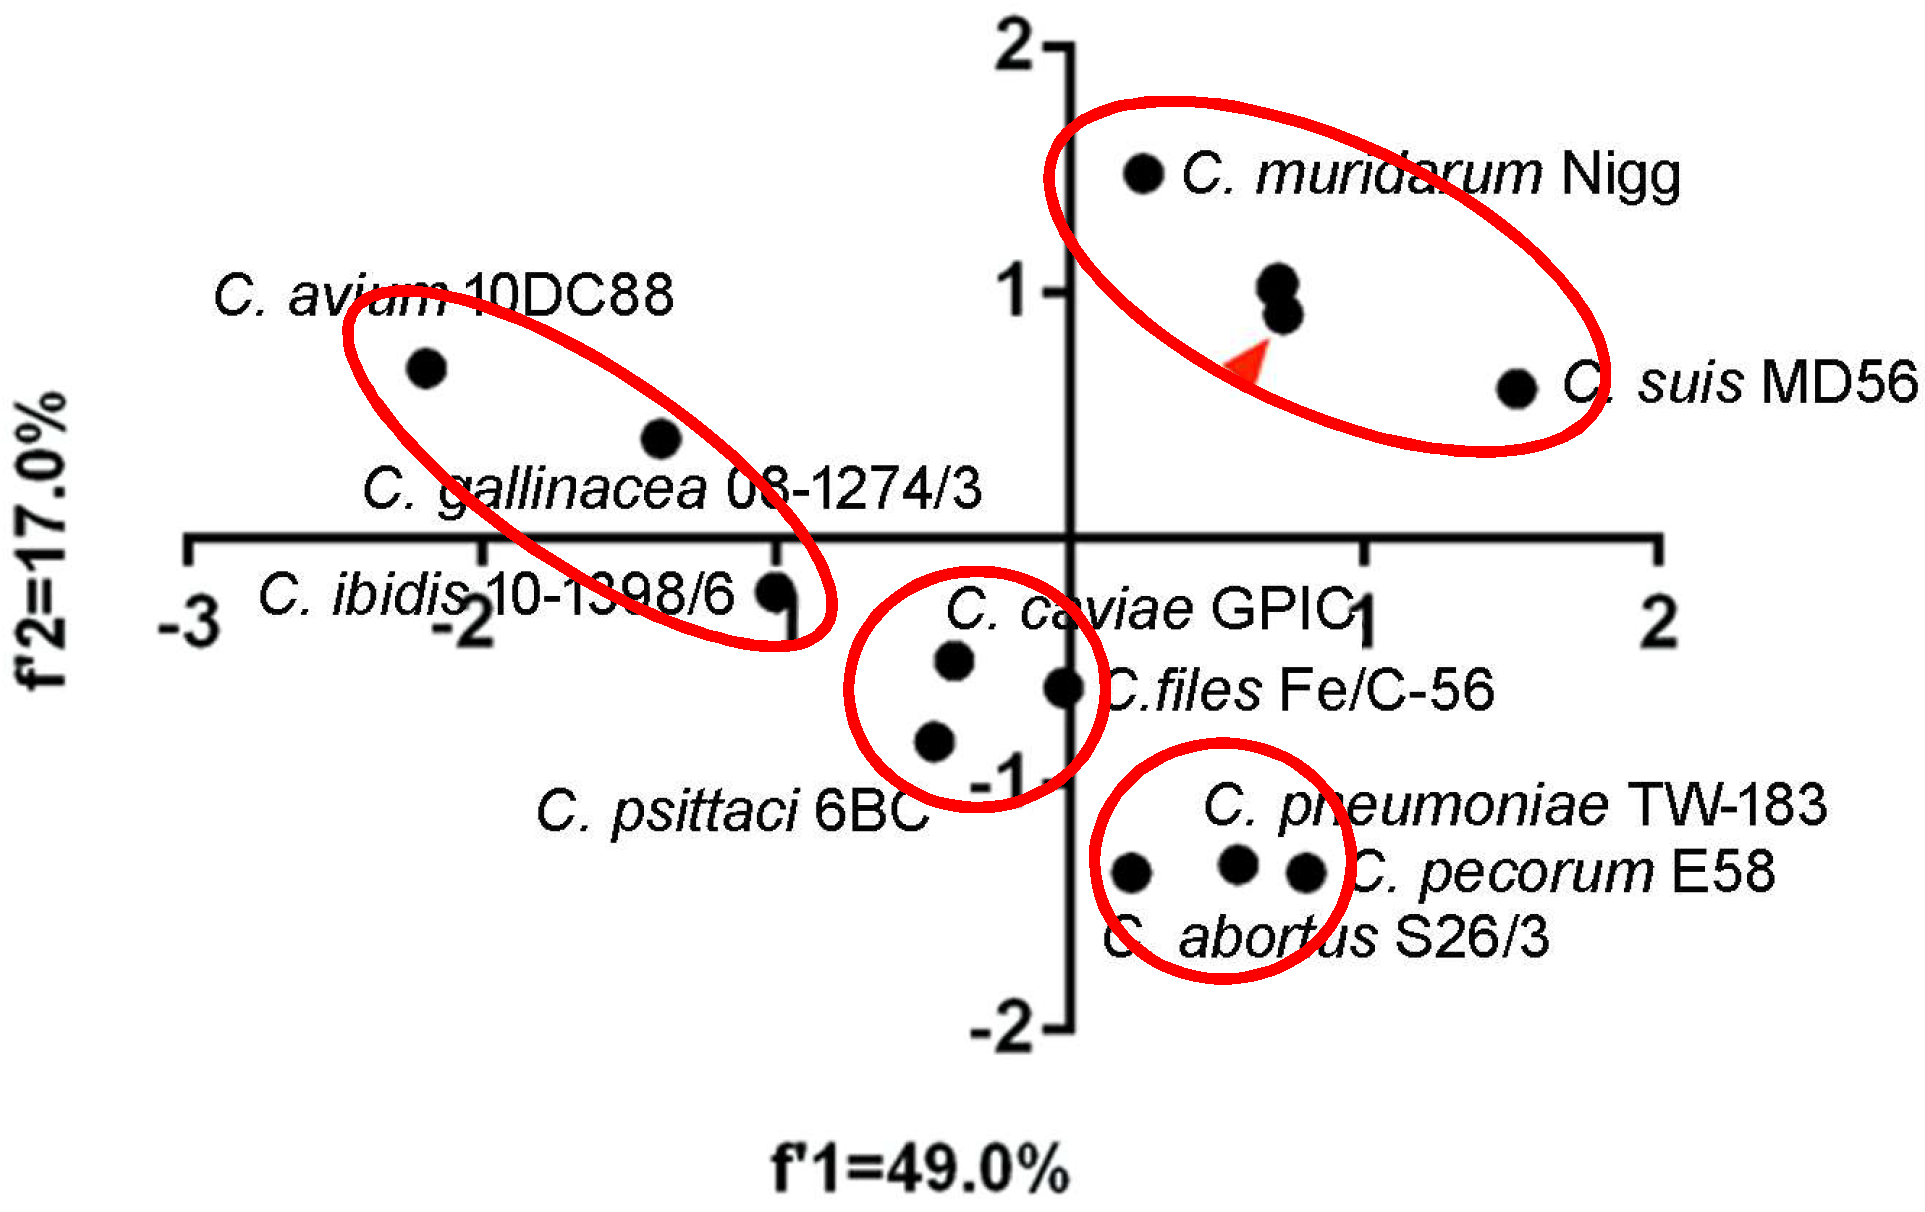
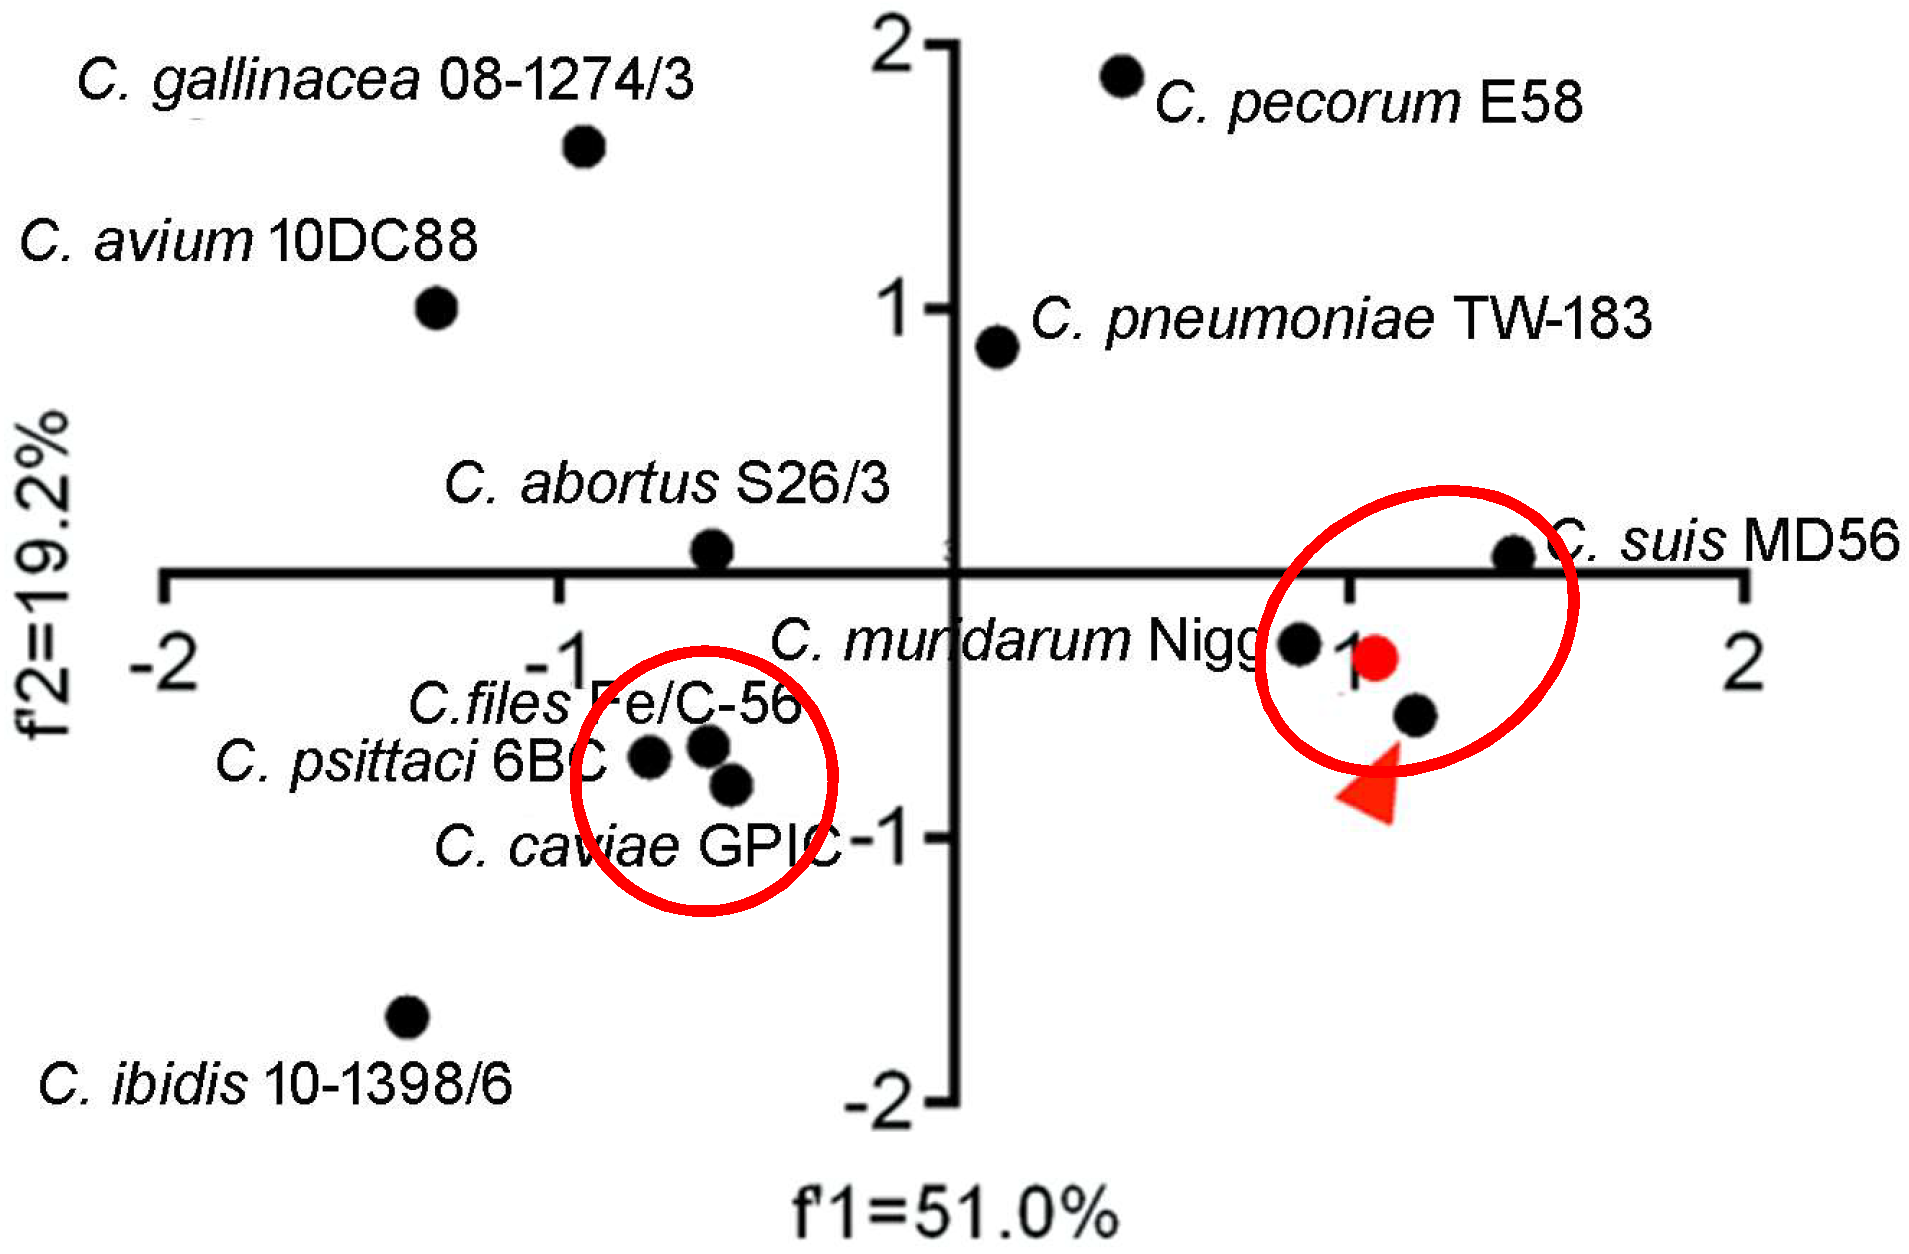
To quantify the overall codon usage trends from synonymous codon usage variations of Chlamydia spp., we used PCA to reflect overall codon usage trends. Generally, the first (f’1) and second (f’2) PCA axis accounted for 49.0% and 17.0% of the total codon usage variation, respectively. The three biovars of C. trachomatis almost perfectly overlapped and clustered with C. suis and C. muridarum, while C. pecorum, C. pneumoniae and C. abortus clustered together. C. caviae, C. felis, and C. psittaci formed a third cluster. Interestingly, the newly identified species, C. avium, C. gallinacean and C. ibidis showed different overall codon usage trends (Figure 2). The first (f’1) and second (f’2) PCA axis accounted for 51.0% and 19.2% of the total amino acid usage variation, respectively. The amino acid usage patterns for C. trachomatis, C. muridarum, C. suis, C. felis, C. peittaci and C. caviae could be divided into the two genetic clusters, however, the others owned their specific amino acid usage patterns (Figure 3). These results suggested that both codon usage and amino acid usage patterns could be regarded as evolutionary dynamics related to the balance between mutation pressure and natural selection for driving the evolution of the Chlamydia spp.
2.5. Multiple Selection Forces Influencing Codon Usage Patterns in Chlamydia spp.
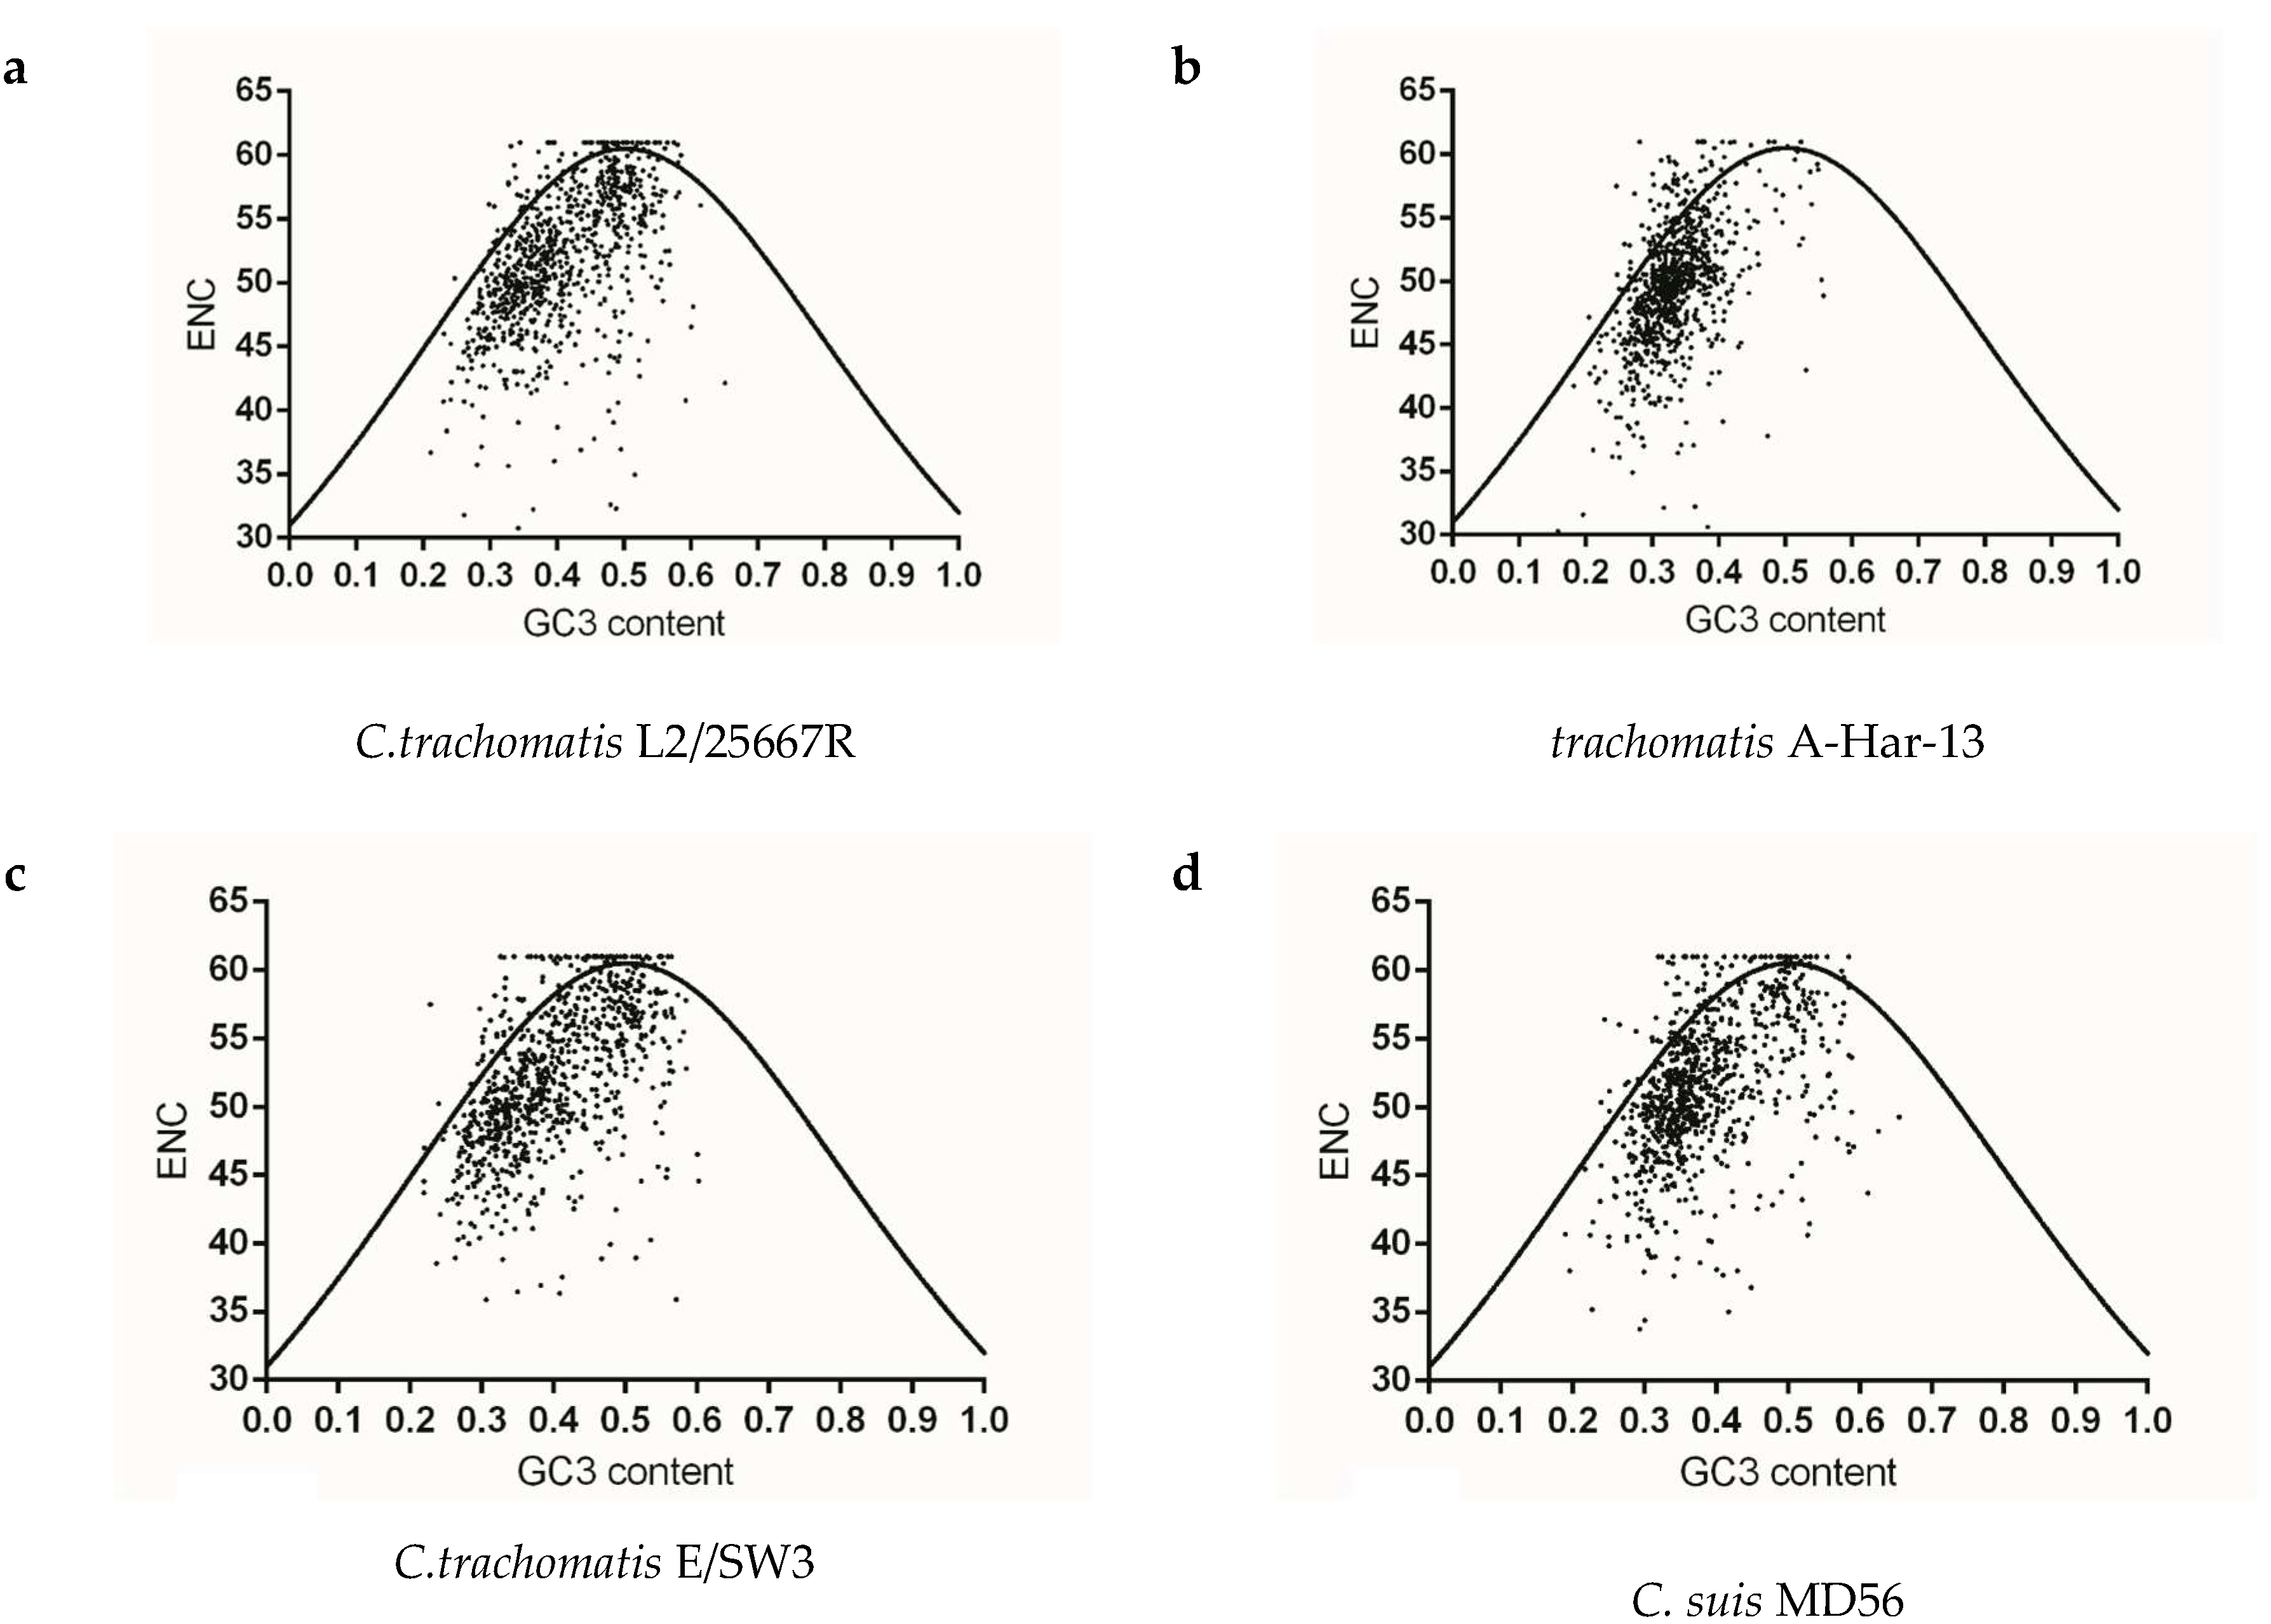
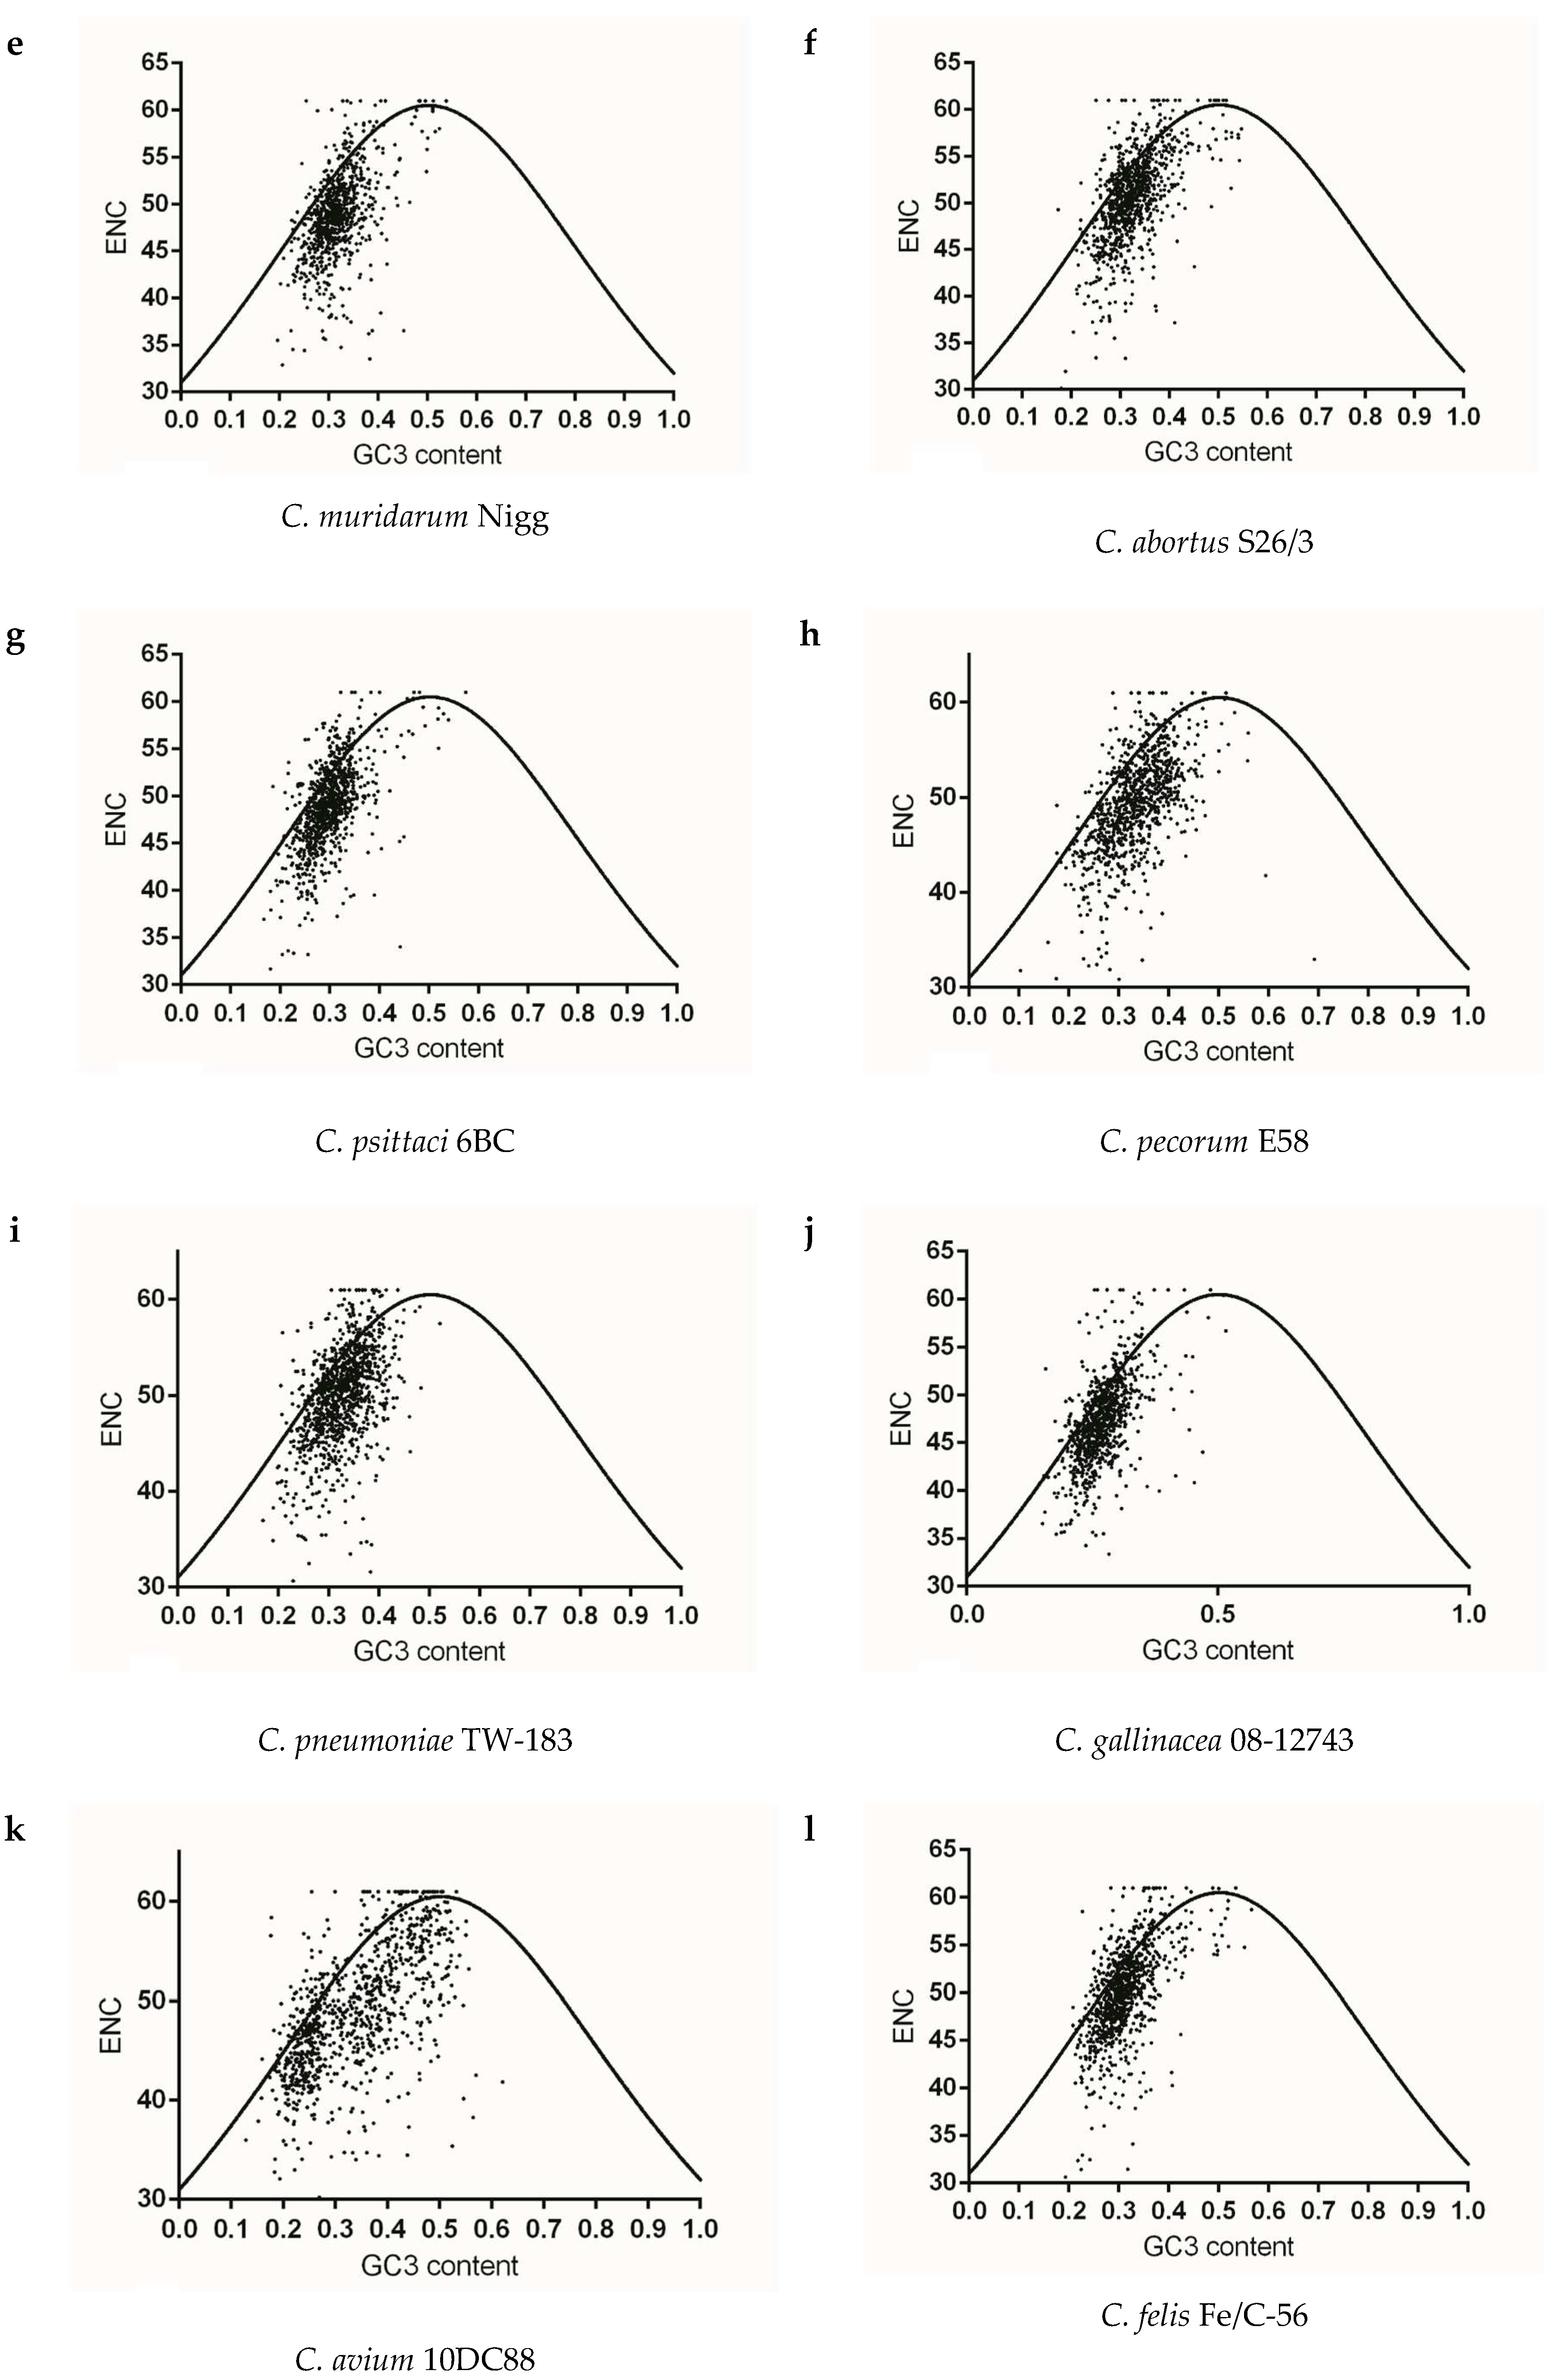
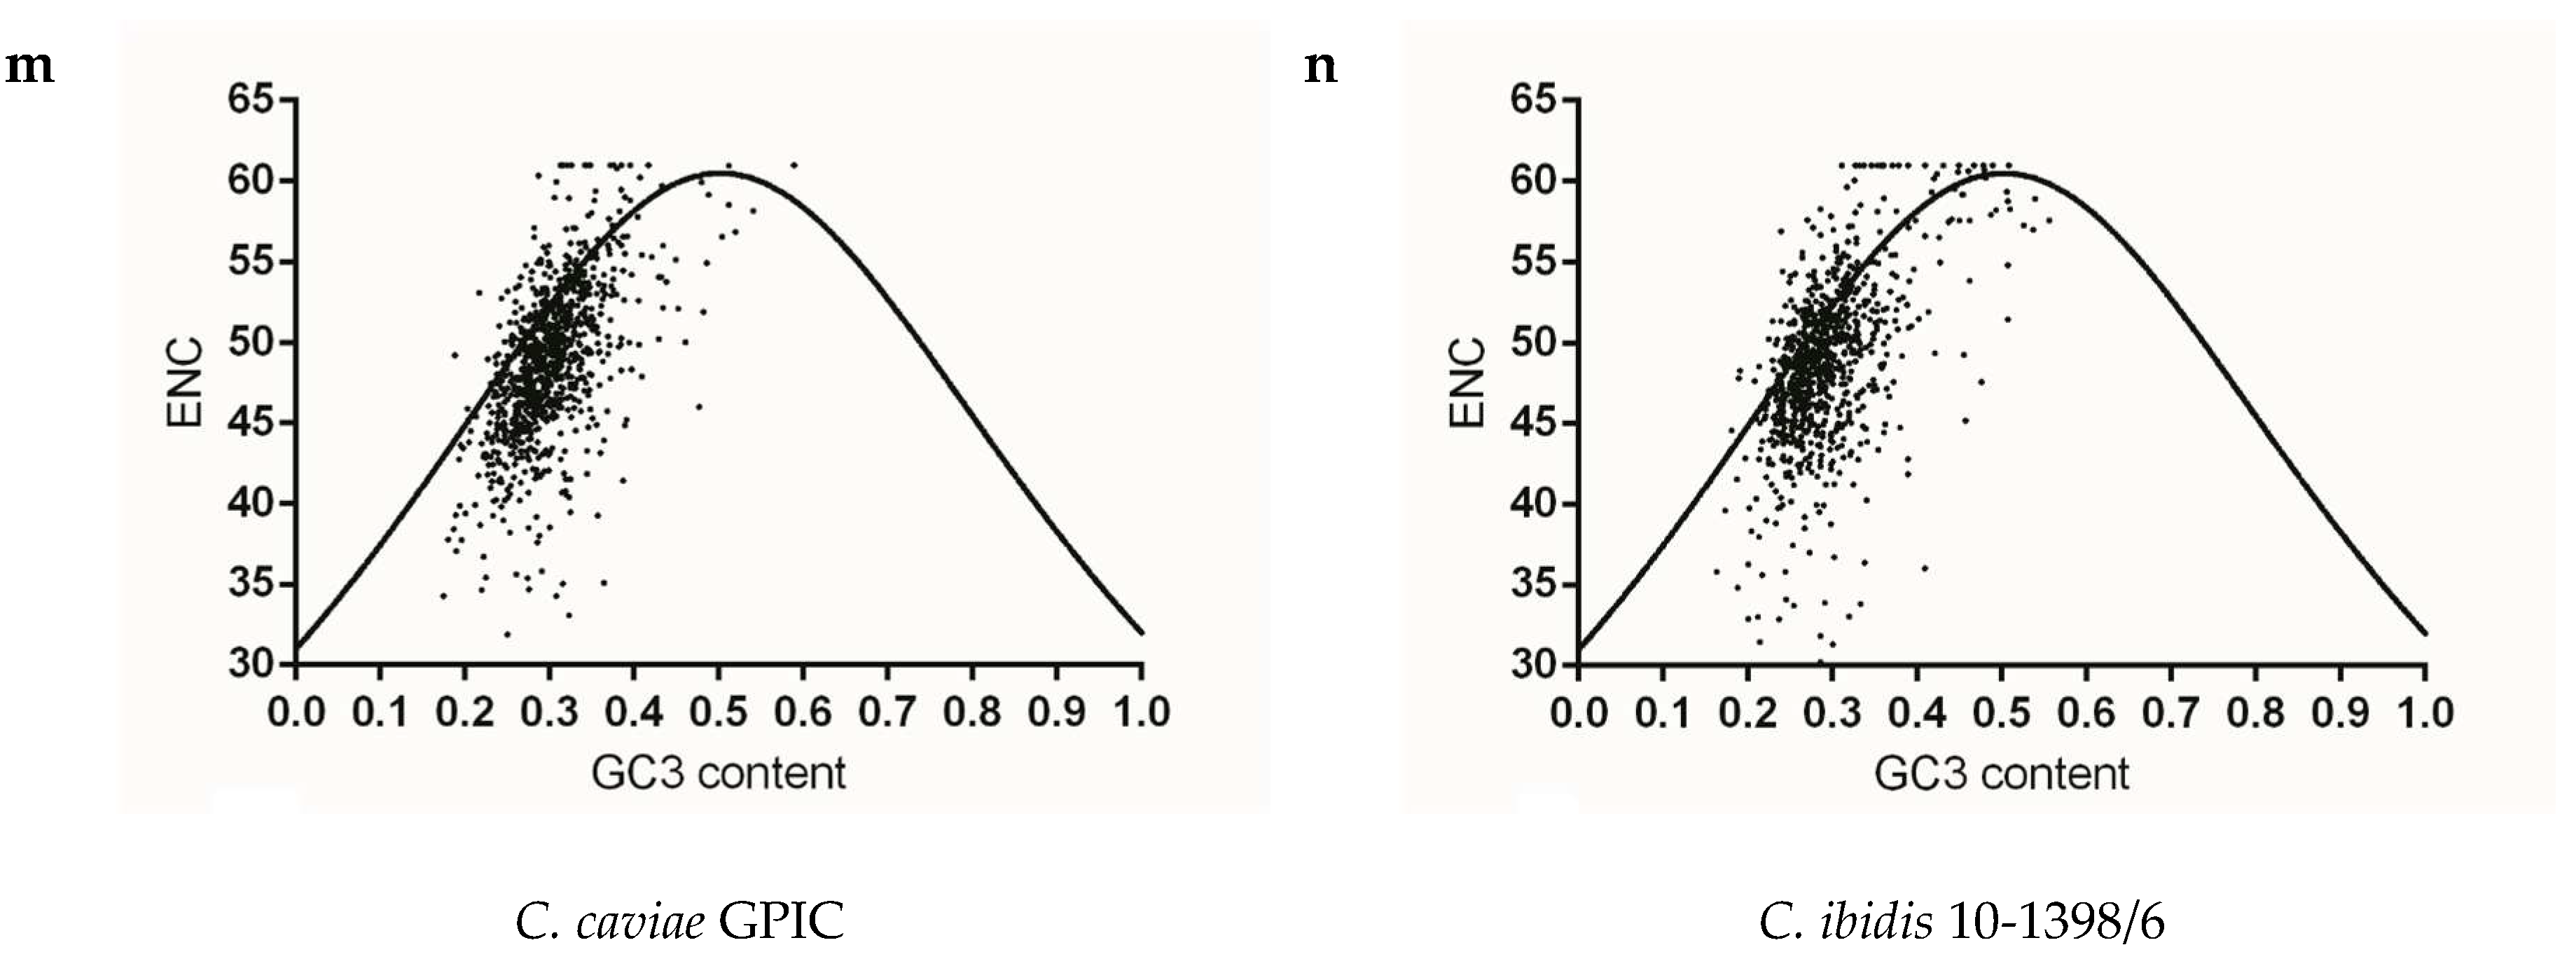
To identify whether gene codon usage patterns in each Chlamydia spp. were shaped solely by mutation pressure, natural selection, or both, ENC v.s GC3 content maps were constructed for each strain. The vast majority of plots for each species did not overlap the expected curve and were below this curve, and the below-curve scattering plots reflected the dominating effects of natural selection on genes of each species. As for the closely related species C. trachomatis, C. muridarum and C. suis, codon usage pattern at gene levels of C. trachomatis A-HAR-13 and C. muridarum Nigg represented more limited codon usage patterns than those of C. trachomatis L2/25567R, C. trachomatis E/SW3 and C. suis MD56 (Figure 4a–e). For C. pneumoniae and most of the mammal infecting Chlamydia spp., similar codon usage patterns among the corresponding genome were observed (Figure 4f–i,l–m). While the three newly identified bird-infesting Chlamydia spp., codon usage patterns of C. avium 10DC88 were more limited than those of C. gallinacea and C. ibidis (Figure 4j,k,n). To better identify the role of mutation pressure from gene nucleotide composition, correlations between ENC and GC3 contents of gene were calculated. ENC and GC3 content are positively correlated in all species (Table 2), suggesting that mutation pressure in all Chlamydia has dominant roles in shaping codon usage. In addition, significant negative correlation with the relative rank (r value ranging from −0.308 to −0.067) was found between CAI and ENC for all strains, excluding C. suis MD56, C. pecorum E58 and C. pneumoniae TW-183 (Table 3), implying that the obvious effect of codon usage bias the on codon usage pattern of gene population was just one among several evolutionary dynamics, compared with the role of mutation pressure.
2.6. High Codon Usage Adaptation of T3ss and Pmps Gene Families to that of Corresponding Genome
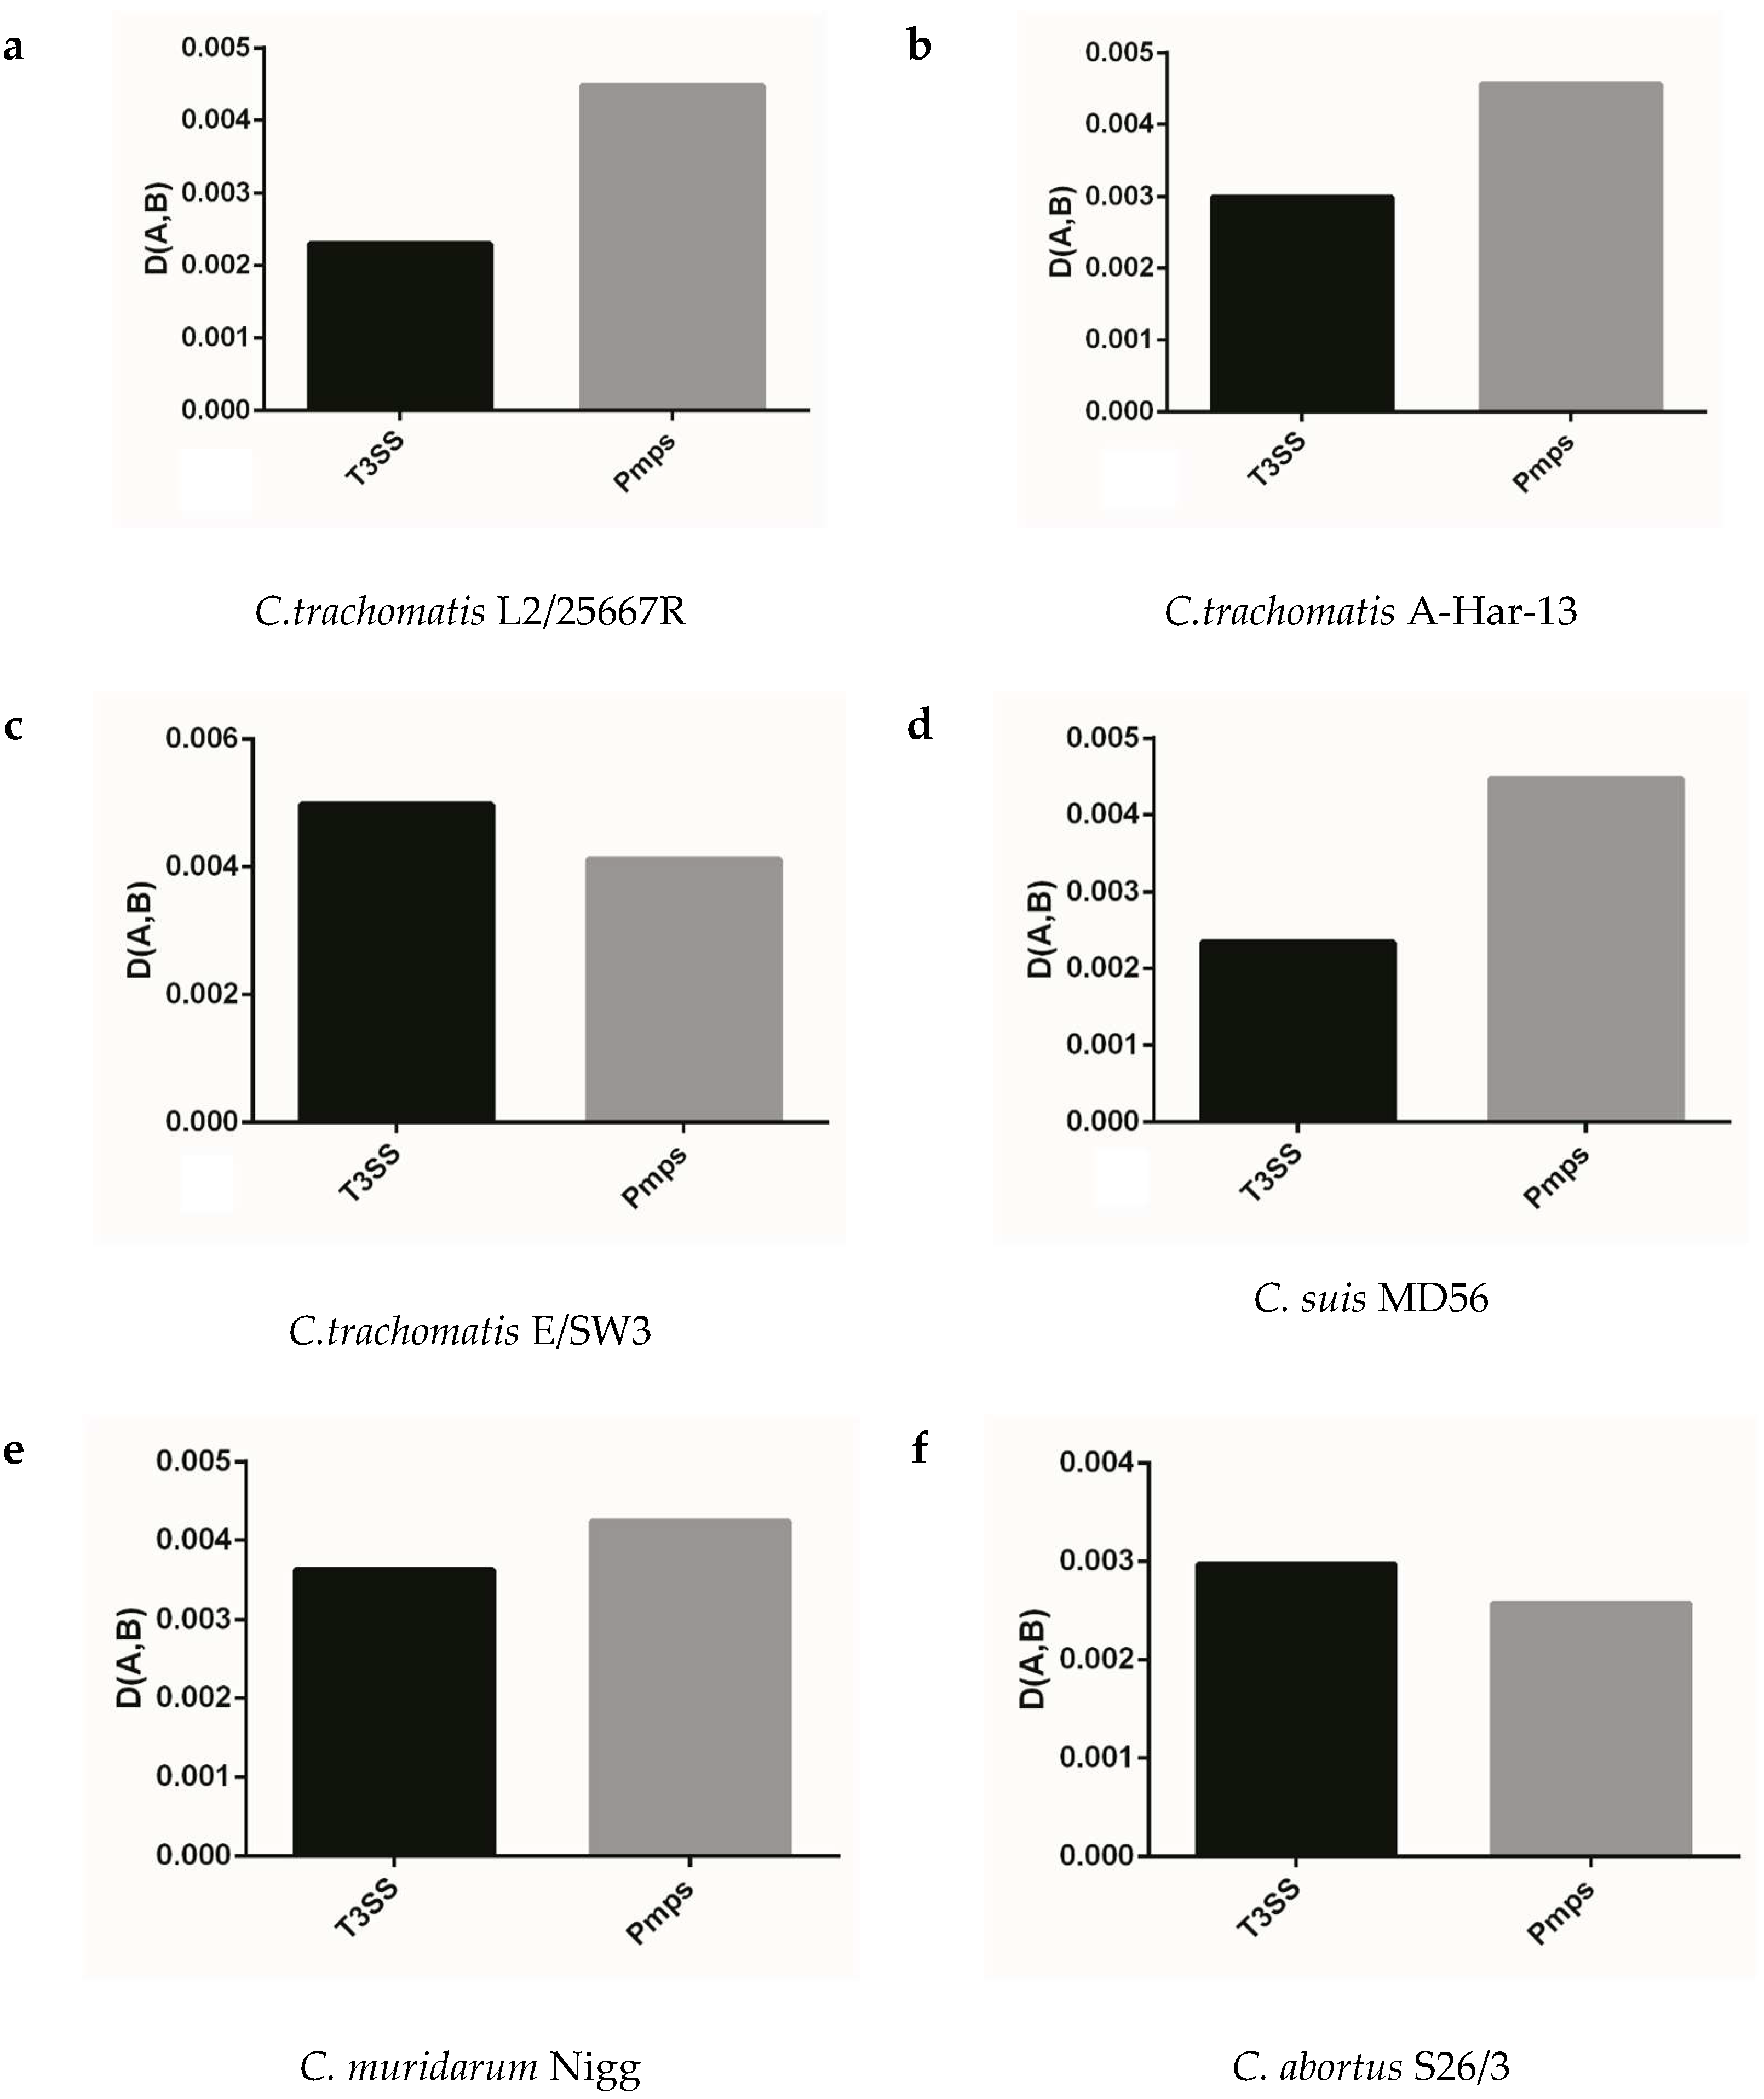
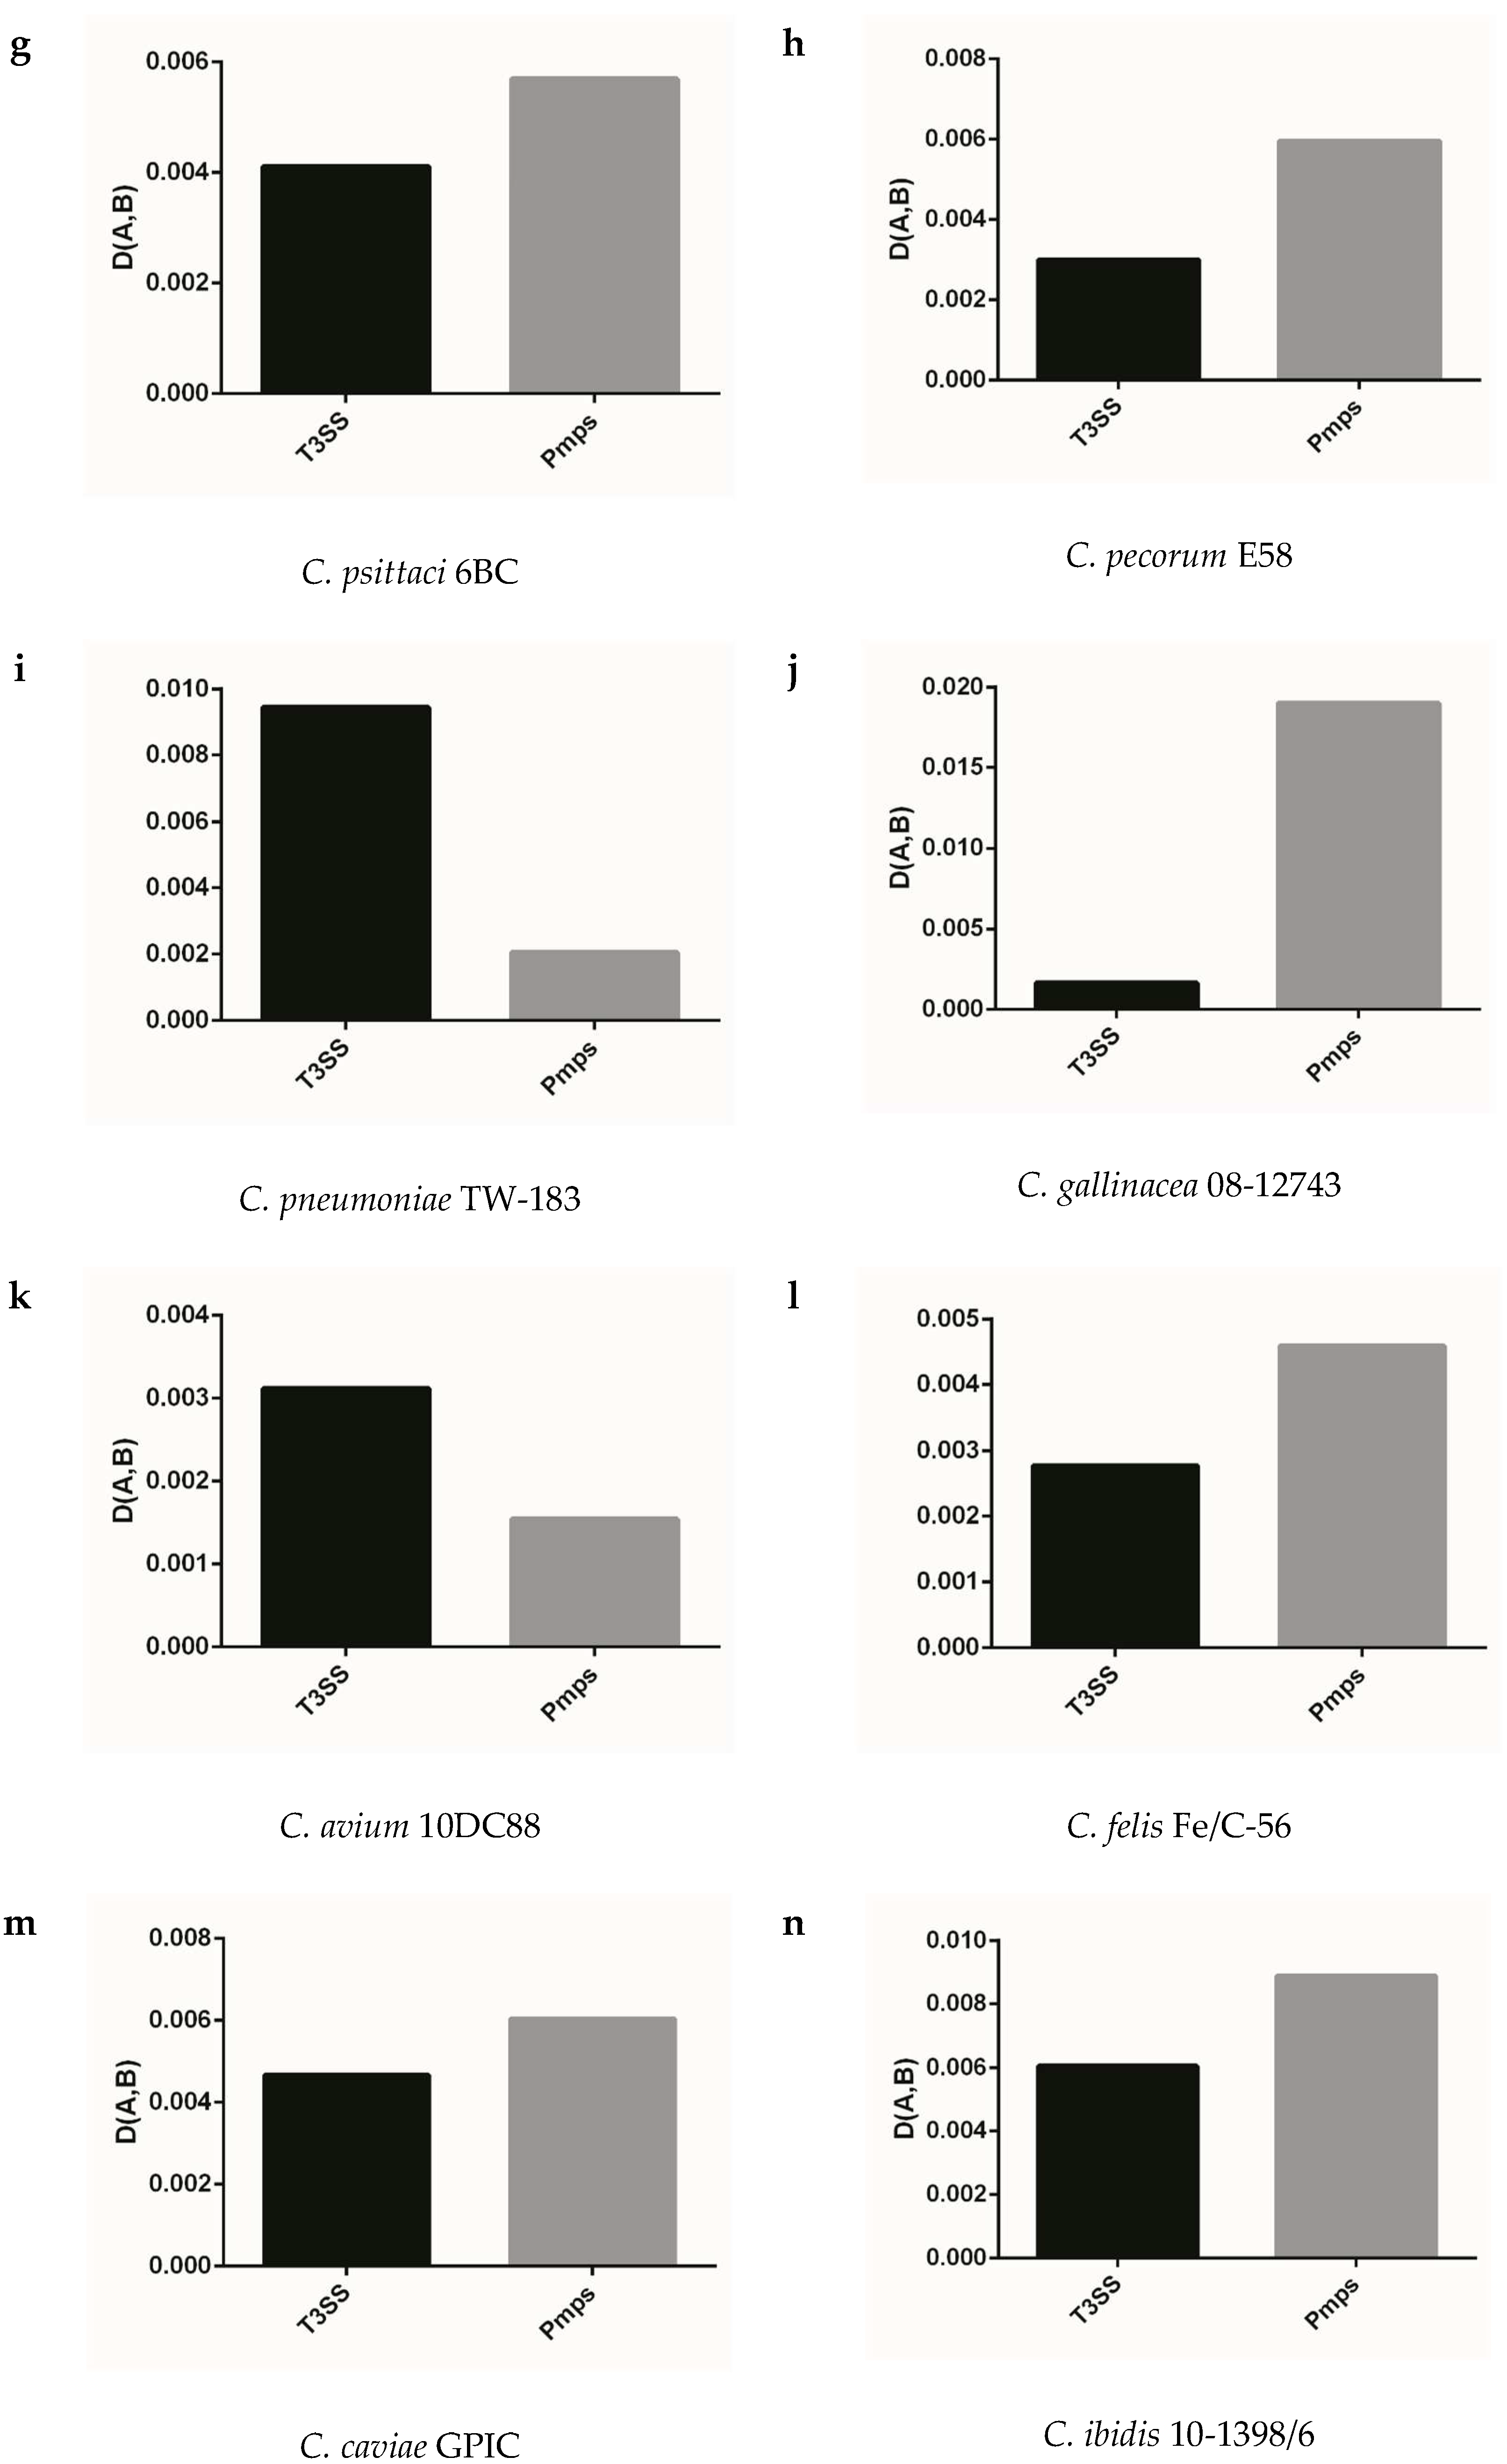
We analyzed the extent of codon usage adaptation between T3ss, Pmps gene families and the corresponding genome to better identify the role of codon usage of gene population in the target gene, which played important roles in life cycle of Chlamydia. As shown in Figure 5, the two gene families generally had strong codon usage adaptation to the corresponding genome (D (A,B) < 0.1) and failed to follow the similar model of codon usage pattern in Chlamydia spp. In the closely related species of C. trachomatis, C. muridarum and C. suis, the T3ss and Pmps genes had a similar adaptation of codon usage in all strains excluding C. suis MD56 (Figure 5a–e). The T3ss and Pmps gene families had an obviously different adaptation of codon usage in C. pneumoniae TW-183 when compared with its closely related Chlamydia spp, such as C. psittaci, C. pecorum, C. abortus, C. felis, and C. caviae (Figure 5i,f,g,h,l,m). While for the three newly identified bird Chlamydia spp. (C. gallinacean, C. avium and C. ibidis), the two gene families had an obviously different adaptation of codon usage in C. gallinacean 08-1274/3, compared with the other two species (Figure 5j,k,n). Since T3ss and Pmps genes had specific adaptations of codon usage in the corresponding genome, the strong codon usage adaptation of the two gene families to the corresponding genome implied evolutionary dynamic derived from genome organization influencing codon usage pattern of genes, which played an important role in the life cycle of Chlamydiae.
3. Discussion
Here, we gave an evolutionary insight into the relationship between nucleotide usages and codon usages in genomes of Chlamydiaceae family members, by means of information entropy, RSCU, ENC, CAI and a similarity index of codon usage adaptation. Although mutation pressure derived from nucleotide usages was identified as the dominant evolutionary dynamic in genomes of Chlamydia spp., other evolutionary dynamics, such as natural selection, also influenced codon usage patterns to modify the evolutionary trends of Chlamydia spp. In previous reports, GC3 content was regarded as a ruler, which is often used for reflecting influences of the overall nucleotide composition variations on codon usages at gene levels [31,40,41,42,43]. The four nucleotide bases are regarded as footstones for genomic organization of microorganisms, the systemic and general estimation of four nucleotide usage patterns is better than the estimation of GC3 content or AT3 content when displaying the roles of nucleotide usage patterns in formation of synonymous codon usage patterns [44,45]. Members of Chlamydiaeace have similar genomes and share almost the same gene contents although they infect different hosts with pathogenic diversity [46]. Quantification of four nucleotide usage variations in gene population of the bacteria is a benefit for the overall nucleotide usage bias. A great deal of genetic information, such as the origin of Chlamydia spp., efficient nutrient usage, and the regulation/expression of genes in corresponding genomes, existed in the complex interplay between the four base (A, C, T and G) usage variations [47,48]. The information entropy method is able to systemically display this complex weight ratio between the four bases. The nucleotide usage bias at the gene levels of Chlamydia spp. reflects the role of efficient nutrient usage in strand-specific nucleotide usage and GC content. Besides, almost all bacterial genomes exhibit nucleotide compositional asymmetry between the replicational leading and lagging strands; therefore, there is an excess of nucleotides G relative to C in the leading strand and of C to G in the lagging strand [36]. This study, in accordance with previous studies, showed that the nucleotide compositional asymmetry contributed to the codon usage bias of genes located in leading and lagging strands in Chlamydia spp. [37,38], which showed the influence of nucleotide usage bias on codon usages. Interestingly, the codon usage patterns derived from genomes of C. abortus and C. avium displayed differences from other Chlamydia spp. in this study. It implied that gene location in the corresponding genome might serve as one evolutionary dynamic for codon usage formation in Chlamydia spp. Generally, AT-rich was found in gene levels of these genomes of Chlamydia spp., suggesting that AT-rich in Chlamydia spp. genomes could be an evolutionary feedback for their genome, losing many genes that were related to metabolic activities. AT-rich in gene levels of bacteria genome enabled the bacteria to replicate themselves with a small amount of energy [29,32,49,50,51].
The nucleotide usage bias at the third codon position was generally stronger than the overall nucleotide usage bias at the gene level in all Chlamydia spp., suggesting that the dominant evolutionary dynamic was caused by the nucleotide composition function on the codon usage pattern of Chlamydiaceae. Interestingly, the overall nucleotide usage bias, nucleotide usage bias at the third codon position and synonymous codon usage pattern represented similar patterns in Chlamydiaceae, respectively. Currently, there are two evolutionary theories that explain why genetic code changes do not result in extinction of the species: the ‘codon capture’ theory and the ‘ambiguous intermediate’ theory [52]. For instance, Mycoplasma, a group of extracellular bacteria, have synonymous codon usage patterns that are regulated by the ‘codon capture’ theory [53,54] due to their extreme nucleotide usage bias (AT-rich). On the other hand, Chlamydia spp., the obligate intercellular bacteria, which do not contain extreme nucleotide usage bias at gene levels should not be mediated by the ‘codon capture’ theory but might follow the ‘ambiguous intermediate’ theory.
As obligate intercellular bacteria, the development cycle of Chlamydiae includes a unique intracellular stage when the microorganisms undergo growth and proliferation in the chlamydial inclusions inside the host cytoplasm, whereby the living activities of Chlamydiae deeply interacts with the host cellular processes. The parasitic life-style of Chlamydia spp. has driven them to adapt to the harsh intracellular environment during the evolutionary process. It has been accepted that co-evolution between intercellular pathogens and hosts can be performed by positive selection from the immune response of hosts and mutation pressure from pathogens [55,56]. Approximately, two-thirds of predicted proteins are shared across Chlamydia spp., which reflects genetic conservation and the evolutionary constraints that are imposed by their intracellular lifestyle and conserved developmental cycle [25,57]. Similarly, the members of Chlamydiaceae undergo a significant genomic degradation in the evolutionary process when compared with Parachlamydia acanthamoebae UWE25, a symbiont of ubiquitous protozoa, which is considered the evolutionary homolog of the last common ancestor of Chlamydia spp. with a genome twice as large in size [39]. The investigation into evolutionary dynamics of this family would be a benefit for better understanding the genetic trends of Chlamydiae. Compared with genetic diversity caused by amino acid usage in Chlamydia spp., evolutionary divergence caused by codon usage can separate Chlamydia spp. into different subgroups, suggesting codon usages play an important role in evolutionary trends in the Chlamydiaceae family. Horizontal gene transfer in Chlamydia plays an important role in sustaining a wide range of susceptible hosts [58]. Since horizontal gene transfer can be considered an important exogenous dynamic resulting in cross-species infection of these microorganisms, can endogenous genes, which function as important roles in life cycle of Chlamydia, be influenced by host bacteria? Pmps genes are considered as a highly heterogenous gene family and possess key biological activities in life cycle of Chlamydiae, and T3ss effectors which also play important roles in life cycle represent high variation of sequence similarity within Chlamydiaceae [1,59,60]. Interestingly, T3ss and Pmps genes represent strong codon usage adaptation to the corresponding host bacteria, implying that during formation of codon usage pattern, genes with important functions in Chlamydia spp. undergo natural selection from host bacteria. Previous reports have pointed out that those genes with important biological activities have a strong codon adaptation to their corresponding genomes, including ribosomal major transcription/translational processing factors, major chaperone/degradation proteins and also genes encoding enzymes of fatty acid biosynthesis, amino acid, and nucleotide biosynthesis [51,61,62].
4. Materials and Methods
4.1. The Genome Data
14 whole genomes of the 12 chlamydial species (three genomes for C. trachomatis) in the Chlamydiaceae family with coding sequence annotations were obtained from the National Center for Biotechnology (NCBI) GenBank database. The demographics of the selected species were given in Table S1.
4.2. Nucleotide Usage Patterns by Information Entropy
To clarify the effects of nucleotide composition on codon usage patterns, the following compositional properties were calculated for the coding sequences of the 14 genomes, namely the overall frequency of occurrence of nucleotides (N%, ‘N’ meaning any nucleotides), frequency of each nucleotide at the third codon position (N3%) and frequency of occurrence of nucleotides GC at the third codon position (GC3%). According to the pr evious report about analyzing nucleotide usage bias [32,55], we employed information entropy to reflect the overall nucleotide usage bias and nucleotide usage bias at the third codon position.
where fi means the probability of the specific nucleotide (Fi), Fi means a number of occurrences of the specific nucleotide. The value of Entropy for nucleotide usage bias represents how dispersed the contribution of these four types of nucleotide is: the higher value, the more uniform nucleotide usage is; in contrast, the lower value reflects a more biased usage of nucleotide.
4.3. Relative Synonymous Codon Usage (RSCU) Value
The RSCU values for all coding sequences of the 12 chlamydial genomes were calculated to determine the characteristics of synonymous codon usage without the confounding influences of the amino acid usages or the gene lengths [63]. It is obvious that RSCU values close to 1.0 indicate a lack of bias for the corresponding codons, in contrast, RSCU values deviating from 1.0 reflect usage bias for the corresponding codons. When the RSCU value is 1.0, the corresponding synonymous codon is selected equally and randomly. Furthermore, to better reflect the extent of synonymous codon usage trends, RSCU values more than 1.6 and less than 0.6 were regarded as ‘over-represented’ and ‘under-represented’ codons, respectively [64].
4.4. Amino Acid Usage Bias by Information Entropy
To better clarify the extent of amino acid usage bias, we reference d the formation of nucleotide usage bias mentioned above. As for amino acid usage bias of each gene, the information Entropy over the frequencies of different amino acids in a given gene is represented by the formula [32,55]:
where fi means the probability of the specific nucleotide (Fi). Fi means a number of occurrences of the specific amino acid. The total types of amino acid are 20. The value of Entropy for amino acid usage bias ranges from 0 to 1, and represents how a dispersed contribution of the twenty types of amino acid: the higher value, the more uniform amino acid usage; in the contrast, the lower value reflects the more biased usage of amino acid.
4.5. Genetic Diversity of Chlamydia at Synonymous Codon and Amino Acid Usages
Principal component analysis (PCA) is a multivariate statistical method which reduces data dimensionality by performing a covariance analysis for a data matrix. As for genetic diversity for Chlamydia at gene levels, PCA was carried out by RSCU data of the 14 genomes of 12 chlamydial species. As for genetic diversity for Chlamydia at amino acid levels, PCA was carried out by amino acid compositions of them.
4.6. Codon Usage Index
To better identify the relationship between nucleotide usages and the overall codon usage bias, an effective number of codons (ENC) analysis was introduced in this study [65]. The ENC values range from 20 to 61, which are able to reflect the role of GC3 content in the overall codon usage bias. The lower the ENC value, the more biased the overall codon usage. In addition, to identify the relationship between the overall codon usage bias and protein properties, codon adaptation index (CAI), the grand average of hydropholicity scale and aromaticity were used in this study. These codon index data for coding sequences of the 14 Chlamydia genomes were calculated by CodonW software (https://sourceforge.net/projects/codonw/).
4.7. Similarity of Codon Usage
To better quantify extents of codon usage adaptation of Pmps genes or T3ss genes to the corresponding species, R (A,B) index was introduced in this study. The formula for R (A,B) index was calculated as follows:
where R (A,B) index is defined as a cosine value of an included angle between A and B special vectors meaning the degree of similarity between Pmps/T3ss gene and the specific species at the aspect of the overall codon usage pattern, ai is defined as the RSCU value for a specific codon in 59 synonymous codons of coding sequence of Pmps or T3SS, bi is termed as the RSCU value for the same codon of the corresponding species. D (A,B) index represents the potential effect of the overall codon usage of host on that of DENV, and this value ranges from zero to 1.0 [66].
4.8. Statistical Methods
One-way ANOVA method was used to compare means of two or more groups containing numerical response data using the software SPSS 16.0 (IBM, Chicago, IL, USA) for Windows, and significant difference can be identified when p value <0.05. Correlation analysis was performed to identify the relationships between CAI data and ENC data/between ENC data and GC3 content for each strain using Spearman’s correlation method.
Supplementary Materials
Supplementary materials can be found at https://www.mdpi.com/1422-0067/19/12/4010/s1.
Author Contributions
J.Z. and Y.S. conceived the experiments. Z.L. and W.H. analyzed the results and wrote the manuscript. Z.L., W.H., P.L. and X.C. conducted the analyzed experiments.
Funding
This research was funded by the National Key R&D Program of China (2018YFD0502006), National Natural Science foundation of China (31502081), National Key R&D Program of China (2017YFD0500905), the National Modern Agricultural Industry Technology Fund for Scientists in Sheep Industry System, China (CARS-39-04B) and the grant derived from Gansu Police Vocational College (2018GJYXM02).
Acknowledgments
The authors appreciate Jianhua Zhou for his kind help in the analysis of data and organization of the manuscript.
Conflicts of Interest
The authors declare no conflict of interest.
Abbreviations
| ENC | Effective Number of Codons |
| CAI | Codon Adaptation Index |
| RSCU | Relative Synonymous Codon Usage |
| PCA | Principal Component Analysis |
| Pmps | Polymorphic membrane proteins |
| T3ss | Type III secretion system |
References
- Nunes, A.; Gomes, J.P. Evolution, phylogeny, and molecular epidemiology of Chlamydia. Infect. Genet. Evolut. 2014, 23, 49–64. [Google Scholar] [CrossRef] [PubMed]
- Sachse, K.; Bavoil, P.M.; Kaltenboeck, B.; Stephens, R.S.; Kuo, C.C.; Rossello-Mora, R.; Horn, M. Emendation of the family Chlamydiaceae: Proposal of a single genus, Chlamydia, to include all currently recognized species. Syst. Appl. Microbiol. 2015, 38, 99–103. [Google Scholar] [CrossRef] [PubMed] [Green Version]
- Vorimore, F.; Hsia, R.C.; Huot-Creasy, H.; Bastian, S.; Deruyter, L.; Passet, A.; Sachse, K.; Bavoil, P.; Myers, G.; Laroucau, K. Isolation of a New Chlamydia species from the Feral Sacred Ibis (Threskiornis aethiopicus): Chlamydia ibidis. PLoS ONE 2013, 8, e74823. [Google Scholar] [CrossRef] [PubMed]
- Rodolakis, A.; Yousef Mohamad, K. Zoonotic potential of Chlamydophila. Vet. Microbiol. 2010, 140, 382–391. [Google Scholar] [CrossRef] [PubMed] [Green Version]
- Feng, L.; Lu, X.; Yu, Y.; Wang, T.; Luo, S.; Sun, Z.; Duan, Q.; Wang, N.; Song, L. Survey, Culture, and Genome Analysis of Ocular Chlamydia trachomatis in Tibetan Boarding Primary Schools in Qinghai Province, China. Front. Cell. Infect. Microbiol. 2016, 6, 207. [Google Scholar] [CrossRef] [PubMed]
- Tsevat, D.G.; Wiesenfeld, H.C.; Parks, C.; Peipert, J.F. Sexually transmitted diseases and infertility. Am. J. Obstet. Gynecol. 2017, 216, 1–9. [Google Scholar] [CrossRef] [PubMed] [Green Version]
- Liu, Y.; Huang, Y.; Yang, Z.; Sun, Y.; Gong, S.; Hou, S.; Chen, C.; Li, Z.; Liu, Q.; Wu, Y.; Baseman, J.; Zhong, G. Plasmid-encoded Pgp3 is a major virulence factor for Chlamydia muridarum to induce hydrosalpinx in mice. Infect. Immun. 2014, 82, 5327–5335. [Google Scholar] [CrossRef]
- Kuo, C.C.; Jackson, L.A.; Campbell, L.A.; Grayston, J.T. Chlamydia pneumoniae (TWAR). Clin. Microbiol. Rev. 1995, 8, 451–461. [Google Scholar] [CrossRef]
- Harkinezhad, T.; Geens, T.; Vanrompay, D. Chlamydophila psittaci infections in birds: A review with emphasis on zoonotic consequences. Vet Microbiol. 2009, 135, 68–77. [Google Scholar] [CrossRef]
- Li, Z.; Cao, X.; Fu, B.; Chao, Y.; Cai, J.; Zhou, J. Identification and characterization of Chlamydia abortus isolates from yaks in Qinghai, China. BioMed Res. Int. 2015, 2015, 658519. [Google Scholar]
- Everett, K.D. Chlamydia and Chlamydiales: More than meets the eye. Vet Microbiol. 2000, 75, 109–126. [Google Scholar] [CrossRef]
- Zocevic, A.; Vorimore, F.; Marhold, C.; Horvatek, D.; Wang, D.; Slavec, B.; Prentza, Z.; Stavianis, G.; Prukner-Radovcic, E.; Dovc, A.; Siarkou, V.I.; Laroucau, K. Molecular characterization of atypical Chlamydia and evidence of their dissemination in different European and Asian chicken flocks by specific real-time PCR. Environ. Microbiol. 2012, 14, 2212–2222. [Google Scholar] [CrossRef] [PubMed]
- Zocevic, A.; Vorimore, F.; Vicari, N.; Gasparini, J.; Jacquin, L.; Sachse, K.; Magnino, S.; Laroucau, K. A real-time PCR assay for the detection of atypical strains of Chlamydiaceae from pigeons. PLoS ONE 2013, 8, e58741. [Google Scholar] [CrossRef] [PubMed]
- Abdelrahman, Y.M.; Belland, R.J. The chlamydial developmental cycle. FEMS Microbiol. Rev. 2005, 29, 949–959. [Google Scholar] [CrossRef] [PubMed]
- Molleken, K.; Schmidt, E.; Hegemann, J.H. Members of the Pmp protein family of Chlamydia pneumoniae mediate adhesion to human cells via short repetitive peptide motifs. Mol. Microbiol. 2010, 78, 1004–1017. [Google Scholar] [CrossRef] [Green Version]
- Gomes, J.P.; Nunes, A.; Bruno, W.J.; Borrego, M.J.; Florindo, C.; Dean, D. Polymorphisms in the nine polymorphic membrane proteins of Chlamydia trachomatis across all serovars: Evidence for serovar Da recombination and correlation with tissue tropism. J. Bacteriol. 2006, 188, 275–286. [Google Scholar] [CrossRef] [PubMed]
- Rockey, D.D.; Lenart, J.; Stephens, R.S. Genome sequencing and our understanding of chlamydiae. Infect. Immun. 2000, 68, 5473–5479. [Google Scholar] [CrossRef] [PubMed]
- Mueller, K.E.; Plano, G.V.; Fields, K.A. New frontiers in type III secretion biology: The Chlamydia perspective. Infect. Immun. 2014, 82, 2–9. [Google Scholar] [CrossRef] [PubMed]
- Ferrell, J.C.; Fields, K.A. A working model for the type III secretion mechanism in Chlamydia. Microb. Infect. 2016, 18, 84–92. [Google Scholar] [CrossRef] [PubMed] [Green Version]
- Hueck, C.J. Type III protein secretion systems in bacterial pathogens of animals and plants. Microbiol. Mol. Biol. Rev. 1998, 62, 379–433. [Google Scholar] [PubMed]
- Betts, H.J.; Wolf, K.; Fields, K.A. Effector protein modulation of host cells: Examples in the Chlamydia spp. arsenal. Curr. Opin. Microbiol. 2009, 12, 81–87. [Google Scholar] [CrossRef] [PubMed]
- Weber, M.M.; Lam, J.L.; Dooley, C.A.; Noriea, N.F.; Hansen, B.T.; Hoyt, F.H.; Carmody, A.B.; Sturdevant, G.L.; Hackstadt, T. Absence of Specific Chlamydia trachomatis Inclusion Membrane Proteins Triggers Premature Inclusion Membrane Lysis and Host Cell Death. Cell Rep. 2017, 19, 1406–1417. [Google Scholar] [CrossRef] [PubMed]
- Clark, T.R.; Noriea, N.F.; Bublitz, D.C.; Ellison, D.W.; Martens, C.; Lutter, E.I.; Hackstadt, T. Comparative genome sequencing of Rickettsia rickettsii strains that differ in virulence. Infect. Immun. 2015, 83, 1568–1576. [Google Scholar] [CrossRef] [PubMed]
- Stephens, R.S.; Kalman, S.; Lammel, C.; Fan, J.; Marathe, R.; Aravind, L.; Mitchell, W.; Olinger, L.; Tatusov, R.L.; Zhao, Q.; Koonin, E.V.; Davis, R.W. Genome sequence of an obligate intracellular pathogen of humans: Chlamydia trachomatis. Science (New York, N.Y.) 1998, 282, 754–759. [Google Scholar] [CrossRef]
- Elwell, C.; Mirrashidi, K.; Engel, J. Chlamydia cell biology and pathogenesis. Nature Rev. Microbiol. 2016, 14, 385–400. [Google Scholar] [CrossRef] [PubMed] [Green Version]
- Muhlhausen, S.; Findeisen, P.; Plessmann, U.; Urlaub, H.; Kollmar, M. A novel nuclear genetic code alteration in yeasts and the evolution of codon reassignment in eukaryotes. Genome Res. 2016, 26, 945–955. [Google Scholar] [CrossRef] [PubMed] [Green Version]
- Ling, J.; O’Donoghue, P.; Soll, D. Genetic code flexibility in microorganisms: Novel mechanisms and impact on physiology. Nature Rev. Microbiol. 2015, 13, 707–721. [Google Scholar] [CrossRef] [PubMed]
- Camiolo, S.; Melito, S.; Porceddu, A. New insights into the interplay between codon bias determinants in plants. DNA Res. 2015, 22, 461–470. [Google Scholar] [CrossRef] [Green Version]
- Sharp, P.M.; Emery, L.R.; Zeng, K. Forces that influence the evolution of codon bias. Phil. Trans. R. Soc. Lond. B 2010, 365, 1203–1212. [Google Scholar] [CrossRef] [Green Version]
- Maran, T.; Kleisner, K. Towards an Evolutionary Biosemiotics: Semiotic Selection and Semiotic Co-option. Biosemiotics 2010, 3, 189–200. [Google Scholar] [CrossRef]
- Ma, X.X.; Ma, P.; Chang, Q.Y.; Liu, Z.B.; Zhang, D.; Zhou, X.K.; Ma, Z.R.; Cao, X. Adaptation of Borrelia burgdorferi to its natural hosts by synonymous codon and amino acid usage. J. Basic Microbiol. 2018, 58, 414–424. [Google Scholar] [CrossRef] [PubMed]
- Wang, Y.N.; Ji, W.H.; Li, X.R.; Liu, Y.S.; Zhou, J.H. Unique features of nucleotide and codon usage patterns in mycoplasmas revealed by information entropy. Biosystems 2018, 165, 1–7. [Google Scholar] [CrossRef] [PubMed]
- Ma, X.X.; Chang, Q.Y.; Ma, P.; Li, L.J.; Zhou, X.K.; Zhang, D.R.; Li, M.S.; Cao, X.; Ma, Z.R. Analyses of nucleotide, codon and amino acids usages between peste des petits ruminants virus and rinderpest virus. Gene 2017, 637, 115–123. [Google Scholar] [CrossRef] [PubMed]
- Mioduser, O.; Goz, E.; Tuller, T. Significant differences in terms of codon usage bias between bacteriophage early and late genes: A comparative genomics analysis. BMC Genom. 2017, 18, 866. [Google Scholar] [CrossRef]
- Pop, C.; Rouskin, S.; Ingolia, N.T.; Han, L.; Phizicky, E.M.; Weissman, J.S.; Koller, D. Causal signals between codon bias, mRNA structure, and the efficiency of translation and elongation. Mol. Syst. Biol. 2014, 10, 770. [Google Scholar] [CrossRef]
- Yu, C.H.; Dang, Y.; Zhou, Z.; Wu, C.; Zhao, F.; Sachs, M.S.; Liu, Y. Codon Usage Influences the Local Rate of Translation Elongation to Regulate Co-translational Protein Folding. Mol. Cell 2015, 59, 744–754. [Google Scholar] [CrossRef]
- Mrazek, J.; Karlin, S. Strand compositional asymmetry in bacterial and large viral genomes. Proc. Natl. Acad. Sci. USA 1998, 95, 3720–3725. [Google Scholar] [CrossRef] [Green Version]
- Guo, F.B.; Yu, X.J. Separate base usages of genes located on the leading and lagging strands in Chlamydia muridarum revealed by the Z curve method. BMC Genom. 2007, 8, 366. [Google Scholar] [CrossRef]
- Zhou, T.; Sun, X.; Lu, Z. Synonymous codon usage in environmental chlamydia UWE25 reflects an evolutional divergence from pathogenic chlamydiae. Gene 2006, 368, 117–125. [Google Scholar] [CrossRef]
- Ma, X.X.; Ma, P.; Chang, Q.Y.; Li, L.J.; Zhou, X.K.; Zhang, D.R.; Li, M.S.; Cao, X.; Ma, Z.R. The analyses of relationships among nucleotide, synonymous codon and amino acid usages for E2 gene of bovine viral diarrhea virus. Gene 2018, 660, 62–67. [Google Scholar] [CrossRef]
- Ma, X.X.; Cao, X. Comparative genomic analysis for nucleotide, codon, and amino acid usage patterns of mycoplasmas. J. Basic Microbiol. 2018, 58, 425–439. [Google Scholar] [CrossRef] [PubMed]
- Ermolaeva, M.D. Synonymous codon usage in bacteria. Curr. Issues Mol. Biol. 2001, 3, 91–97. [Google Scholar] [PubMed]
- Nasrullah, I.; Butt, A.M.; Tahir, S.; Idrees, M.; Tong, Y. Genomic analysis of codon usage shows influence of mutation pressure, natural selection, and host features on Marburg virus evolution. BMC Evolut. Biol. 2015, 15, 174. [Google Scholar] [CrossRef] [PubMed]
- Butt, A.M.; Nasrullah, I.; Qamar, R.; Tong, Y. Evolution of codon usage in Zika virus genomes is host and vector specific. Emerg. Microbes. Infect. 2016, 5, e107. [Google Scholar] [CrossRef] [PubMed]
- Cutter, A.D.; Wasmuth, J.D.; Blaxter, M.L. The evolution of biased codon and amino acid usage in nematode genomes. Mol. Biol. Evolut. 2006, 23, 2303–2315. [Google Scholar] [CrossRef] [PubMed]
- Rajaram, K.; Giebel, A.M.; Toh, E.; Hu, S.; Newman, J.H.; Morrison, S.G.; Kari, L.; Morrison, R.P. Mutational Analysis of the Chlamydia muridarum Plasticity Zone. Infect. Immun. 2015, 83, 2870–2881. [Google Scholar] [CrossRef] [PubMed] [Green Version]
- Chen, W.H.; Lu, G.; Bork, P.; Hu, S.; Lercher, M.J. Energy efficiency trade-offs drive nucleotide usage in transcribed regions. Infect. Immun. 2016, 7, 11334. [Google Scholar] [CrossRef] [PubMed] [Green Version]
- Zeng, K.; Charlesworth, B. Estimating selection intensity on synonymous codon usage in a nonequilibrium population. Genetics 2009, 183, 651–662. [Google Scholar] [CrossRef]
- Bragg, J.G.; Quigg, A.; Raven, J.A.; Wagner, A. Protein elemental sparing and codon usage bias are correlated among bacteria. Mol. Ecol. 2012, 21, 2480–2487. [Google Scholar] [CrossRef]
- Buckland, R.J.; Watt, D.L.; Chittoor, B.; Nilsson, A.K.; Kunkel, T.A.; Chabes, A. Increased and imbalanced dNTP pools symmetrically promote both leading and lagging strand replication infidelity. PLoS Genet. 2014, 10, e1004846. [Google Scholar] [CrossRef]
- Seward, E.A.; Kelly, S. Dietary nitrogen alters codon bias and genome composition in parasitic microorganisms. Genome Biol. 2016, 17, 226. [Google Scholar] [CrossRef] [PubMed]
- Santos, M.A.; Moura, G.; Massey, S.E.; Tuite, M.F. Driving change: The evolution of alternative genetic codes. Trends Genet. 2004, 20, 95–102. [Google Scholar] [CrossRef] [PubMed]
- Oba, T.; Andachi, Y.; Muto, A.; Osawa, S. CGG: An unassigned or nonsense codon in Mycoplasma capricolum. Proc. Natl. Acad. Sci. USA 1991, 88, 921–925. [Google Scholar] [CrossRef]
- Osawa, S.; Jukes, T.H. Codon reassignment (codon capture) in evolution. J. Mol. Evolut. 1989, 28, 271–278. [Google Scholar] [CrossRef]
- Cao, X.A.; Hu, W.; Shang, Y.J.; Liu, Y.S.; Han, S.Y.; Wang, Y.N.; Zhao, L.; Li, X.R.; Zhou, J.H. Analyses of nucleotide, synonymous codon and amino acid usages at gene levels of Brucella melitensis strain QY1. Infect. Genet. Evolut. 2018, 65, 257–264. [Google Scholar] [CrossRef] [PubMed]
- Zhou, J.H.; Wang, Y.N.; Chang, Q.Y.; Ma, P.; Hu, Y.; Cao, X. Type III Interferons in Viral Infection and Antiviral Immunity. Cell. Physiol. Biochem. 2018, 51, 173–185. [Google Scholar] [CrossRef] [PubMed]
- Bachmann, N.L.; Polkinghorne, A.; Timms, P. Chlamydia genomics: Providing novel insights into chlamydial biology. Trends Microbiol. 2014, 22, 464–472. [Google Scholar] [CrossRef] [PubMed]
- Kim, H.; Kwak, W.; Yoon, S.H.; Kang, D.K.; Kim, H. Horizontal gene transfer of Chlamydia: Novel insights from tree reconciliation. PLoS ONE 2018, 13, e0195139. [Google Scholar] [CrossRef] [PubMed]
- Jewett, T.J.; Miller, N.J.; Dooley, C.A.; Hackstadt, T. The conserved Tarp actin binding domain is important for chlamydial invasion. PLoS Pathog. 2010, 6, e1000997. [Google Scholar] [CrossRef] [PubMed]
- Lutter, E.I.; Martens, C.; Hackstadt, T. Evolution and conservation of predicted inclusion membrane proteins in chlamydiae. Comp. Funct. Genom. 2012, 2012, 362104. [Google Scholar] [CrossRef] [PubMed]
- Das, S.; Roymondal, U.; Sahoo, S. Analyzing gene expression from relative codon usage bias in Yeast genome: A statistical significance and biological relevance. Gene 2009, 443, 121–131. [Google Scholar] [CrossRef] [PubMed]
- Rocha, E.P.; Danchin, A. Base composition bias might result from competition for metabolic resources. Trends Genet. 2002, 18, 291–294. [Google Scholar] [CrossRef]
- Sharp, P.M.; Li, W.H. Codon usage in regulatory genes in Escherichia coli does not reflect selection for ‘rare’ codons. Nucleic Acids Res. 1986, 14, 7737–7749. [Google Scholar] [CrossRef] [PubMed] [Green Version]
- Zhou, J.H.; Gao, Z.L.; Zhang, J.; Ding, Y.Z.; Stipkovits, L.; Szathmary, S.; Pejsak, Z.; Liu, Y.S. The analysis of codon bias of foot-and-mouth disease virus and the adaptation of this virus to the hosts. Infect. Genet. Evolut. 2013, 14, 105–110. [Google Scholar] [CrossRef] [PubMed]
- Wright, F. The ‘effective number of codons’ used in a gene. Gene 1990, 87, 23–29. [Google Scholar] [CrossRef]
- Zhou, J.H.; Zhang, J.; Sun, D.J.; Ma, Q.; Chen, H.T.; Ma, L.N.; Ding, Y.Z.; Liu, Y.S. The distribution of synonymous codon choice in the translation initiation region of dengue virus. PLoS ONE 2013, 8, e77239. [Google Scholar] [CrossRef] [PubMed]
Figure 1.
The overall codon usage bias and codon usage bias at the third codon position at gene levels of the Chlamydia spp. (a) C. trachomatis L2/25567R, (b) C. trachomatis A-HAR-13, (c) C. trachomatis E/SW3, (d) C. suis MD56, (e) C. muridarum Nigg, (f) C. abortus S26/3, (g) C. psittaci 6BC, (h) C. pecorum E58, (i) C. pneumoniae TW-183, (j) C. gallinacea 08-12743, (k) C. avium 10DC88, (l) C. felis Fe/C-56, (m) C. caviae GPIC, (n) C. ibidis 10-1398/6. *** p < 0.001.


Figure 2.
Principal component analysis of codon usage patterns at gene levels of the Chlamydia spp. The red triangle points to the three biovar strains of C. trachomatis (trachoma biovar strain A-HAR-13, genital tract infection biovar strain E/SW3, and lymphogranuloma venereum biovar strain L2/25567R), which highly overlap each other. The Chlamydia spp. clustered in separate groups were highlighted in red ellipses.

Figure 3.
Principal component analysis of amino acid usage patterns of Chlamydia spp. The red triangle points to the two C. trachomatis strains (genital tract infection biovar strain E/SW3 and lymphogranuloma venereum biovar strain L2/25567R), which highly overlap each other, while the red shows the trachoma biovar strain A-HAR-13). The Chlamydia spp. clustered in separate groups were highlighted in red ellipses.

Figure 4.
The relationship between the overall codon usage patterns represented by ENC values and GC composition at the third synonymous codon position (GC3) at gene levels of the Chlamydia spp. (a) C. trachomatis L2/25567R, (b) C. trachomatis A-HAR-13, (c) C. trachomatis E/SW3, (d) C. suis MD56, (e) C. muridarum Nigg, (f) C. abortus S26/3, (g) C. psittaci 6BC, (h) C. pecorum E58, (i) C. pneumoniae TW-183, (j) C. gallinacea 08-12743, (k) C. avium 10DC88, (l) C. felis Fe/C-56, (m) C. caviae GPIC, (n) C. ibidis 10-1398/6.


Figure 5.
The adaptation of synonymous codon usage patterns between T3ss and Pmps gene families to the corresponding genome. (a) C. trachomatis L2/25567R, (b) C. trachomatis A-HAR-13, (c) C. trachomatis E/SW3, (d) C. suis MD56, (e) C. muridarum Nigg, (f) C. abortus S26/3, (g) C. psittaci 6BC, (h) C. pecorum E58, (i) C. pneumoniae TW-183, (j) C. gallinacea 08-12743, (k) C. avium 10DC88, (l) C. felis Fe/C-56, (m) C. caviae GPIC, (n) C. ibidis 10-1398/6.


Table 1.
Nucleotide content (%) of the 14 Chlamydia strains at gene levels.
| Species | T% | C% | A% | G% | T3% | C3% | A3% | G3% |
|---|---|---|---|---|---|---|---|---|
| C. trachomatis L2/25567R | 29.9 ± 3.18 | 20 ± 3.37 | 28.4 ± 3.31 | 21.7 ± 3.38 | 36.5 ± 4 | 16.6 ± 5.05 | 29.01 ± 3.93 | 17.9 ± 4.73 |
| C. trachomatis A-Har-13 | 29.9 ± 3.39 | 20 ± 3.43 | 28.5 ± 3.49 | 21.6 ± 3.61 | 36 ± 4.27 | 16.6 ± 5.12 | 29.1 ± 4.15 | 17.9 ± 4.84 |
| C. trachomatis ESW3 | 29.9 ± 3.2 | 20 ± 3.37 | 28.4 ± 3.34 | 21.7 ± 3.4 | 29.9 ± 3.2 | 20 ± 3.37 | 28.4 ± 3.34 | 21.7 ± 3.4 |
| C. suis MD56 | 29.5 ± 3.5 | 20.4 ± 3.5 | 28.1 ± 3.7 | 22 ± 3.7 | 35 ± 4.4 | 17.5 ± 5.3 | 28.2 ± 4.3 | 19.0 ± 5.2 |
| C. muridarum Nigg | 30.5 ± 3.3 | 19.5 ± 3.3 | 28.8 ± 3.5 | 21.2 ± 3.7 | 38 ± 4.1 | 15.6 ± 5.0 | 29.5 ± 4.2 | 17.3 ± 5.0 |
| C. abortus S26/3 | 29.9 ± 3.4 | 19.8 ± 2.8 | 29.7 ± 3.5 | 20.6 ± 2.9 | 36 ± 4.5 | 17.3 ± 4.4 | 29.8 ± 4.3 | 16.8 ± 4.0 |
| C. psittaci 6BC | 30.2 ± 3.3 | 19.4 ± 2.6 | 30.1 ± 3.4 | 20.3 ± 2.8 | 38 ± 4.3 | 16.2 ± 4.3 | 30.8 ± 4.3 | 15.5 ± 3.7 |
| C. pecorum E58 | 29.5 ± 3.8 | 20.3 ± 4.0 | 28.8 ± 4.1 | 21.3 ± 3.9 | 36 ± 5.3 | 17.3 ± 6.1 | 28.4 ± 5.3 | 18.6 ± 5.5 |
| C. pneumoniae TW-183 | 29.5 ± 3.6 | 20.4 ± 3.2 | 29.2 ± 3.6 | 20.9 ± 3.1 | 36 ± 4.8 | 18.1 ± 5.1 | 28.9 ± 4.9 | 16.9 ± 4.3 |
| C. gallinacea 08-12743 | 31.3 ± 3.7 | 18.8 ± 3.2 | 30.3 ± 3.7 | 19.7 ± 3.5 | 39 ± 4.8 | 14.1 ± 4.8 | 31.6 ± 4.9 | 15.0 ± 4.6 |
| C. avium 10DC88 | 31.7 ± 3.7 | 18.2 ± 3.0 | 30.9 ± 3.7 | 19.2 ± 3.3 | 40 ± 5.1 | 13.2 ± 4.4 | 32.8 ± 4.9 | 13.8 ± 4.2 |
| C. felis Fe/C-56 | 30.1 ± 3.3 | 19.5 ± 2.7 | 29.9 ± 3.5 | 20.4 ± 2.9 | 37 ± 4.4 | 16.5 ± 4.1 | 30.4 ± 4.4 | 16.0 ± 3.9 |
| C. caviae GPIC | 30.2 ± 3.4 | 19.3 ± 2.7 | 30.0 ± 3.5 | 20.5 ± 2.9 | 38 ± 4.5 | 16.0 ± 4.2 | 30.4 ± 4.5 | 15.8 ± 3.9 |
| C. ibidis 10-1398 6 | 31.0 ± 3.7 | 18.5 ± 2.5 | 30.2 ± 3.6 | 20.3 ± 3.2 | 39 ± 4.8 | 14.5 ± 3.8 | 30.6 ± 5.0 | 15.7 ± 3.9 |
Table 2.
The correlation analysis for the effective number of codons (ENC) value and GC3 content of Chlamydia spp.
Table 2.
The correlation analysis for the effective number of codons (ENC) value and GC3 content of Chlamydia spp.
| Strains | Correlation | Significance |
|---|---|---|
| C. trachomatis L2/25567R | r = 0.369 | p = 3.7 × 10⁻³⁰ |
| C. trachomatis A-Har-13 | r = 0.512 | p = 1.8 × 10−63 |
| C. trachomatis ESW3 | r = 0.560 | p = 2.7 × 10−74 |
| C. suis MD56 | r = 0.511 | p = 2.2 × 10−63 |
| C. muridarum Nigg | r = 0.520 | p = 2.1 × 10−63 |
| C. abortus S26/3 | r = 0.590 | p = 5.3 × 10−93 |
| C. psittaci 6BC | r = 0.585 | p = 1.0 × 10−89 |
| C. pecorum E58 | r = 0.554 | p = 2.8 × 10−79 |
| C. pneumoniae TW-183 | r = 0.488 | p = 2.8 × 10−67 |
| C. gallinacea 08-12743 | r = 0.548 | p = 1.6 × 10−71 |
| C. avium 10DC88 | r = 0.630 | p = 1.3 × 10−104 |
| C. felis Fe/C-56 | r = 0.580 | p = 4.5 × 10−89 |
| C. caviae GPIC | r = 0.585 | p = 1.1 × 10−91 |
| C. ibidis 10-1398/6 | r = 0.547 | p = 1.4 × 10−76 |
Table 3.
The correlation between the codon adaptiation index (CAI) and ENC of Chlamydia spp.
| Strains | Correlation | Significance |
|---|---|---|
| C. trachomatis L2/25567R | r = 0.272 | p = 1.6 × 10⁻¹⁶ |
| C. trachomatis A-Har-13 | r = −0.186 | p = 9.6 × 10⁻⁹ |
| C. trachomatis ESW3 | r = −0.257 | p = 7.4 × 10⁻¹⁵ |
| C. suis MD56 | r = −0.417 | p = 9.8 × 10−41 |
| C. muridarum Nigg | r = −0.16 | p = 1.5 × 10⁻⁶ |
| C. abortus S26/3 | r = −0.299 | p = 9.8 × 10⁻²² |
| C. psittaci 6BC | r = −0.311 | p = 4.9 × 10⁻²³ |
| C. pecorum E58 | r = 0.005 | p = 0.882 |
| C. pneumoniae TW-183 | r = −0.04 | p = 0.187 |
| C. gallinacea 08-12743 | r = −0.168 | p = 4.0 × 10⁻⁷ |
| C. avium 10DC88 | r = −0.308 | p = 5.4 × 10⁻²² |
| C. felis Fe/C-56 | r = −0.268 | p = 1.4 × 10⁻¹⁷ |
| C. caviae GPIC | r = −0.275 | p = 1.4 × 10⁻¹⁸ |
| C. ibidis 10-1398/6 | r = −0.246 | p = 9.1 × 10⁻¹⁵ |
© 2018 by the authors. Licensee MDPI, Basel, Switzerland. This article is an open access article distributed under the terms and conditions of the Creative Commons Attribution (CC BY) license (http://creativecommons.org/licenses/by/4.0/).
Share and Cite
MDPI and ACS Style
Li, Z.; Hu, W.; Cao, X.; Liu, P.; Shang, Y.; Zhou, J. Synonymous Codon Usages as an Evolutionary Dynamic for Chlamydiaceae. Int. J. Mol. Sci. 2018, 19, 4010. https://0-doi-org.brum.beds.ac.uk/10.3390/ijms19124010
AMA Style
Li Z, Hu W, Cao X, Liu P, Shang Y, Zhou J. Synonymous Codon Usages as an Evolutionary Dynamic for Chlamydiaceae. International Journal of Molecular Sciences. 2018; 19(12):4010. https://0-doi-org.brum.beds.ac.uk/10.3390/ijms19124010
Chicago/Turabian StyleLi, Zhaocai, Wen Hu, Xiaoan Cao, Ping Liu, Youjun Shang, and Jizhang Zhou. 2018. "Synonymous Codon Usages as an Evolutionary Dynamic for Chlamydiaceae" International Journal of Molecular Sciences 19, no. 12: 4010. https://0-doi-org.brum.beds.ac.uk/10.3390/ijms19124010
Note that from the first issue of 2016, this journal uses article numbers instead of page numbers. See further details here.