Article

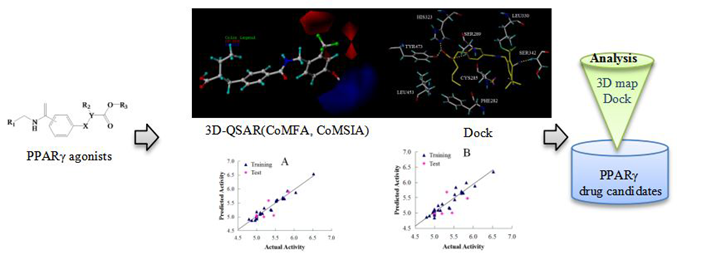
Molecular Modeling Study for the Design of Novel Peroxisome Proliferator-Activated Receptor Gamma Agonists Using 3D-QSAR and Molecular Docking

1
Biomedicine Key Laboratory of Shaanxi Province, The College of Life Sciences, Northwest University, Xi’an 710069, China
2
Key Laboratory of Resource Biology and Biotechnology in Western China, Ministry of Education, Northwest University, Xi’an 710069, China
3
School of Pharmaceutical Sciences, Xi’an Medical University, Xi’an 710021, China
*
Author to whom correspondence should be addressed.
Int. J. Mol. Sci. 2018, 19(2), 630; https://0-doi-org.brum.beds.ac.uk/10.3390/ijms19020630
Submission received: 30 January 2018 / Revised: 17 February 2018 / Accepted: 18 February 2018 / Published: 23 February 2018
(This article belongs to the Special Issue PPARs in Cellular and Whole Body Energy Metabolism)

Abstract

:
Type 2 diabetes is becoming a global pandemic disease. As an important target for the generation and development of diabetes mellitus, peroxisome proliferator-activated receptor γ (PPARγ) has been widely studied. PPARγ agonists have been designed as potential anti-diabetic agents. The advanced development of PPARγ agonists represents a valuable research tool for diabetes therapy. To explore the structural requirements of PPARγ agonists, three-dimensional quantitative structure–activity relationship (3D-QSAR) and molecular docking studies were performed on a series of N-benzylbenzamide derivatives employing comparative molecular field analysis (CoMFA), comparative molecular similarity indices analysis (CoMSIA), and surflex-dock techniques. The generated models of CoMFA and CoMSIA exhibited a high cross-validation coefficient (q2) of 0.75 and 0.551, and a non-cross-validation coefficient (r2) of 0.958 and 0.912, respectively. The predictive ability of the models was validated using external validation with predictive factor (r2pred) of 0.722 and 0.682, respectively. These results indicate that the model has high statistical reliability and good predictive power. The probable binding modes of the best active compounds with PPARγ active site were analyzed, and the residues His323, Tyr473, Ser289 and Ser342 were found to have hydrogen bond interactions. Based on the analysis of molecular docking results, and the 3D contour maps generated from CoMFA and CoMSIA models, the key structural features of PPARγ agonists responsible for biological activity could be determined, and several new molecules, with potentially higher predicted activity, were designed thereafter. This work may provide valuable information in further optimization of N-benzylbenzamide derivatives as PPARγ agonists.

Graphical Abstract

1. Introduction

Type 2 diabetes (T2D) is a disease that is generally characterized by relative insulin deficiency caused by insulin resistance in target organs, and pancreatic β-cell dysfunction [1]. In 2014, there were 422-million people with diabetes, with more than 90% estimated to have T2D, worldwide. Unfortunately, this number will increase to approximately 552-million by the year 2030 [2]. Accordingly, T2D is generating a significant socioeconomic burden, as a pandemic disease with a high and increasing fatality [3,4].
The peroxisome proliferator-activated receptor γ (PPARγ) is generally regarded as a molecular target for the thiazolidinedione class of anti-diabetic drugs [5,6], as it plays a key role in the generation and development of diabetes mellitus [7,8,9]. Recent studies have shown that PPARγ agonists, including rosiglitazone and pioglitazone [10], may be used as insulin sensitizers in target tissues to lower glucose, as well as fatty acid levels in T2D patients.
However, both rosiglitazone and pioglitazone have been withdrawn from the market because of significant hepatotoxicity and cancer development concerns [11]. Hence, there is an urgent need for the development of safer PPARγ modulating drugs. One severe side-effect of known PPARγ agonists, involves sodium and water retention, which may be dangerous for patients suffering from congestive heart conditions [12]. Recently, various new N-benzylbenzamide compounds have been shown to act as PPARγ agonists that, not only lowered blood pressure and reduced systemic glucose, triglycerides, and free fatty acid levels, but have also been shown to maintain water and electrolyte homeostasis [13]. Therefore, a variety of N-benzylbenzamide compounds have since been identified as safer PPARγ modulators for the treatment of T2D.
Based on CoMFA [14], along with CoMSIA [15], methods involving 3D-QSAR determinations allow for the structure–activity relationship of N-benzylbenzamide compounds to be studied. Molecular docking was also applied to reveal the most likely binding modes between the compounds and PPARγ. On the basis of 3D-QSAR and molecular docking results, valuable information can be retrieved for further structured-based drug design, with higher activity. Finally, a series of new potent molecules with a higher predicted activity than the template compound, the latter exhibiting the best activity reported in the literature, have been designed. Our study will potentially provide guidance for the future design of selective and potent PPARγ agonists.

2. Results and Discussion

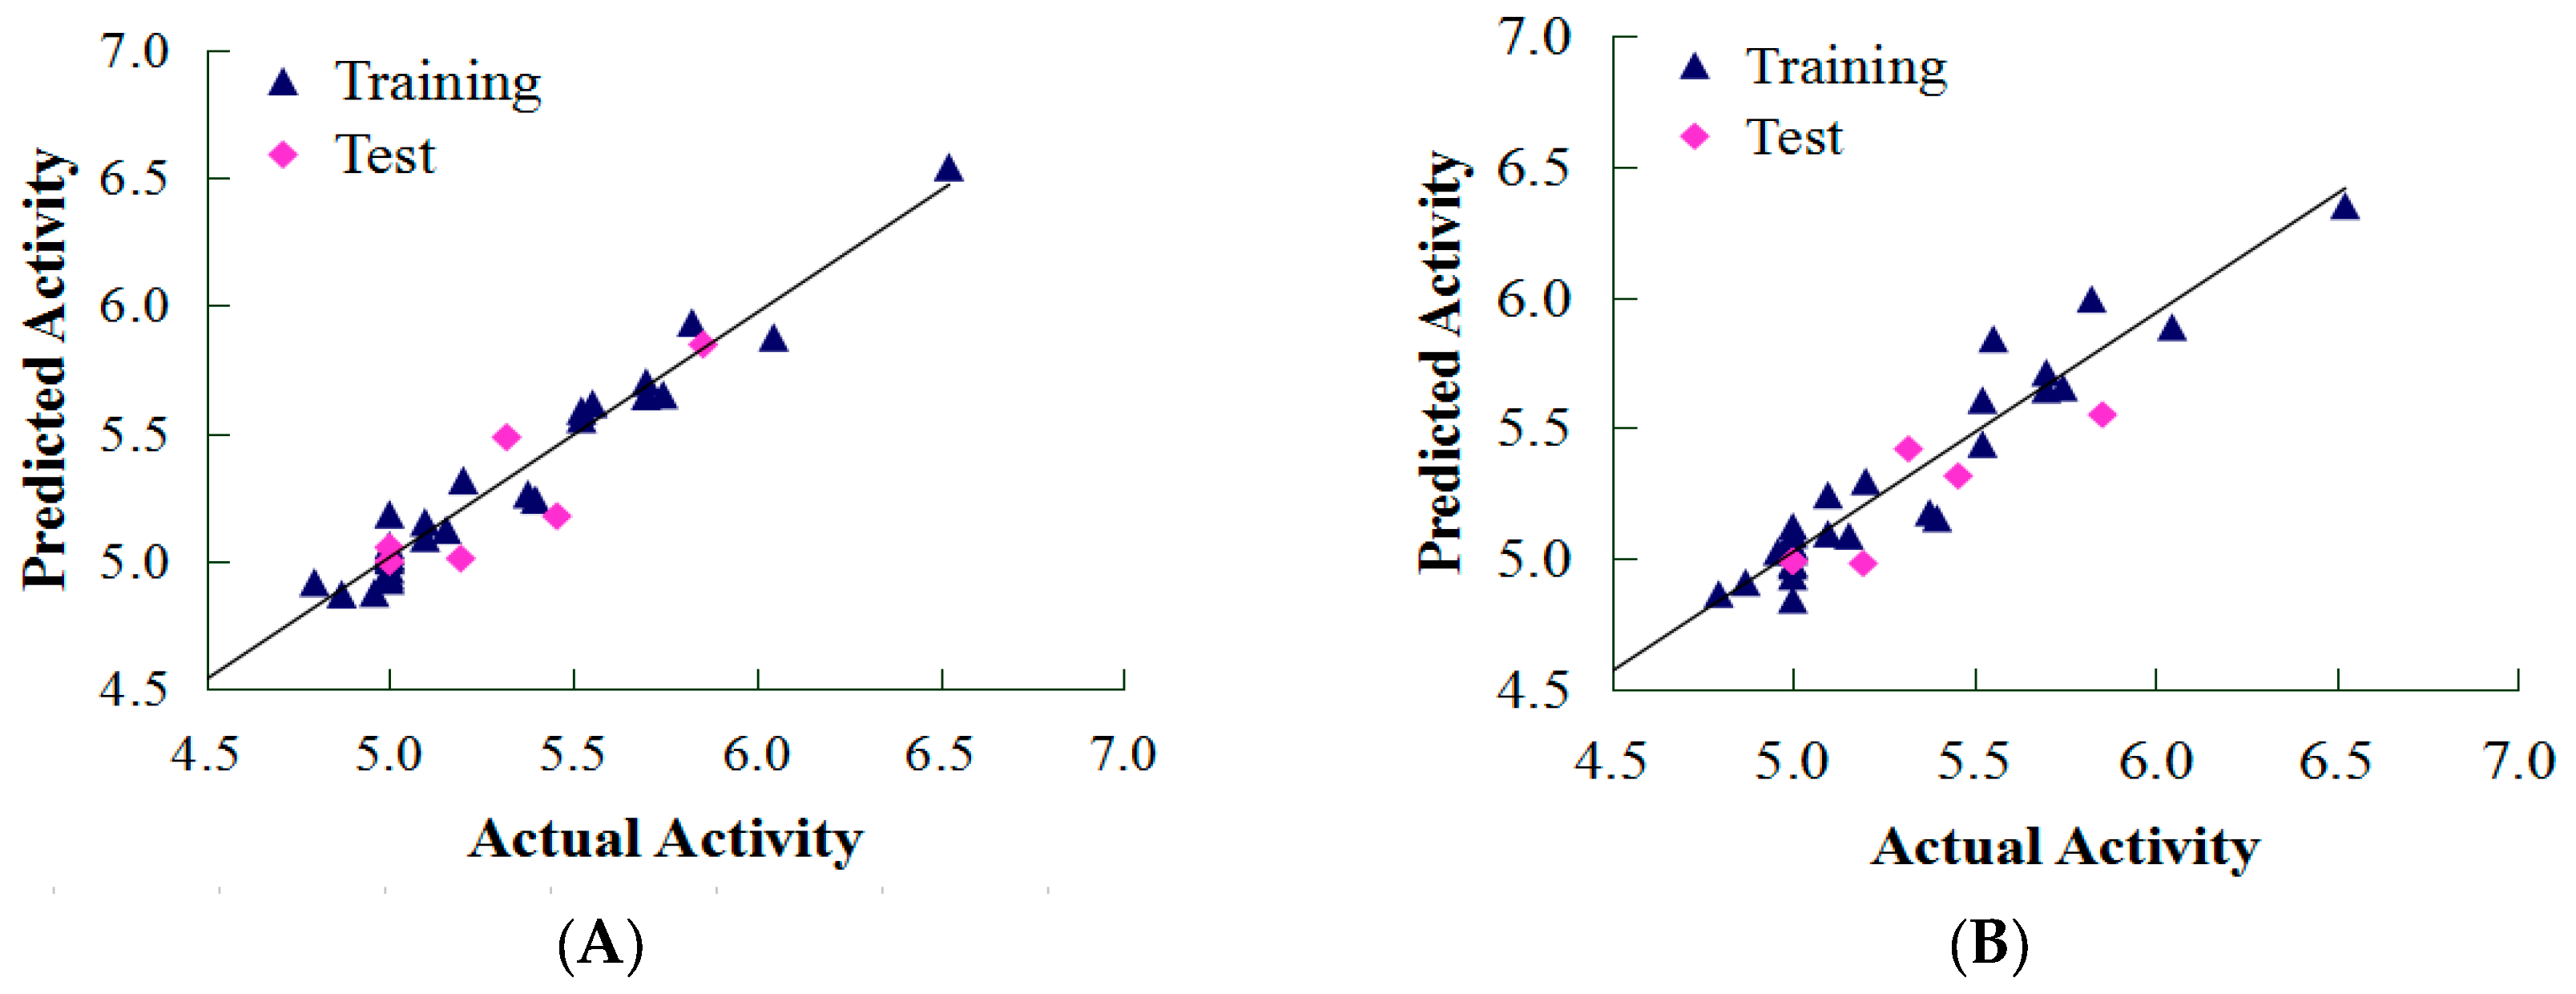
2.1. CoMFA and CoMSIA Results

The 3D-QSAR models were obtained using a training set of 27 compounds, and a test set of six compounds. The statistical parameters associated with CoMFA and CoMSIA can be found in Table 1. In general, various alignment strategies can lead to different statistical values in the constructed QSAR models. The best CoMFA and CoMSIA models were generated employing a partial least square (PLS) analysis, which produced cross-validated coefficients (q2). When a cross-validation coefficient, q2 > 0.5, was used, the QSAR model demonstrated statistical significance.
As shown in Table 1, two descriptor fields in CoMFA form all three possible combination models, including steric (S), electrostatic (E) and SE models. The CoMSIA models, with a combination of five descriptor fields, including S, E, hydrophobic (H), hydrogen bond donor (D) and acceptor (A), were developed to generate the optimal 3D-QSAR model. However, some models with a low q2 value did not meet the criterion (q2 > 0.5), indicating an unacceptable 3D-QSAR model. Still, overfitting seemed to occur for some models (those with a large number of components). From Table 1, we can see that the best established models (CoMFA and CoMSIA) exhibited high q2 (0.75 and 0.551), r2 (0.958 and 0.912), and F-values (76.113 and 43.388), along with a low standard error of estimate (SEE) value (0.097 and 0.138), and a suitable number of components (6 and 5), which indicated good statistical correlation of the models. Moreover, the predictive capabilities of the generated models were assessed by calculating their predictive correlation coefficient (r2pred) involving their corresponding test set molecules. The generated CoMFA and CoMSIA models with maximum external predictive ability (r2pred 0.722 and 0.682), were considered the best models. The distribution of actual predicted pEC50 values of the training and test sets for CoMFA and CoMSIA are shown in Figure 1. The CoMFA and CoMSIA models show a good fit along the diagonal line. Both models also exhibited satisfactory predictive ability throughout the training and test sets.

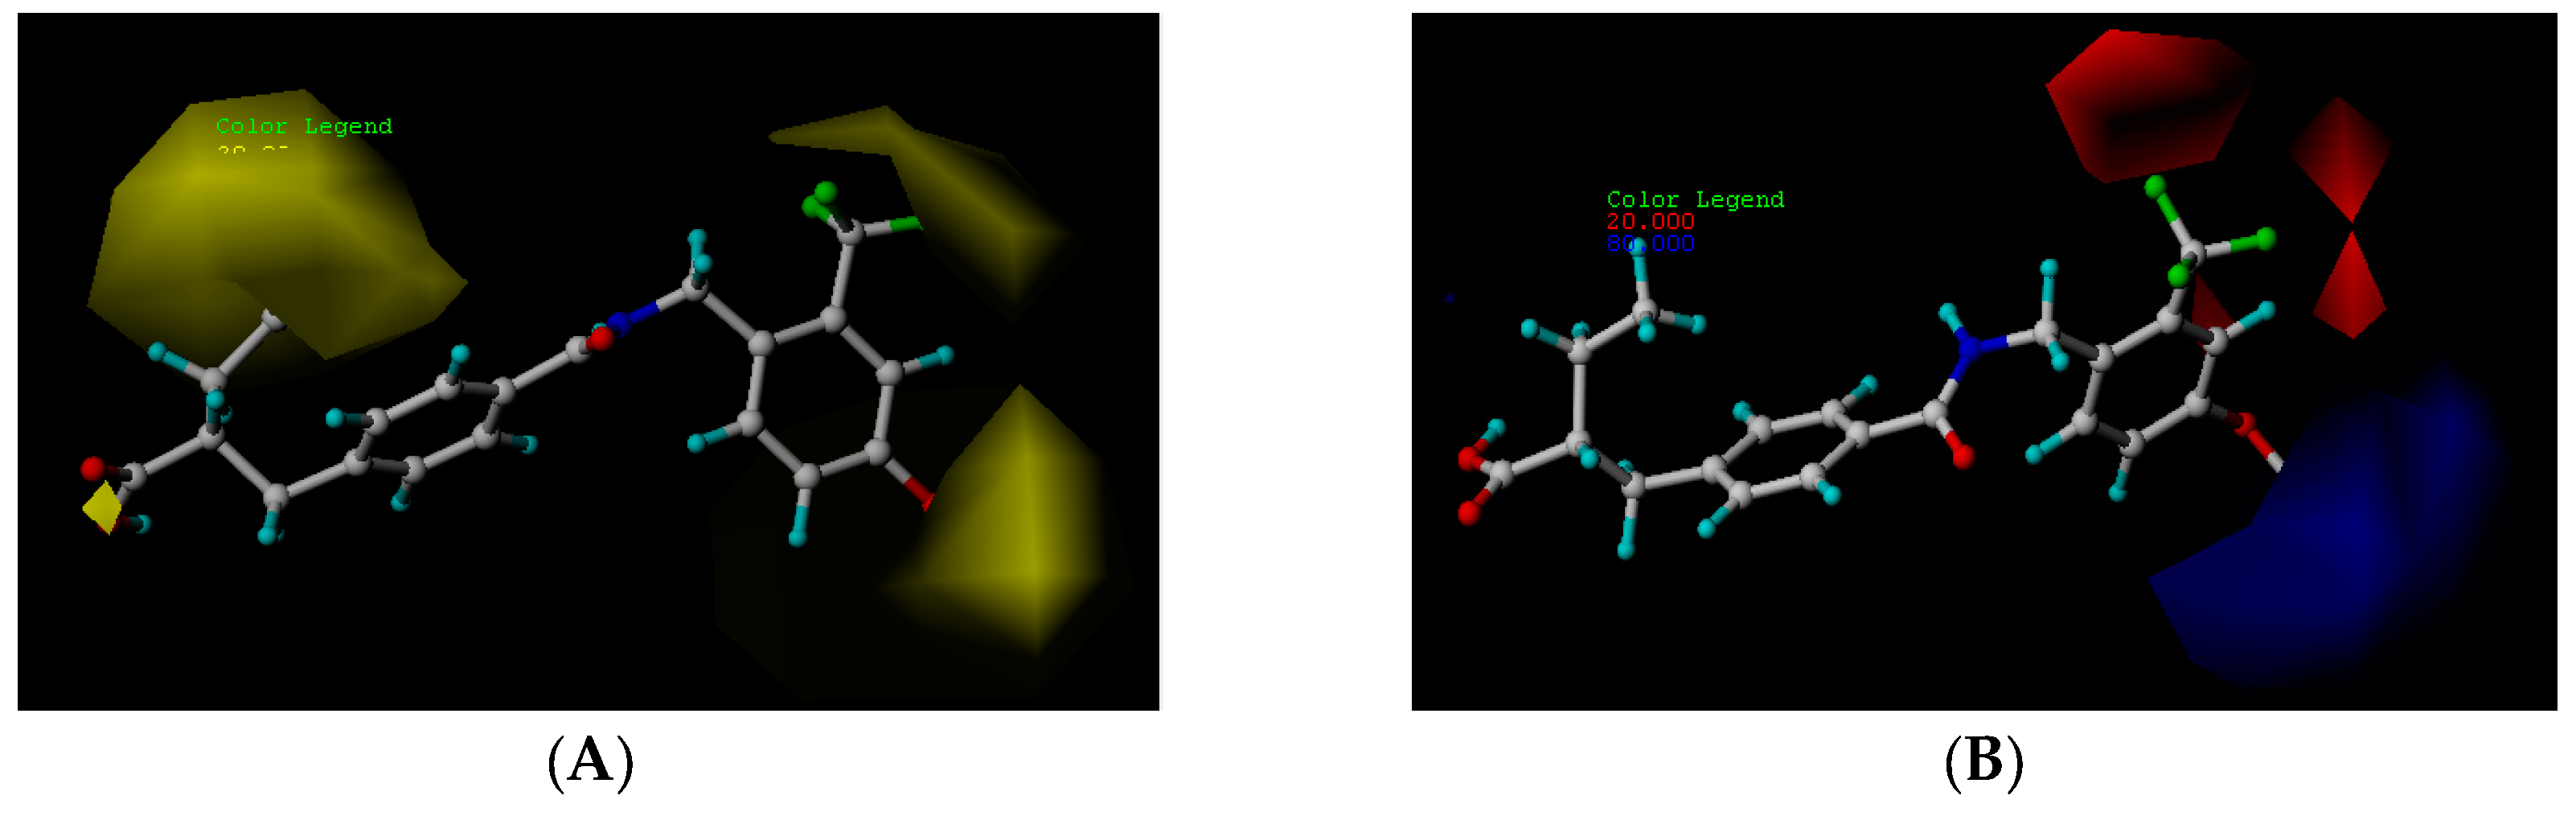
2.2. CoMFA Contour Map Analysis

The steric and electrostatic fields of the CoMFA model are presented as contour maps in Figure 2. Finally, compound 24c was selected as the template molecule. The green contours represent regions indicating favorable steric fields, while the yellow contours represent the regions indicating unfavorable steric fields. Moreover, the blue and red contours highlight the positions where electropositive groups and electronegative groups would be favorable, respectively.

2.2.1. Steric Contour Map

The steric contour map in CoMFA (Figure 2A) has a yellow contour near the ortho position of the benzene ring, which indicates that the presence of steric substituents in this region is unfavorable. Furthermore, the yellow contour explains why a –CF3 substituent in ortho position of the benzene ring in compound 2b is more potent than in compound 10b, which bears a –OCF3 substituent. Likewise, a small yellow contour map appeared in the para position of the benzene ring, which indicates that the large size of the substituent was not preferred in this area. Moreover, a –OCH3 group in this position in compound 18b, could be found within the steric field, which led to decreased biological activity. Finally, the large yellow region on the R2 substitutes may explain why compound 32b, bearing a phenyl group, was less active than compound 30b bearing a propyl group.

2.2.2. Electrostatic Contour Map

A large blue contour area near the para position of the benzene ring indicates that the presence of an electropositive group may increase activity (Figure 2B). This assumption becomes even more significant in the case of compounds 20b and 12b, as these compounds contain a –Cl and –F substituent, respectively. However, due to the presence of different electron-donating groups, compound 12b was found to be less biologically active than compound 20b. The red contours present on the ortho position of the benzene ring suggest that an electron negative group would be favorable in this area, an assumption that proves to be true for compounds 2b and 6b, which contain a –CF3 group and a –CH3 group, respectively. However, since a –CF3 group proves to be more electron-withdrawing than a –CH3 group, compound 2b was determined to be more biologically active than compound 6b.

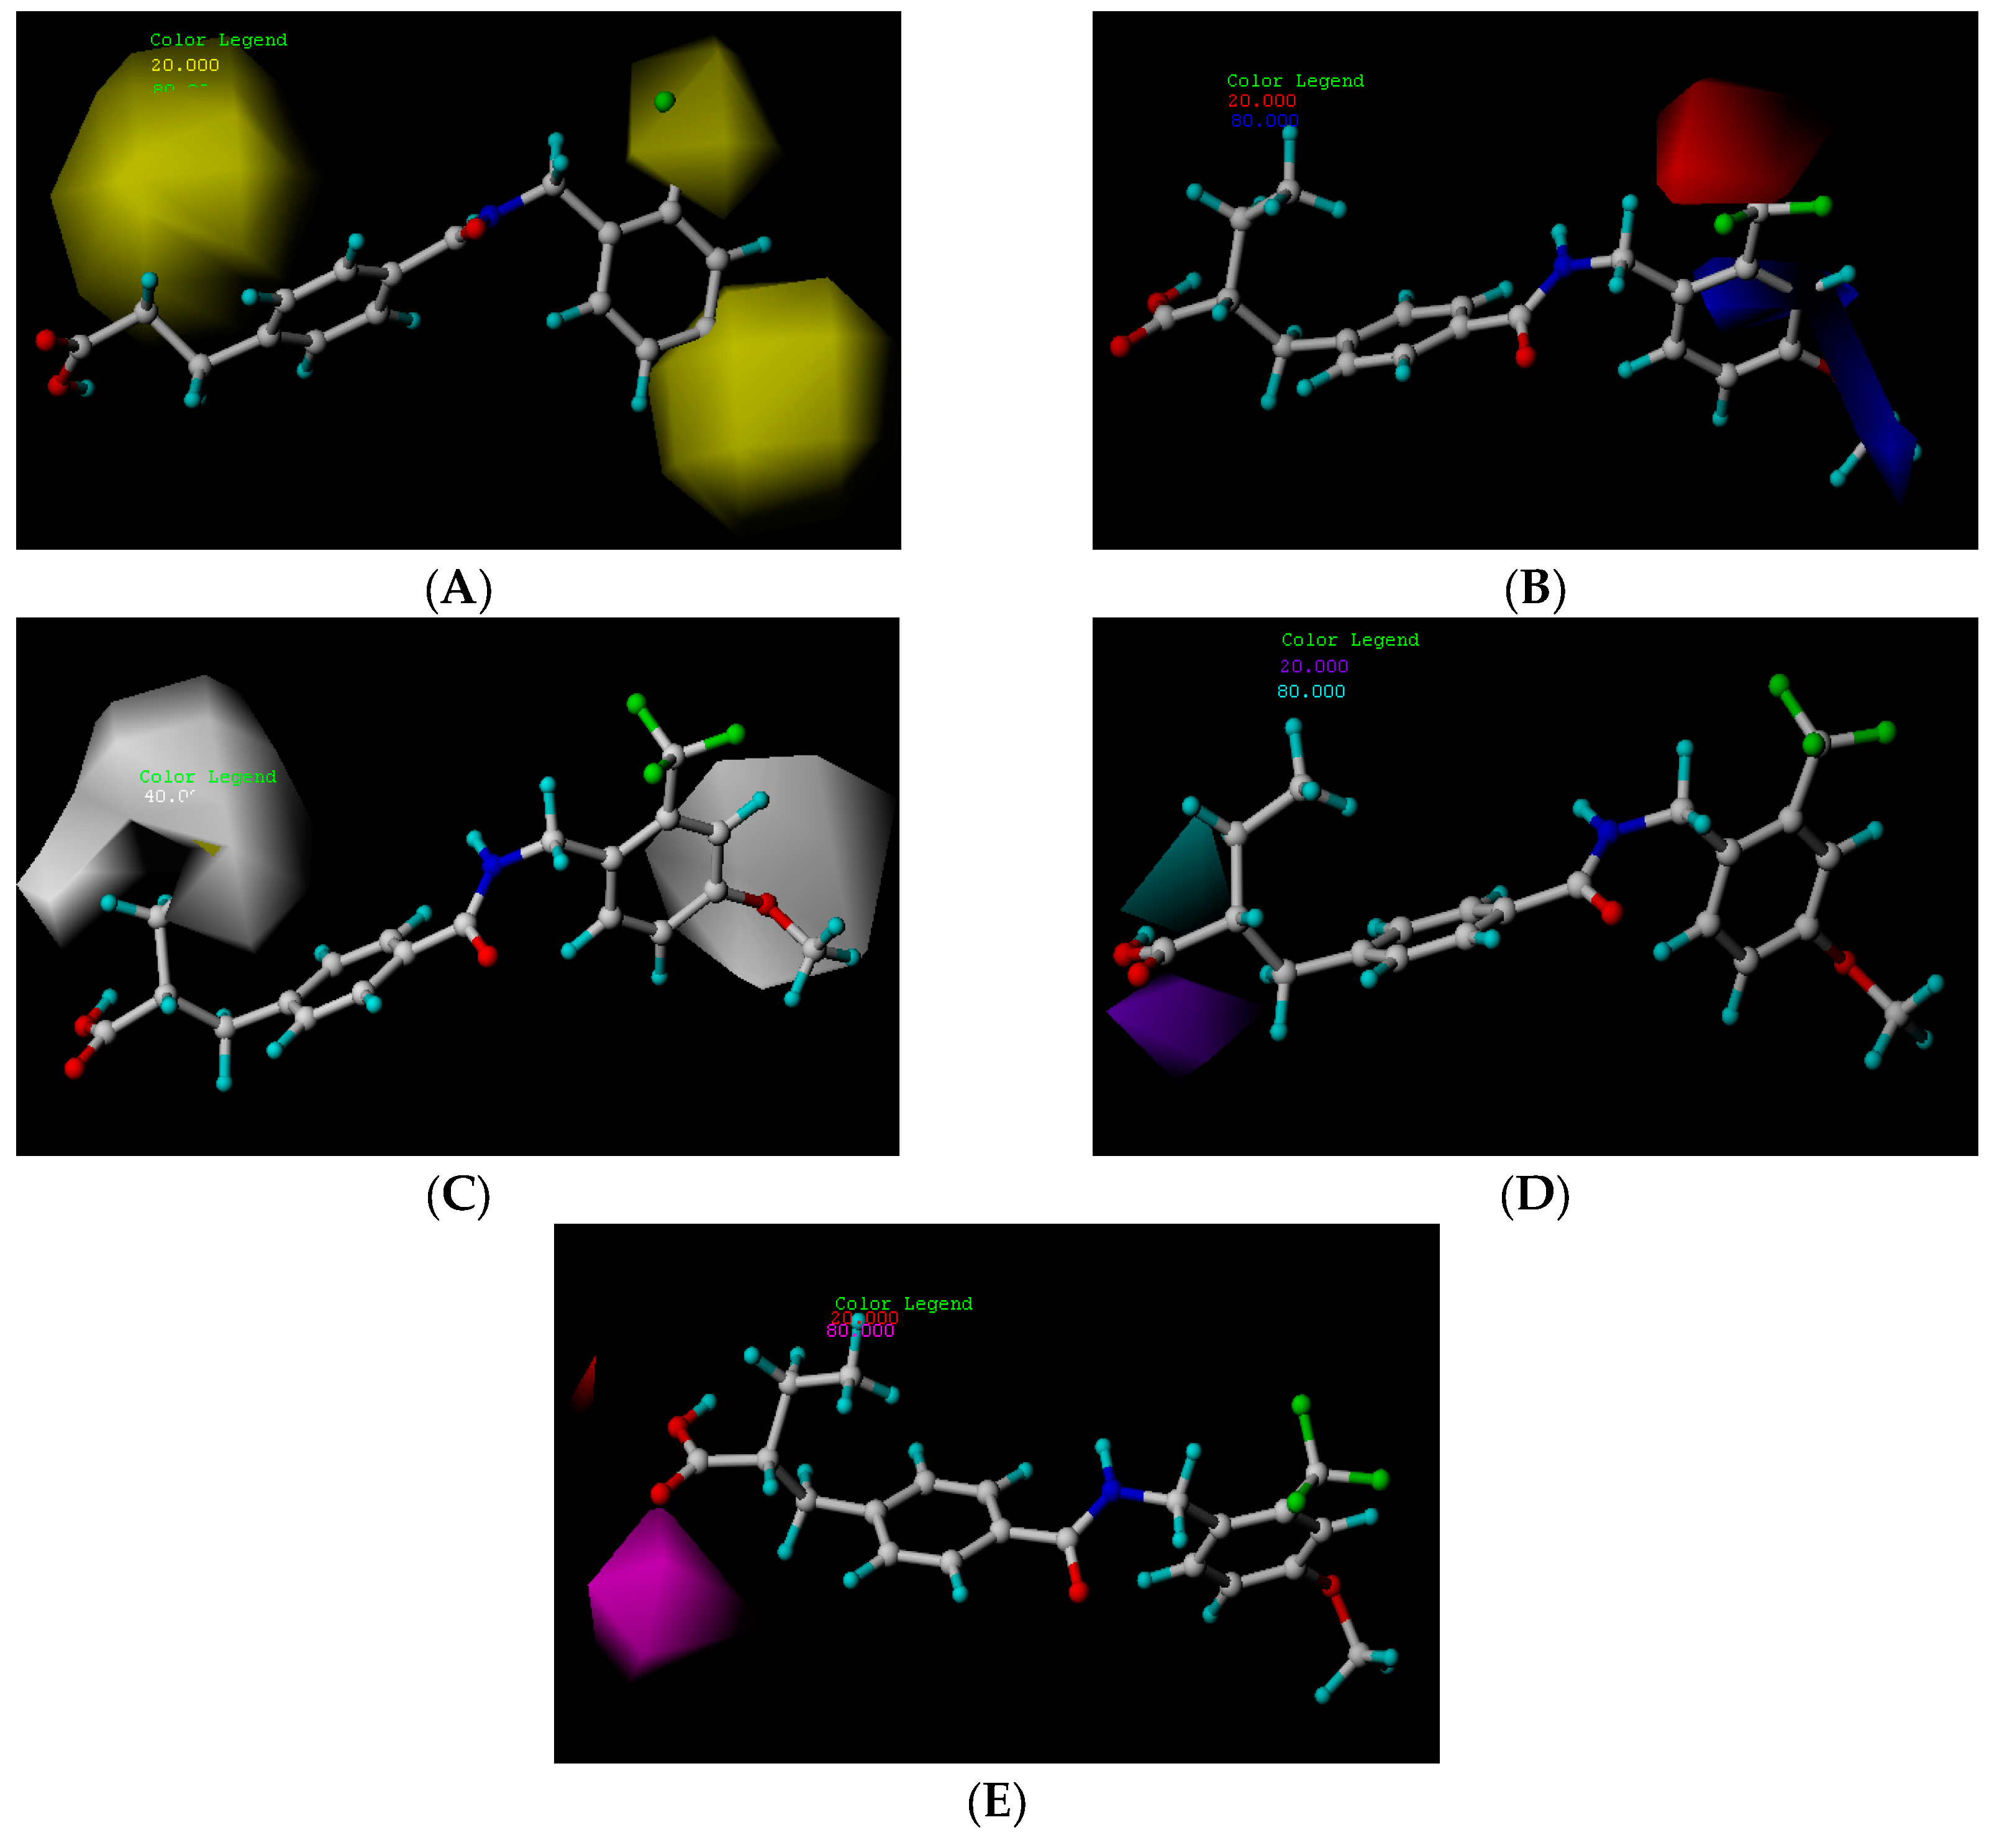
2.3. CoMSIA Contour Map Analysis

The CoMSIA steric and electrostatic contour maps were both similar to the CoMFA contour maps discussed above (Figure 3A,B). Thus, only hydrophobic, hydrogen bond donor, as well as hydrogen bond acceptor fields of CoMSIA, were analyzed in this section. The CoMSIA steric, electrostatic, hydrophobic, hydrogen bond donor along with hydrogen bond acceptor contour maps are shown in Figure 3, respectively. Compound 24c was selected as the corresponding reference molecule.

2.3.1. Hydrophobic Contour Map

In the hydrophobic contour map (Figure 3C), the yellow contours show favorable hydrophobic regions, while white contours represent unfavorable hydrophobic regions. For the hydrophobic map, one white unfavorable region could be found around the R2 substitutes, indicating that the addition of hydrophobic substituents in this region would lead to decrease in activity. Further evidence for this notion can be obtained from compound 30b bearing a propyl group, which is considerably less hydrophobic than a phenyl group. Therefore, compound 30b proves to be more active than the biologically less active compound 32b, bearing a phenyl group. The other white contour area observed in the para position of the benzene ring, indicates that hydrophobic substituents were not preferred in this region. This finding can be further explained by the fact that compound 21c contains a –Cl substituent that generally leads to a higher potency compared to a methoxy group present in compound 19c.

2.3.2. Hydrogen Bond Donor Map

The contour map for the hydrogen bond donor field is shown in Figure 3D. Cyan and purple contours represent a hydrogen bond donor field favorable region and hydrogen bond donor unfavorable region, respectively. For the hydrogen bond donor map, a cyan contour appeared around the hydroxyl group. This suggests that a hydrogen bond interaction, with the hydrogen atom of the hydroxyl group acting as a hydrogen bond donor, is favorable for increased activity.

2.3.3. Hydrogen Bond Acceptor Map

In the hydrogen bond acceptor contour map (Figure 3E), the magenta contours represent a favorable hydrogen bond acceptor field, while the red contours represent an unfavorable hydrogen bond acceptor field. For the hydrogen bond acceptor map, one favorable polyhedral surface (magenta) is found around the carboxyl group, which suggests that hydrogen bond interactions between the oxygen atom of the carbonyl group, acting as a hydrogen bond acceptor, and a hydrogen atom of the group, lead to an increase in activity.

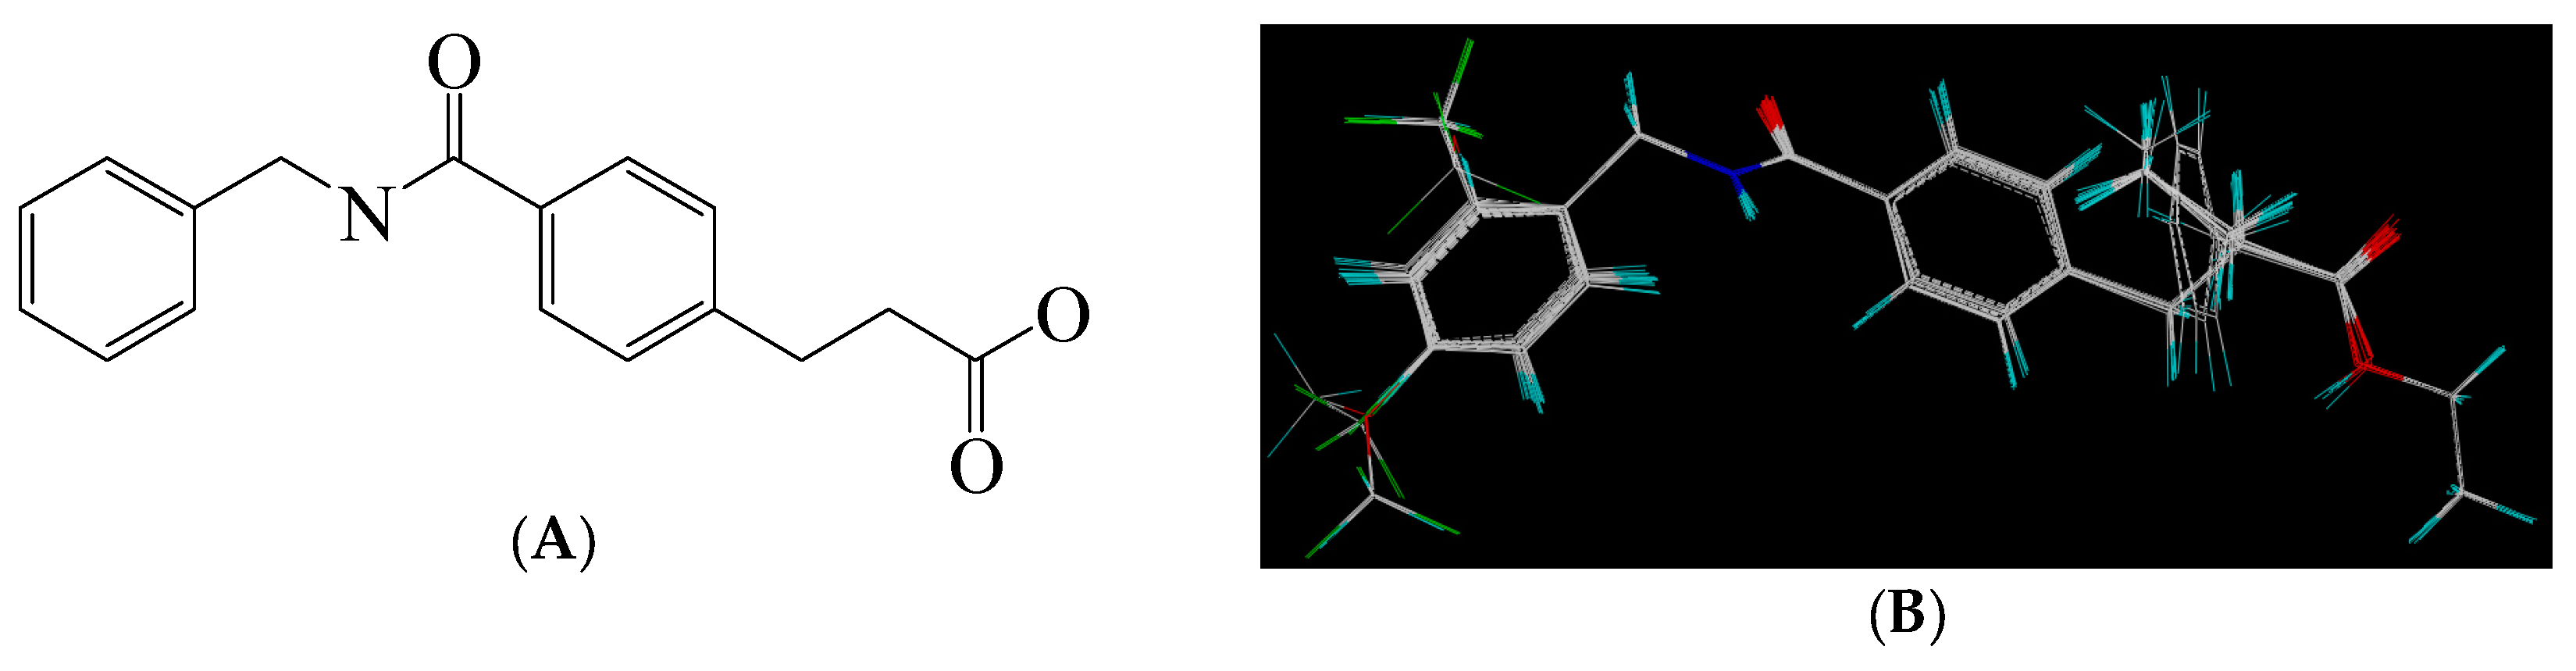
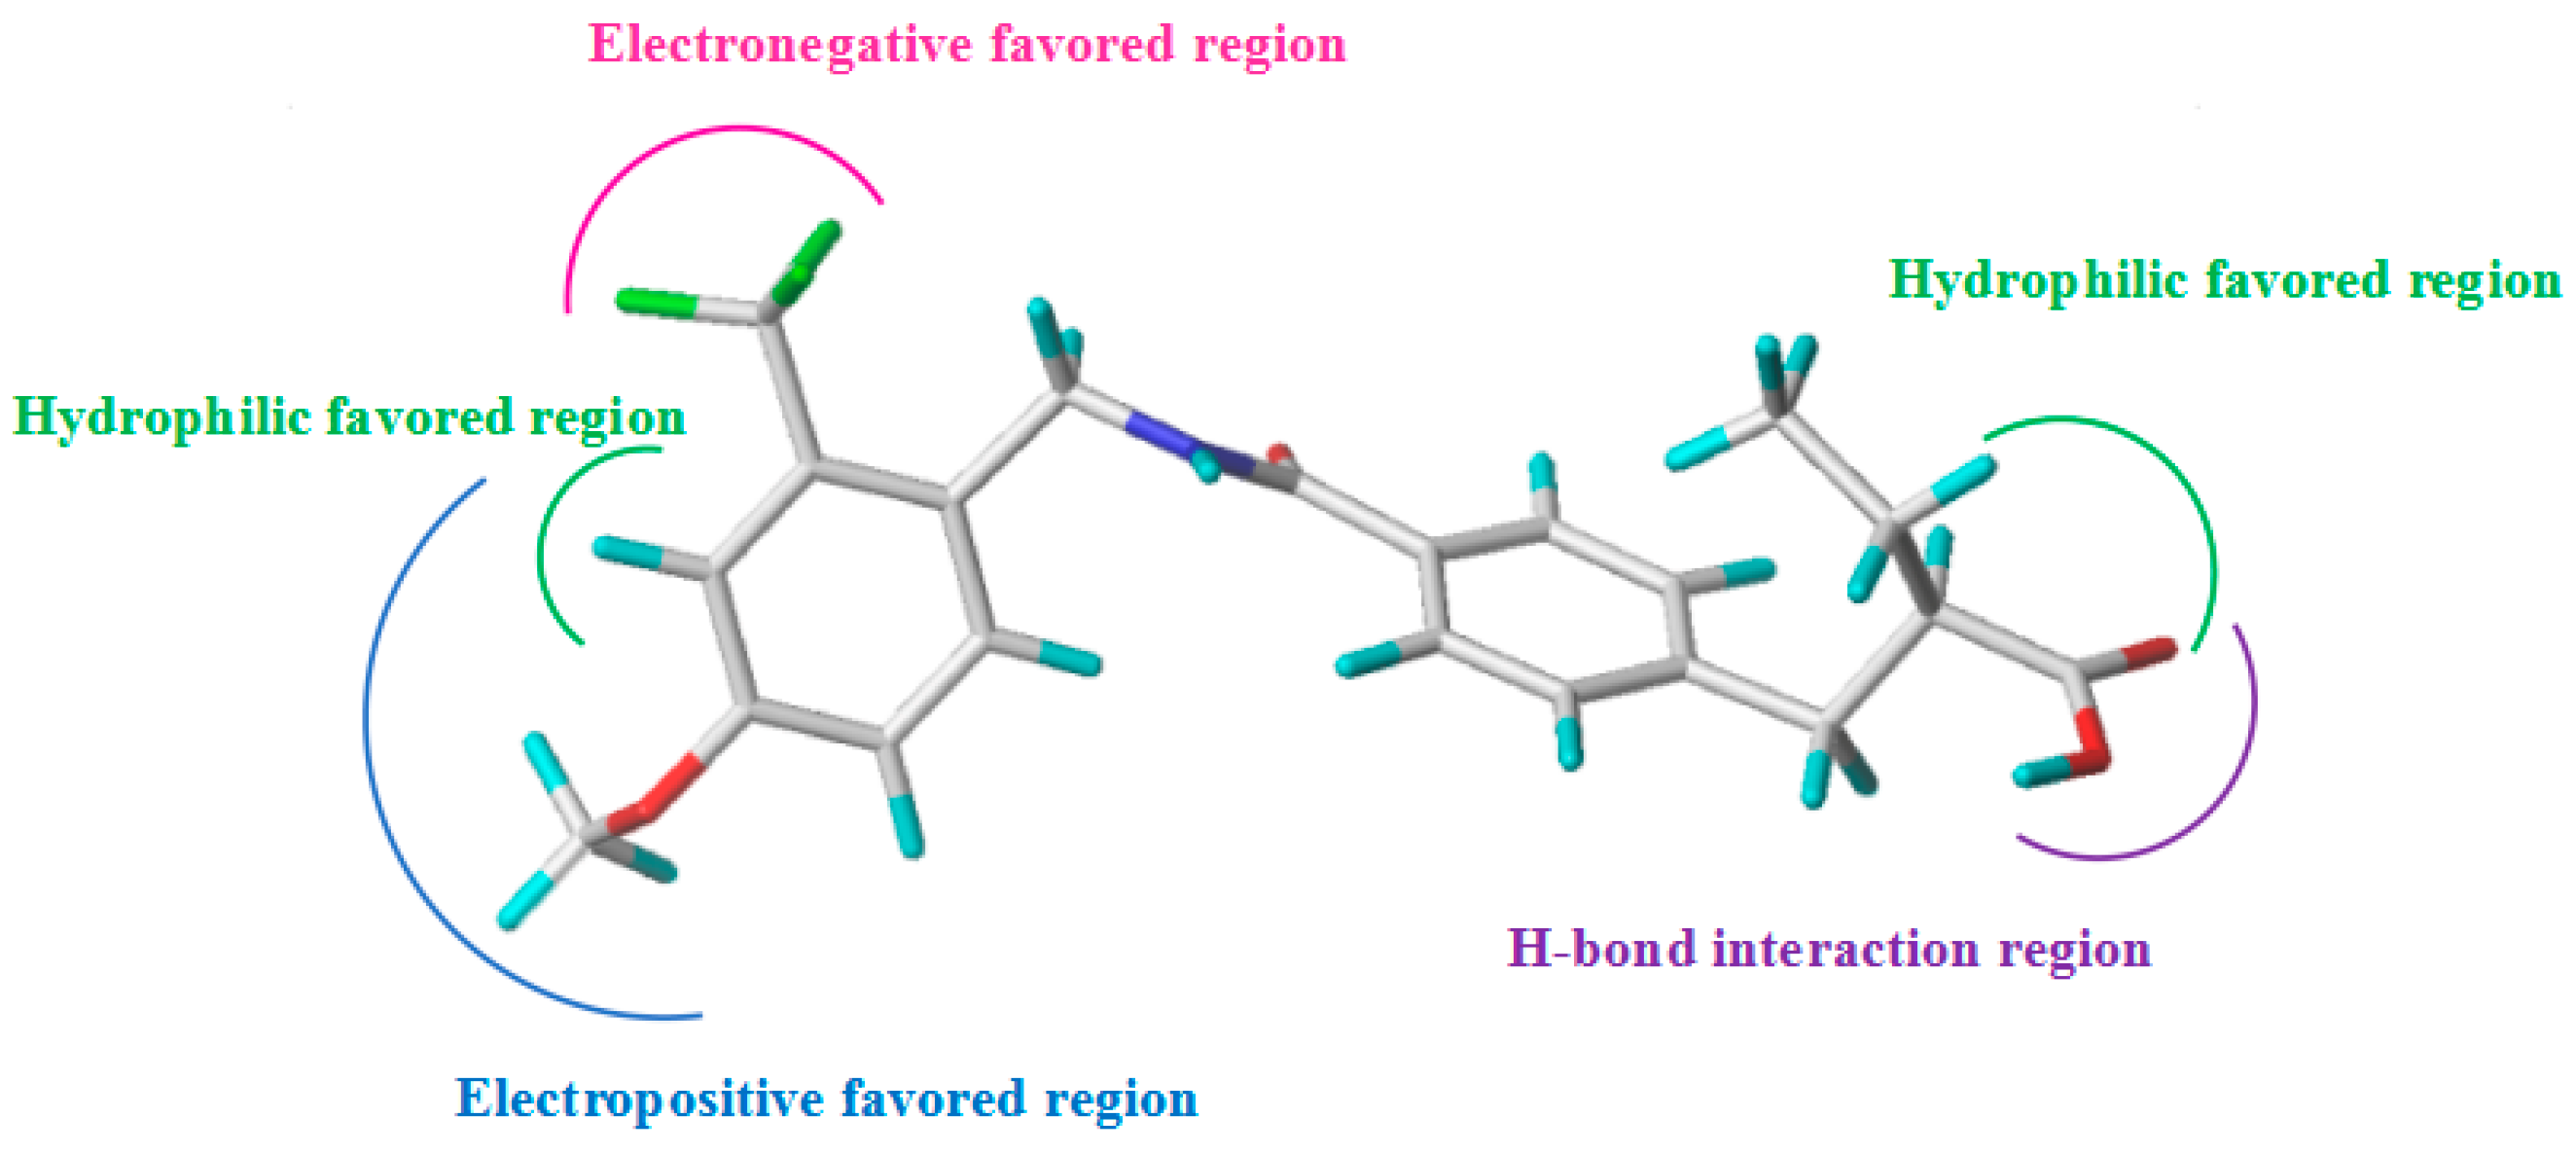
2.4. Design of More Potent Compounds

Based on CoMFA and CoMSIA models obtained in the present study, the structure–activity relationships of PPARγ agonists could be determined, and several new potent molecules could be designed. The chemical structures of the newly designed compounds, as well as their activity characteristics on PPARγ, were predicted by the CoMFA and CoMSIA models, as seen in Table 2. The predicted activities of the newly designed compounds on PPARγ were all significant. A set of the molecules demonstrated an even better activity than the most active agonist previously reported, further validating the superiority of the models, and indicates that the structure–activity relationships in the work reported herein, may potentially be used in structural modification and optimization.

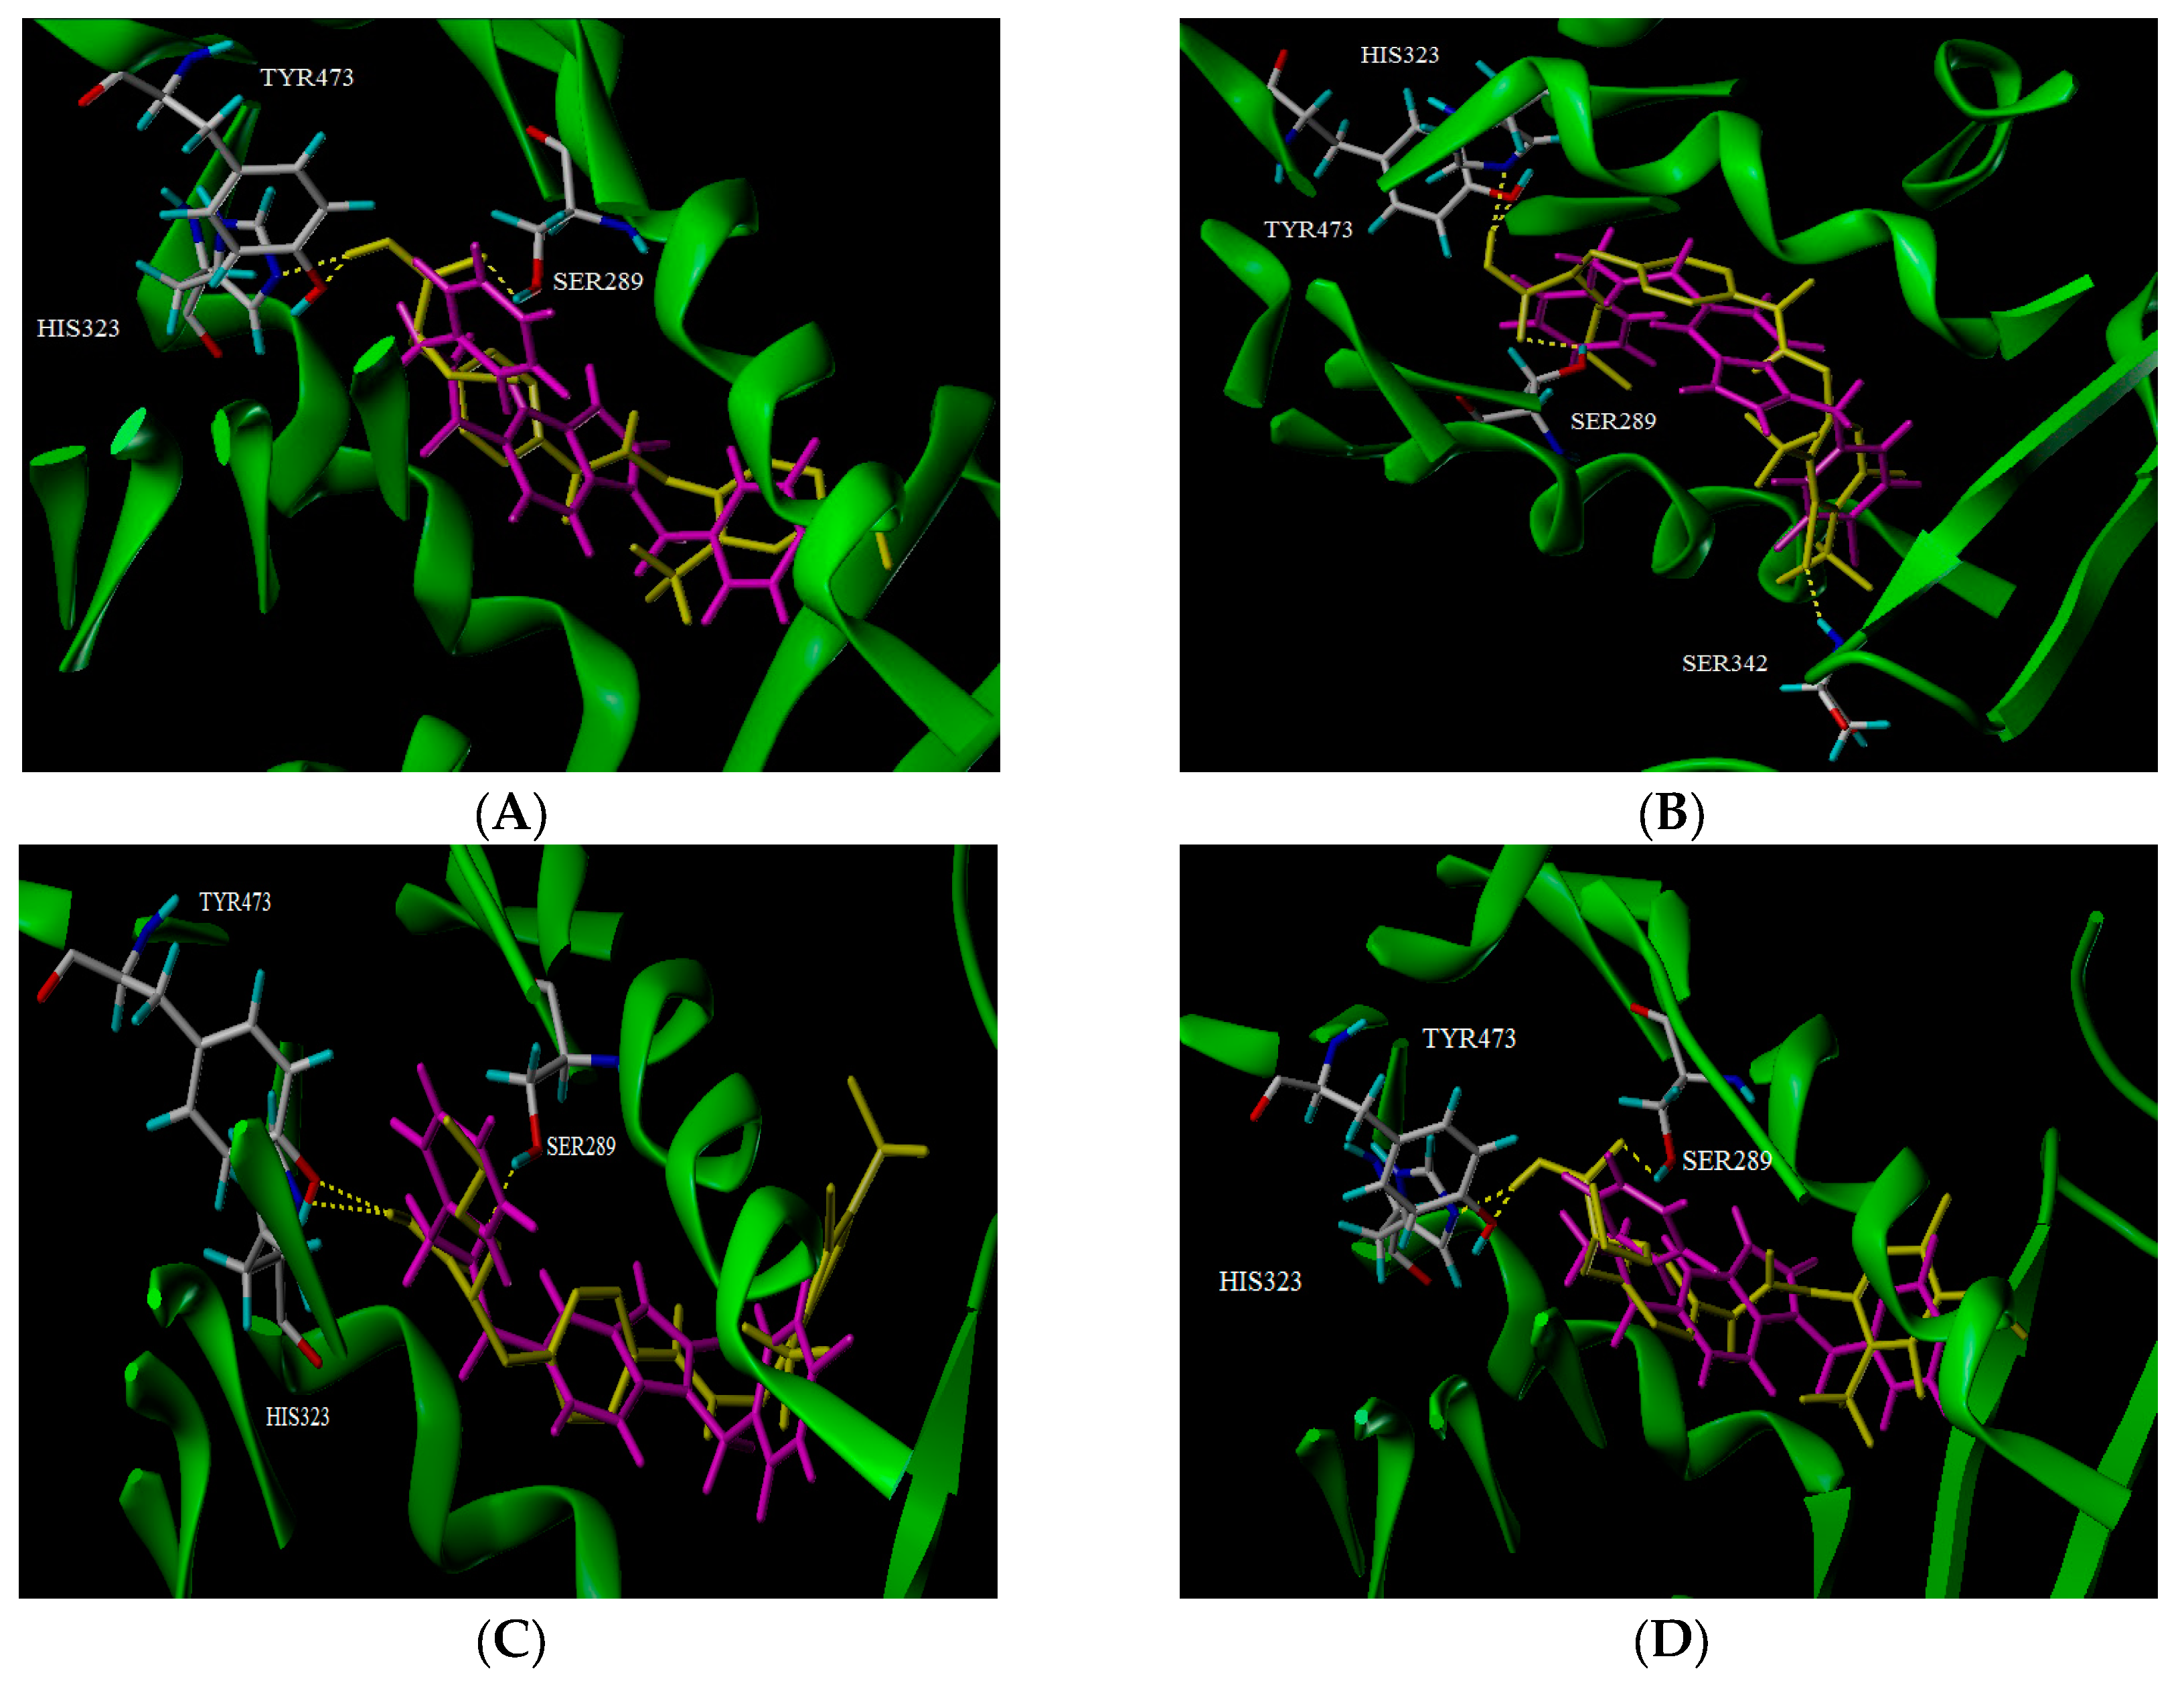
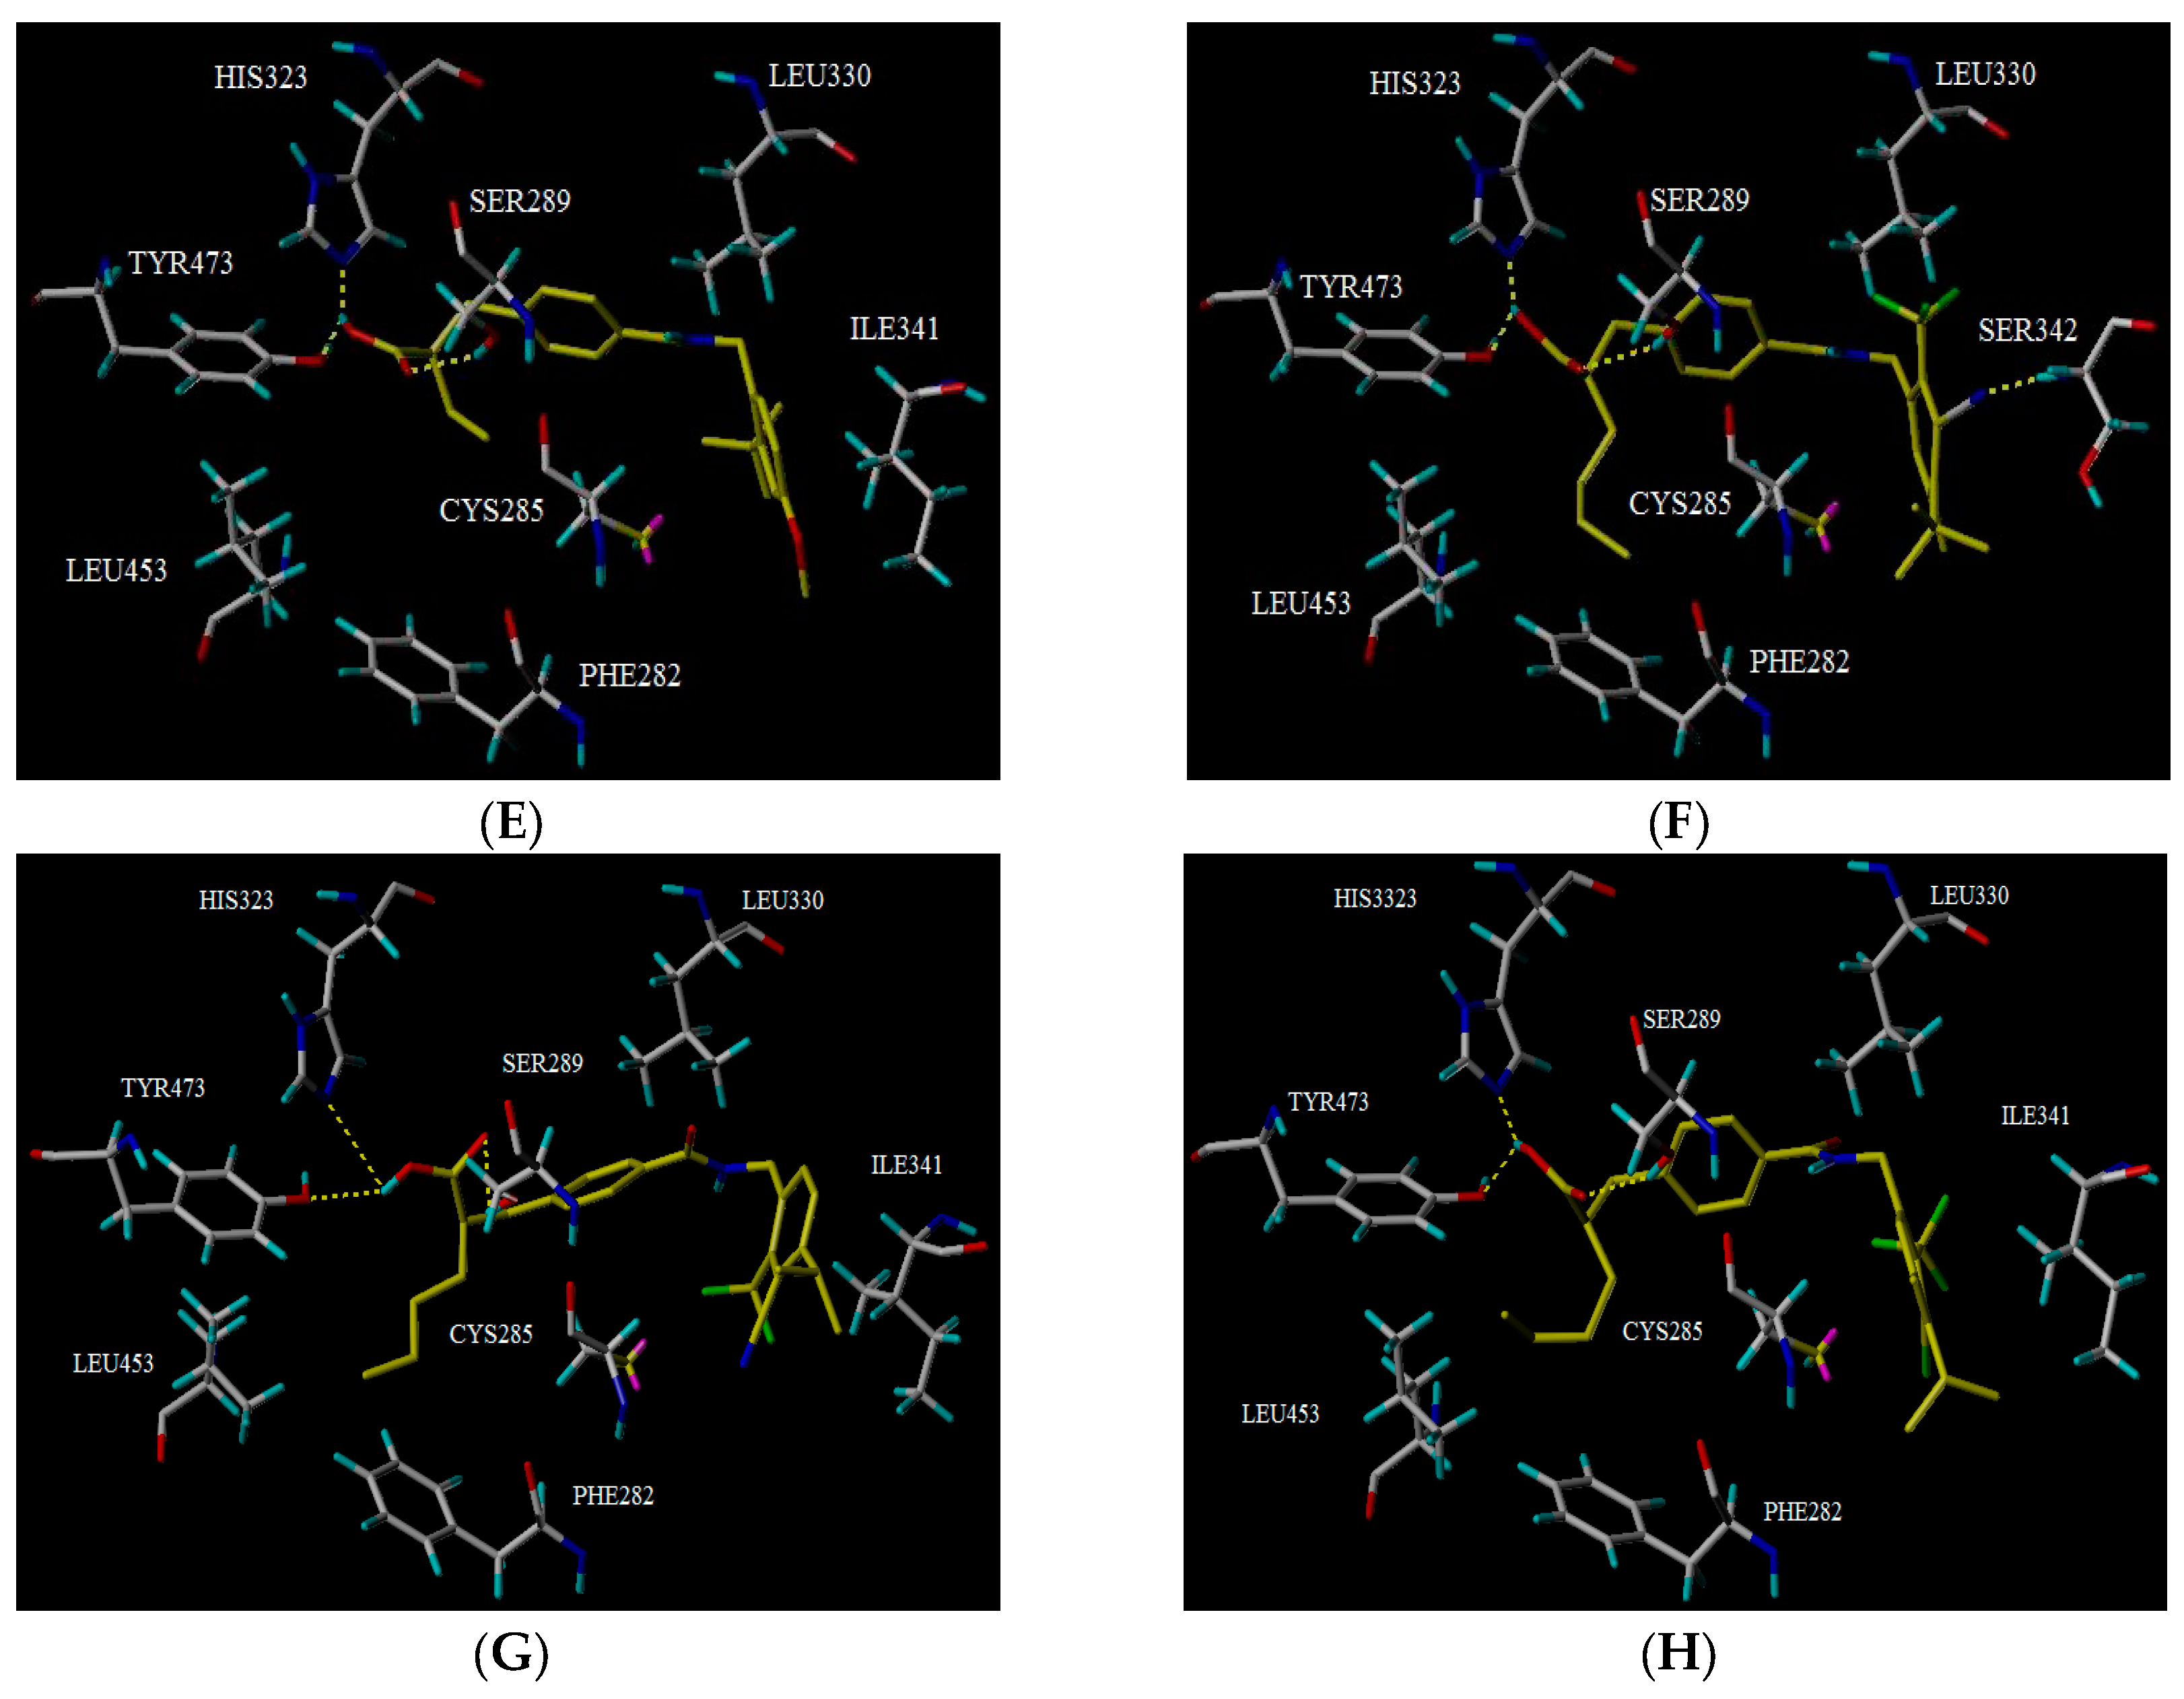
2.5. Docking Analysis

In order to obtain the probable binding conformations between the molecules and the protein, Surflex-dock was carried out to dock the compounds to the binding site of PPARγ. In this study, compound 24c (template) and a newly designed compound, N1, N9, and N12, were placed in the corresponding binding sites, respectively. The docking score of compound 24c was 8.913. Meanwhile, the docking scores of compounds N1, N19, and N12 were 11.0573, 11.010, and 11.690, respectively. The docking scores of compounds N1, N9, and N12 are higher than compound 24c, which has the highest activity in the training set. This result is in good agreement with corresponding predicted activities of CoMFA and CoMSIA models.
Figure 4 shows the surface of the binding site of PPARγ, the binding modes between compounds 24c, N1, N9, and N12, and the binding site of the protein. Figure 4A–D, illustrate the surface of the binding site and the conformations of compounds 24c, N1, N9, and N12 (yellow), and the original ligand (purple), as well as the key residues (white) at the binding site. High resemblance between these molecules is observed and they occupied nearly the same binding pocket as PPARγ. It is representative of the active conformation to dock selected compounds. Here, compounds were positioned in the pocket, surrounded by His323, Tyr473, Ser289, Leu453, Ile341, Cys285, etc. As seen in Figure 4E–H, the carbonyl group of the ligand that acts as a hydrogen bond acceptor, formed a hydrogen bond with the backbone O–H of Ser289. The backbone N–H of His323, and O–H of Tyr473, which act as hydrogen bond acceptors and formed hydrogen bonds with the hydroxyl group of the ligand, respectively. Thus, these three hydrogen bond interactions played a major role in the combination of these drugs and the receptor.

3. Materials and Methods

3.1. Data Set

A set of 33 N-benzylbenzamide derivatives and the corresponding activity data were collected from the work of René Blöcher et al. [13] (Table 3). The data set was randomly divided into the training set of 27 compounds (82%) to generate the 3D-QSAR model, and the test set of 6 compounds (18%) to verify the predictive ability of the model. The bioactivities of the compounds were expressed as pEC50 (-logEC50), which was used as a dependent variable in further investigations. To avoid possible issues during the external validation, the selection of the training and the test set was carried out such that both sets included structurally diverse compounds and all types of activity [16,17,18].

3.2. Molecular Modeling and Alignment

To obtain the best conformers for each molecule, the Sybyl X-2.1.1 software package was used for all compound modeling and optimization parameters. All structures of the compound series were subjected to preliminary geometry optimization using the Tripos force field with 1000 iterations [19]. Partial atomic charges were calculated by the Gasteiger-Hückel scheme, with an energy gradient convergence criterion of 0.05 kcal/mol Å [20]. Based on the analysis method described above, the lowest energy conformation of each molecule was determined for the definitive QSAR studies. Molecular alignment is one of the most essential steps for the generation of the best CoMFA and CoMSIA models [21]. Thus, molecular alignment was performed using the Distill alignment technique, a user-defined common core of the Sybyl tools [22]. Compound 24c, exhibiting the highest activity in the complete data set, was selected as the template molecule. The remaining compounds in the Mol2 database were aligned by their corresponding maximum common substructures, as shown in Figure 5A. The rigid body alignment of the molecules is shown in Figure 5B.

3.3. CoMFA Method

The CoMFA method is often used to describe steric and electrostatic fields. Lennard-Jones and Coulomb potentials were employed to calculate two fields. A 3D cubic lattice, with grid spacing of 2.0 Å, was generated to surround the aligned molecules in all directions. These grid points were generated using the Tripos force field, a sp3 carbon atom probe with a Van der Waals radius of 1.52 Å, and a charge of +1.00 (default probe atom in Sybyl). Based on the CoMFA method, steric and electrostatic fields were scaled with a default energy cut off of 30 kcal/mol, the latter being the optimal parameter for this model [23].

3.4. CoMSIA Method

The CoMSIA analysis is similar to CoMFA, in regard to the descriptors around the aligned molecules. Three other fields, (i.e., hydrophobic, hydrogen bond donor, and hydrogen bond acceptor fields), were calculated together with the same standard settings used in the CoMFA calculations. More importantly, the distance dependence between the probe atom and each molecule atom was measured by a Gaussian function [24].

3.5. Internal Validation and Partial Least Squares (PLS) Analysis

Partial least square (PLS) regression analysis was performed on the training set to construct the correlation between the QSAR model and activity values [25]. To evaluate the reliability of the models generated from PLS analysis, cross-validation analysis was performed through the leave-one-out (LOO) method, which determines the square of the cross-validation coefficient (q2) and the optimal number of components (ONC). To obtain the non-cross-validation coefficient (r2), a final non-cross-validation analysis was performed using the ONC derived from cross validation analysis and the corresponding standard error of estimate (SEE). The value for q2, a measure of the internal quality of the models, was evaluated as follows:
q 2 = ( y o b s y p r e ) 2 ( y o b s y m e a n ) 2
where yobs, ypre, and ymean are observed, predicted, and mean activity in the training set, respectively.

3.6. External Validation of the QSAR Model

To evaluate the predictive ability of CoMFA and CoMSIA models on the test set, the predictive power of the models generated by the CoMFA or CoMSIA analyses with the training set was assessed by calculating the predictive factor r2 (r2pred) [26], and measuring the predictive performance of the PLS model. The factor r2 was calculated as follows:
r pread 2 = SD PRESS SD
the sum of squared deviation, (SD) between the biological activity of molecules in the test set and the mean biological activity of the training set molecules; the sum of squared deviations between actual and predicted activity values (PRESS), for every molecule in the test set. Coefficients and QSAR results in the contour maps were produced with the field type “STDEV*COEFF”.

3.7. Molecular Docking

In an effort to explore the interaction mechanism and investigate suitable binding modes, a molecular docking study was performed using the Sybyl package [27]. The crystal structure of PPARγ was retrieved from the RCSB (Research Collaboratory for Structural Bioinformatics) Protein Data Bank (PDB ID: 5TWO) [28]. In the protein preparation phase, the A-chain was used for the docking study. Crystallized ligands and water molecules of the B-chain were deleted and the hydrogen atoms along with the united atom Gasteiger charges were assigned for the receptor [29]. Based on a protomol generation with a threshold parameter of 0.5 and a bloat parameter of 1 Å, the intended active sites where putative ligands could align to and generate potential interactions, were created using the Sybyl package. Binding affinities were presented by Surflex-Dock total scores. In general, conformations of each ligand were ranked by total scores of docking, with the best conformation of the ligand taken into consideration for the corresponding binding interactions. In this study, compound 24c (template) and the newly designed compound N1, were selected and docked to the binding pocket, using the parameters optimized previously.

4. Conclusions

In this paper, 3D-QSAR and molecular docking studies were utilized to investigate the structural requirements for improving the potency of N-benzylbenzamide derivatives as PPARγ agonists. The established CoMFA and CoMSIA models were both statistically significant, with high external prediction characteristics, indicating that the models could be used to successfully predict compound activity. Surflex-Dock analysis also demonstrated the binding interactions of the template compound with amino acids. Using the model parameter analysis and contour maps, the corresponding structure-activity relationships were determined (Figure 6). Based on the information derived from the different contour maps, several new compounds with improved activities, were designed, further validating the ability of the generated model. We surmise that this will be helpful for the future development of new PPARγ agonists, in the design and screening of new high-activity compounds.

Acknowledgments

This work was supported by the funding from the National Natural Science Foundation of China (No.31200253), Natural Science Basic Research Plan in Shaanxi Province of China (No.2017JM8049), and Key Science Technology Program of Shaanxi Province (No.2016SF-379).

Author Contributions

Yaning Jian and Yang Li conceived and designed the experiments; Yaning Jian and Yang Li performed the experiments; Yaning Jian, Yuyu He, Jingjing Yang and Wei Han analyzed the data; Ye Zhao and Xifeng Zhai contributed analysis tools; Yaning Jian and Yang Li wrote the paper.

Conflicts of Interest

The authors declare no conflict of interest.

References

  1. Chatterjee, S.; Khunti, K.; Davies, M.J. Type 2 diabetes. Lancet 2017, 389, 2239–2251. [Google Scholar] [CrossRef]
  2. Spurr, S.; Bally, J.; Bullin, C.; Trinder, K. Type 2 Diabetes in Canadian Aboriginal Adolescents: Risk Factors and Prevalence. J. Pediatr. Nurs. 2017, 36, 111–117. [Google Scholar] [CrossRef] [PubMed]
  3. American diabetes association. Economic Costs of Diabetes in the U.S. in 2012. Diabetes Care 2013, 36, 1033–1046. [Google Scholar]
  4. Seuring, T.; Archangelidi, O.; Suhrcke, M. The Economic Costs of Type 2 Diabetes: A Global Systematic Review. PharmacoEconomics 2015, 33, 811–831. [Google Scholar] [CrossRef] [PubMed] [Green Version]
  5. Lehmann, J.M.; Moore, L.B.; Smith-Oliver, T.A.; Wilkison, W.O.; Willson, T.M.; Kliewer, S.A. An antidiabetic thiazolidinedione is a high affinity ligand for peroxisome proliferator-activated receptor gamma (PPARγ). J. Biol. Chem. 1995, 270, 12953–12956. [Google Scholar] [CrossRef] [PubMed]
  6. Willson, T.M.; Cobb, J.E.; Cowan, D.J.; Wiethe, R.W.; Correa, I.D.; Prakash, S.R.; Beck, K.D.; Moore, L.B.; Kliewer, S.A.; Lehmann, J.M. The Structure-Activity Relationship between Peroxisome Proliferator-Activated Receptor γ Agonism and the Antihyperglycemic Activity of Thiazolidinediones. J. Med. Chem. 1996, 39, 665–668. [Google Scholar] [CrossRef] [PubMed]
  7. Barroso, I.; Gurnell, M.; Crowley, V.E.; Agostini, M.; Schwabe, J.W.; Soos, M.A.; Maslen, G.L.; Williams, T.D.; Lewis, H.; Schafer, A.J.; et al. Dominant negative mutations in human ppar gamma associated with severe insulin resistance, diabetes mellitus and hypertension. Nature 1999, 402, 880–883. [Google Scholar] [CrossRef] [PubMed]
  8. Flavell, D.M.; Ireland, H.; Stephens, J.W.; Hawe, E.; Acharya, J.; Mather, H.; Hurel, S.J.; Humphries, S.E. Peroxisome proliferator-activated receptor α gene variation influences age of onset and progression of type 2 diabetes. Diabetes 2005, 54, 582–586. [Google Scholar] [CrossRef] [PubMed]
  9. Jay, M.A.; Ren, J. Peroxisome proliferator-activated receptor (PPAR) in metabolic syndrome and type 2 diabetes mellitus. Curr. Diabetes Rev. 2007, 3, 33–39. [Google Scholar] [CrossRef] [PubMed]
  10. Campbell, I.W. The Clinical Significance of PPAR Gamma Agonism. Curr. Mol. Med. 2005, 5, 349–363. [Google Scholar] [CrossRef] [PubMed]
  11. Ahmadian, M.; Suh, J.M.; Hah, N.; Liddle, C.; Atkins, A.R.; Downes, M.; Evans, R.M. PPARγ signaling and metabolism: The good, the bad and the future. Nat. Med. 2013, 19, 557–566. [Google Scholar] [CrossRef] [PubMed]
  12. Yang, T.; Soodvilai, S. Renal and vascular mechanisms of thiazolidinedione-induced fluid retention. PPAR Res. 2008, 2008. [Google Scholar] [CrossRef] [PubMed]
  13. Blöcher, R.; Lamers, C.; Wittmann, S.K.; Merk, D.P.; Hartmann, M.; Weizel, L.; Diehl, O.; Brüggerhoff, A.; Boß, M.; Kaiser, A.; et al. N-benzylbenzamides: A novel merged scaffold for orally available dual soluble epoxide hydrolase/peroxisome proliferator-activated receptor γ modulators. J. Med. Chem. 2015, 59, 61–81. [Google Scholar] [CrossRef] [PubMed]
  14. Sahu, N.K.; Sharma, M.C.; Mourya, V.; Kohli, D.V. QSAR studies of some side chain modified 7-chloro-4-aminoquinolines as antimalarial agents. Arab. J. Chem. 2014, 7, 701–707. [Google Scholar] [CrossRef]
  15. Klebe, G.; Abraham, U.; Mietzner, T. Molecular Similarity Indices in a Comparative Analysis (CoMSIA) of Drug Molecules to Correlate and Predict Their Biological Activity. J. Med. Chem. 1994, 37, 4130–4146. [Google Scholar] [CrossRef] [PubMed]
  16. Leonard, J.; Roy, K. On Selection of Training and Test Sets for the Development of Predictive QSAR models. Qsar. Comb. Sci. 2010, 25, 235–251. [Google Scholar] [CrossRef]
  17. Roy, K.; Paul, S. Exploring 2D and 3D QSARs of 2,4-Diphenyl-1,3-oxazolines for Ovicidal Activity Against Tetranychus urticae. Qsar. Comb. Sci. 2009, 28, 406–425. [Google Scholar] [CrossRef]
  18. Patel, P.; Chintha, C.; Ghate, M.; Bhatt, H.; Vyas, V.K. 3D QSAR study of 4H-chromen-1,2,3,4-tetrahydropyrimidine-5-carboxylate derivatives as potential anti-mycobacterial agents. Med. Chem. Res. 2014, 23, 2955–2963. [Google Scholar] [CrossRef]
  19. Wang, F.F.; Zhou, B. Toward the identification of a reliable 3D-QSAR model for the protein tyrosine phosphatase 1B inhibitors. J. Mol. Struct. 2018, 1158, 75–87. [Google Scholar] [CrossRef]
  20. Liu, J.; Zhang, H.; Xiao, Z.; Wang, F.; Wang, X.; Wang, Y. Combined 3D-QSAR, molecular docking and molecular dynamics study on derivatives of peptide epoxyketone and tyropeptin-boronic acid as inhibitors against the β5 subunit of human 20s proteasome. Int. J. Mol. Sci. 2011, 12, 1807–1835. [Google Scholar] [CrossRef] [PubMed]
  21. Damre, M.V.; Gangwal, R.P.; Dhoke, G.V.; Lalit, M.; Sharma, D.; Khandelwal, K.; Sangamwar, A.T. 3D-QSAR and molecular docking studies of amino-pyrimidine derivatives as PknB inhibitors. J. Taiwan Inst. Chem. E 2014, 45, 354–364. [Google Scholar] [CrossRef]
  22. Xie, X.Q.; Chen, J.Z. Data Mining a Small Molecule Drug Screening Representative Subset from NIH Pub Chem. J. Chem. Inf. Model. 2008, 48, 465–475. [Google Scholar] [CrossRef] [PubMed]
  23. Ståhle, L.; Wold, S. Partial least squares analysis with cross-validation for the two-class problem: A Monte Carlo study. J. Chemometr. 1987, 1, 185–196. [Google Scholar] [CrossRef]
  24. Xiao, A.; Zhang, Z.; An, L.; Xiang, Y. 3D-QSAR and docking studies of 3-arylquinazolinethione derivatives as selective estrogen receptor modulators. J. Mol. Model. 2008, 14, 149–159. [Google Scholar] [CrossRef] [PubMed]
  25. Clark, M.; Cramer, R.D.; Opdenbosch, N.V. Validation of the general purpose tripos 5.2 force field. J. Comput. Chem. 1989, 10, 982–1012. [Google Scholar] [CrossRef]
  26. Golbraikh, A.; Tropsha, A. Beware of q2! J. Mol. Graph. Model. 2002, 20, 269–276. [Google Scholar] [CrossRef]
  27. Ambure, P.S.; Gangwal, R.P.; Sangamwar, A.T. 3D-QSAR and molecular docking analysis of biphenyl amide derivatives as p38α mitogen-activated protein kinase inhibitors. Mol. Divers. 2012, 16, 377–388. [Google Scholar] [CrossRef] [PubMed]
  28. Yi, W.; Shi, J.; Zhao, G.; Zhou, X.E.; Suinopowell, K.; Melcher, K.; Xu, H.E. Identification of a novel selective pparγ ligand with a unique binding mode and improved therapeutic profile in vitro. Sci. Rep. 2017, 7, 41487. [Google Scholar] [CrossRef] [PubMed]
  29. Van Westen, G.J.; Overington, J.P.A. ligand’s-eye view of protein similarity. Nat. Methods 2013, 10, 116–117. [Google Scholar] [CrossRef] [PubMed]
Figure 1. Plots of Actual versus predicted pEC50 values, for the training set and test set compounds, for CoMFA (A) and CoMSIA (B) models.
Ijms 19 00630 g001
Figure 2. CoMFA contour maps displayed with most potent compound, 24c. (A) CoMFA steric contour map (green, favored; yellow, disfavored); (B) CoMFA electrostatic contour map (blue, electropositive favored; red, electronegative favored).
Ijms 19 00630 g002
Figure 3. CoMSIA contour maps displayed with most potent compound, 24c. (A) CoMSIA steric contour map (green, favored; yellow, disfavored); (B) CoMSIA electrostatic contour map (blue, electropositive favored; red, electronegative favored); (C) CoMSIA hydrophobic contour map (yellow, favored; white, disfavored); (D) CoMSIA hydrogen donor contour map (cyan, favored; purple, disfavored); (E) CoMSIA hydrogen acceptor contour map (magenta, favored; red, disfavored).
Ijms 19 00630 g003
Figure 4. Docking results. (A) The surface of the binding site, and the conformation comparison of compound 24c (yellow), the original ligand (purple), and the key residues (white) at the binding site; (B) The surface of the binding site and the comparison of the conformation of, compound N1 (yellow), the original ligand (purple), and the key residues (white), at the binding site; (C) The surface of the binding site, and the comparison of the conformation of compound N9 (yellow), the original ligand (purple), and the key residues (white), at the binding site; (D) The surface of the binding site, and the comparison of the conformation of compound N12 (yellow), the original ligand (purple), and the key residues (white), at the binding site; (E) Interaction between compound 24c (yellow) and residues (white); (F) Interaction between compound N1 (yellow) and residues (white); (G) Interaction between compound N9 (yellow) and residues (white); (H) Interaction between compound N12 (yellow) and residues (white).
Ijms 19 00630 g004aIjms 19 00630 g004b
Figure 5. Molecular alignment. (A) Common structure retrieved from compound 24; (B) Alignment of the compounds in the training set.
Ijms 19 00630 g005
Figure 6. Diagram of structure-activity relationship based on core structure of template compound 24c.
Ijms 19 00630 g006
Table 1. Statistical parameters of the CoMFA and CoMSIA models.
PLS
Statistics
ONCq2r2SEEFCotribution (%)
SEHDA
CoMFA
S80.5760.9300.13229.872100
E70.4970.9370.12240.470100
SE60.7500.9580.09776.11351.648.4
CoMSIA
S50.4720.8040.20517.183100
E70.4280.9110.14527.952100
H100.5060.9581.10836.771100
D2−0.0510.1680.3952.418100
A1−0.0830.0300.4180.777100
SE100.610.9490.12029.70834.066.0
SH30.4120.8230.18635.54536.163.9
SD100.5050.9350.13523.07148.351.7
SA40.4930.8030.20122.41584.915.1
EH50.4790.8910.15334.25559.140.9
ED90.3520.9320.13425.95988.111.9
EA60.4330.8760.16723.64089.110.9
HD100.5370.9650.10043.74475.124.9
HA100.5250.9580.10936.22590.69.4
DA2−0.0360.1860.3912.74081.019.0
SEH50.5410.9160.13445.73217.951.930.2
SED100.60.9540.11333.50832.055.912.1
SEA90.6070.9440.12132.00534.960.44.7
SHD50.4480.9130.13743.91528.951.020.1
SHA50.4260.9090.14041.76933.859.66.6
SDA40.5010.8000.20222.01857.832.29.9
EHD50.4780.8850.15732.22953.135.911.0
EHA50.4920.8890.15433.75756.838.94.3
EDA90.3680.9410.12530.15779.611.88.6
HDA100.5320.9640.10043.07170.123.56.4
SEHD50.5450.9120.13743.73216.147.727.19.1
SEHA50.550.9150.13545.17017.350.528.93.3
SEDA100.5930.9540.11333.52030.352.911.75.1
SHDA50.4490.9050.14339.94028.149.517.54.9
EHDA50.4860.8840.15932.04451.635.09.73.7
SEHDA50.5510.9120.13843.38815.746.726.58.22.8
Optimum number of components (ONC), leave-one-out cross-validated correlation coefficient (q2), noncross-validated correlation coefficient (r2), standard error of estimate (SEE), Fischer test values (F), steric field (S), electrostatic field (E), hydrophobic field (H), Hydrogen bond donor field (D), Hydrogen bond acceptor field (A).
Table 2. Newly designed compounds and predictive activity.
Ijms 19 00630 i001
NO.R1R2R3CoMFA PredictedCoMSIA Predicted
N1CNC(Me)3Me6.9427.170
N2CNC(Me)3OMe6.7657.155
N3CNC(Me)3ET6.9007.155
N4CNCH(Me)2OMe6.9827.105
N5CNC(Me)36.8227.083
N6CNCH(Me)2Me7.0647.080
N7CNCH(Me)2ET7.1037.070
N8COOHC(Me)3Me6.8207.063
N9CNCH(Me)27.0366.999
N10ClC(Me)3Me6.7426.986
N11CHOC(Me)3Me6.8786.916
N12COOHCH(Me)2Me7.0736.902
N13CHOC(Me)3c-Pr6.8156.886
N14ClCH(Me)2Me6.7816.843
N15C(Me)36.6486.798
Table 3. Actual and predicted pEC50 values of PPARγ agonists.
Ijms 19 00630 i002
NO.R1R2SubstitutionActual pEC50Pred-pEC50
CoMFACoMSIA
01a * Ijms 19 00630 i003Etpara5.0004.9964.992
02b Ijms 19 00630 i004Etpara5.7455.6505.655
03c * Ijms 19 00630 i005Etpara5.3195.4835.420
04b Ijms 19 00630 i006Etpara4.7964.9154.867
05c Ijms 19 00630 i007Etpara4.8704.8694.911
06b Ijms 19 00630 i008Etpara5.0004.9414.845
07b Ijms 19 00630 i009Etpara5.0005.0155.029
08c Ijms 19 00630 i010Etpara5.0005.0395.093
09c Ijms 19 00630 i011Etpara5.0005.0195.053
10b * Ijms 19 00630 i012Etpara5.4565.1745.317
11c Ijms 19 00630 i013Etpara5.0975.0905.097
12b Ijms 19 00630 i014Etpara4.9594.8745.028
13c Ijms 19 00630 i015Etpara5.0004.9245.125
14b Ijms 19 00630 i016Etpara5.3775.2615.178
15c Ijms 19 00630 i017Etpara5.2015.3155.297
16b Ijms 19 00630 i018Etpara5.5235.5885.607
17c Ijms 19 00630 i019Etpara5.6995.6455.712
18b Ijms 19 00630 i020Etpara5.0005.0604.984
19c Ijms 19 00630 i021Etpara5.1555.1215.089
20b Ijms 19 00630 i022Etpara5.0005.1825.047
21c Ijms 19 00630 i023Etpara5.3985.2395.156
22b * Ijms 19 00630 i024Etpara5.8545.8465.551
23b Ijms 19 00630 i025Etpara5.5535.6155.841
24c Ijms 19 00630 i026Etpara6.5236.5426.349
25b * Ijms 19 00630 i027Etmeta5.0005.0524.991
26c * Ijms 19 00630 i028Etmeta5.1945.0084.983
27b Ijms 19 00630 i029Hpara5.0004.9664.934
28c Ijms 19 00630 i030Hpara5.0005.0024.974
29b Ijms 19 00630 i031Mepara5.0975.1515.245
30b Ijms 19 00630 i032Prpara6.0465.8755.886
31c Ijms 19 00630 i033Prpara5.8245.9335.993
32b Ijms 19 00630 i034Phenylpara5.6995.6995.648
33c Ijms 19 00630 i035Phenylpara5.5235.5565.439
⁎ Test set molecules.

