Article

Furosine Induced Apoptosis by the Regulation of STAT1/STAT2 and UBA7/UBE2L6 Genes in HepG2 Cells

1
Institute of Animal Sciences, Chinese Academy of Agricultural Sciences, Beijing 100193, China
2
College of Animal Science and Technology, Anhui Agricultural University, Hefei 230036, China
*
Author to whom correspondence should be addressed.
Int. J. Mol. Sci. 2018, 19(6), 1629; https://0-doi-org.brum.beds.ac.uk/10.3390/ijms19061629
Submission received: 29 March 2018 / Revised: 23 April 2018 / Accepted: 25 April 2018 / Published: 31 May 2018
(This article belongs to the Section Biochemistry)

Abstract

:
As a typical product in the Miallard reaction, research on the quantitative detection of furosine is abundant, while its bioactivities and toxic effects are still unclear. Our own work recently demonstrated the induction of furosine on apoptosis in HepG2 cells, while the related mechanism remained elusive. In this study, the effects of furosine on cell viability and apoptosis were detected to select the proper dosage, and transcriptomics detection and data analysis were performed to screen out the special genes. Additionally, SiRNA fragments of the selected genes were designed and transfected into HepG2 cells to validate the role of these genes in inducing apoptosis. Results showed that furosine inhibited cell viability and induced cell apoptosis in a dose-dependent manner, as well as activated expressions of the selected genes STAT1 (signal transducer and activator of transcription 1), STAT2 (signal transducer and activator of transcription 2), UBA7 (ubiquitin-like modifier activating enzyme 7), and UBE2L6 (ubiquitin-conjugating enzyme E2L6), which significantly affected downstream apoptosis factors Caspase-3 (cysteinyl aspartate specific proteinase-3), Bcl-2 (B-cell lymphoma gene-2), Bax (BCL2-Associated gene X), and Caspase-9 (cysteinyl aspartate specific proteinase-9). For the first time, we revealed furosine induced apoptosis through two transcriptional regulators (STAT1 and STAT2) and two ubiquitination-related enzymes (UBA7 and UBE2L6).

1. Introduction

The Maillard reaction is a classical reaction resulting from the food heating process. As it results in the covalent attachment of sugars and the degradative products to lysine and arginine residues, the generated amadori products are known as Maillard reaction products (MRPs) [1,2]. As one of the typical MRPs in the Miallard reaction, furosine (C12H18N2O4, Mw 254.28) exists in lots of food items including dairy products, infant formula, cereals, honey, and bakery products, etc. [3,4,5]. Furosine has been proven to be a stable derivative of the amadori compound, which is also well-known as a reliable marker and indicator of the nutritional evaluation of the heat treatment of food [6,7].
Articles on the quantitative detection and analysis of furosine are abundant, while research about the toxicity evaluation and mechanism exploration of furosine are rare. Until now, there has been no available data providing evidence for metabolic courses exploration of furosine, though safety evaluation and limit control of furosine in food products have become necessary and pressing. In our recent research, furosine was found to pose a toxic effect on liver tissue through activating downstream apoptosis and an inflammatory reaction, embodied in up-regulation of Caspase-3, Bax, Bcl-2, IL-1β, and TNF-α [8]. However, the related molecular mechanism of furosine still remained unclear. In this study, we exerted HepG2 cell transcriptomics detection to screen out the special genes, STAT1, STAT2, UBA7, and UBE2L6, which might play a key role in participating cell apoptosis induced by furosine. Then, we investigated the effect of these selected genes on downstream apoptosis factors, in order to further validate furosine induced cell apoptosis through the two transcriptional regulators (STAT1 and STAT2) and two ubiquitination-related enzymes (UBA7 and UBE2L6).

2. Results

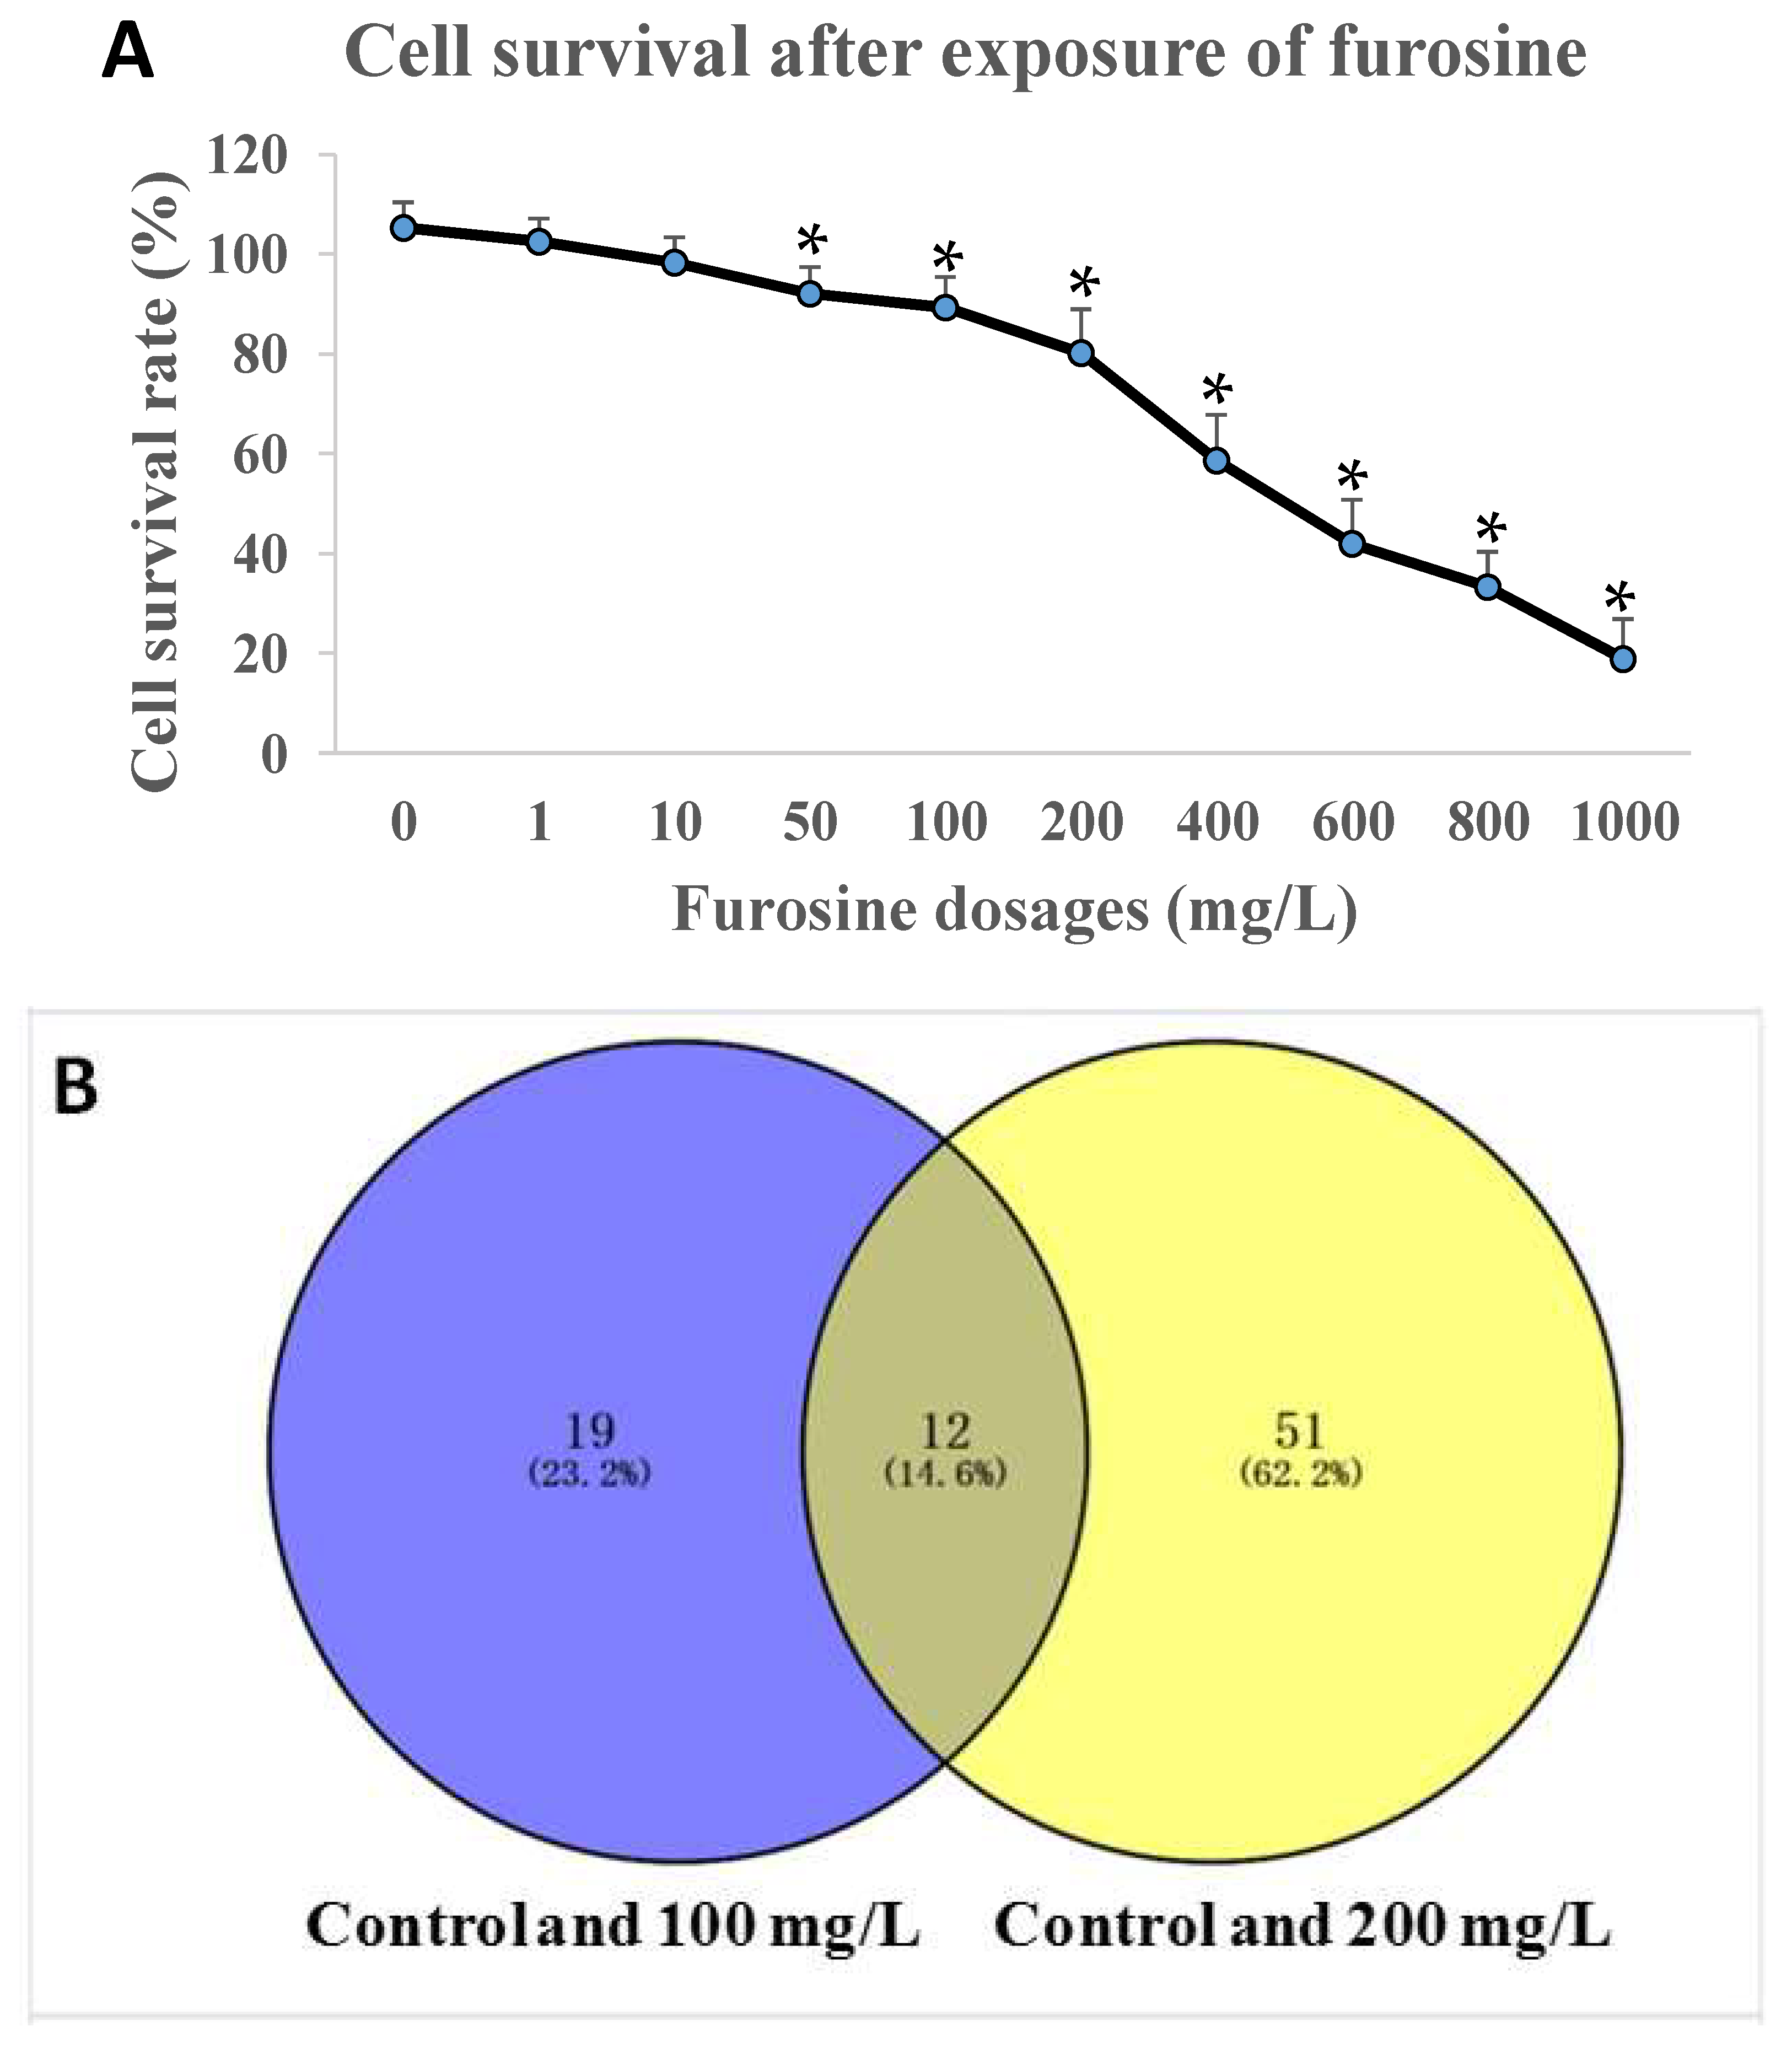
2.1. Furosine Inhibited HepG2 Cell Viability

To test the effect of furosine on HepG2 cell viability, different dosages (0, 1, 10, 50, 100, 200, 400, 600, 800 and 1000 mg/L) of furosine were applied utilizing the CCK8 kit. Reduction in cell viability was observed after being exposed to furosine with a dosage of 100 mg/L or above (p < 0.05) for 48 h, with a dose-effect relationship (Figure 1A). Considering that the cell viability at the dosages of 100 and 200 mg/L were 90.3 ± 9.6% and 83.5 ± 5.0%, respectively, the two dosages were selected as the appropriate ones in the following experiments.

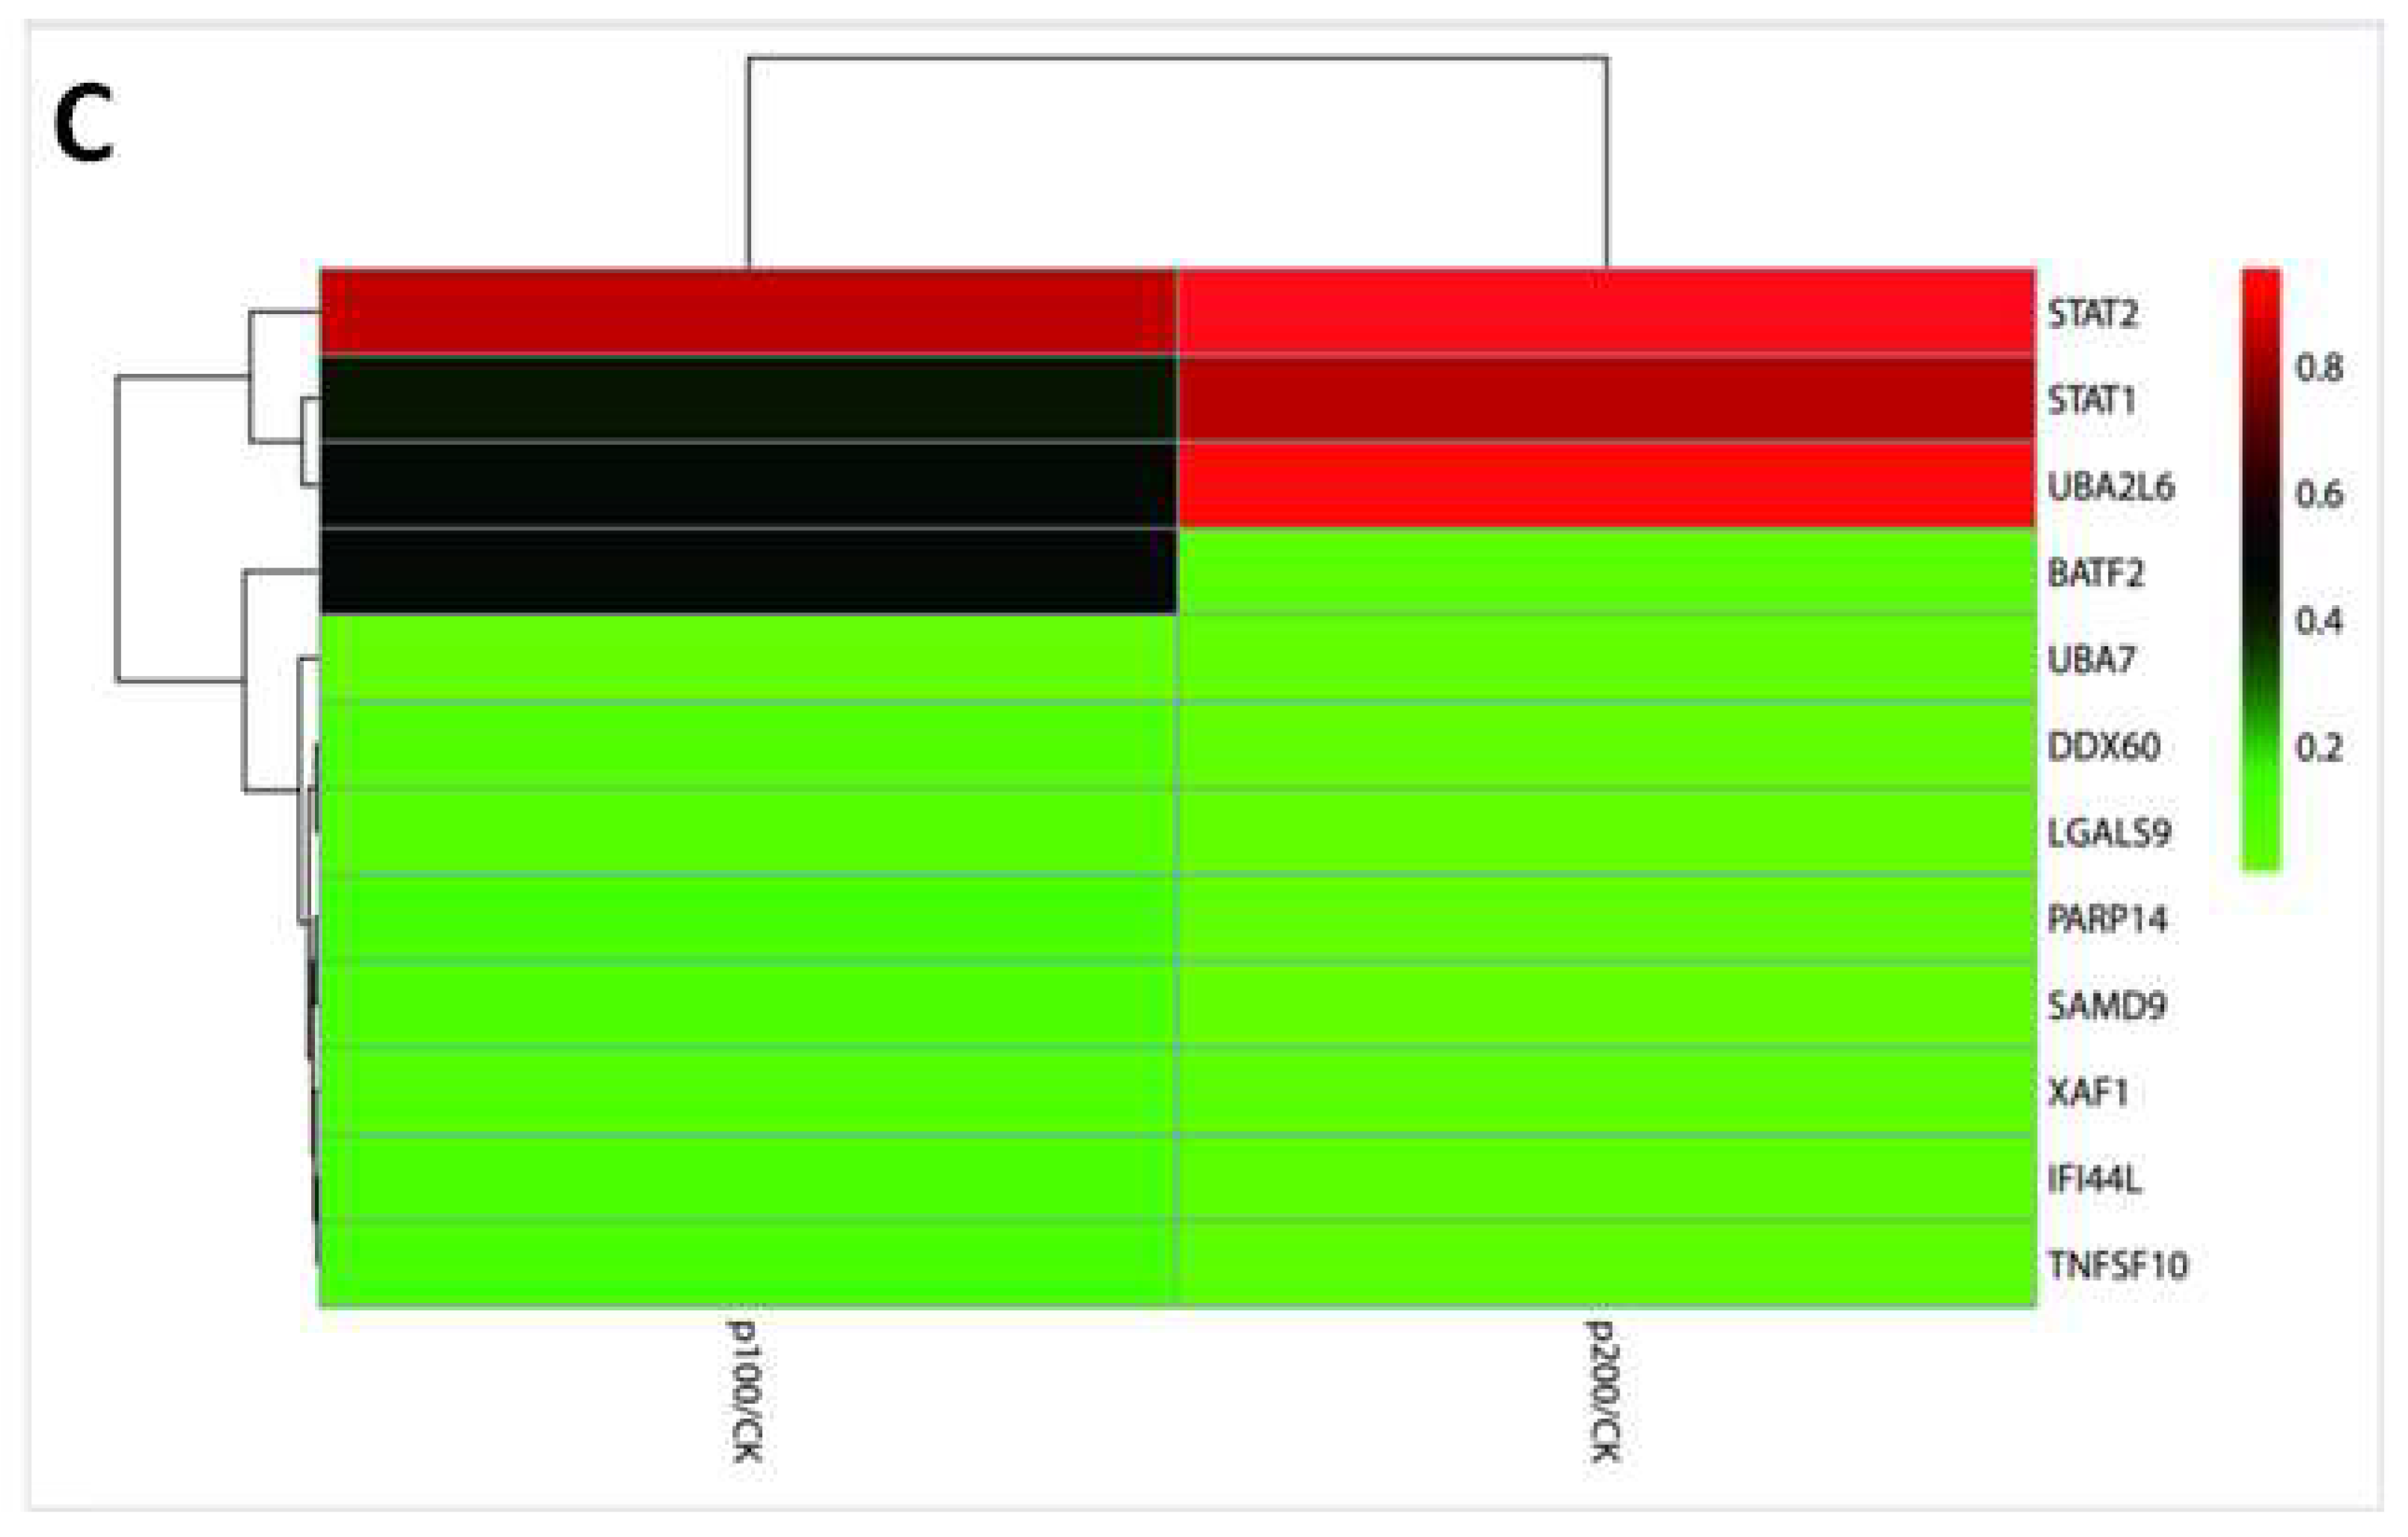
2.2. Transcriptomics Detection of HepG2 Cells

The transcriptomics strategy was used in HepG2 cells before or after 100/200 mg/L furosine treatment to detect the important genes participating in the signal pathway, and the number of biological replicates in each group was three (n = 3). We found that 31 gene expressions changed in the control group vs. 100 mg/L group condition, while 63 gene expressions changed in the control vs. 200 mg/L condition. Expressions of 19 genes or 51 genes were changed only in control vs. 100 mg/L or control vs. 200 mg/L conditions. Together, there were 12 genes with a similar expression pattern between the control vs. 100 mg/L and control vs. 200 mg/L, including STAT1, STAT2, UBA7, and UBE2L6, etc. (Figure 1B, Venn diagram). The expression levels of the 12 special genes were integrated into the heatmap (Figure 1C).

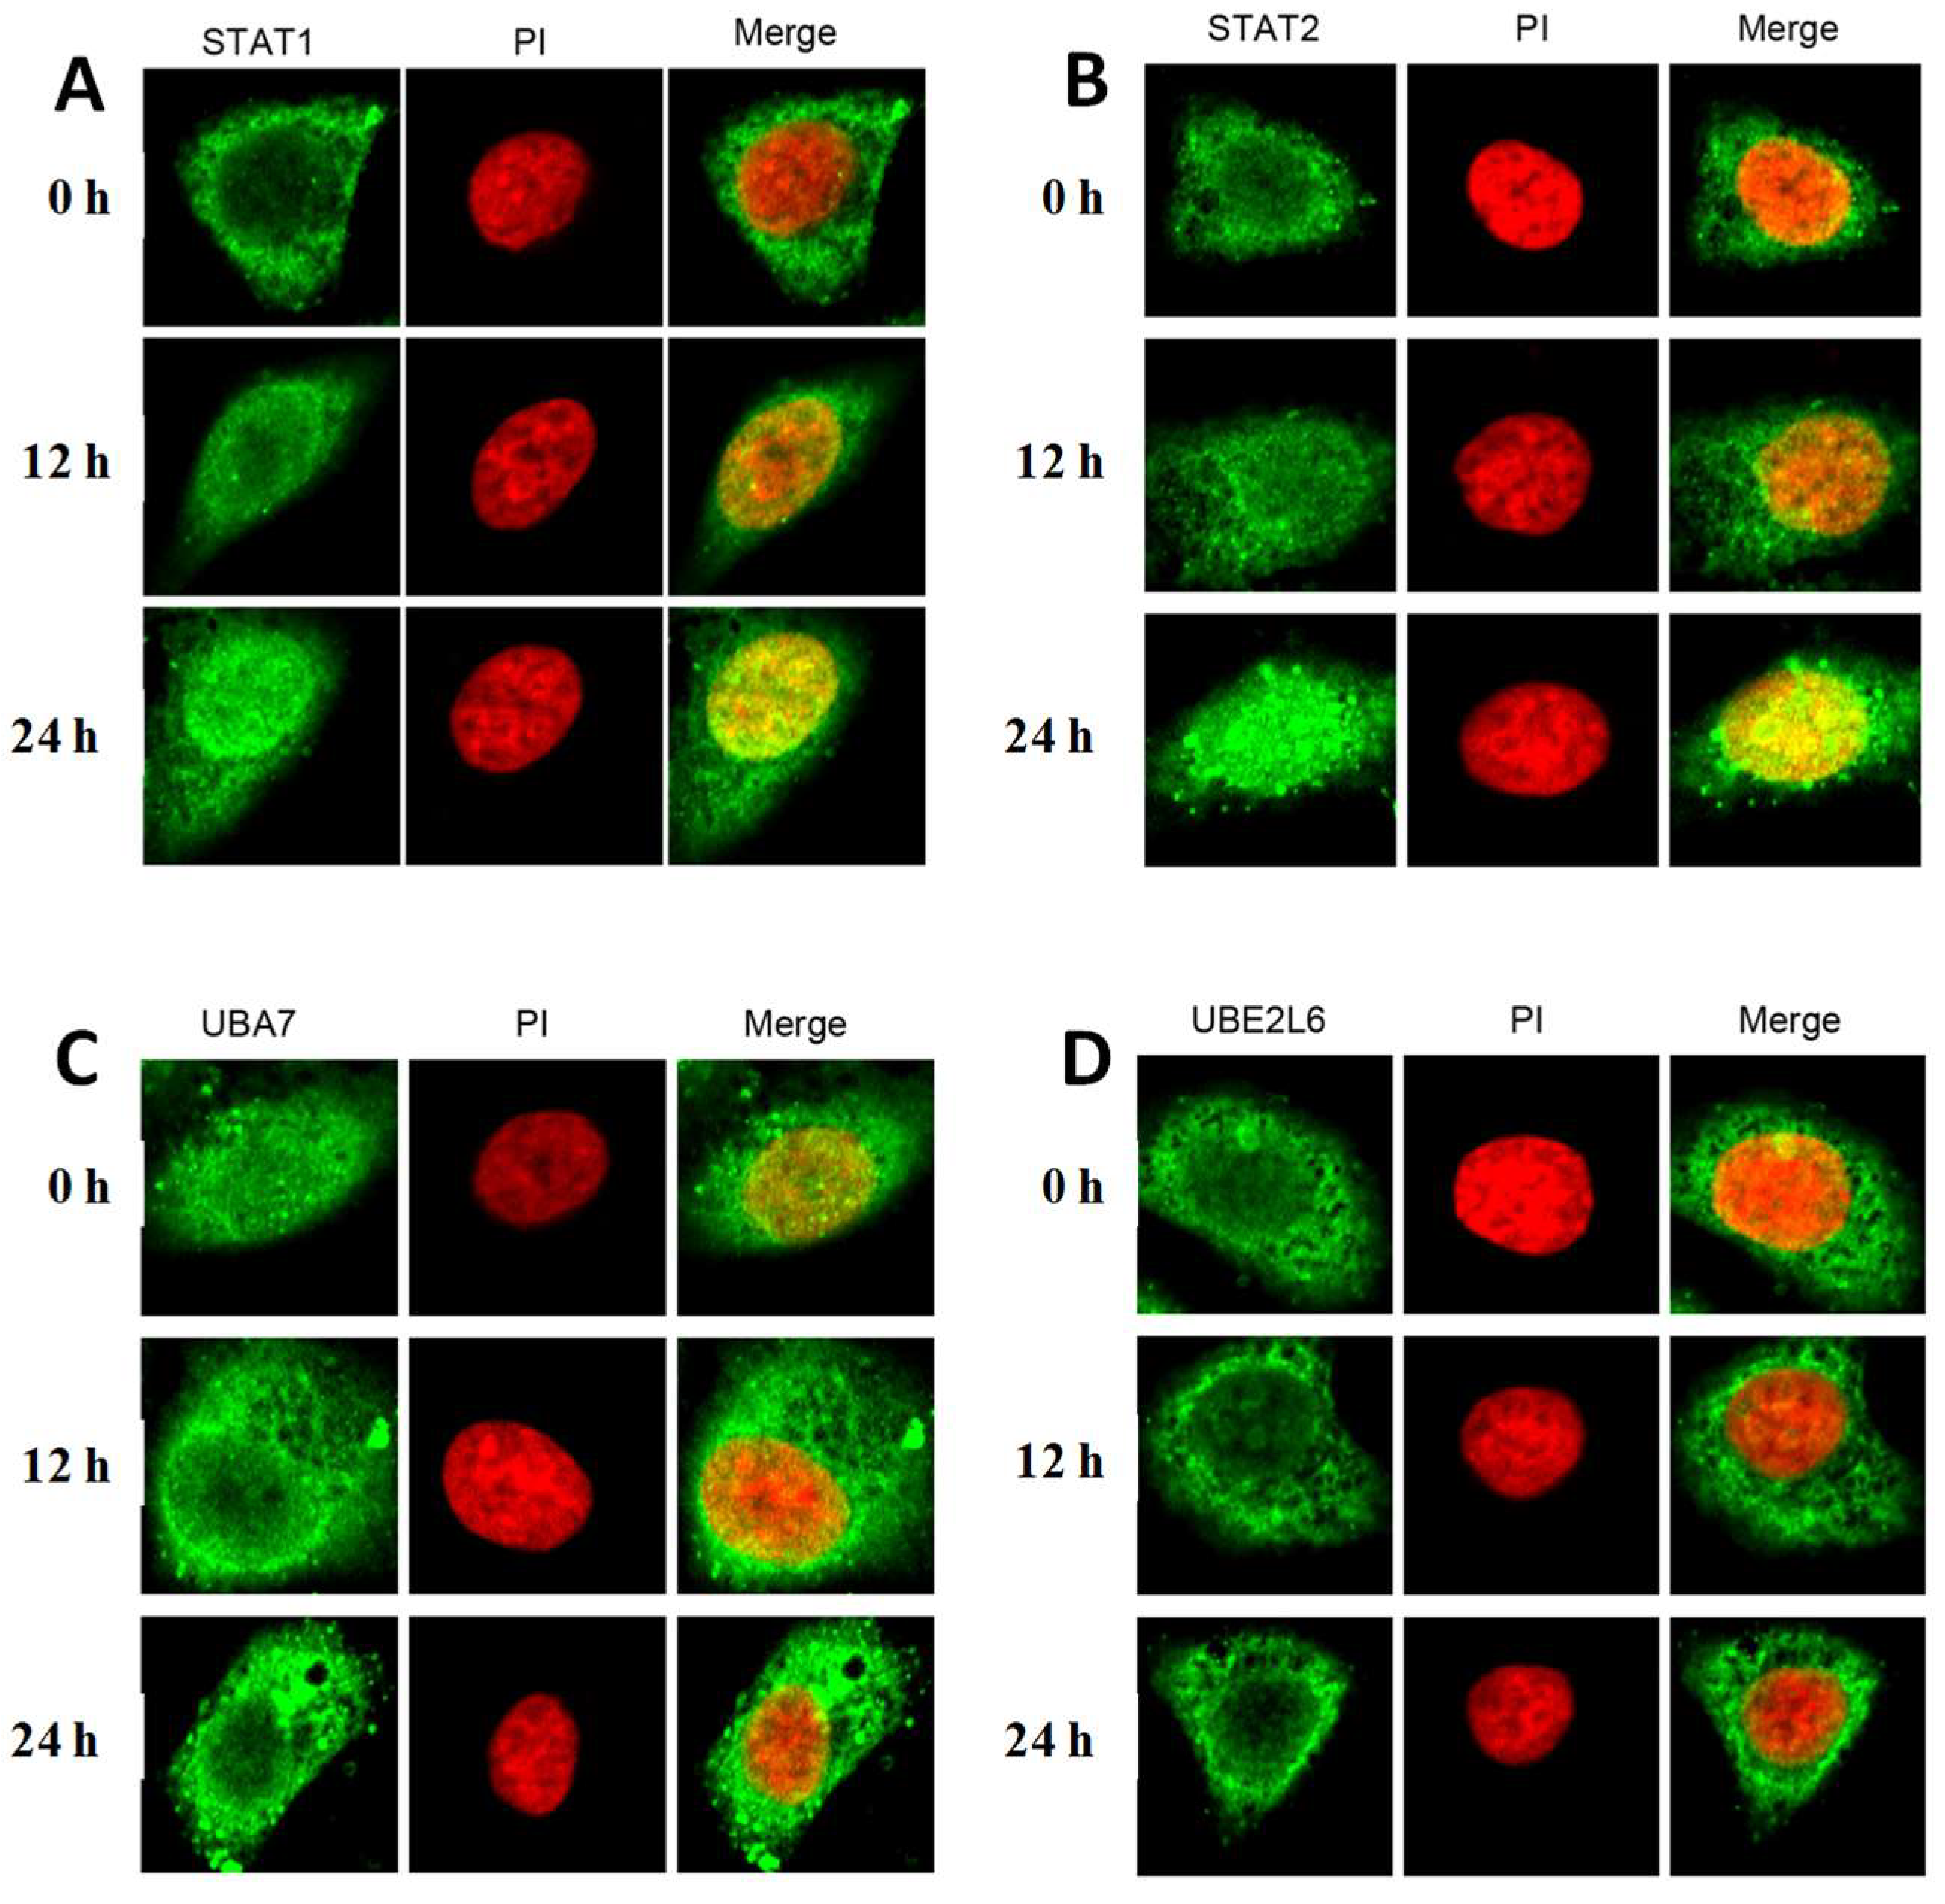
2.3. The Effect of Furosine on Cellular Location of STAT1, STAT2, UBA7, and UBE2L6

The expressions and subcellular locations of STAT1/2, UBA7, and UBE2L6 were also investigated by in situ fluorescence imaging using confocal. The GFP-labeled of these factors fused proteins were transfected into HepG2, and green fluorescence indicates that the fused proteins all expressed successfully. As the time exposure to furosine increased, the green light of the factors were boosted, indicating that the expressions were enhanced. To exactly locate the protein, the PI dye was used to stain the compartment of the nucleus.
As the merged results of these proteins and nucleus showed, STAT1 and STAT2 were found to be mainly located in the cytoplasm of normal HepG2 cells, and they began to translocate into the nucleus with the treatment of furosine (Figure 2A,B). UBA7 was found to locate in both cytosol and the nucleus under a normal condition, and most of the UBA7 protein in furosine-treated cells translocated into cell cytosol (Figure 2C). Most of the UBE2L6 protein located in cell cytosol without outside stimulation, and it seemed to translocate into cytosol in furosine-treated cells (Figure 2D).

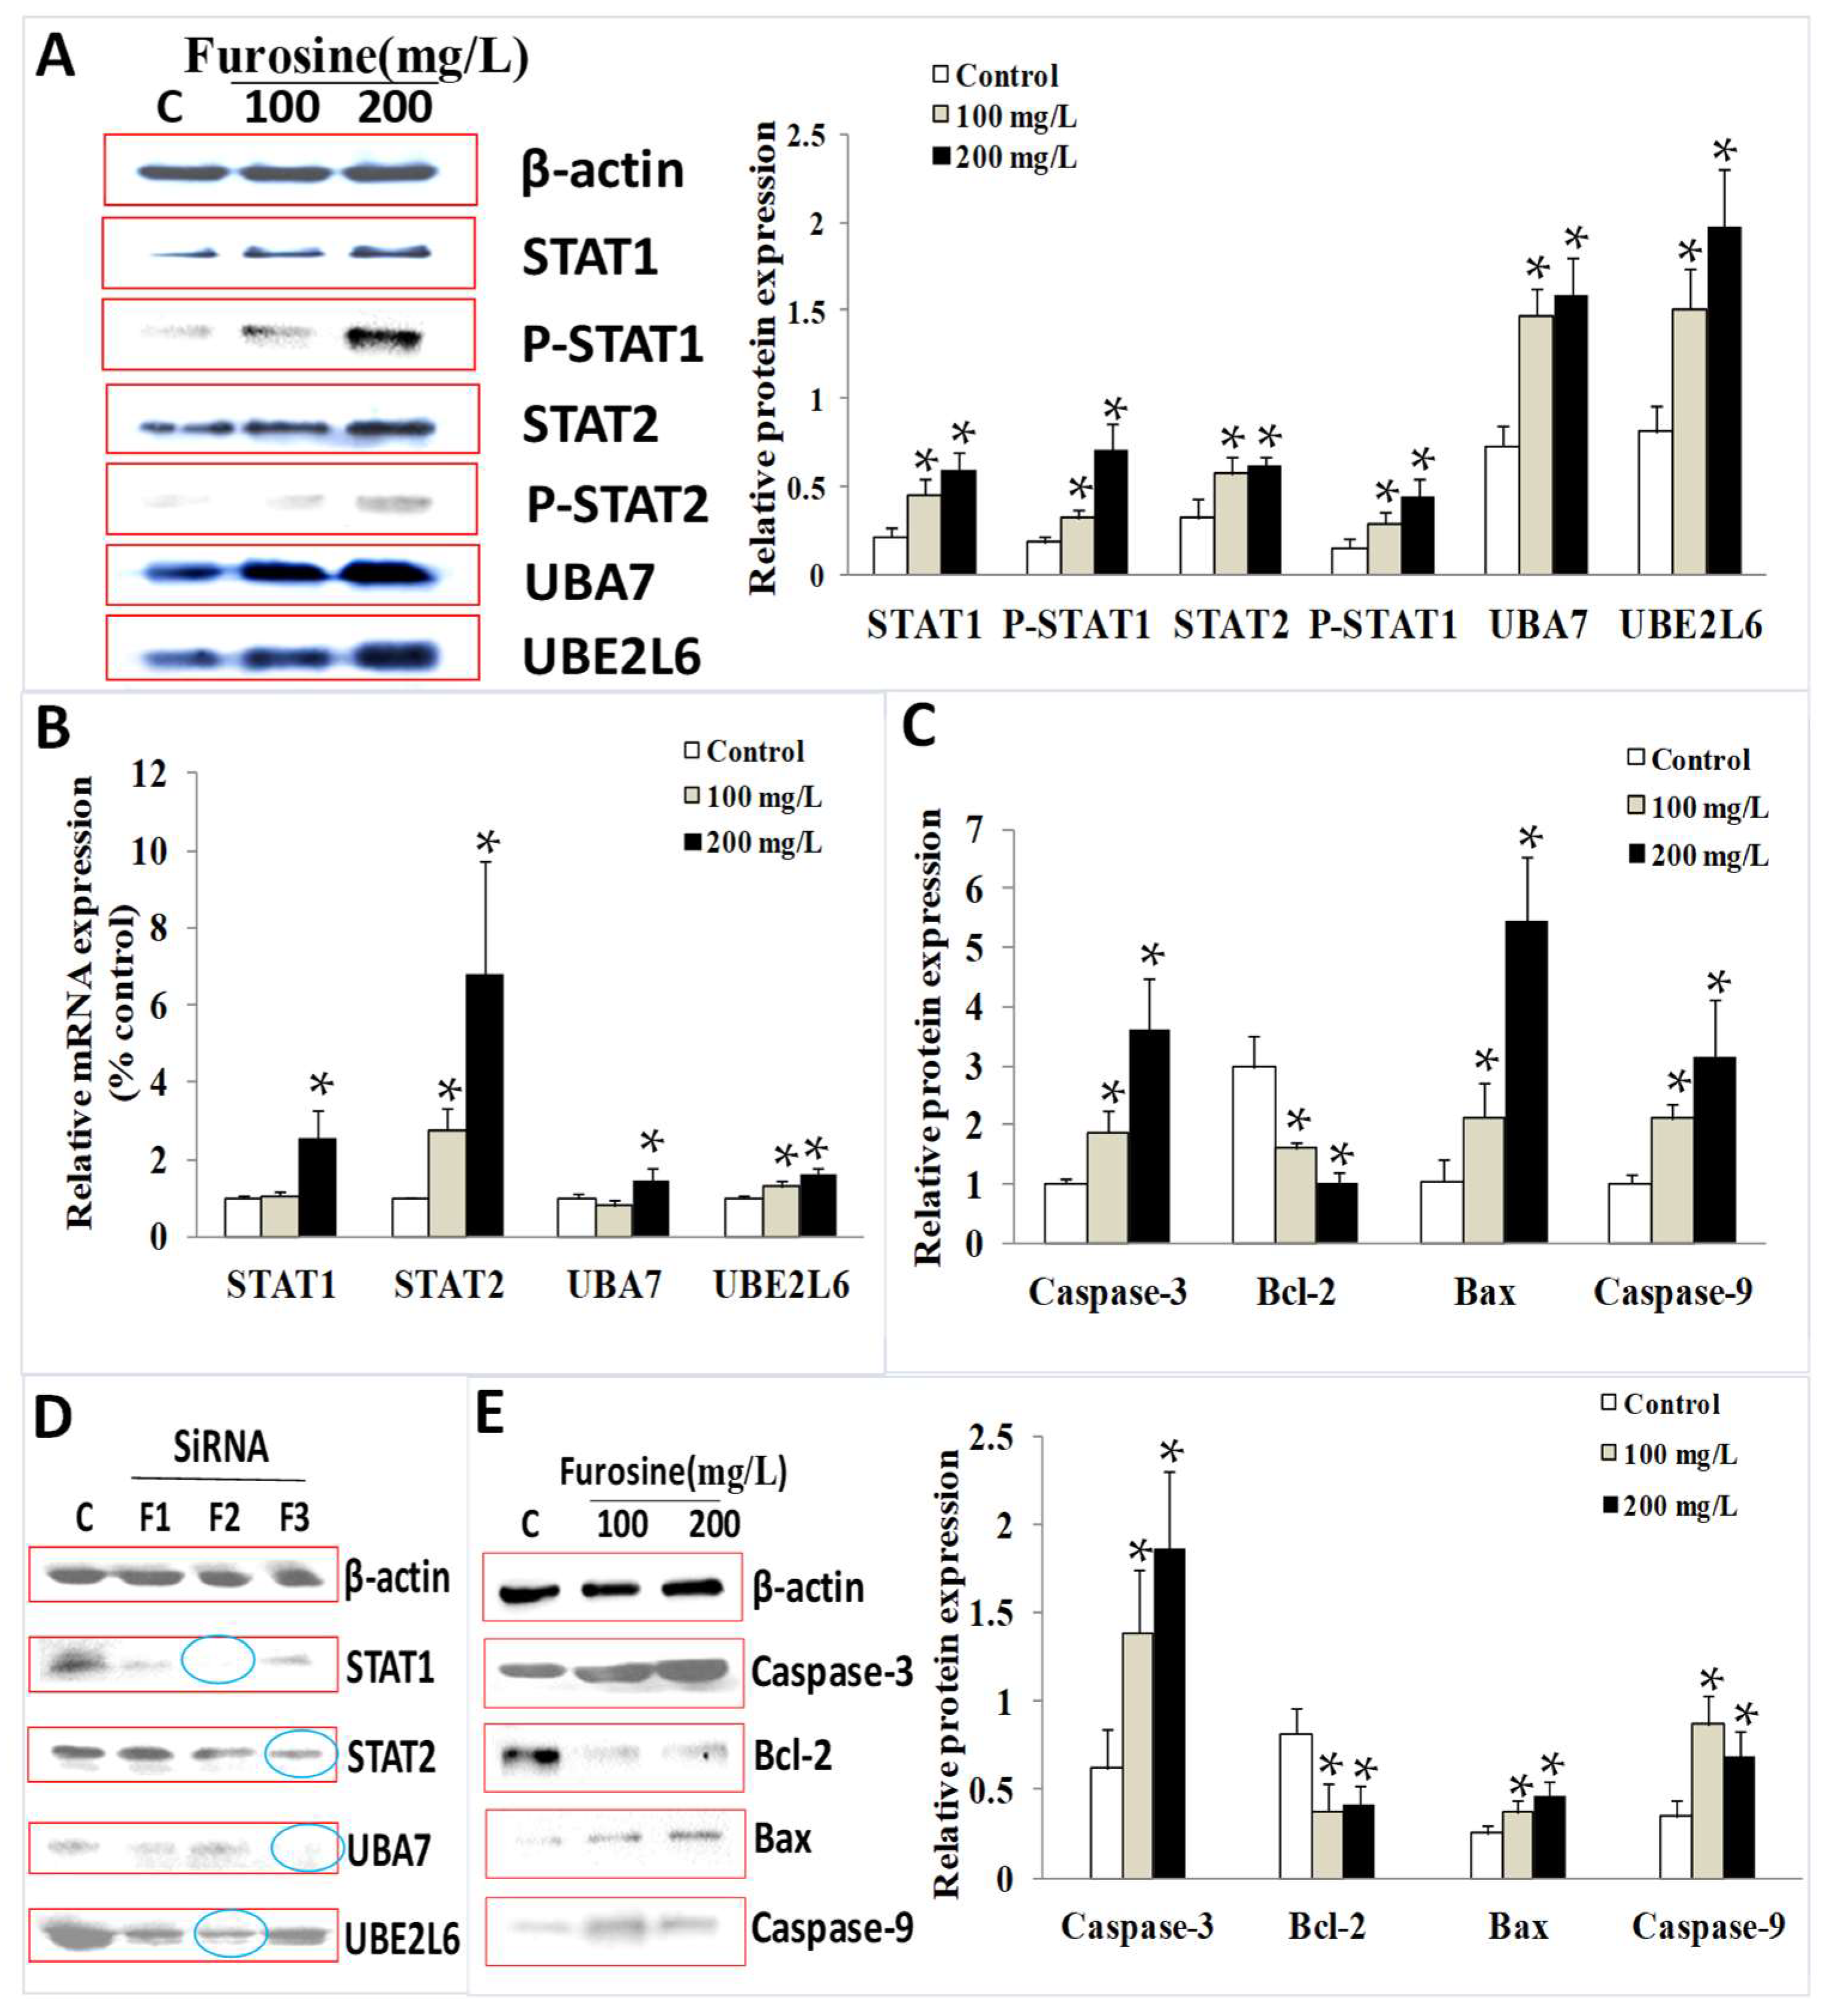
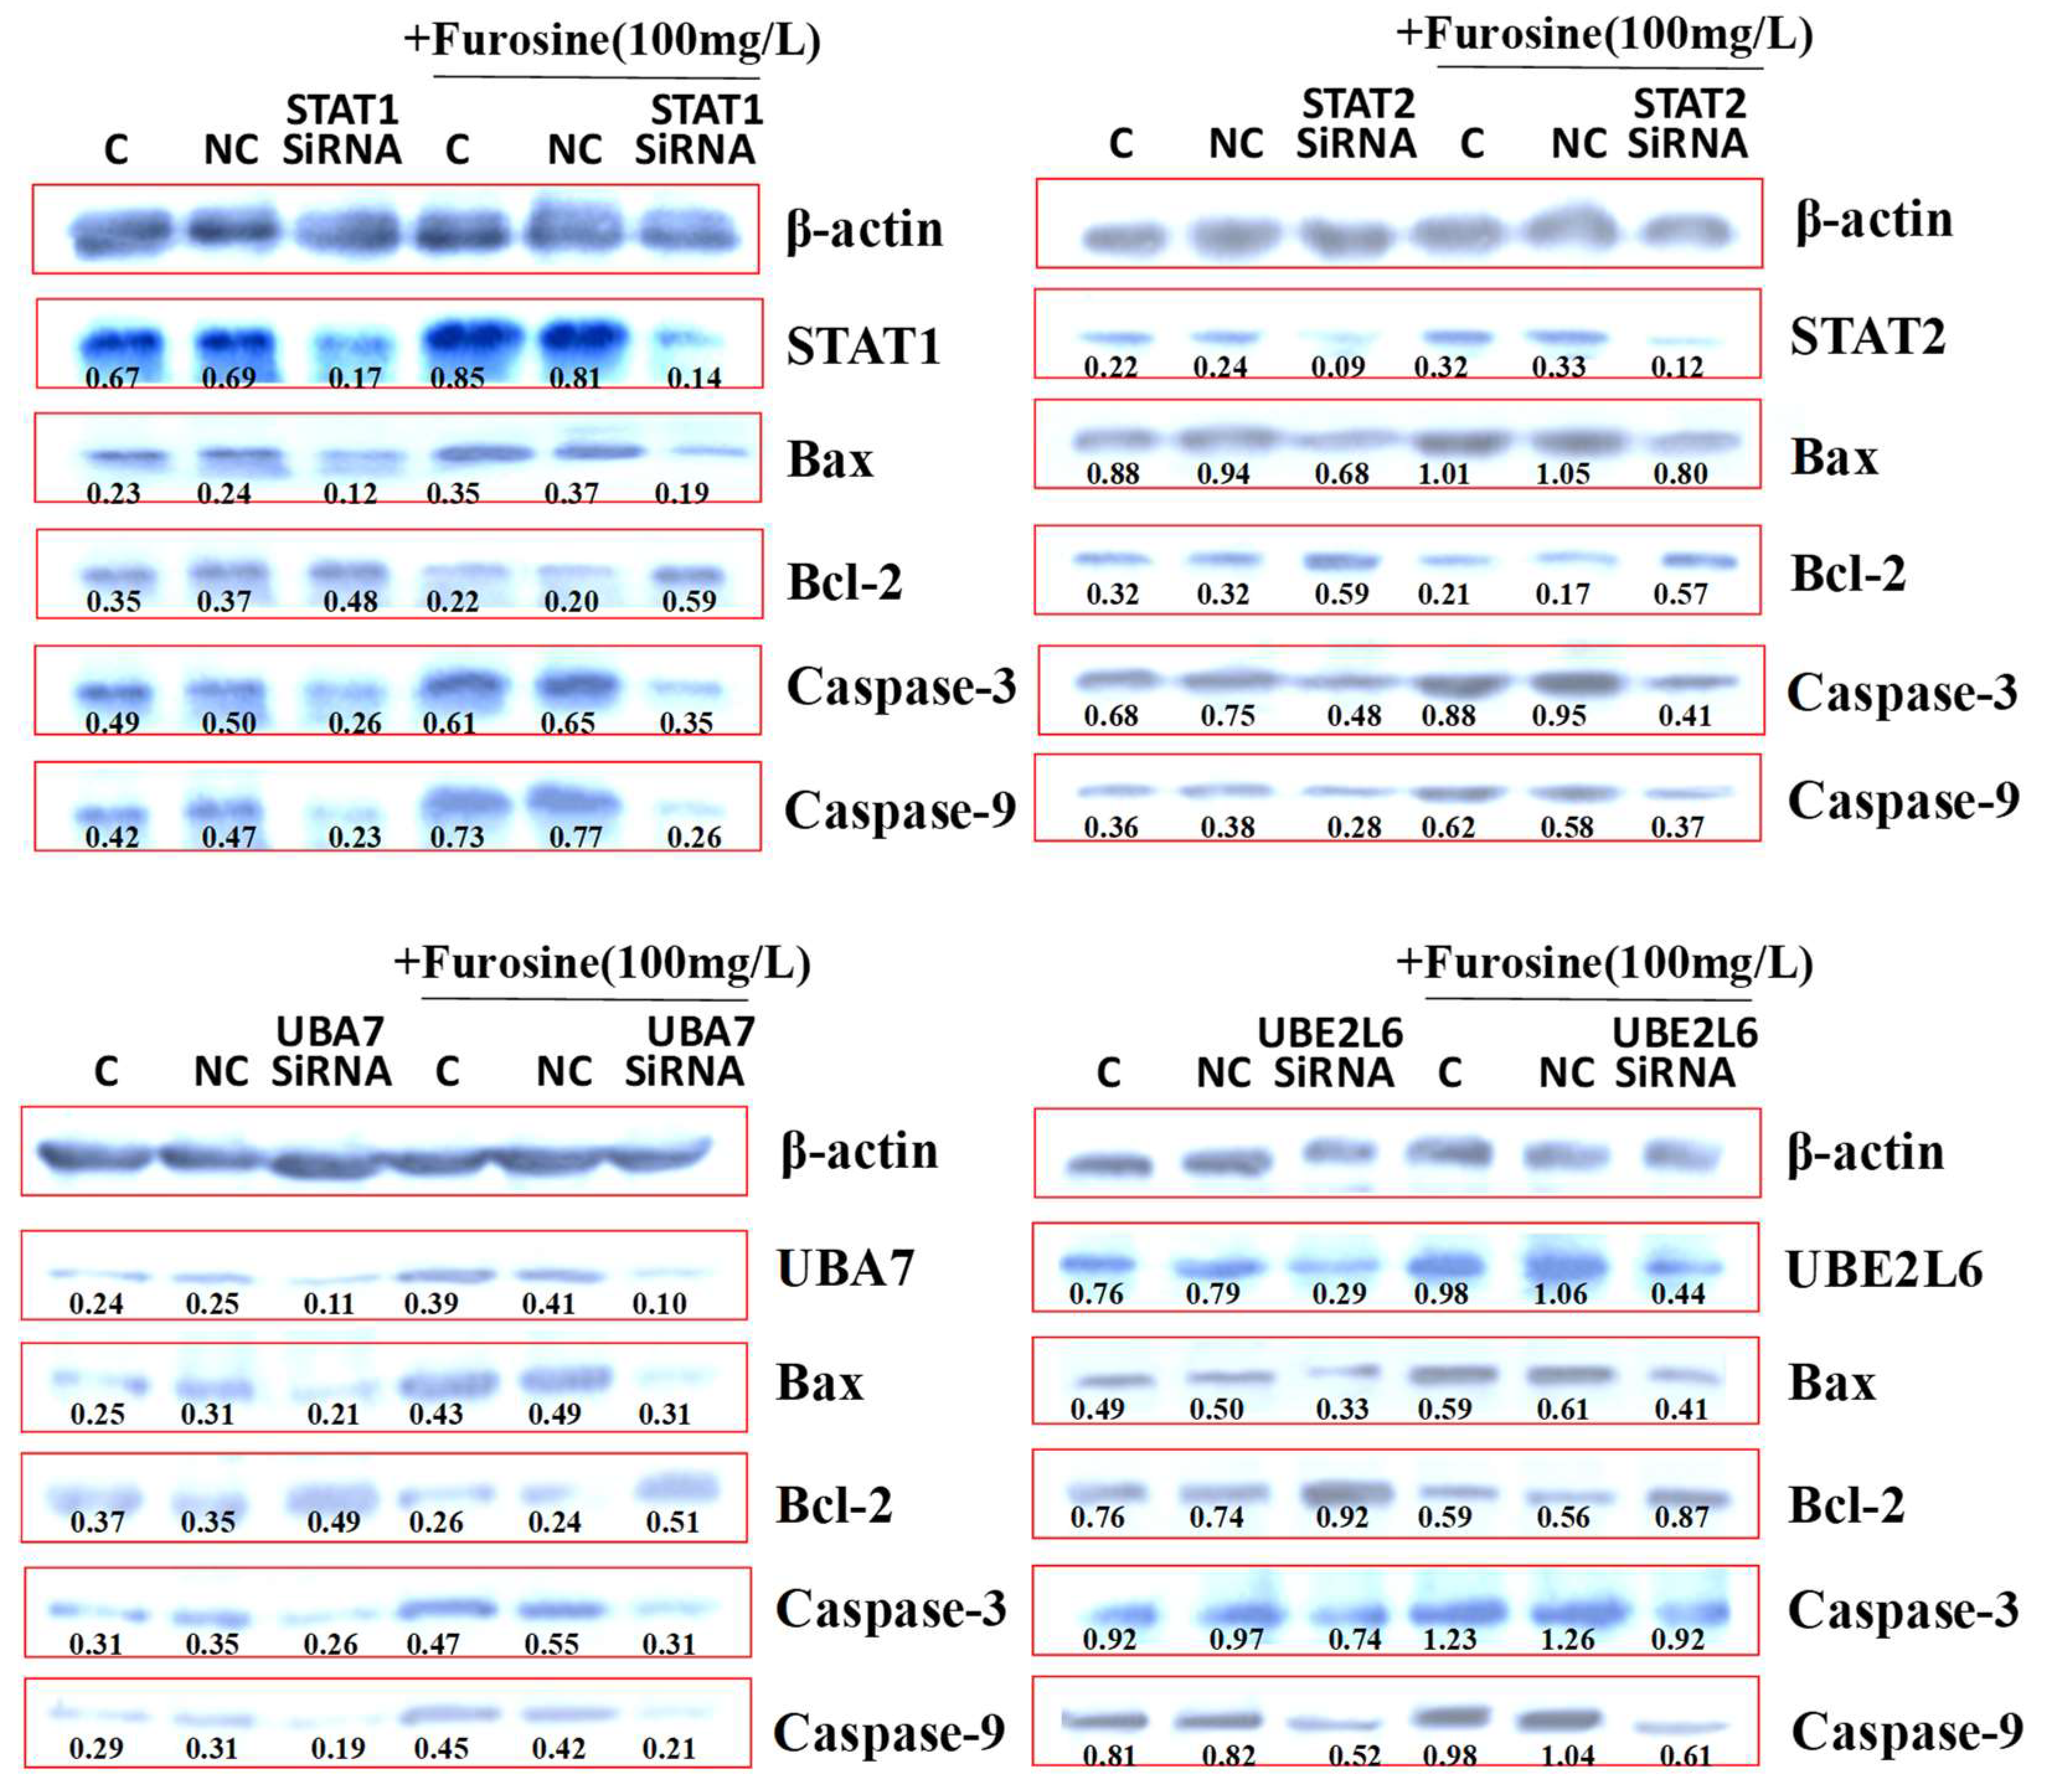
2.4. The Effect of Furosine on mRNA and Protein Expression of STAT1, STAT2, UBA7, and UBE2L6

To validate the effect of furosine on the expression of these factors, in terms of both the mRNA level and protein level, qPCR and western blotting detections were performed. Results showed that expressions of STAT1, STAT2, P-STAT1, P-STAT2, UBA7, and UBE2L6 proteins in the whole HepG2 cells increased significantly (p < 0.05) with the treatment of furosine. Additionally, mRNA expressions of STAT1, STAT2, P-STAT1, P-STAT2, UBA7, and UBE2L6 in the whole cells increased significantly (p < 0.05) with the treatment of furosine, in a dose-dependent manner, when compared with the control (Figure 3A,B).

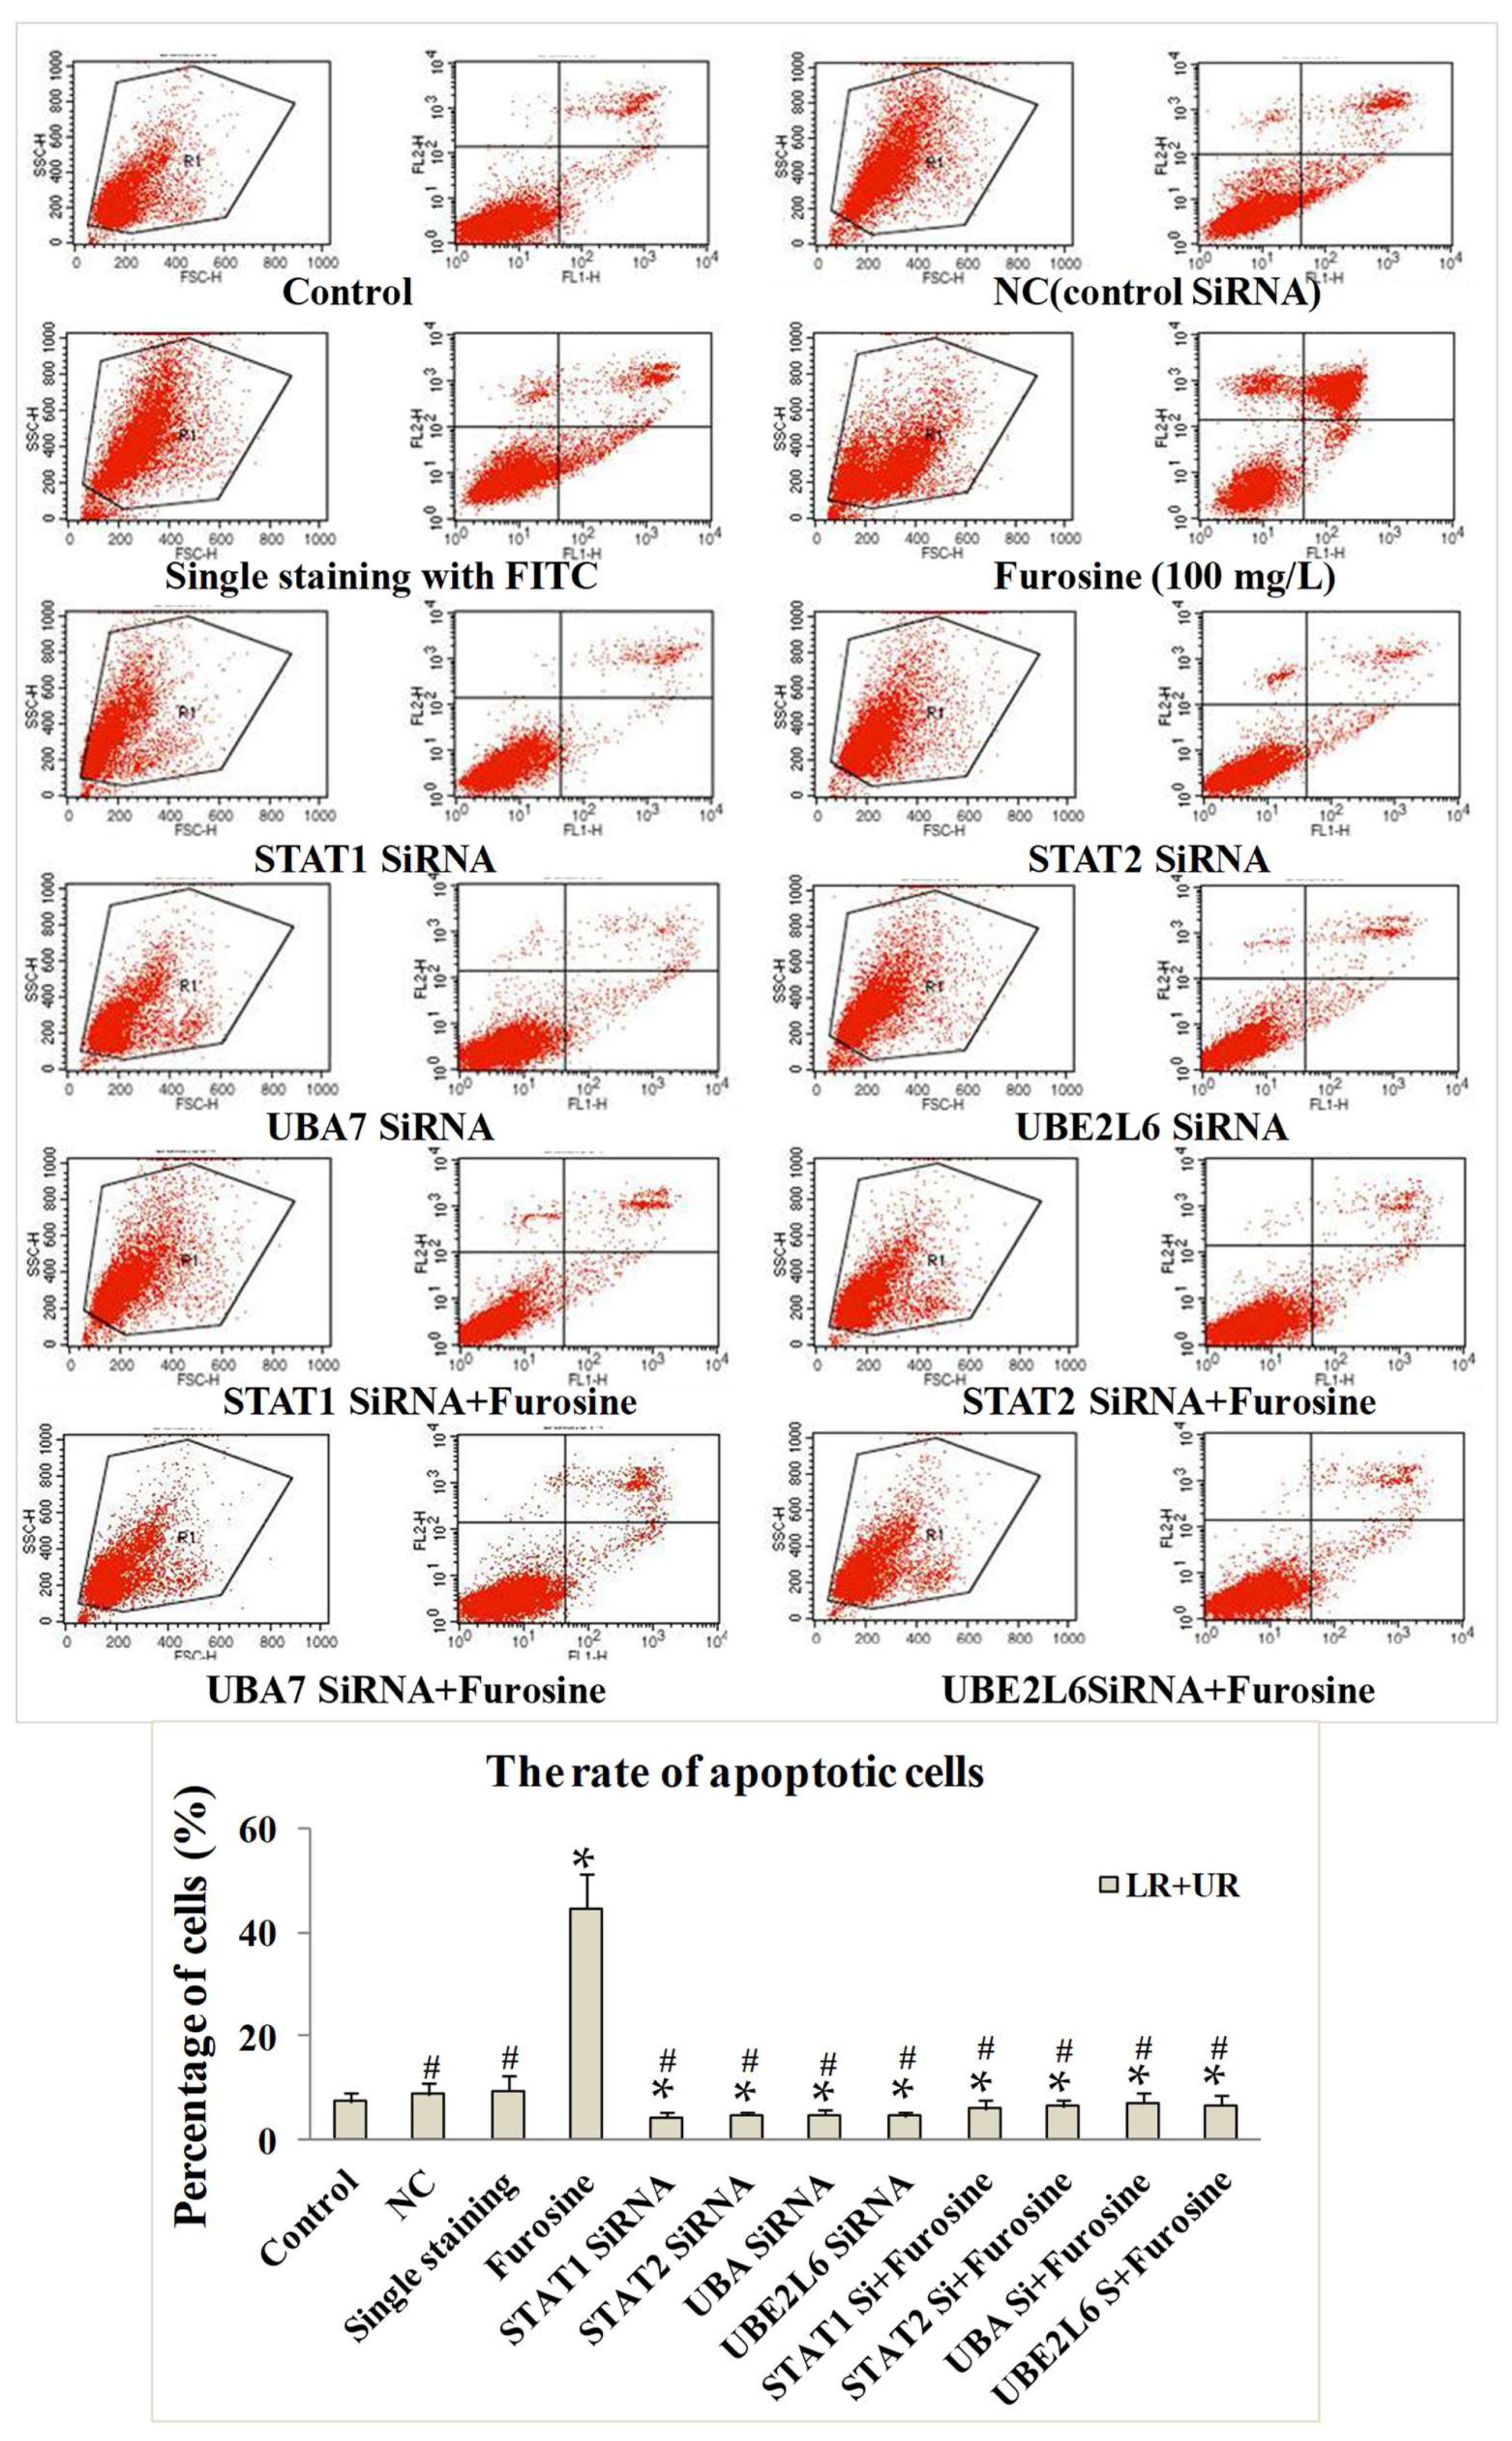
2.5. The Role of Furosine in Inducing Cell Apoptosis

To investigate the role of furosine in regulating the apoptosis-related pathway, downstream factors including Caspase-3, Bcl-2, Bax, and Caspase-9 were detected by qPCR (quantitative real time polymerase chain reaction) and western blotting. Results showed that when compared with the control, Caspase-3, Bax, and Caspase-9 were found to be significantly up-regulated in furosine treatment groups (p < 0.05), and the inhibitor of apoptosis Bcl-2 decreased significantly (p < 0.05), in terms of both the mRNA level (Figure 3C) and protein level (Figure 3E). Moreover, expressions of these factors were found to be changed in furosine treatment groups in a dosage-dependent manner.

2.6. The Role of STAT1, STAT2, UBA, and UBE2L6 in Participating in Apoptosis Induced by Furosine

To estimate the function of these factors in the furosine-induced signal pathway, the different expression patterns of regulatory factors were investigated in HepG2 cells and SiRNA-treated HepG2 cells. The gene fragments for SiRNA of STAT1/2, UBA7, and UBE2L6 were designed and used to test the efficiency of gene silence, and the gene fragments of high efficiency were screened out for further study (blue arrows, in Figure 3D).
To investigate the effect of furosine on cell apoptosis, an annexin V/PI (propidium iodide) staining kit was utilized. Results showed that the cell apoptosis rates in the NC (negative control) group and single staining group seemed to exhibit no obvious change compared to the control. When we treated the cells with STAT1/STAT2/UBA7/UBE2L6 SiRNAs, respectively, the apoptosis rates were lower than the control/ NC group/ single staining group (p < 0.05). Additionally, treatment of furosine significantly induced the apoptosis of HepG2 cells when compared with the control (p < 0.05). When we treated the cells with SiRNAs of STAT1/STAT2/UBA7/UBE2L6 + furosine (100 mg/L), there seemed to be no obvioius up-regulation of apoptosis rates compared with the STAT1/STAT2/UBA7/UBE2L6 SiRNAs groups. The above results indicated that the four factors played key roles in inducing and participating in HepG2 cell apoptosis (Figure 4).
In the STAT1-SiRNA+furosine group, expression of Caspase-3 decreased compared with the STAT1-SiRNA group (p < 0.05), while the other genes exhibited a similar expression pattern to the STAT1-SiRNA group. In the STAT2-SiRNA+furosine group, expressions of Caspase-9, Bax, and Bcl-2 were comparable to those in the STAT2-SiRNA group. In the UBA7-SiRNA+furosine group, expressions of Bax and Caspase-9 were down-regulated, whereas Bcl-2 exhibited a higher expression, compared to those in the UBA7-SiRNA group (p < 0.05). In the UBE2L6-SiRNA+furosine group, expressions of Bax and Caspase-9 decreased more than those in the UBE2L6-SiRNA group (p < 0.05) (Figure 5).

3. Discussion

STAT1 and STAT2 are transcription factors belonging to the STAT protein family. STAT molecules can be phosphorylated by kinase-associated receptors and activated by dimerization and forming homodimers or heterodimers, which then translocate into the nucleus as transcription factors. As the most classical members of the STATs family, STAT1 and STAT2 were found to be activated by several inflammatory ligands including interferon gamma (IFN-γ), interferon alpha (IFN-f), epidermal Growth Factor (EGF), and tumor necrosis factor alpha (TNF-α), etc. [9]. STAT1 and STAT2 are involved in cell viability, proliferation, apoptosis, and the cell cycle, which mediate inflammation, oxidation, tumors, and organ injury through the STAT1/STAT2-related pathway [10,11,12,13,14,15,16].
UBA7 and UBE2L6 belong to ubiquitination-related enzymes. The ubiquitin-modified proteins are always abnormal or short-lived proteins, which are finally degradated. Ubiquitination course is usually considered to involve three classes of enzymes: ubiquitin-activating enzymes (E1s), ubiquitin-conjugating enzymes (E2s), and ubiquitin-protein ligases (E3s). UBA7 is regarded as one kind of E1 ubiquitin-activating enzyme, and UBE2L6 is regarded as a member of the E2 ubiquitin-conjugating enzyme group. The two enzymes are involved in protein metabolization like proteasomal degradation and cell apoptosis, which are tightly related to inflammation, organ injury, virus infection, and tumors, etc. [17,18,19,20,21,22,23,24].
There are several articles elucidating the relationship between STATs and ubiquitin-related enzymes, especially in cell apoptosis activated by hypoxia, inflammation, and tumors. Research has proved that STAT1/2 can induce cell apoptosis and protein degradation, requiring ubiquitin-related enzymes including UBA7 and UBE2L6 [25,26,27,28]. Considering the above reuslts, we selected the four factors through transcriptomics detection and tested their translocation and expression levels in furosine treatment cells.
IF results showed that the fluorescence signal of STAT1 and STAT2 in the cell nucleus increased, the fluorescence signal of UBA7 in the cell nucleus weakened, and the one of UBE2L6 seemed to exhibit no obvious change, when comparing them with the control. The above results could be explained as follows: As key transcriptional regulators, STAT1 and STAT2 entered into the cell nucleus with the aim of regulating the expression of several apoptotic proteins after the stimulation of furosine; UBA7 usually locates in the whole cell, and it tended to translocate into cell cytosol and degradate proteins in apoptosis course in the furosine treatment group; UBE2L6 always locates in cell cytosol and still participates in protein degradation in cytosol, so its location seemed to display no change with the treatment of furosine [29,30,31,32,33,34]. The above results suggested that furosine activated the four factors in HepG2 cells, embodying the translocation of these factors in HepG2 cells.
Combined with the results of q-PCR detection and western blotting detection, the mRNA levels of the four factors (STAT1/2, UBA7, UBE2L6) in the furosine treatment groups were expressed significantly higher than the control, and the protein levels of the six factors (STAT1/2, P-STAT1/2, UBA7, UBE2L6) in the furosine treatment groups were expressed significantly higher than the control, suggesting that furosine activated the phosphoralation of STAT1 and STAT2 and expressions of UBA7 and UBE2L6, which were the downstream sponsor of STAT1 and STAT2, in a dosage-dependent manner. The above results further validated the effect of furosine in regulating these factors in HepG2 cells.
Referring to cell apoptosis, the apoptotic cell rate was detected and analyzed by a flow cytometer, the effect of furosine in inducing cell apoptosis was primarily proved, and several related factors (Caspase-3, Caspase-9, Bax, and Bcl-2) were detected and discussed. Caspase-3, Caspase-9, and Bax are well-known enhancing factors, while Bcl-2 is a classical apoptosis inhibitor [35,36,37]. These factors were measured before or after the treatment of furosine to evaluate the role of furosine in regulating downstream apoptosis. Results showed that furosine induced apoptosis of HepG2 cells with a dosage-effect relationship. Furthermore, to investigate the effect of STAT1/STAT2/UBA7/UBE2L6 on apoptosis induced by furosine, SiRNA fragments were transfected into the cells and apoptosis-related factors were detected. We found that after knocking down expressions of STAT1/STAT2/UBA7/UBE2L6, Caspase-3, Caspase-9, and Bax were down-regulated and Bcl-2 was up-regulated significantly in furosine-treated groups, when compared with the control, indicating that STAT1/STAT2/UBA7/UBE2L6 regulated expressions of the downstream apoptosis factors. The above results, for the first time, validated that furosine induced apoptosis through the regulation of STAT1/2 and UBA7/UBE2L6 genes in HepG2 cells.
Considering that furosine could induced the apoptosis of liver cancer cells, its anti-tumor and anti-invasive effects in tumor-bearing animal models deserve our investigation and validation, which will be studied in the near future. Meanwhile, furosine was proved to be toxic to mice liver and kidney samples, so its toxicokinetics indicators and limit standard also deserve more attention and further research.

4. Materials and Methods

4.1. Chemicals

Furosine was purchased from PolyPeptide (Strasbourg, France) with a purity of 95%. HepG2 (liver hepatocellular cells) cell line was purchased from American Type Culture Collection Cells (ATCC, Manassas, VA, USA). Dulbecco’s Modified Eagle Medium (DMEM) and heat-inactivated fetal bovine serum (HI-FBS) were obtained from GIBCO (Waltham, MA, USA). l-glutamine was pruchased from Solarbio (Beijing, China). 1% penicillin/streptomycin was purchased from Thermo Fisher (Waltham, MA, USA). Cell counting kit-8 (CCK-8 kit) was purchased from Dojindo (Kumamoto, Japan). 0.1% (v/v) Triton X-100 and 100 mg/mL RNAase were purchased from Sigma (St. Louis, MO, USA). Triton X-100 staining solution was purchased from Roche (Berlin, Germany). RIPA lysate buffer (including PMSF and proteases) and the BCA detection kit were obtained from Beyotime (Shanghai, China). The TransZol Up Kit was purchased from TransGen Biotech (Beijing, China). Nanodrop 2000 was purchased from Thermo Fisher (Waltham, MA, USA). The High Capacity cDNA Archive Kit, Universal Master Mix, and RNAse-free water were purchased from Applied Biosystems (Foster City, CA, USA). All the primary antibodies and secondary antibodies were purchased from Santa Cruz (Santa Cruz, CA, USA). Protein lysis buffer and reagents related to western blotting were purchased from Solarbio (Beijing, China). Enhanced chemiluminescence (ECL) reagent was purchased from Tanon (Shanghai, China). The Annexin V/PI staining kit for cell apoptosis detection was purchased from Solarbio (Beijing, China).

4.2. Cell Culture and Viability Detection

HepG2 cells were cultured in DMEM containing 10% FBS, 0.9% l-glutamine, and 1% penicillin/streptomycin, in a humidified incubator (Thermo, Waltham, MA, USA) at 37 °C, in the presence of 5% CO2.
Cell viability was measured and analyzed by the CCK-8 kit assay. About 1 × 10⁴ cells per well were planted into 96-well plates and incubated for at least 24 h, and then different concentrations of furosine (the stock solution was 10 g/L, purified water as the solvent) ranging from 0–2000 mg/L in a total volume of 100 μL were added into the wells and cocultured for 48 h. Then, the medium was removed and 100 μL/well CCK-8 (Cell Counting Kit) solution was added into the wells for 4 h. Following this, the optical density (OD) value was detected by a microplate reader (Thermo, Waltham, MA, USA) at the wavelength of 570 nm. The proper dosage for further tests was chosen.

4.3. Transcriptomics Detection and Data Analysis

HepG2 cells were cultured and treated with furosines (100/200 mg/L) for 48 h, and the cells were then gathered. Total RNA was extracted from the samples with the TRIzol™ Reagent (15,596,018, Invitrogen, Carlsbad, CA, USA) according to the manufacturer’s instructions. Extracted total RNA was quantified by Nanodrop2000 (Thermo Fisher Scientific, Waltham, MA, USA) and its quality was detected by the Bioanalyzer 2100 expert_RNA Nano 6000 Assay (Agilent, Santa Clara, CA, USA). mRNA isolation and the strand-specific mRNA-seq library preparation were performed using TruSeq Stranded mRNA Library Prep (20,020,594, Illumina, San Diego, CA, USA), including cDNA transcription, End repairing, A-tailing, and adapter ligation. Amplification was conducted for 15 cycles, followed by quality examination using the Bioanalyzer 2100 expert_High Sensitivity DNA Assay (Agilent) and Qubit™ 3 Fluorometer (Thermo Fisher Scientific). The libraries were then sequenced on the Illumina HiSeq platform (Supplementary Material). The data was exported into Excel spreadsheets by Simca-P for PCA (principle components analysis), PLS-DA (partial least squares discriminant analysis), t-test, and VIP (variable importance in projection) plot analysis (Supplementary Material).

4.4. Cell SiRNA Treatment

Based on primary analysis results in transcriptomics detection of HepG2 cells, combined with the literature survey, STAT1 (signal transducer and activator of transcription 1), STAT2 (signal transducer and activator of transcription 2), UBA7 (ubiquitin-like modifier activating enzyme 7), and UBE2L6 (ubiquitin-conjugating enzyme E2L6) were chosen as the possible targets of furosine. To further validate the interaction between furosine and these factors, we synthesized their SiRNA sequences (genepharma, Shanghai, China). Cells were seeded into six-well plates for 24 h to ensure a 30% intensity. DNA-liposome complex was prepared as follows: (1) transfection reagent (4 μL/well, Santa Cruz) was diluted in 1 mL fresh DMEM; (2) SiRNA segments (4 μg/well) were diluted in 1 mL fresh DMEM; (3) the complexes of (1) and (2) were mixed together and DNA-liposome complex (2 mL per well) was added into the wells and these samples were placed at 37 °C. 24 h later, the DMEM-DNA-lipsome complex was added into DMEM to culture for another 24 h. The step of furosine treatment also started after removing the DMEM-DNA-lipsome complex, and the treatment time was 48 h. Utilizing western blotting detection of the aim proteins, the high-efficiency SiRNA fragments were screened out.

4.5. Quantitative Real-Time PCR (q-PCR) Analysis

The total RNA was extracted from HepG2 cells using a TransZol Up Kit (Transgen, Beijing, China). The quantity and concentration of RNA were evaluated by 1.2% agarose gel electrophoresis and Nanodrop 2000 (Thermofisher, Waltham, MA, USA). The total RNA was transcribed into cDNA using a High Capacity cDNA Archive Kit, according to the manufacturer’s protocol. Primers for STAT1, STAT2, UBA7, UBE2L6, Caspase-3, Bax, Bcl-2, Caspase-9, and GAPDH are listed in Table 1, and GAPDH was chosen as the internal control. Quantitative real-time RT-PCR (qRT-PCR) was performed in 96-well plates in a total volume of 20 μL, containing 10 μL Universal Master Mix, 0.5 μL forward primer (10 μM), 0.5 μL reverse primer (10 μM), 1 μL template cDNA (cDNA, 10–15 ng/μL), and 8 μL RNAse-free water. All qRT-PCR reactions were performed at 94 °C for 30 s, followed by 40 cycles of 94 °C for 5 s, and 63 °C for 30 s, using two-step RT-PCR. All q-PCR reactions were performed on the ABI 7900 HT system, and were conducted in triplicate to ensure methodological reproducibility.

4.6. Western Blot Analysis

Total proteins of the cells (1 × 10⁶ cells per well) were extracted by lysis buffer containing protease inhibitors, and the sample was then centrifuged (4 °C, 12,000× g) for 5 min. With catalysis and heat treatment at 98 °C, the samples were loaded onto 12% SDS-polyacrylamide gels for electrophoresis and then transferred onto nitrocellulose filters by Trans-Blot machines (BioRad, Hercules, CA, USA). The filters were blocked with 2% BSA dissolved in TBST buffer for 2 h at room temperature. Then, the proteins were probed with the primary antibodies for 2 h at 25 °C, including β-actin, STAT1, STAT2, P-STAT1, P-STAT2, UBA7, UBE2L6, Caspase-3, Bax, Bcl-2, and Caspase-9. β-actin was regarded as the internal reference to promise equal loading. After the membranes were washed with PBST (phosphate buffered solution) buffer (10 min × 3), they were incubated with secondary antibodies for 2 h at room temperature and then washed (15 min × 3). Finally, the proteins were detected utilizing an ECL reagent (Millipore, Burlington, MA, USA) and analyzed by Image J software (Rawak Software, Inc., Stuttgart, Germany).

4.7. Immunofluorescence Cell Staining

For immunofluorescence cell staining, HepG2 cells were seeded into the six-well plates (10% intensity). The cells were treated with furosine, and were then fixed, permeated with icy methanol for 20 min, washed thrice (15 min in total) with PBS, and blocked with 10% goat serum for 30 min. Primary antibody (1:250, Santa Cruz, CA, USA) was added and incubated for 1 h, and washed thrice (15 min in total) with PBS. Then, the cells were incubated for 30 min with the secondary antibodies (FITC-labelled, 1:500, Santa Cruz, CA, USA) and washed three times (5 min × 3). The nucleus was stained with PI (5 mg/mL as the final concentration, Sigma) for 15 min and washed (10 min × 3); the locations of β-actin, STAT1, STAT2, UBA7, and UBE2L6 factors were scanned utilizing confocal microscopy (Zeiss, Oberkochen, Germany).

4.8. Cell Apoptosis Detection

After furosine treatment, cells were gathered and washed with PBS buffer, and were suspended in 200 μL binding buffer. The cell sample was incubated with 10 μL FITC-annexin V buffer and 20 μL PI buffer (10 mg/mL), then gently mixed together and incubated for 10 min at 25 °C in the dark. A total of 400 μL binding buffer was added into the cell samples and the samples were measured with flow cytometry immediately. Cells stained with annexin V−/PI+ stand for necrotic cells, annexin V+/PI+ cells stand for late apoptotic cells, and annexin V+/PI− cells stand for early apoptotic ones.

4.9. Statistical Analysis

All the data was represented as Mean ± SD. Data analysis was performed using GraphPad Prism 6.0 software (GraphPad, San Diego, CA, USA). Statistical analysis was conducted using the Student’s t-test and One-Way Aanalysis of variance (ANOVA). In the experiments of cell viability, q-PCR, and western blotting, p value < 0.05 was considered to indicate a statistically significant difference between the control and furosine-treated groups.

Supplementary Materials

Supplementary materials can be found at https://0-www-mdpi-com.brum.beds.ac.uk/1422-0067/19/6/1629/s1.

Author Contributions

H.L. designed research plan and wrote the paper; L.X. constructed the mice model; N.Z. prepared the cell samples and finished experiments in vitro; J.W. and N.Z. revised the paper.

Funding

This work was supported by Special Fund for Agro-scientific Research in the public Interest (201403071), the Ministry of Modern Agro-Industry Technology Research System of China (CARS-36), and the Agricultural Science and Technology Innovation Program (ASTIP-IAS12).

Acknowledgments

We thank two Agriculture-Key Labs, the Ministry of Agriculture-Key Laboratory of Quality & Safety Control for Milk and Dairy Products, Institute of Animal Science, Ministry of Agriculture-Laboratory of Quality and Safety Risk Assessment for Dairy Products, China, for financial support. The author specially thanks Beijing Qiji Biotechnology Co., Ltd., for scientists from the company provided this paper’s authors with omics detections and high-level data analysis.

Conflicts of Interest

The authors declare no conflict of interest.

Abbreviations

HepG2liver hepatocellular cells
STAT1signal transducer and activator of transcription 1
STAT2signal transducer and activator of transcription 2
UBA7ubiquitin-like modifier activating enzyme 7
UBE2L6ubiquitin-conjugating enzyme E2L6

References

  1. Henle, T. Protein-bound advanced glycation endproducts (AGEs) as bioactive amino acid derivatives in foods. Amino Acids 2005, 29, 313–322. [Google Scholar] [CrossRef] [PubMed]
  2. Ledl, F.; Schleicher, E. New aspects of the Maillard reaction in foods and in the human body. Angew. Chem. Int. Ed. Engl. 1990, 29, 565–594. [Google Scholar] [CrossRef]
  3. Radamendoza, M.; Olano, A.; Villamiel, M. Furosine as indicator of Maillard reaction in jams and fruit-based infant foods. J. Agric. Food Chem. 2002, 50, 4141–4145. [Google Scholar] [CrossRef]
  4. Rajchl, A.; Cizkova, H.; Voldrich, M.; Jiruskova, M.; Sevcik, R. Evaluation of shelf life and heat treatment of tomato products. Czech. J. Food Sci. 2009, 27, 130–133. [Google Scholar] [CrossRef]
  5. Villamiel, M.; Castillo, M.D.; Corzo, N.; Olano, A. Presence of furosine in honeys. J. Sci. Food Agric. 2001, 81, 790–793. [Google Scholar] [CrossRef]
  6. Seiquer, I.; Diaz-Alguacil, J.; Delgado-Andrade, C.; Lopez-Frias, M.; Munoz Hoyos, A.; Galdo, G.; Navarro, M.P. Diets rich in Maillard reaction products affect protein digestibility in adolescent males aged 11–14. Am. J. Clin. Nutr. 2006, 83, 1082–1088. [Google Scholar] [CrossRef] [PubMed]
  7. Troise, A.D.; Fiore, A.; Wiltafsky, M.; Fogliano, V. Quantification of N-epsilon (2-Furoylmethyl)-l-lysine (furosine), Nepsilon-(Carboxymethyl)-l-lysine (CML), N-epsilon-(Carboxyethyl)-l-lysine (CEL) and total lysine through stable isotope dilution assay and tandem mass spectrometry. Food Chem. 2015, 188, 357–364. [Google Scholar] [CrossRef] [PubMed]
  8. Li, H.Y.; Xing, L.; Wang, J.Q.; Zheng, N. Toxicology studies of furosine in vitro/in vivo and exploration of the related mechanism. Toxicol. Lett. 2018, 291, 101–111. [Google Scholar] [CrossRef] [PubMed]
  9. Baris, S.; Alroqi, F.; Kiykim, A.; Karakoc-Aydiner, E.; Ogulur, I.; Ozen, A.; Charbonnier, L.M.; Bakır, M.; Boztug, K.; Chatila, T.A.; et al. Severe Early-Onset Combined Immunodeficiency due to Heterozygous Gain-of-Function Mutations in STAT1. J. Clin. Immunol. 2016, 36, 641–648. [Google Scholar] [CrossRef] [PubMed]
  10. Kaur, T.; Mukherjea, D.; Sheehan, K.; Jajoo, S.; Rybak, L.P.; Ramkumar, V. Short interfering RNA against STAT1 attenuates cisplatin-induced ototoxicity in the rat by suppressing inflammation. Cell Death Dis. 2011, 2, e180. [Google Scholar] [CrossRef] [PubMed]
  11. Yoo, S.H.; Park, O.; Henderson, L.E.; Abdelmegeed, M.A.; Moon, K.H.; Song, B.J. Lack of PPARα exacerbates lipopolysaccharide-induced liver toxicity through STAT1 inflammatory signaling and increased oxidative/nitrosative stress. Toxicol. Lett. 2011, 202, 23–29. [Google Scholar] [CrossRef] [PubMed]
  12. Xu, Y.; Feng, D.; Wang, Y.; Lin, S.; Xu, L. Sodium tanshinone IIA sulfonate protects mice from ConA-induced hepatitis via inhibiting NF-κB and IFN-γ/STAT1 pathways. J. Clin. Immunol. 2008, 28, 512–519. [Google Scholar] [CrossRef] [PubMed]
  13. Moore, F.; Naamane, N.; Colli, M.L.; Bouckenooghe, T.; Ortis, F.; Gurzov, E.N.; Igoillo-Esteve, M.; Mathieu, C.; Bontempi, G.; Thykjaer, T.; et al. STAT1 is a master regulator of pancreatic β-cell apoptosis and islet inflammation. J. Biol. Chem. 2011, 286, 929–941. [Google Scholar] [CrossRef] [PubMed]
  14. Zhu, S.; Waguespack, M.; Barker, S.A.; Li, S. Doxorubicin directs the accumulation of interleukin-12 induced IFN γ into tumors for enhancing STAT1 dependent antitumor effect. Clin. Cancer Res. 2007, 13, 4252–4260. [Google Scholar] [CrossRef] [PubMed]
  15. Alazawi, W.; Heath, H.; Petts, G.; Kudu, H.; Feakins, R.; O’Brien, A.; Goldin, R.; Foster, G.R. PTH-102 Stat2 is a key inflammatory molecule in human non-alcoholic fatty liver disease and murine liver injury. Gut 2015, 64, A452–A453. [Google Scholar] [CrossRef]
  16. Lee, J.W.; Kang, H.S.; Lee, J.Y.; Lee, E.J.; Rhim, H.; Yoon, J.H.; Seo, S.R.; Chung, C.K. The transcription factor STAT2 enhances proteasomal degradation of RCAN1 through the ubiquitin E3 ligase FBW7. Biochem. Biophys. Res. Commun. 2012, 420, 404–410. [Google Scholar] [CrossRef] [PubMed]
  17. Tripathi, M.K.; Chaudhuri, G. Down-regulation of UCRP and UBE2L6 in BRCA2 knocked-down human breast cells. Biochem. Biophys. Res. Commun. 2005, 328, 43–48. [Google Scholar] [CrossRef] [PubMed]
  18. Hoyo-Becerra, C.; Liu, Z.; Yao, J.; Kaltwasser, B.; Gerken, G.; Hermann, D.M.; Schlaak, J.F. Rapid regulation of depression-associated genes in a new mouse model mimicking interferon-α-related depression in hepatitis C virus infection. Mol. Neurobiol. 2014, 52, 1–12. [Google Scholar] [CrossRef] [PubMed]
  19. Borsini, A.; Cattaneo, A.; Malpighi, C.; Thuret, S.; Harrison, N.A.; Zunszain, P.A.; Pariante, C.M. Interferon-alpha reduces human hippocampal neurogenesis and increases apoptosis via activation of distinct STAT1-dependent mechanisms. Int. J. Neuropsychopharmacol. 2017, 21, 187–200. [Google Scholar] [CrossRef] [PubMed]
  20. Zhang, Q.; Qiao, L.; Wang, X.C.; Ding, J.; Chen, J. UHRF1 epigenetically down-regulates UbcH8 to inhibit apoptosis in cervical cancer cells. Cell Cycle 2018, 31, 1–9. [Google Scholar] [CrossRef] [PubMed]
  21. Zhou, X.; Wei, J.; Chen, F.; Xiao, X.; Huang, T. Epigenetic downregulation of the ISG15–conjugating enzyme UbcH8 impairs lipolysis and correlates with poor prognosis in nasopharyngeal carcinoma. Oncotarget 2015, 6, 41077–41091. [Google Scholar] [CrossRef] [PubMed]
  22. Zhou, M.J.; Chen, F.Z.; Chen, C.H.; Wan, X.X.; Zhou, X.; Fang, Q.; Zhang, D.Z. ISG15 inhibits cancer cell growth and promotes apoptosis. Int. J. Mol. Med. 2017, 39, 446–452. [Google Scholar] [CrossRef] [PubMed]
  23. Salla, R.; Tuija, H.K.; Anne, P.; Sarhadi, V.K.; Jaakko, H.; Sakari, K.; Juha, S.; Harriet, W.; Sisko, A. Pathways affected by asbestos exposure in normal and tumour tissue of lung cancer patients. BMC Med. Genom. 2008, 1, 55. [Google Scholar]
  24. Klimmeck, D.; Hansson, J.; Raffel, S.; Vakhrushe, S.Y.; Trumpp, A.; Krijgsveld, J. Proteomic cornerstones of hematopoietic stem cell differentiation: Distinct signatures of multipotent progenitors and myeloid committed cells. Mol. Cell. Proteom. 2012, 11, 286–302. [Google Scholar] [CrossRef] [PubMed]
  25. Chen, X.D.; Wu, K.H.; Lu, S.; Xiong, J.L.; Tan, L.J. UBE2L6 expression is highly correlated with an osteoporotic candidate gene STAT-1. Osteoporos. Int. 2013, 24, 566–567. [Google Scholar]
  26. Mittal, M.K.; Chaudhuri, G. Requirement of functionally active BRCA2 protein for the expression of IRF9-regulated genes in human breast cells. Cancer Res. 2009, 69, A16. [Google Scholar] [CrossRef]
  27. Przanowski, P.; Loska, S.; Cysewski, D.; Dabrowski, M.; Kaminska, B. ISG’ylation increases stability of numerous proteins including Stat1, which prevents premature termination of immune response in LPS-stimulated microglia. Neurochem. Int. 2018, 112, 227–233. [Google Scholar] [CrossRef] [PubMed]
  28. Stefan, M.; Wei, C.; Lombardi, A.; Li, C.W.; Concepcion, E.S. Genetic epigenetic dysregulation of thymic TSH receptor gene expression triggers thyroid autoimmunity. Proc. Natl. Acad. Sci. USA 2014, 111, 12562–12567. [Google Scholar] [CrossRef] [PubMed]
  29. Sobh, A.; Chou, J.; Schneider, L.; Geha, R.S.; Massaad, M.J. Chronic mucocutaneous candidiasis associated with an SH2 domain gain-of-function mutation that enhances STAT1 phosphorylation. Allergy Clin. Immun. 2016, 138, 297–299. [Google Scholar] [CrossRef] [PubMed]
  30. Wang, C.; Sun, M.; Yuan, X.; Ji, L.; Jin, Y. Enterovirus 71 suppresses interferon responses by blocking Janus kinase (JAK)/signal transducer and activator of transcription (STAT) signaling through inducing karyopherin-α1 degradation. J. Biol. Chem. 2017, 292, 10262–10274. [Google Scholar] [CrossRef] [PubMed]
  31. Sdnk, B.; Umasuthan, N.; Priyathilaka, T.T.; Thulasitha, W.S.; Jdhe, J. Molecular cloning, transcriptional profiling, and subcellular localization of signal transducer and activator of transcription 2 (STAT2) ortholog from rock bream, Oplegnathus fasciatus. Gene 2017, 626, 95–105. [Google Scholar]
  32. Cohen, P.; Tcherpakov, M. Will the ubiquitin system furnish as many drug targets as protein kinases. Cell 2010, 143, 686–693. [Google Scholar] [CrossRef] [PubMed]
  33. Salajegheh, M.; Kong, S.W.; Pinkus, J.L. Interferon-stimulated gene 15 (ISG15) cnjugates proteins in dermatomyositis muscle with perifascicular atrophy. Ann. Neurol. 2010, 67, 53–63. [Google Scholar] [CrossRef] [PubMed]
  34. Moudry, P.; Lukas, C.; Macurek, L.; Hanzlikova, H.; Hodny, Z.; Lukas, J.; Bartek, J. Ubiquitin. Cell Cycle 2012, 11, 1573–1582. [Google Scholar] [CrossRef] [PubMed]
  35. Mitupatum, T.; Aree, K.; Kittisenachai, K.S.; Roytrakul, S.; Puthong, S.; Kangsadalampai, S.; Rojpibulstit, P. mRNA Expression of Bax, Bcl-2, p53, Cathepsin B, Caspase-3 and Caspase-9 in the HepG2 cell line following induction by a novel monoclonal Ab Hep88 mAb: Cross-Talk for paraptosis and apoptosis. Asian Pac. J. Cancer Prev. 2016, 2, 703–712. [Google Scholar] [CrossRef]
  36. Wu, R.; Tang, S.; Wang, M.; Xu, X.; Yao, C.; Wang, S.M. MicroRNA-497 induces apoptosis and suppresses proliferation via the Bcl-2/Bax-Caspase9-Caspase3 pathway and cyclin D2 protein in HUVECs. PLoS ONE 2016, 11, e0167052. [Google Scholar] [CrossRef] [PubMed]
  37. Liang, S.; Sun, K.; Wang, Y.; Dong, S.; Wang, C.; Liu, L.; Wu, Y. Role of Cyt-C/caspases-9,3, Bax/Bcl-2 and the FAS death receptor pathway in apoptosis induced by zinc oxide nanoparticles in human aortic endothelial cells and the protective effect by alpha-lipoic acid. Chem. Biol. Interact. 2016, 258, 40–51. [Google Scholar] [CrossRef] [PubMed]
Figure 1. HepG2 cell viability and transcriptomics detection. (A) Furosine inhibited cell survival rate with a dose-effect relationship. The data was represented as mean ± SD (standard deviation), * p < 0.05, compared with the control (n = 8); (B) Overlapping of selected genes with changed expressions in control, 100 mg/L group, and 200 mg/L group, through cell transcriptomics detection (n = 3); (C) Heatmap of 12 special genes.
Ijms 19 01629 g001aIjms 19 01629 g001b
Figure 2. Translocation detection of four factors in HepG2 cells treated by furosine (100 mg/L) by confocal. (A) STAT1 in cell; (B) STAT2 in cell; (C) UBA7 in cell; (D) UBE2L6 in cell. Green light stands for proteins of interest in the cell, and red light stands for the nucleus. The pictures were captured at 100× magnification.
Ijms 19 01629 g002
Figure 3. mRNA level and protein level of STAT1/2, P-STAT1/2, UBA7, UBE2L6, Caspase-3, Bcl-2, Bax, and Caspase-9 affected by furosine. (A) Furosine up-regulated expressions of STAT1/2, P-STAT1/2, UBA7, and UBE2L6 at protein level; (B) Furosine up-regulated expressions of STAT1/2, UBA7, and UBE2L6 at mRNA level; (C) Furosine up-regulated expressions of Caspase-3/9, Bax, and Bcl-2 at protein level; (D) Selection of high-efficient SiRNA fragment in HepG2 cells. Blue circle stands for the high-effeciency SiRNA fragments of each factor which would be chosen and utilized in Figure 4 and Figure 5; (E) Furosine up-regulated expressions of Caspase-3/9, Bax, and Bcl-2 at mRNA level. The values of biochemical indicators were represented as mean ± SD, * p < 0.05, compared with the control (n = 3).
Ijms 19 01629 g003
Figure 4. The effect of furosine on cell apoptosis by annexin V/PI staining. Control stood for cells without any treatment; NC stood for cells treated with control SiRNA; single staining group stood for cells stained with annexin-FITC; Si stood for SiRNA of the aimed factor. All the data were represented as mean ± SD, * p < 0.05, compared with the control. # p < 0.05, compared with the furosine treatment group (n = 3).
Ijms 19 01629 g004
Figure 5. Proteins expression of STAT1/2, UBA7, UBE2L6, Caspase-3, Bcl-2, Bax, and Caspase-9 treated with of SiRNA and furosine. The values of biochemical indicators were represented as mean. C stands for control, and NC stands for group treated with control SiRNA.
Ijms 19 01629 g005
Table 1. Primers of the genes in q-PCR detection.
Gene NamePrimer Sequences (5′ → 3′)
Forward PrimerReverse Primer
STAT1GCTGCTGCTCCACAAGATGTTTCTGCTGCCTTCGCTTCCA
STAT2TGGCAGTGACAGAGGAGTTACACAGGCAATGGAGAGTTGGTTCA
UBA7TCCAGAAGATGAGACGCTCCTTAGCAACAGTCACACCTCCATTC
UBE2L6GGAAGCCTTACACCAAGCCTTAGAGTCAGGAGGTCAGCAAGTTC
Caspase-3TGGAGGCTGACTTCCTGTATGCTTCCGTTGCCACCTTCCTGTTA
BaxCCAGGATGCGTCCACCAAGAGAAGTCCAGTGTCCAGCCCAT
Bcl-2GCATCTTCTCCTTCCAGCCTGATCTGCGAAGTCACGACGGTAG
Caspase-9TGAATGACCACCTAGAGCCTTGAGAACCACACCAGCCACAGT
GAPDHCGTCCCGTAGACAAAATGGTTTGATGGCAACAATCTCCAC

