Characterization of Histone Deacetylase Expression Within In Vitro and In Vivo Bladder Cancer Model Systems

Abstract
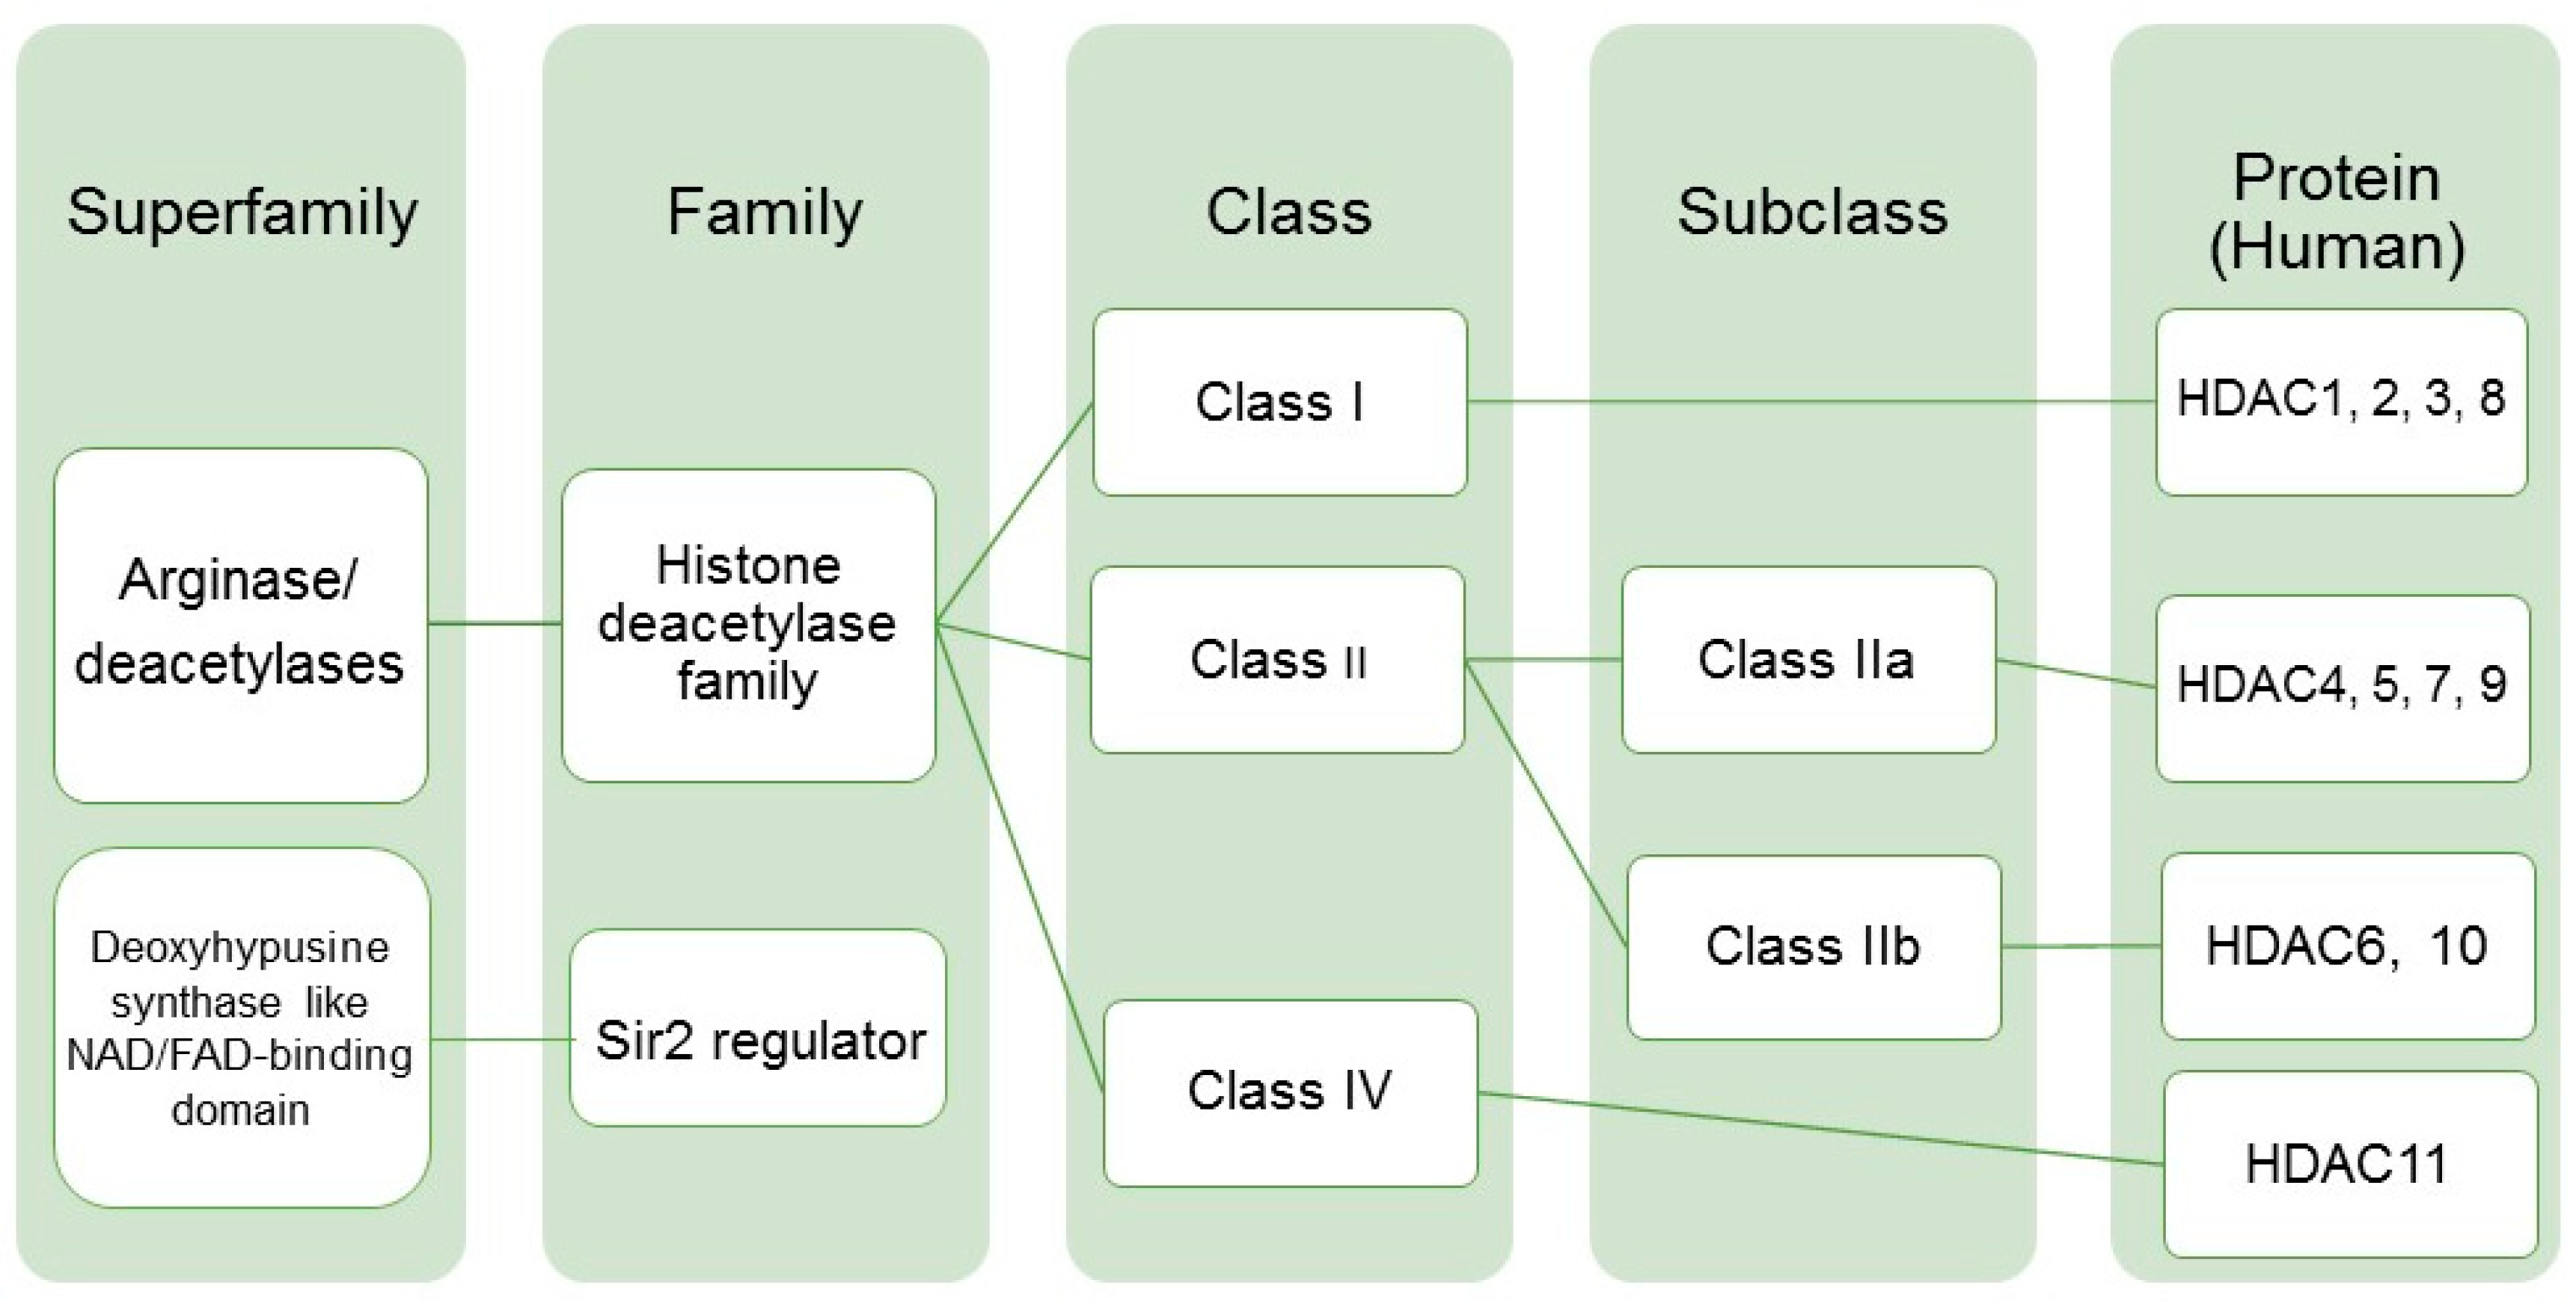
:1. Introduction
2. Results
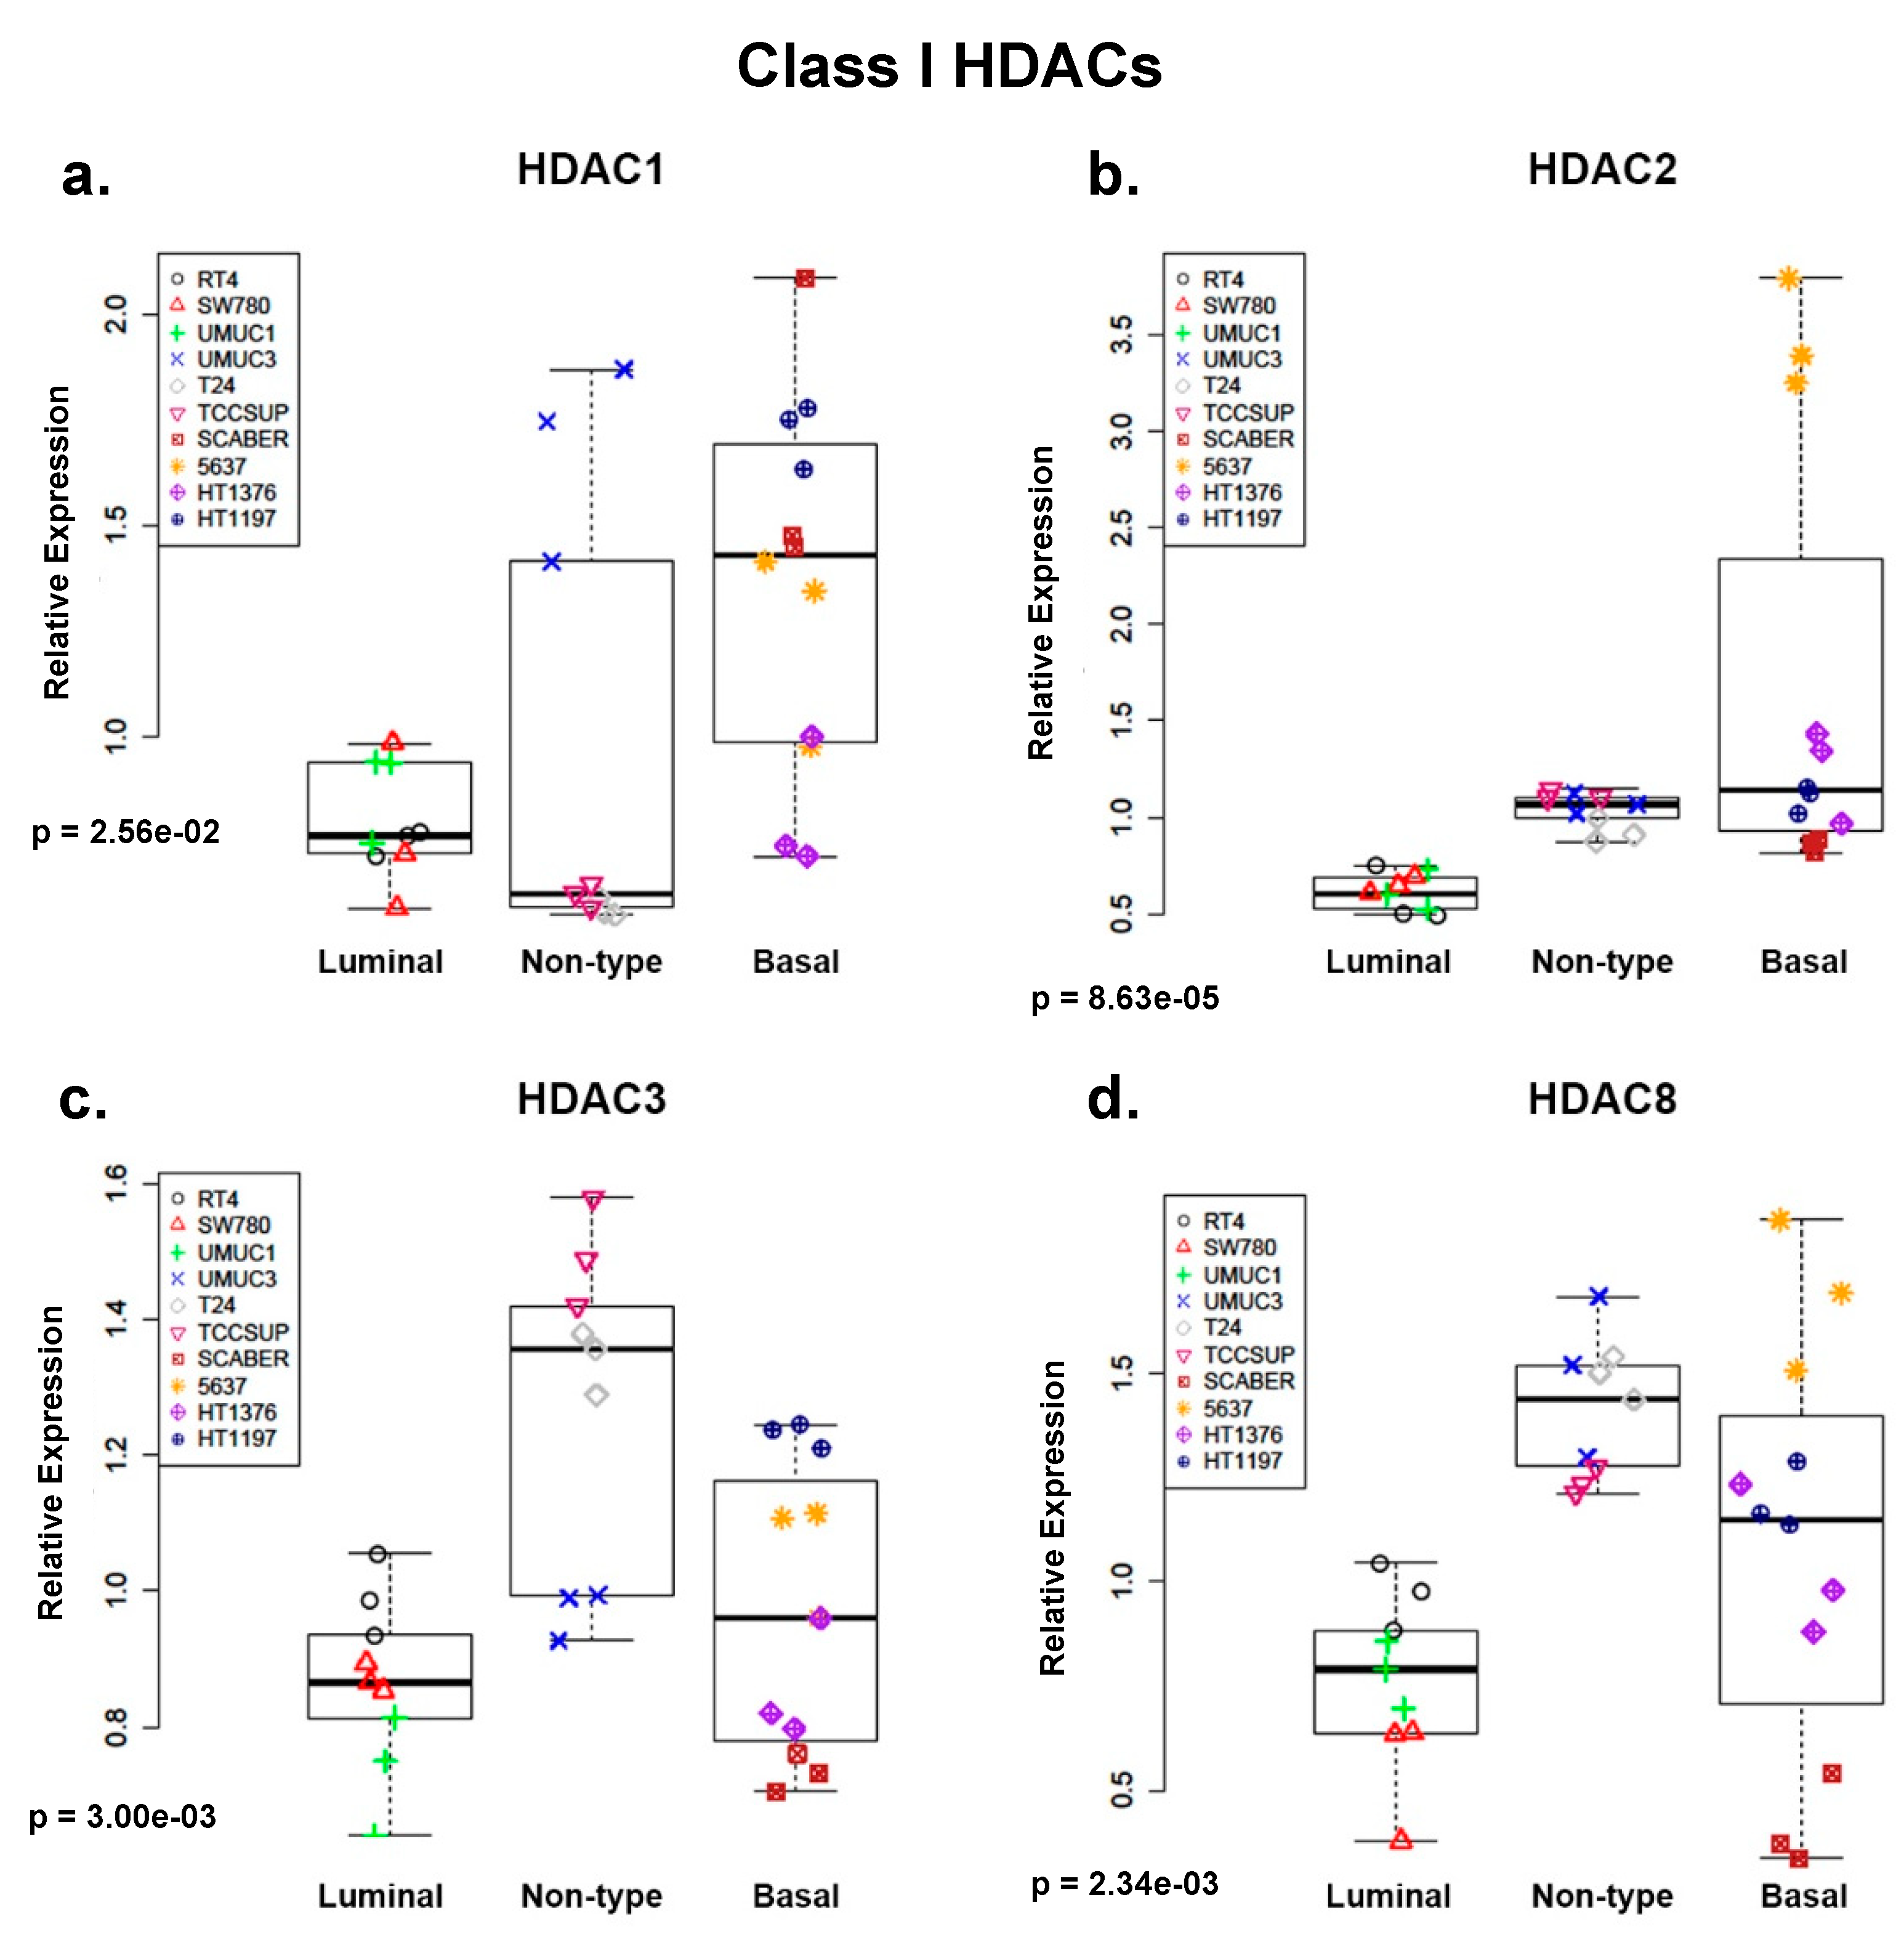
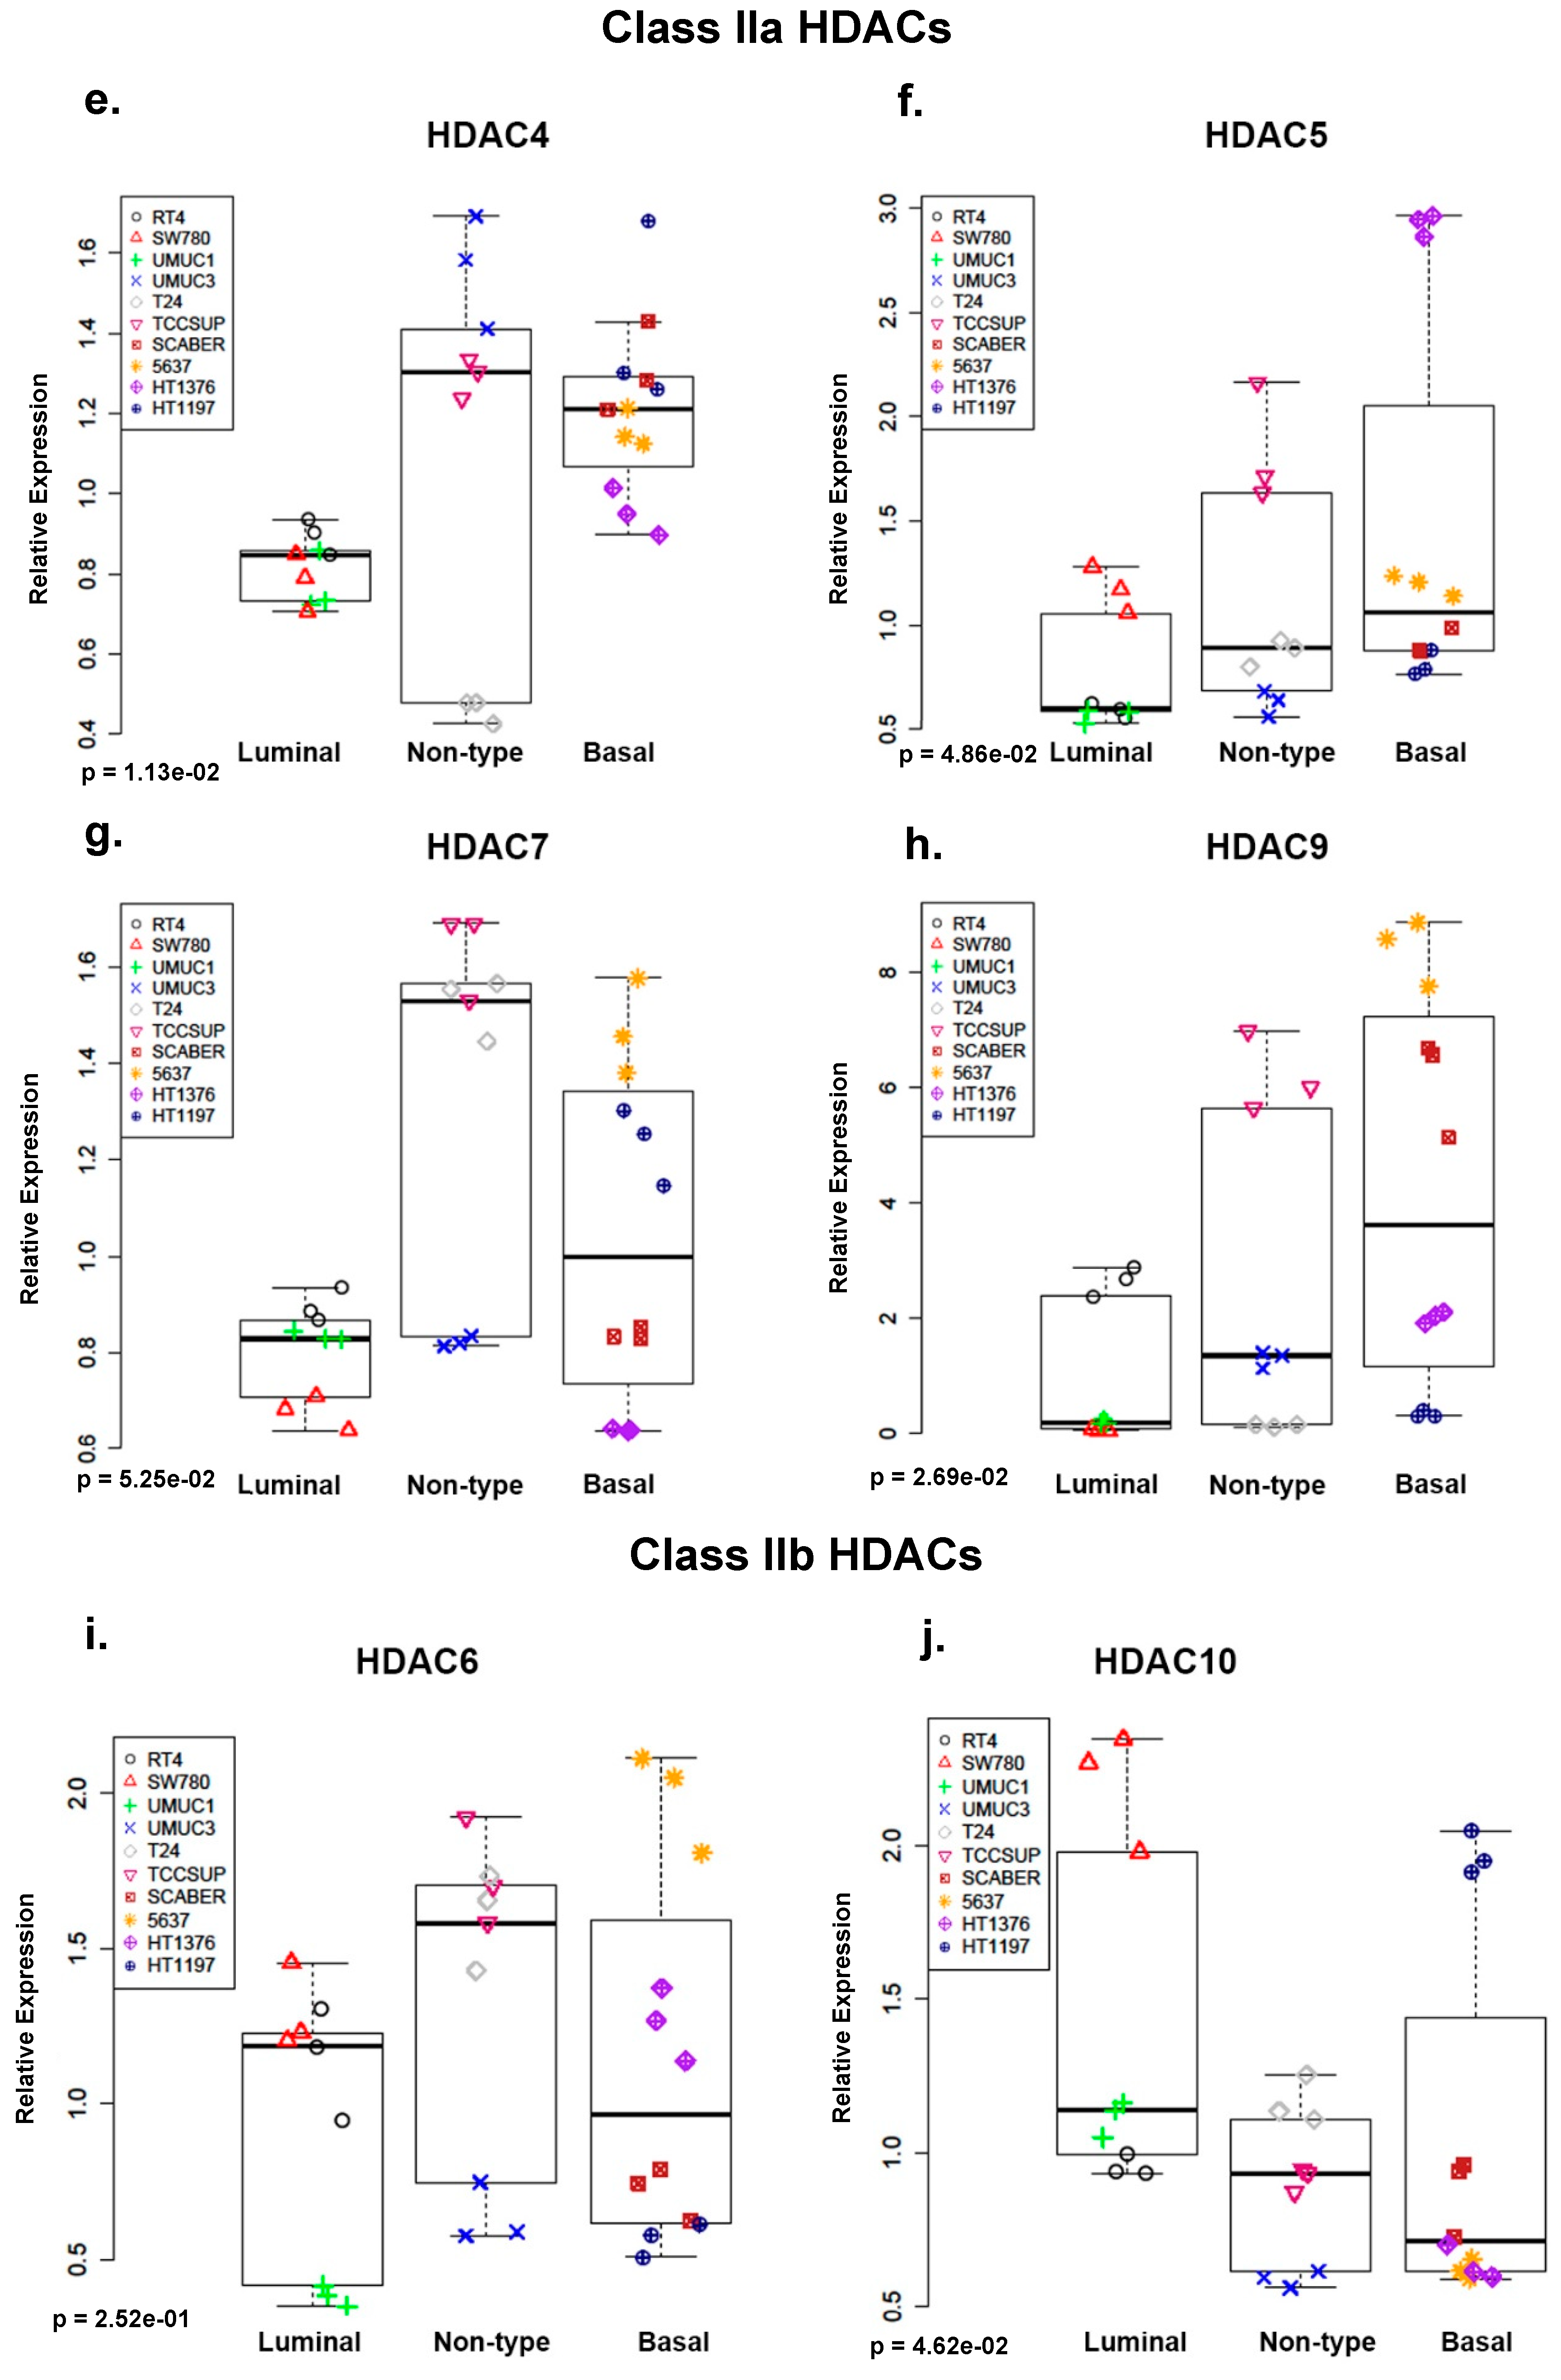
2.1. Class I and Class IIa Histone Deacetylases (HDACs) Are Overexpressed in Non-Type and Basal Human Bladder Cancer (BC) Cell Lines at the mRNA Level
2.2. Histone Deacetylase 9 (DAC9) Is Expressed Primarily in Bladder Cancer (BC) Cell Lines with Non-Type and Basal Molecular Subtypes at the Protein Level
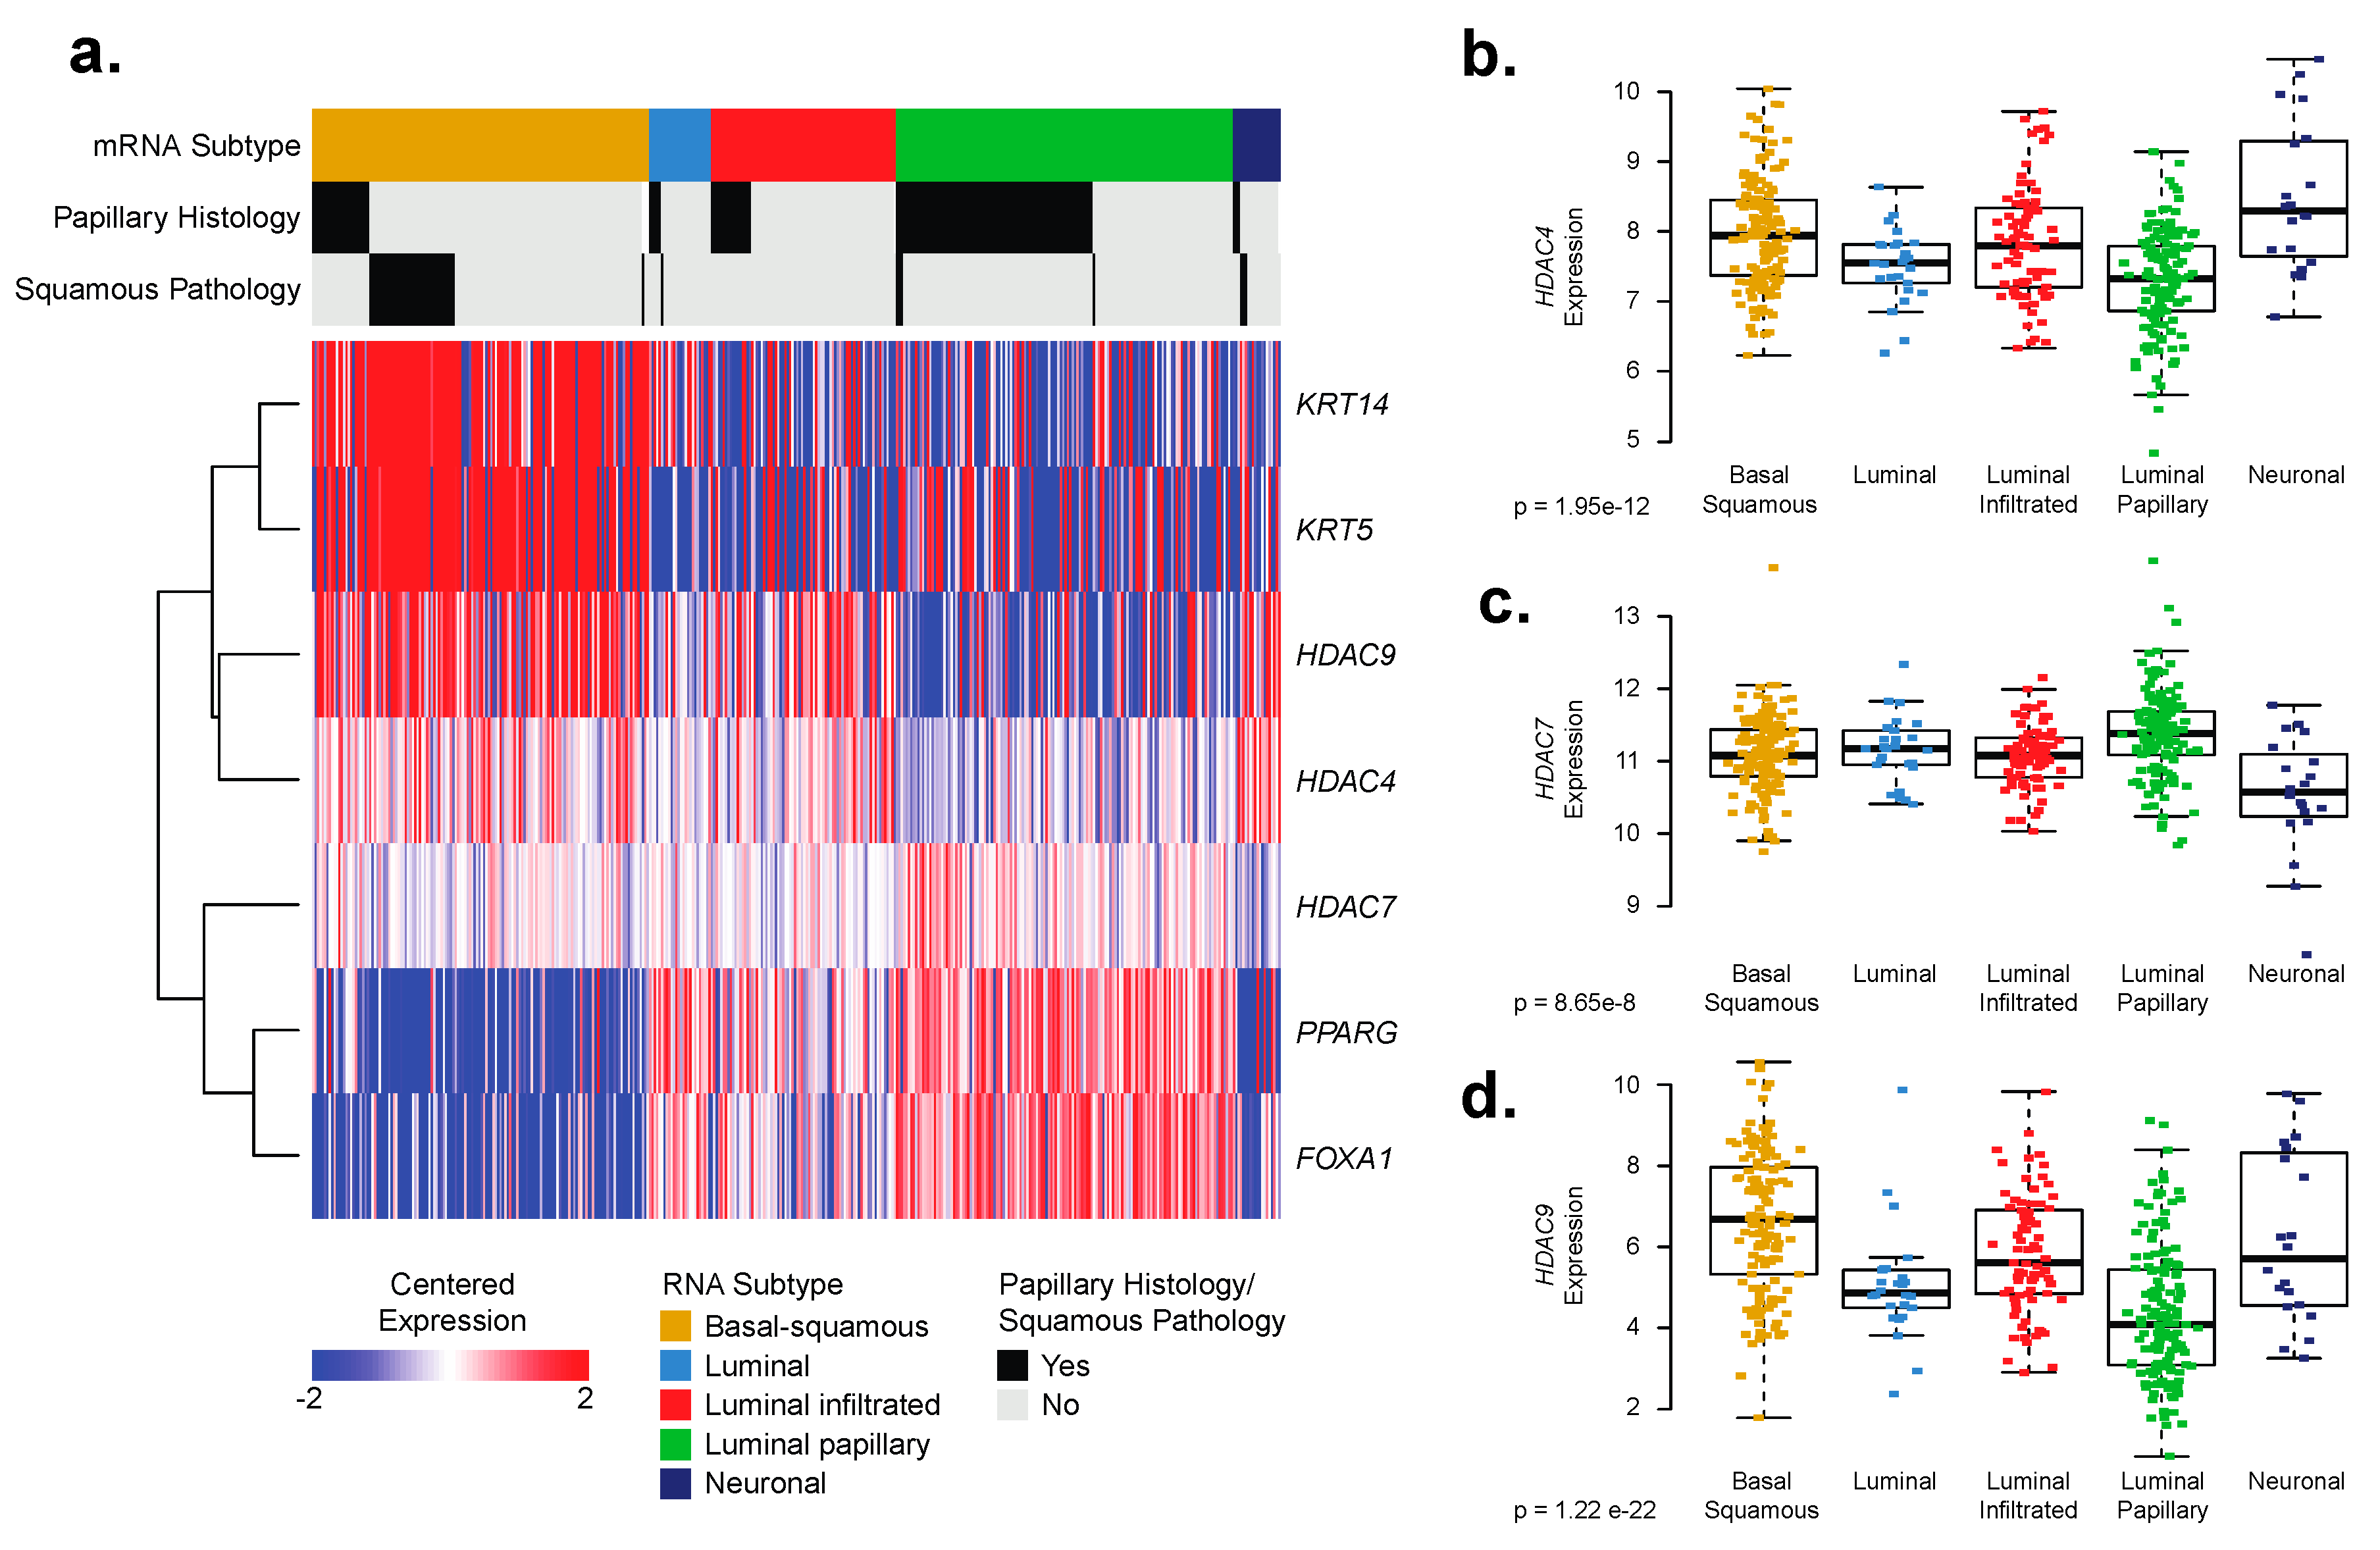
2.3. Basal–Squamous Bladder Cancer (BC) Clinical Samples Are Enriched for Histone Deacetylase (HDAC)4 and HDAC9 Expression
2.4. Bladder Cancer (BC) Driver Genes Correlate with Expression of Histone Deacetylases (HDACs)
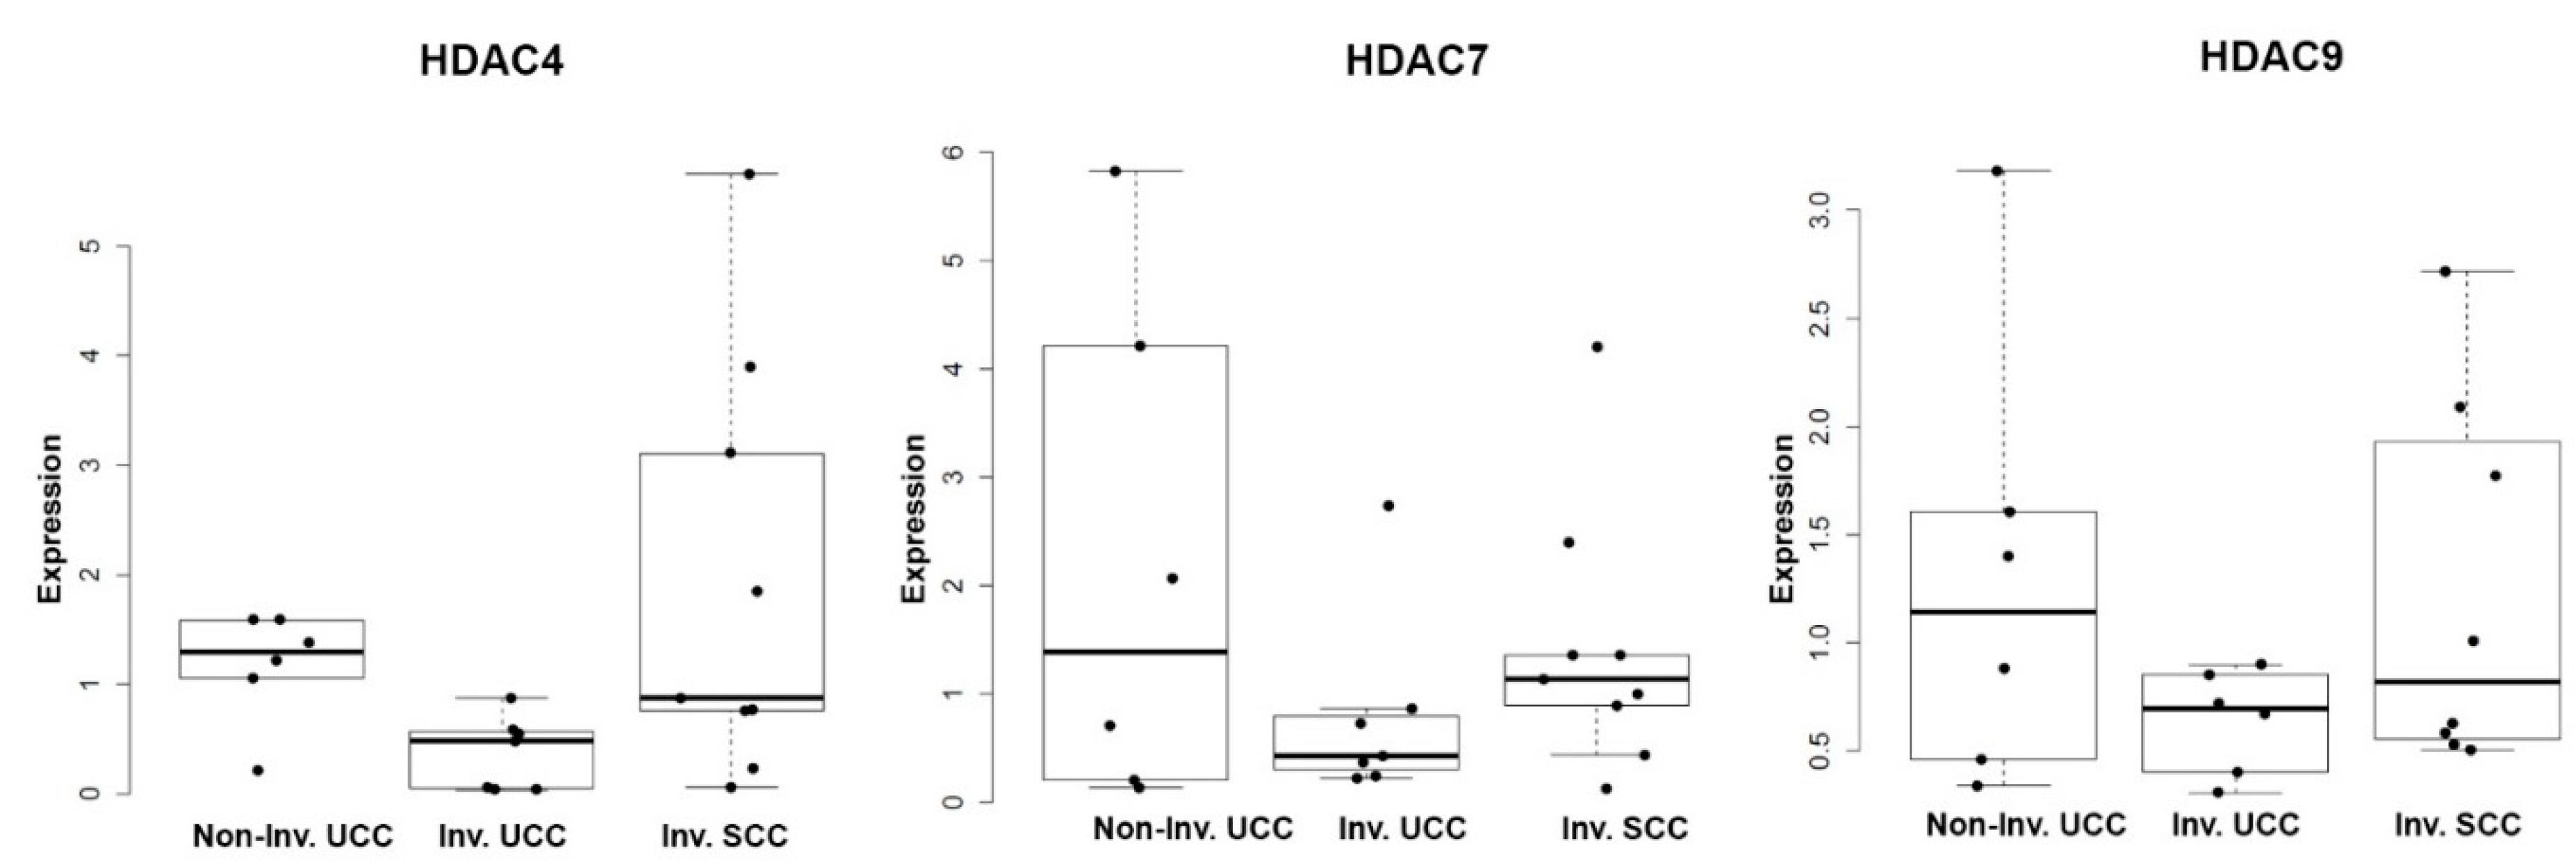
2.5. Histone Deacetylases (DACs) Exhibit Tumor Stage and Morphology-Specific Expression Patterns in Human Bladder Cancer (BC) Samples
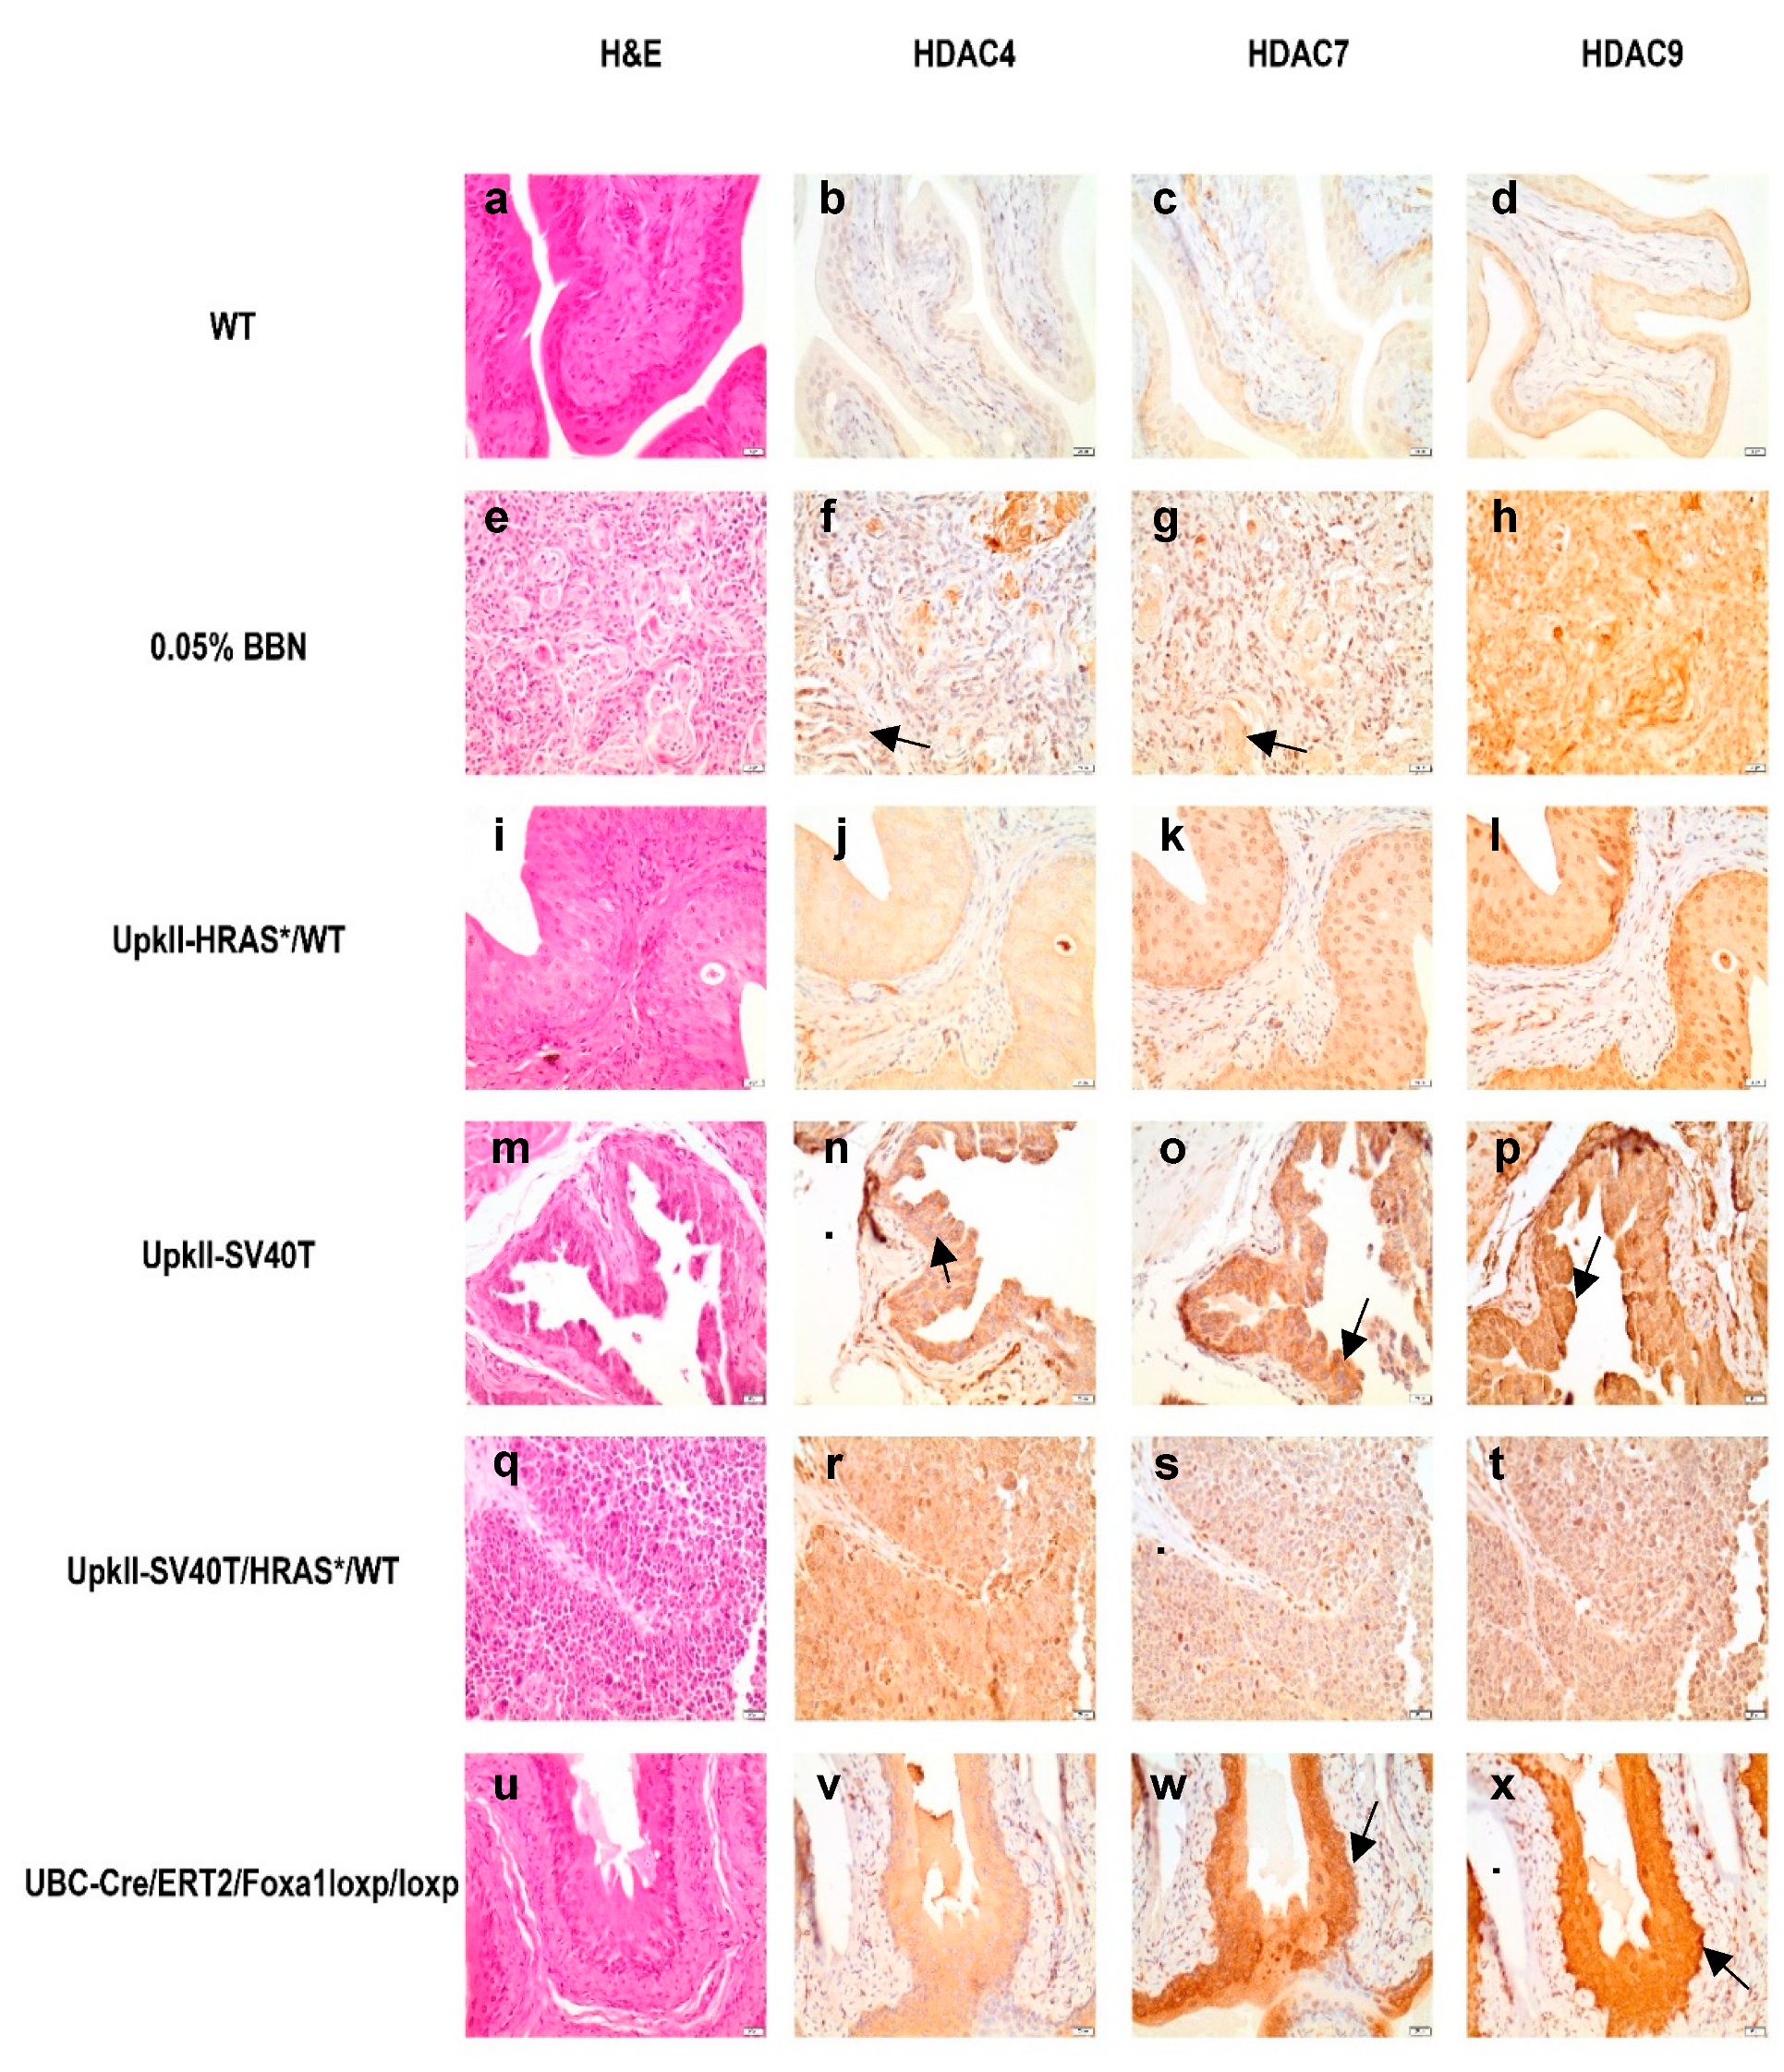
2.6. Class IIa Histone Deacetylase (HDAC) Expression and Localization Are Altered in Commonly Used Bladder Cancer (BC) Mouse Models
3. Discussion
4. Materials and Methods
4.1. Cell Culture
4.2. Western Blotting
4.3. RNA Extraction and Quantitative Real Time Polymerase Chain Reaction (Q-RT-PCR)
4.4. Statistical Analysis
4.5. Immunohistochemistry
Author Contributions
Funding
Acknowledgments
Conflicts of Interest
Abbreviations
| BC | Bladder Cancer |
| HDAC | Histone deacetylase |
| TCGA | The Cancer Genome Atlas |
| SqD | Squamous differentiation |
Appendix A

| HDAC | TP53 | RB1 | FOXA1 | ATM | EGFR | FGFR3 | CDKN2A | ARID1A | PTEN | PIK3CA |
|---|---|---|---|---|---|---|---|---|---|---|
| HDAC1 | 0.1624 | 0.02996 | 0.4039 | −0.127 | −0.1595 | 0.3441 | −0.1003 | 0.3251 | −0.1595 | −0.05632 |
| HDAC2 | 0.2164 | −0.02874 | 0.1617 | −0.0687 | −0.1048 | 0.07189 | 0.008594 | 0.1749 | −0.1528 | 0.05724 |
| HDAC3 | 0.03379 | −0.02488 | −0.1877 | −0.1393 | 0.002187 | −0.0004484 | −0.02018 | −0.178 | 0.01519 | −0.02707 |
| HDAC4 | −0.02602 | 0.105 | −0.2993 | 0.2819 | 0.2459 | −0.18 | −0.008325 | 0.001288 | 0.1057 | 0.2742 |
| HDAC5 | 0.0405 | −0.3184 | −0.2667 | −0.02262 | −0.06405 | −0.2479 | 0.2605 | −0.08976 | −0.0749 | −0.03048 |
| HDAC6 | 0.1206 | −0.215 | 0.258 | 0.08062 | −0.1804 | 0.1051 | 0.1652 | 0.2128 | −0.2522 | −0.04342 |
| HDAC7 | 0.1337 | −0.05924 | 0.1303 | 0.01031 | −0.2497 | 0.1578 | −0.09243 | −0.04465 | −0.03465 | −0.2807 |
| HDAC8 | −0.02261 | −0.2274 | 0.08146 | −0.2085 | −0.2769 | 0.02707 | 0.1442 | −0.09856 | −0.1915 | −0.1553 |
| HDAC9 | −0.157 | 0.02283 | −0.3666 | 0.1594 | 0.1935 | −0.4092 | 0.2044 | −0.1787 | 0.1525 | 0.2269 |
| HDAC10 | 0.09979 | 0.1543 | 0.3525 | −0.03751 | −0.3128 | 0.4304 | −0.3988 | −0.07686 | −0.09097 | −0.3866 |
| HDAC11 | 0.04096 | −0.07616 | 0.2241 | −0.1387 | −0.2152 | 0.2309 | −0.08684 | −0.05148 | −0.1342 | −0.2882 |
| HDAC | TP53 | RB1 | FOXA1 | ATM | EGFR | FGFR3 | CDKN2A | ARID1A | PTEN | PIK3CA |
|---|---|---|---|---|---|---|---|---|---|---|
| HDAC1 | 0.00252 | 0.6389 | 5.31 × 10⁻¹⁶ | 0.01857 | 0.002858 | 1.65 × 10⁻¹¹ | 0.0703 | 2.69 × 10⁻¹⁰ | 0.002858 | 0.3356 |
| HDAC2 | 4.12 × 10⁻⁵ | 0.6514 | 0.002564 | 0.2282 | 0.05715 | 0.2048 | 0.8911 | 0.00103 | 0.004125 | 0.3295 |
| HDAC3 | 0.5929 | 0.6847 | 0.0004064 | 0.009527 | 0.9828 | 0.9928 | 0.7308 | 0.0008312 | 0.8033 | 0.6639 |
| HDAC4 | 0.6736 | 0.05715 | 6.31 × 10⁻⁹ | 6.23 × 10⁻⁸ | 2.45 × 10⁻⁶ | 0.0007432 | 0.8911 | 0.9883 | 0.05715 | 1.34 × 10⁻⁷ |
| HDAC5 | 0.5123 | 5.06 × 10⁻¹⁰ | 2.75 × 10⁻⁷ | 0.6997 | 0.2671 | 1.89 × 10⁻⁶ | 5.44 × 10⁻⁷ | 0.1071 | 0.1846 | 0.6379 |
| HDAC6 | 0.02628 | 4.40 × 10⁻⁵ | 6.95 × 10⁻⁷ | 0.1524 | 0.0007387 | 0.05715 | 0.0021 | 5.24 × 10⁻⁵ | 1.40 × 10⁻⁶ | 0.4824 |
| HDAC7 | 0.01279 | 0.3118 | 0.01543 | 0.8752 | 1.77 × 10⁻⁶ | 0.003159 | 0.0977 | 0.471 | 0.5864 | 6.79 × 10⁻⁸ |
| HDAC8 | 0.6997 | 1.56 × 10⁻⁵ | 0.1492 | 7.56 × 10⁻⁵ | 1.02 × 10⁻⁷ | 0.6639 | 0.007092 | 0.07442 | 0.0003117 | 0.003606 |
| HDAC9 | 0.003263 | 0.6997 | 3.67 × 10⁻¹³ | 0.002858 | 0.0002713 | 0 | 0.0001066 | 0.0008003 | 0.004125 | 1.59 × 10⁻⁵ |
| HDAC10 | 0.07118 | 0.003795 | 3.46 × 10⁻¹² | 0.5498 | 1.30 × 10⁻⁹ | 0 | 0 | 0.1753 | 0.1029 | 5.45 × 10⁻¹⁵ |
| HDAC11 | 0.5114 | 0.1779 | 1.91 × 10⁻⁵ | 0.009705 | 4.40 × 10⁻⁵ | 1.14 × 10⁻⁵ | 0.1202 | 0.3875 | 0.01263 | 3.02 × 10⁻⁸ |
References
- Siegel, R.L.; Miller, K.D.; Jemal, A. Cancer statistics, 2019. CA Cancer J. Clin. 2019, 69, 7–34. [Google Scholar] [CrossRef] [PubMed]
- Choi, W.; Czerniak, B.; Ochoa, A.; Su, X.; Siefker-Radtke, A.; Dinney, C.; McConkey, D.J. Intrinsic basal and luminal subtypes of muscle-invasive bladder cancer. Nat. Rev. Urol. 2014, 11, 400–410. [Google Scholar] [CrossRef]
- Clark, P.E.; Agarwal, N.; Biagioli, M.C.; Eisenberger, M.A.; Greenberg, R.E.; Herr, H.W.; Inman, B.A.; Kuban, D.A.; Kuzel, T.M.; Lele, S.M.; et al. Bladder cancer. J. Natl. Compr. Cancer Netw. 2013, 11, 446–475. [Google Scholar] [CrossRef] [PubMed]
- Siegel, R.L.; Miller, K.D.; Jemal, A. Cancer Statistics, 2017. CA Cancer J. Clin. 2017, 67, 7–30. [Google Scholar] [CrossRef]
- Damrauer, J.S.; Hoadley, K.A.; Chism, D.D.; Fan, C.; Tiganelli, C.J.; Wobker, S.E.; Yeh, J.J.; Milowsky, M.I.; Iyer, G.; Parker, J.S.; et al. Intrinsic subtypes of high-grade bladder cancer reflect the hallmarks of breast cancer biology. Proc. Natl. Acad. Sci. USA 2014, 111, 3110–3115. [Google Scholar] [CrossRef] [PubMed] [Green Version]
- Hedegaard, J.; Lamy, P.; Nordentoft, I.; Algaba, F.; Hoyer, S.; Ulhoi, B.P.; Vang, S.; Reinert, T.; Hermann, G.G.; Mogensen, K.; et al. Comprehensive Transcriptional Analysis of Early-Stage Urothelial Carcinoma. Cancer Cell 2016, 30, 27–42. [Google Scholar] [CrossRef] [PubMed]
- Hurst, C.D.; Alder, O.; Platt, F.M.; Droop, A.; Stead, L.F.; Burns, J.E.; Burghel, G.J.; Jain, S.; Klimczak, L.J.; Lindsay, H.; et al. Genomic Subtypes of Non-invasive Bladder Cancer with Distinct Metabolic Profile and Female Gender Bias in KDM6A Mutation Frequency. Cancer Cell 2017, 32, 701–715.e7. [Google Scholar] [CrossRef]
- Sjodahl, G.; Lauss, M.; Lovgren, K.; Chebil, G.; Gudjonsson, S.; Veerla, S.; Patschan, O.; Aine, M.; Ferno, M.; Ringner, M.; et al. A molecular taxonomy for urothelial carcinoma. Clin. Cancer Res. 2012, 18, 3377–3386. [Google Scholar] [CrossRef] [PubMed]
- Warrick, J.I.; Walter, V.; Yamashita, H.; Chung, E.; Shuman, L.; Amponsa, V.O.; Zheng, Z.; Chan, W.; Whitcomb, T.L.; Yue, F.; et al. FOXA1, GATA3 and PPAR Cooperate to Drive Luminal Subtype in Bladder Cancer: A Molecular Analysis of Established Human Cell Lines. Sci. Rep. 2016, 6, 38531. [Google Scholar] [CrossRef]
- DeGraff, D.J.; Clark, P.E.; Cates, J.M.; Yamashita, H.; Robinson, V.L.; Yu, X.; Smolkin, M.E.; Chang, S.S.; Cookson, M.S.; Herrick, M.K.; et al. Loss of the urothelial differentiation marker FOXA1 is associated with high grade, late stage bladder cancer and increased tumor proliferation. PLoS ONE 2012, 7, e36669. [Google Scholar] [CrossRef] [PubMed]
- Warrick, J.I.; Kaag, M.; Raman, J.D.; Chan, W.; Tran, T.; Kunchala, S.; DeGraff, D.; Chen, G. Squamous Dysplasia of the Urinary Bladder: A Consecutive Cystectomy Series. Int. J. Surg. Pathol. 2016, 24, 306–314. [Google Scholar] [CrossRef]
- Knowles, M.A.; Hurst, C.D. Molecular biology of bladder cancer: New insights into pathogenesis and clinical diversity. Nat. Rev. Cancer 2015, 15, 25–41. [Google Scholar] [CrossRef]
- Lindgren, D.; Frigyesi, A.; Gudjonsson, S.; Sjodahl, G.; Hallden, C.; Chebil, G.; Veerla, S.; Ryden, T.; Mansson, W.; Liedberg, F.; et al. Combined gene expression and genomic profiling define two intrinsic molecular subtypes of urothelial carcinoma and gene signatures for molecular grading and outcome. Cancer Res. 2010, 70, 3463–3472. [Google Scholar] [CrossRef] [PubMed]
- Wolff, E.M.; Liang, G.; Jones, P.A. Mechanisms of Disease: Genetic and epigenetic alterations that drive bladder cancer. Nat. Clin. Pract. Urol. 2005, 2, 502–510. [Google Scholar] [CrossRef]
- Rodriguez-Paredes, M.; Esteller, M. Cancer epigenetics reaches mainstream oncology. Nat. Med. 2011, 17, 330–339. [Google Scholar] [CrossRef]
- Davie, J.R.; Spencer, V.A. Signal transduction pathways and the modification of chromatin structure. Prog. Nucleic Acid. Res. Mol. Biol. 2001, 65, 299–340. [Google Scholar] [PubMed]
- Wolffe, A.P. Chromatin remodeling: Why it is important in cancer. Oncogene 2001, 20, 2988–2990. [Google Scholar] [CrossRef]
- Seto, E.; Yoshida, M. Erasers of histone acetylation: The histone deacetylase enzymes. Cold Spring Harb. Perspect. Biol. 2014, 6, a018713. [Google Scholar] [CrossRef] [PubMed]
- Bradner, J.E.; West, N.; Grachan, M.L.; Greenberg, E.F.; Haggarty, S.J.; Warnow, T.; Mazitschek, R. Chemical phylogenetics of histone deacetylases. Nat. Chem. Biol. 2010, 6, 238–243. [Google Scholar] [CrossRef]
- Choi, W.; Porten, S.; Kim, S.; Willis, D.; Plimack, E.R.; Hoffman-Censits, J.; Roth, B.; Cheng, T.; Tran, M.; Lee, I.L.; et al. Identification of distinct basal and luminal subtypes of muscle-invasive bladder cancer with different sensitivities to frontline chemotherapy. Cancer Cell 2014, 25, 152–165. [Google Scholar] [CrossRef]
- Ozawa, A.; Tanji, N.; Kikugawa, T.; Sasaki, T.; Yanagihara, Y.; Miura, N.; Yokoyama, M. Inhibition of bladder tumour growth by histone deacetylase inhibitor. BJU Int. 2010, 105, 1181–1186. [Google Scholar] [CrossRef]
- Ozdag, H.; Teschendorff, A.E.; Ahmed, A.A.; Hyland, S.J.; Blenkiron, C.; Bobrow, L.; Veerakumarasivam, A.; Burtt, G.; Subkhankulova, T.; Arends, M.J.; et al. Differential expression of selected histone modifier genes in human solid cancers. BMC Genomics 2006, 7, 90. [Google Scholar] [CrossRef] [PubMed]
- Poyet, C.; Jentsch, B.; Hermanns, T.; Schweckendiek, D.; Seifert, H.H.; Schmidtpeter, M.; Sulser, T.; Moch, H.; Wild, P.J.; Kristiansen, G. Expression of histone deacetylases 1, 2 and 3 in urothelial bladder cancer. BMC Clin. Pathol. 2014, 14, 10. [Google Scholar] [CrossRef] [PubMed]
- Xu, X.S.; Wang, L.; Abrams, J.; Wang, G. Histone deacetylases (HDACs) in XPC gene silencing and bladder cancer. J. Hematol. Oncol. 2011, 4, 17. [Google Scholar] [CrossRef]
- Niegisch, G.; Knievel, J.; Koch, A.; Hader, C.; Fischer, U.; Albers, P.; Schulz, W.A. Changes in histone deacetylase (HDAC) expression patterns and activity of HDAC inhibitors in urothelial cancers. Urol. Oncol. 2013, 31, 1770–1779. [Google Scholar] [CrossRef] [PubMed]
- Thomsen, M.B.H.; Nordentoft, I.; Lamy, P.; Vang, S.; Reinert, L.; Mapendano, C.K.; Høyer, S.; Ørntoft, T.F.; Jensen, J.B.; Dyrskjøt, L. Comprehensive multiregional analysis of molecular heterogeneity in bladder cancer. Sci. Rep. 2017, 7, 11702. [Google Scholar] [CrossRef]
- Warrick, J.I.; Sjödahl, G.; Kaag, M.; Raman, J.D.; Merrill, S.; Shuman, L.; Chen, G.; Walter, V.; DeGraff, D.J. Intratumoral Heterogeneity of Bladder Cancer by Molecular Subtypes and Histologic Variants. Eur. Urol. 2018, 75, 18–22. [Google Scholar] [CrossRef] [PubMed]
- Hovelson, D.H.; Udager, A.M.; McDaniel, A.S.; Grivas, P.; Palmbos, P.; Tamura, S.; Lazo de la Vega, L.; Palapattu, G.; Veeneman, B.; El-Sawy, L.; et al. Targeted DNA and RNA Sequencing of Paired Urothelial and Squamous Bladder Cancers Reveals Discordant Genomic and Transcriptomic Events and Unique Therapeutic Implications. Eur. Urol. 2018, 74, 741–753. [Google Scholar] [CrossRef] [PubMed]
- Giannopoulou, A.F.; Velentzas, A.D.; Konstantakou, E.G.; Avgeris, M.; Katarachia, S.A.; Papandreou, N.C.; Kalavros, N.I.; Mpakou, V.E.; Iconomidou, V.; Anastasiadou, E.; et al. Revisiting Histone Deacetylases in Human Tumorigenesis: The Paradigm of Urothelial Bladder Cancer. Int. J. Mol. Sci 2019, 20, 1291. [Google Scholar] [CrossRef]
- Dawson, M.A.; Kouzarides, T. Cancer epigenetics: From mechanism to therapy. Cell 2012, 150, 12–27. [Google Scholar] [CrossRef]
- Cancer Genome Atlas Research, N. Comprehensive molecular characterization of urothelial bladder carcinoma. Nature 2014, 507, 315–322. [Google Scholar] [CrossRef] [Green Version]
- Robertson, A.G.; Kim, J.; Al-Ahmadie, H.; Bellmunt, J.; Guo, G.; Cherniack, A.D.; Hinoue, T.; Laird, P.W.; Hoadley, K.A.; Akbani, R.; et al. Comprehensive Molecular Characterization of Muscle-Invasive Bladder Cancer. Cell 2017, 171, 540–556.e25. [Google Scholar] [CrossRef] [PubMed]
- Barretina, J.; Caponigro, G.; Stransky, N.; Venkatesan, K.; Margolin, A.A.; Kim, S.; Wilson, C.J.; Lehar, J.; Kryukov, G.V.; Sonkin, D.; et al. The Cancer Cell Line Encyclopedia enables predictive modelling of anticancer drug sensitivity. Nature 2012, 483, 603–607. [Google Scholar] [CrossRef] [PubMed]
- Goldstein, J.T.; Berger, A.C.; Shih, J.; Duke, F.F.; Furst, L.; Kwiatkowski, D.J.; Cherniack, A.D.; Meyerson, M.; Strathdee, C.A. Genomic Activation of PPARG Reveals a Candidate Therapeutic Axis in Bladder Cancer. Cancer Res. 2017, 77, 6987–6998. [Google Scholar] [CrossRef]
- Reddy, O.L.; Cates, J.M.; Gellert, L.L.; Crist, H.S.; Yang, Z.; Yamashita, H.; Taylor, J.A., 3rd; Smith, J.A., Jr.; Chang, S.S.; Cookson, M.S.; et al. Loss of FOXA1 Drives Sexually Dimorphic Changes in Urothelial Differentiation and Is an Independent Predictor of Poor Prognosis in Bladder Cancer. Am. J. Pathol. 2015, 185, 1385–1395. [Google Scholar] [CrossRef] [Green Version]
- McKinsey, T.A.; Zhang, C.L.; Olson, E.N. Identification of a signal-responsive nuclear export sequence in class II histone deacetylases. Mol. Cell Biol. 2001, 21, 6312–6321. [Google Scholar] [CrossRef]
- Fischle, W.; Dequiedt, F.; Hendzel, M.J.; Guenther, M.G.; Lazar, M.A.; Voelter, W.; Verdin, E. Enzymatic activity associated with class II HDACs is dependent on a multiprotein complex containing HDAC3 and SMRT/N-CoR. Mol. Cell 2002, 9, 45–57. [Google Scholar] [CrossRef]
- Babjuk, M.; Burger, M.; Zigeuner, R.; Shariat, S.F.; van Rhijn, B.W.; Comperat, E.; Sylvester, R.J.; Kaasinen, E.; Bohle, A.; Palou Redorta, J.; et al. EAU guidelines on non-muscle-invasive urothelial carcinoma of the bladder: Update 2013. Eur. Urol. 2013, 64, 639–653. [Google Scholar] [CrossRef]
- Fukushima, S.; Hirose, M.; Tsuda, H.; Shirai, T.; Hirao, K. Histological classification of urinary bladder cancers in rats induced by N-butyl-n-(4-hydroxybutyl)nitrosamine. Gan 1976, 67, 81–90. [Google Scholar]
- Masui, T.; Dong, Y.; Yamamoto, S.; Takada, N.; Nakanishi, H.; Inada, K.; Fukushima, S.; Tatematsu, M. p53 mutations in transitional cell carcinomas of the urinary bladder in rats treated with N-butyl-N-(4-hydroxybutyl)-nitrosamine. Cancer Lett. 1996, 105, 105–112. [Google Scholar] [CrossRef]
- Vasconcelos-Nobrega, C.; Colaco, A.; Lopes, C.; Oliveira, P.A. Review: BBN as an urothelial carcinogen. In Vivo 2012, 26, 727–739. [Google Scholar] [PubMed]
- Zhang, Z.T.; Pak, J.; Huang, H.Y.; Shapiro, E.; Sun, T.T.; Pellicer, A.; Wu, X.R. Role of Ha-ras activation in superficial papillary pathway of urothelial tumor formation. Oncogene 2001, 20, 1973–1980. [Google Scholar] [CrossRef] [PubMed] [Green Version]
- Zhang, Z.T.; Pak, J.; Shapiro, E.; Sun, T.T.; Wu, X.R. Urothelium-specific expression of an oncogene in transgenic mice induced the formation of carcinoma in situ and invasive transitional cell carcinoma. Cancer Res. 1999, 59, 3512–3517. [Google Scholar] [PubMed]
- Pinkerneil, M.; Hoffmann, M.J.; Deenen, R.; Kohrer, K.; Arent, T.; Schulz, W.A.; Niegisch, G. Inhibition of Class I Histone Deacetylases 1 and 2 Promotes Urothelial Carcinoma Cell Death by Various Mechanisms. Mol. Cancer Ther. 2016, 15, 299–312. [Google Scholar] [CrossRef] [PubMed] [Green Version]
- Weichert, W.; Roske, A.; Gekeler, V.; Beckers, T.; Stephan, C.; Jung, K.; Fritzsche, F.R.; Niesporek, S.; Denkert, C.; Dietel, M.; et al. Histone deacetylases 1, 2 and 3 are highly expressed in prostate cancer and HDAC2 expression is associated with shorter PSA relapse time after radical prostatectomy. Br. J. Cancer 2008, 98, 604–610. [Google Scholar] [CrossRef] [PubMed] [Green Version]
- Wilson, A.J.; Byun, D.S.; Popova, N.; Murray, L.B.; L’Italien, K.; Sowa, Y.; Arango, D.; Velcich, A.; Augenlicht, L.H.; Mariadason, J.M. Histone deacetylase 3 (HDAC3) and other class I HDACs regulate colon cell maturation and p21 expression and are deregulated in human colon cancer. J. Biol. Chem. 2006, 281, 13548–13558. [Google Scholar] [CrossRef] [PubMed]
- Eckschlager, T.; Plch, J.; Stiborova, M.; Hrabeta, J. Histone Deacetylase Inhibitors as Anticancer Drugs. Int. J. Mol. Sci. 2017, 18, 1414. [Google Scholar] [CrossRef]
- Xu, W.S.; Parmigiani, R.B.; Marks, P.A. Histone deacetylase inhibitors: Molecular mechanisms of action. Oncogene 2007, 26, 5541–5552. [Google Scholar] [CrossRef]
- Grivas, P.; Mortazavi, A.; Picus, J.; Hahn, N.M.; Milowsky, M.I.; Hart, L.L.; Alva, A.; Bellmunt, J.; Pal, S.K.; Bambury, R.M.; et al. Mocetinostat for patients with previously treated, locally advanced/metastatic urothelial carcinoma and inactivating alterations of acetyltransferase genes. Cancer 2019, 125, 533–540. [Google Scholar] [CrossRef]
- Rosik, L.; Niegisch, G.; Fischer, U.; Jung, M.; Schulz, W.A.; Hoffmann, M.J. Limited efficacy of specific HDAC6 inhibition in urothelial cancer cells. Cancer Biol. Ther. 2014, 15, 742–757. [Google Scholar] [CrossRef] [Green Version]
- Karam, J.A.; Fan, J.; Stanfield, J.; Richer, E.; Benaim, E.A.; Frenkel, E.; Antich, P.; Sagalowsky, A.I.; Mason, R.P.; Hsieh, J.T. The use of histone deacetylase inhibitor FK228 and DNA hypomethylation agent 5-azacytidine in human bladder cancer therapy. Int. J. Cancer 2007, 120, 1795–1802. [Google Scholar] [CrossRef]
- Qu, W.; Kang, Y.D.; Zhou, M.S.; Fu, L.L.; Hua, Z.H.; Wang, L.M. Experimental study on inhibitory effects of histone deacetylase inhibitor MS-275 and TSA on bladder cancer cells. Urol. Oncol. 2010, 28, 648–654. [Google Scholar] [CrossRef]
- Livak, K.J.; Schmittgen, T.D. Analysis of relative gene expression data using real-time quantitative PCR and the 2(-Delta Delta C(T)) Method. Methods 2001, 25, 402–408. [Google Scholar] [CrossRef] [PubMed]
- R Core Team. R: A language and environment for statistical computing. R Foundation for Statistical Computing, Vienna, Austria. 2018. Available online: https://www.R-project.org/ (accessed on 4 April 2019).


© 2019 by the authors. Licensee MDPI, Basel, Switzerland. This article is an open access article distributed under the terms and conditions of the Creative Commons Attribution (CC BY) license (http://creativecommons.org/licenses/by/4.0/).
Share and Cite
Buckwalter, J.M.; Chan, W.; Shuman, L.; Wildermuth, T.; Ellis-Mohl, J.; Walter, V.; Warrick, J.I.; Wu, X.-R.; Kaag, M.; Raman, J.D.; et al. Characterization of Histone Deacetylase Expression Within In Vitro and In Vivo Bladder Cancer Model Systems. Int. J. Mol. Sci. 2019, 20, 2599. https://0-doi-org.brum.beds.ac.uk/10.3390/ijms20102599
Buckwalter JM, Chan W, Shuman L, Wildermuth T, Ellis-Mohl J, Walter V, Warrick JI, Wu X-R, Kaag M, Raman JD, et al. Characterization of Histone Deacetylase Expression Within In Vitro and In Vivo Bladder Cancer Model Systems. International Journal of Molecular Sciences. 2019; 20(10):2599. https://0-doi-org.brum.beds.ac.uk/10.3390/ijms20102599
Chicago/Turabian StyleBuckwalter, Jenna M., Wilson Chan, Lauren Shuman, Thomas Wildermuth, Justine Ellis-Mohl, Vonn Walter, Joshua I. Warrick, Xue-Ru Wu, Matt Kaag, Jay D. Raman, and et al. 2019. "Characterization of Histone Deacetylase Expression Within In Vitro and In Vivo Bladder Cancer Model Systems" International Journal of Molecular Sciences 20, no. 10: 2599. https://0-doi-org.brum.beds.ac.uk/10.3390/ijms20102599