Molecular Inverse Comorbidity between Alzheimer’s Disease and Lung Cancer: New Insights from Matrix Factorization

 , , ,
, , ,  and
and 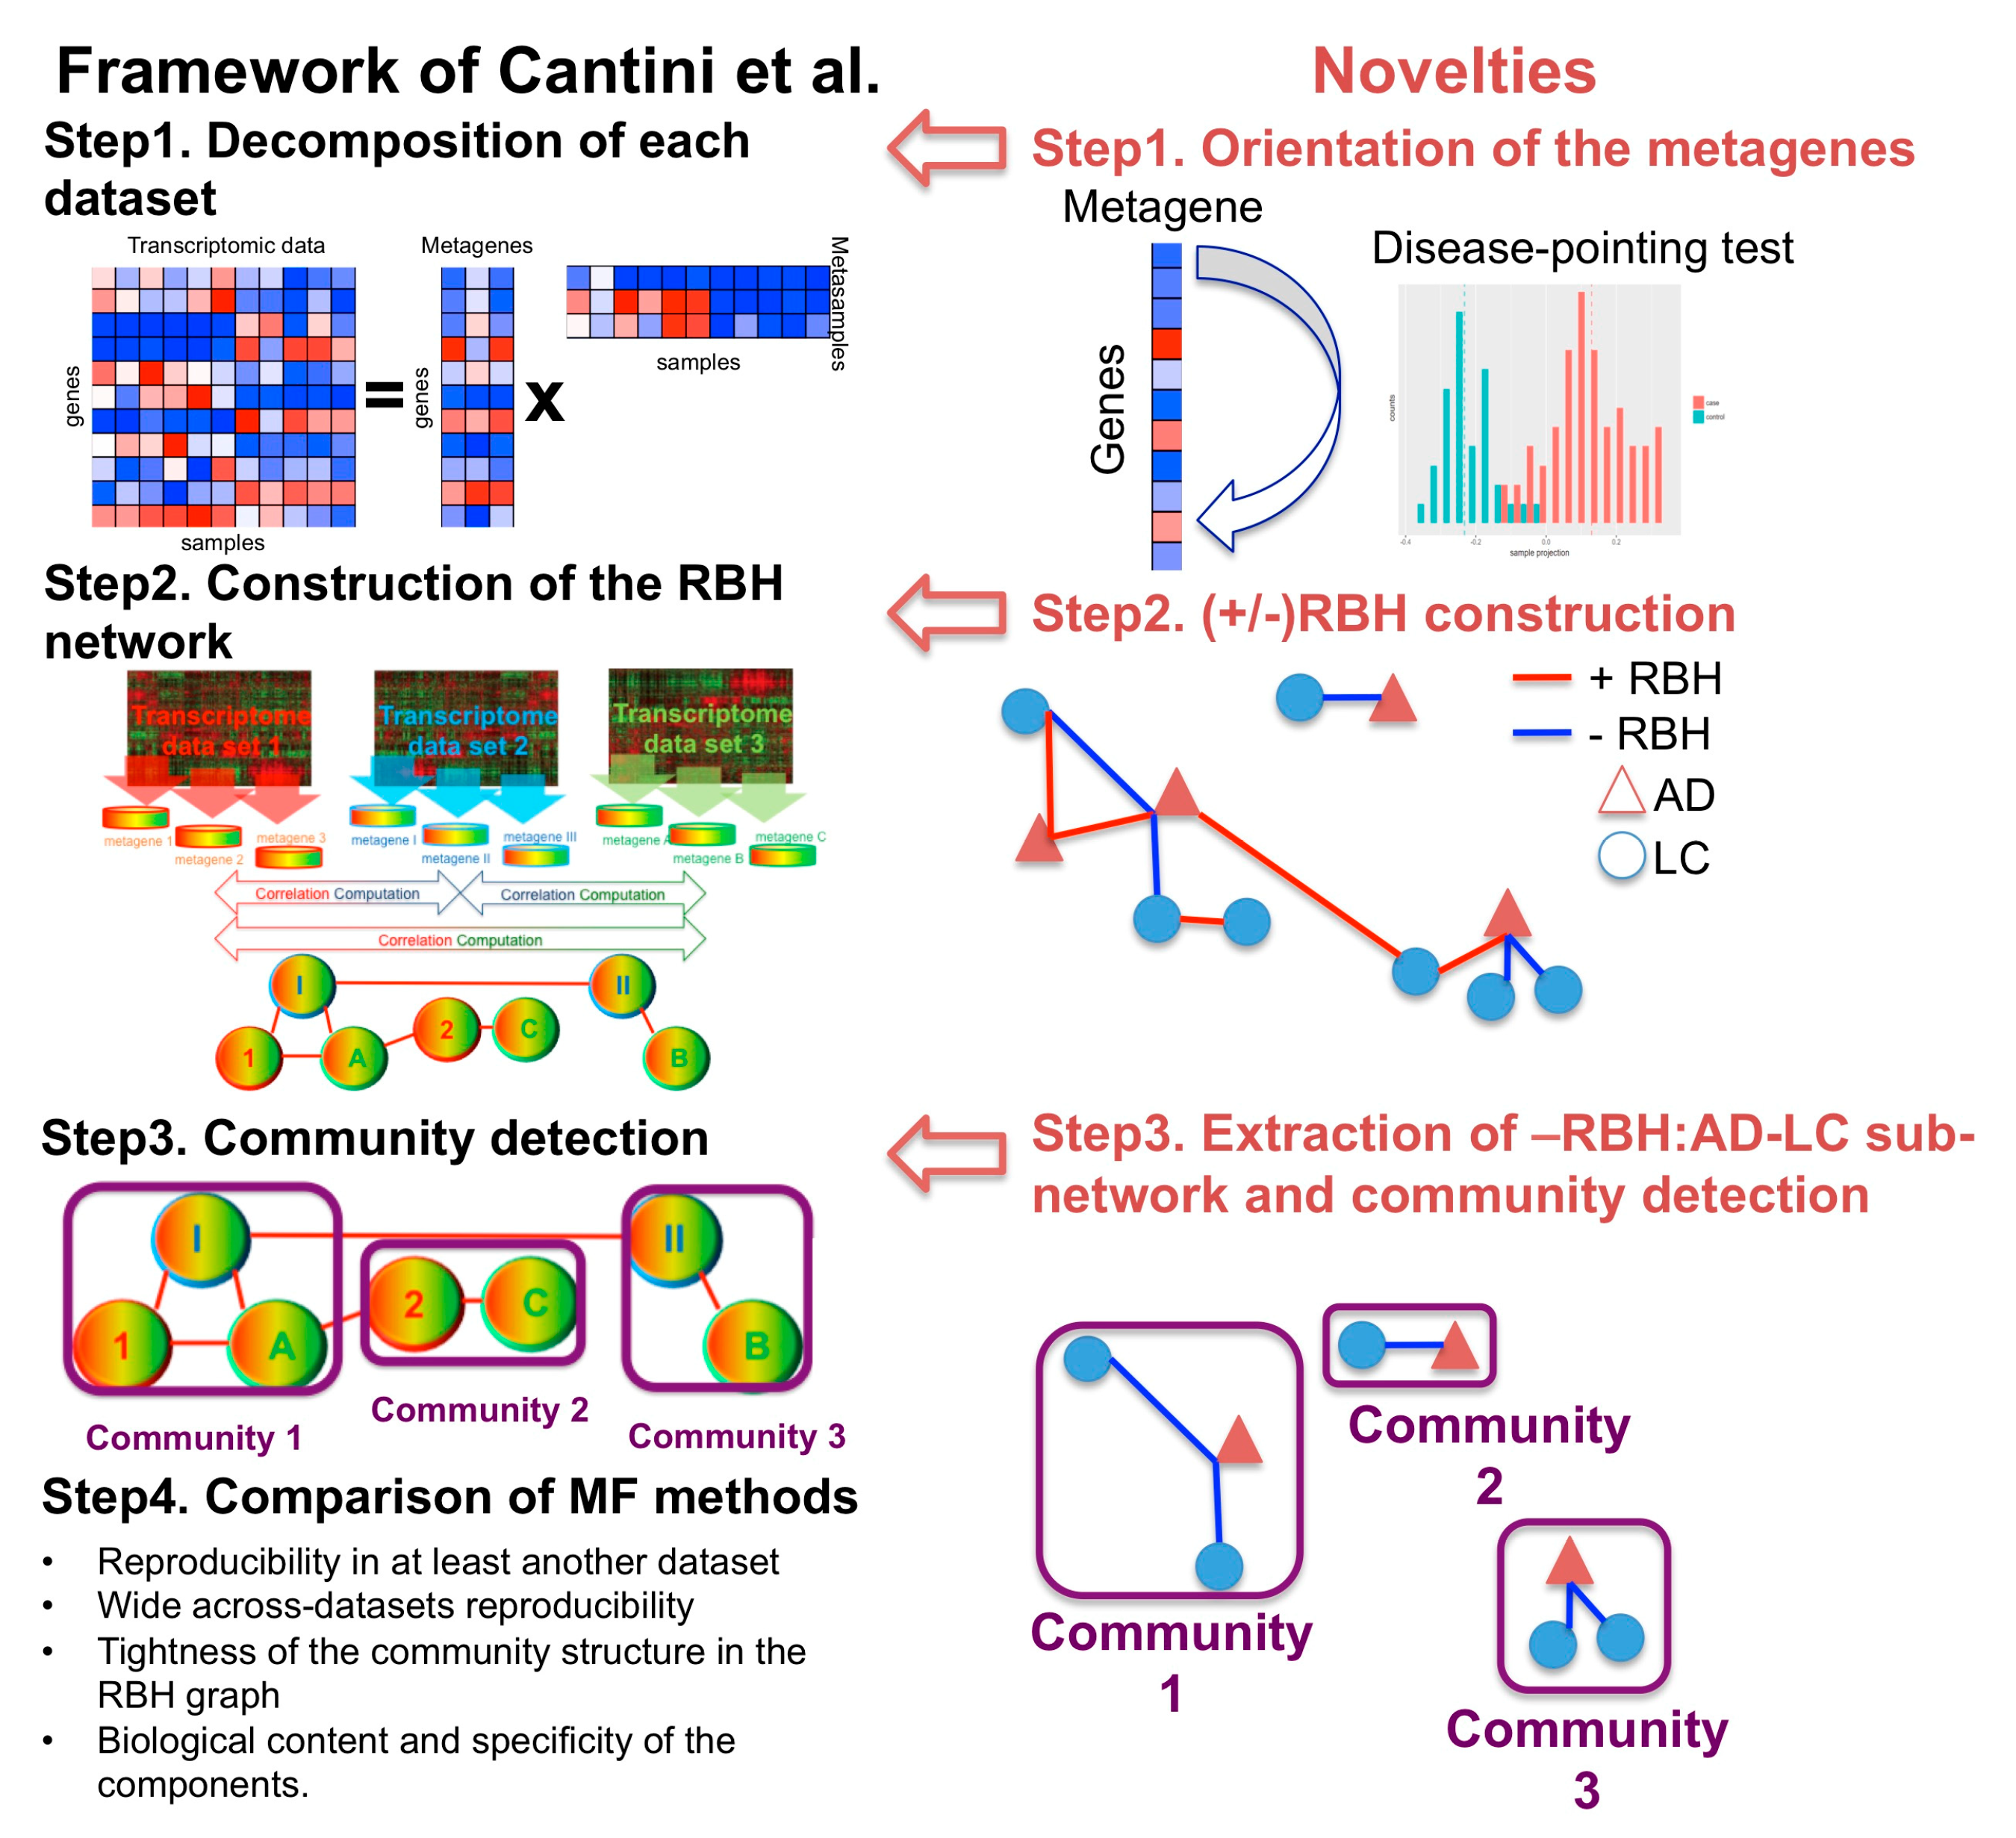
Abstract
:1. Introduction
2. Results
2.1. A New MF Framework to Study Disease–Disease Relationships
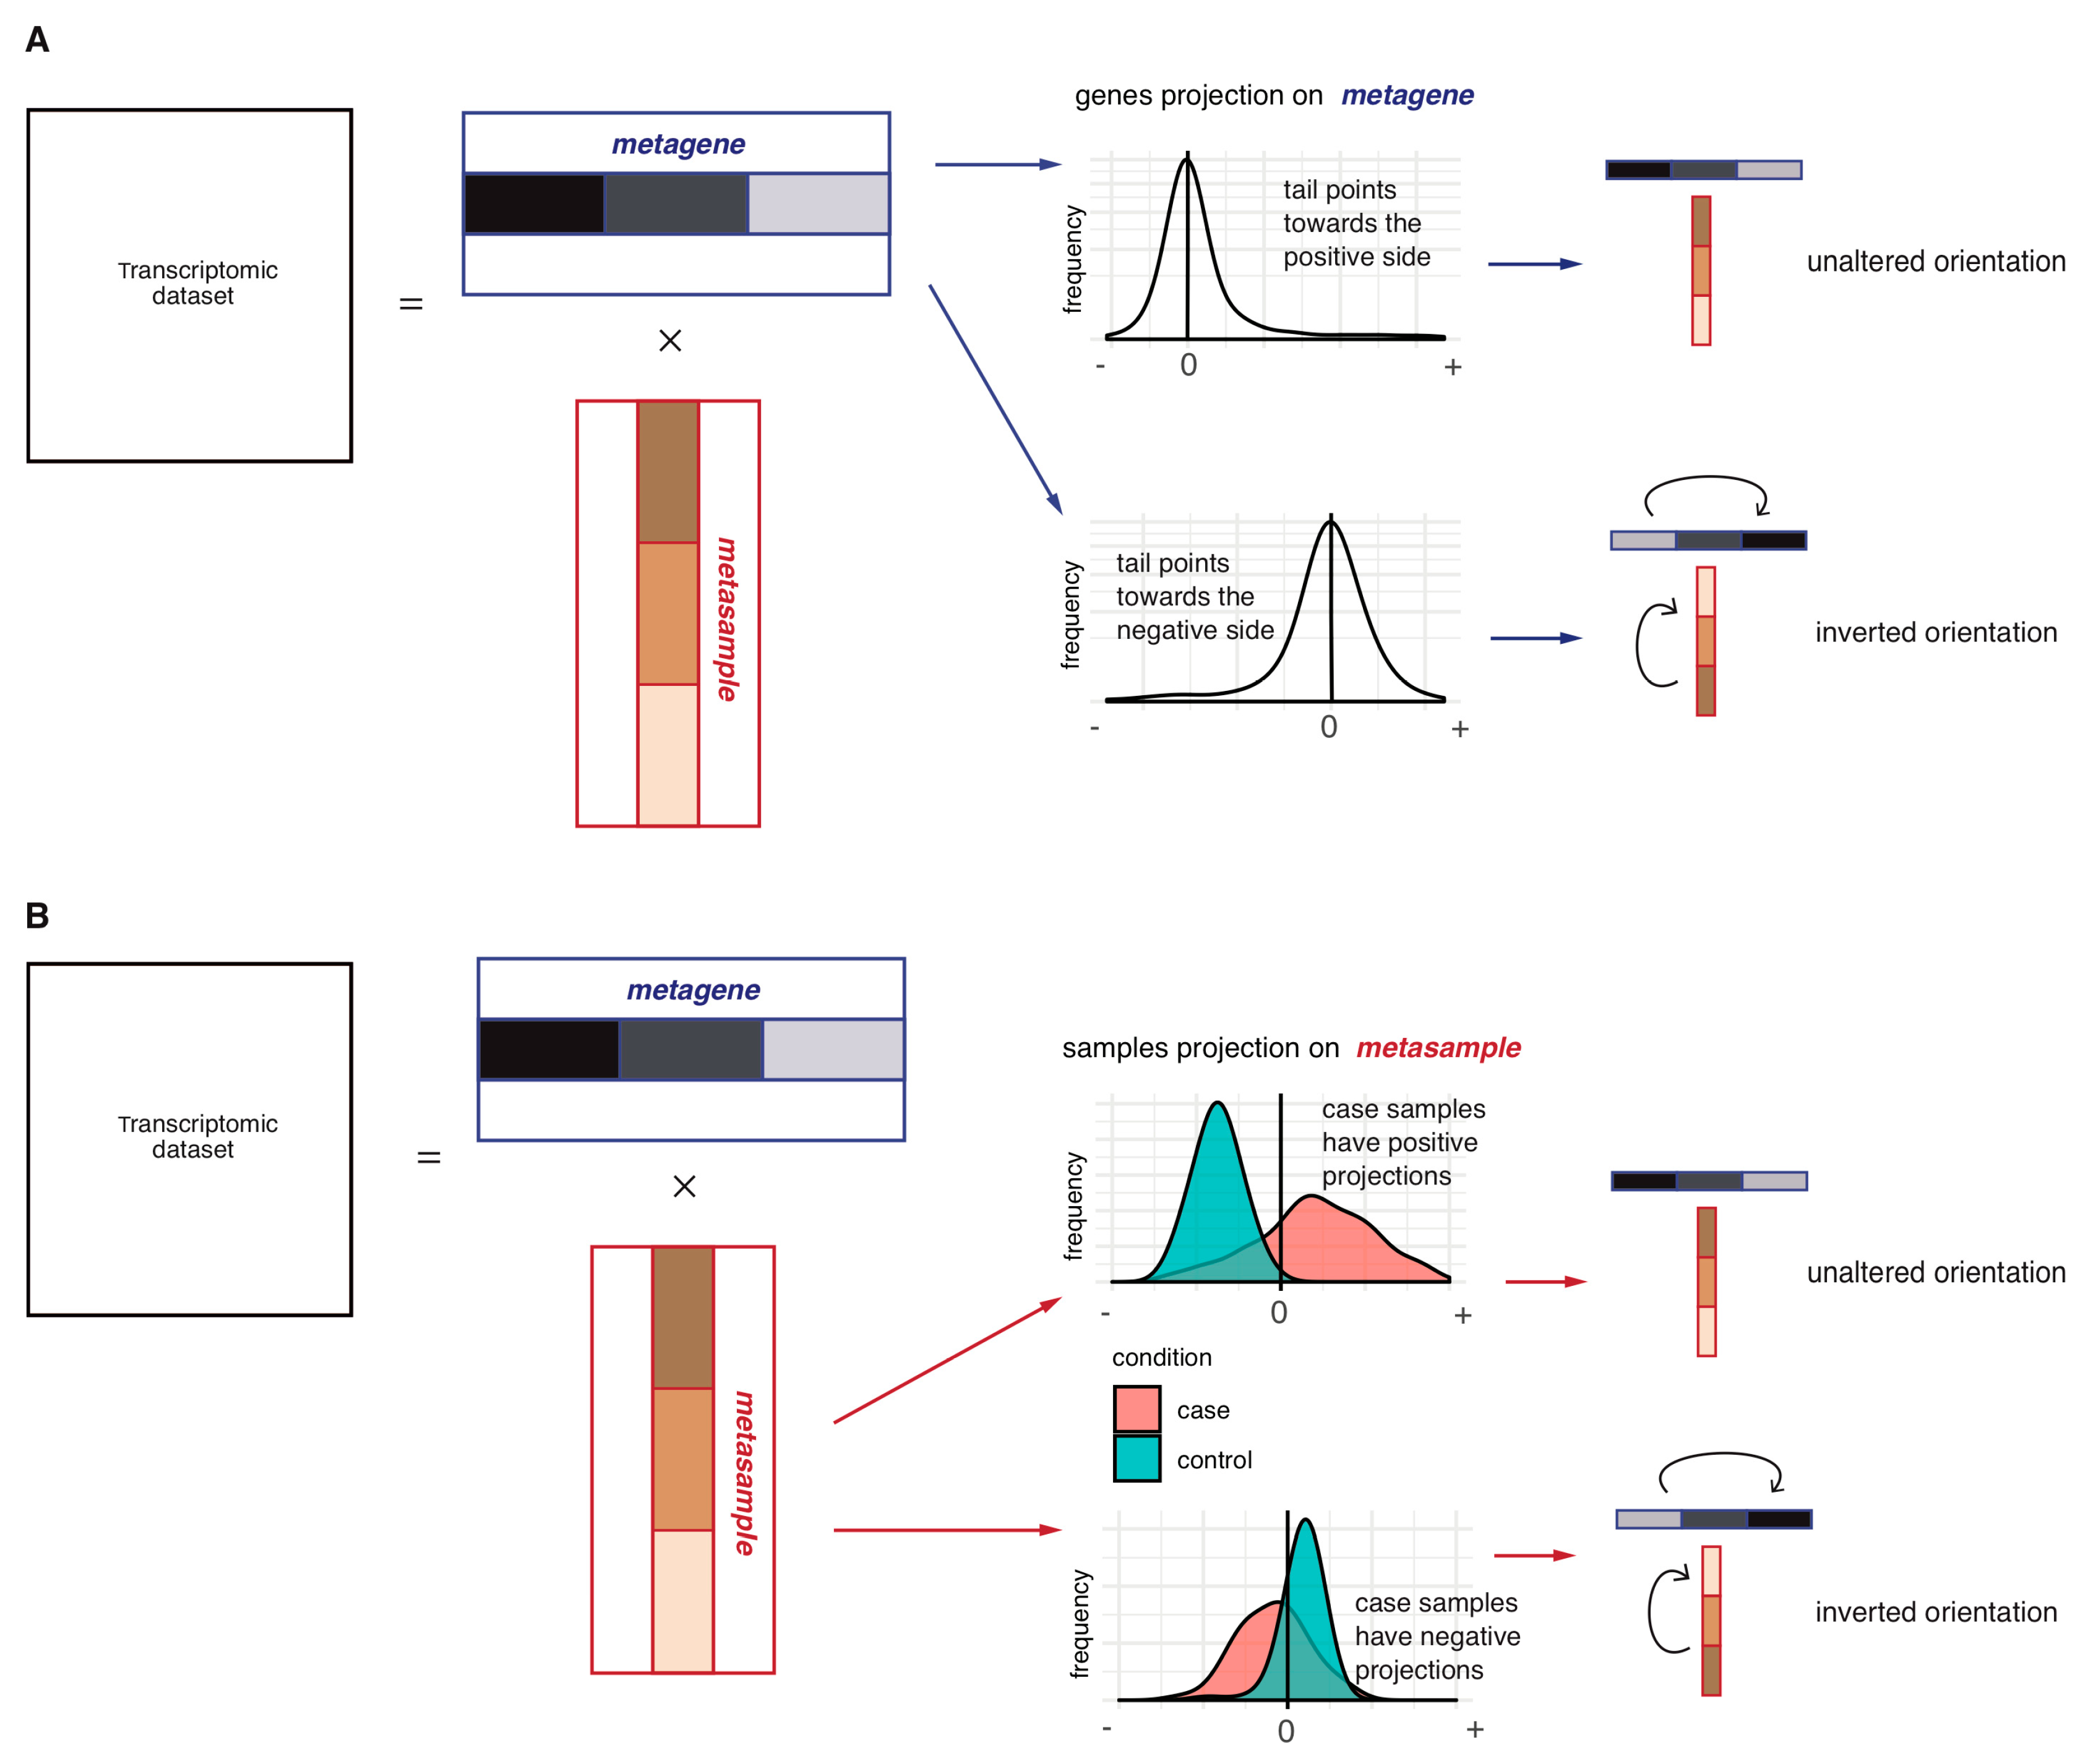
2.1.1. Step 1: Data Decomposition and Orientation of the Components
2.1.2. Step 2: Construction of the Reciprocal Best Hits (RBHs)
2.1.3. Step 3: Subnetwork Isolation and Community Detection
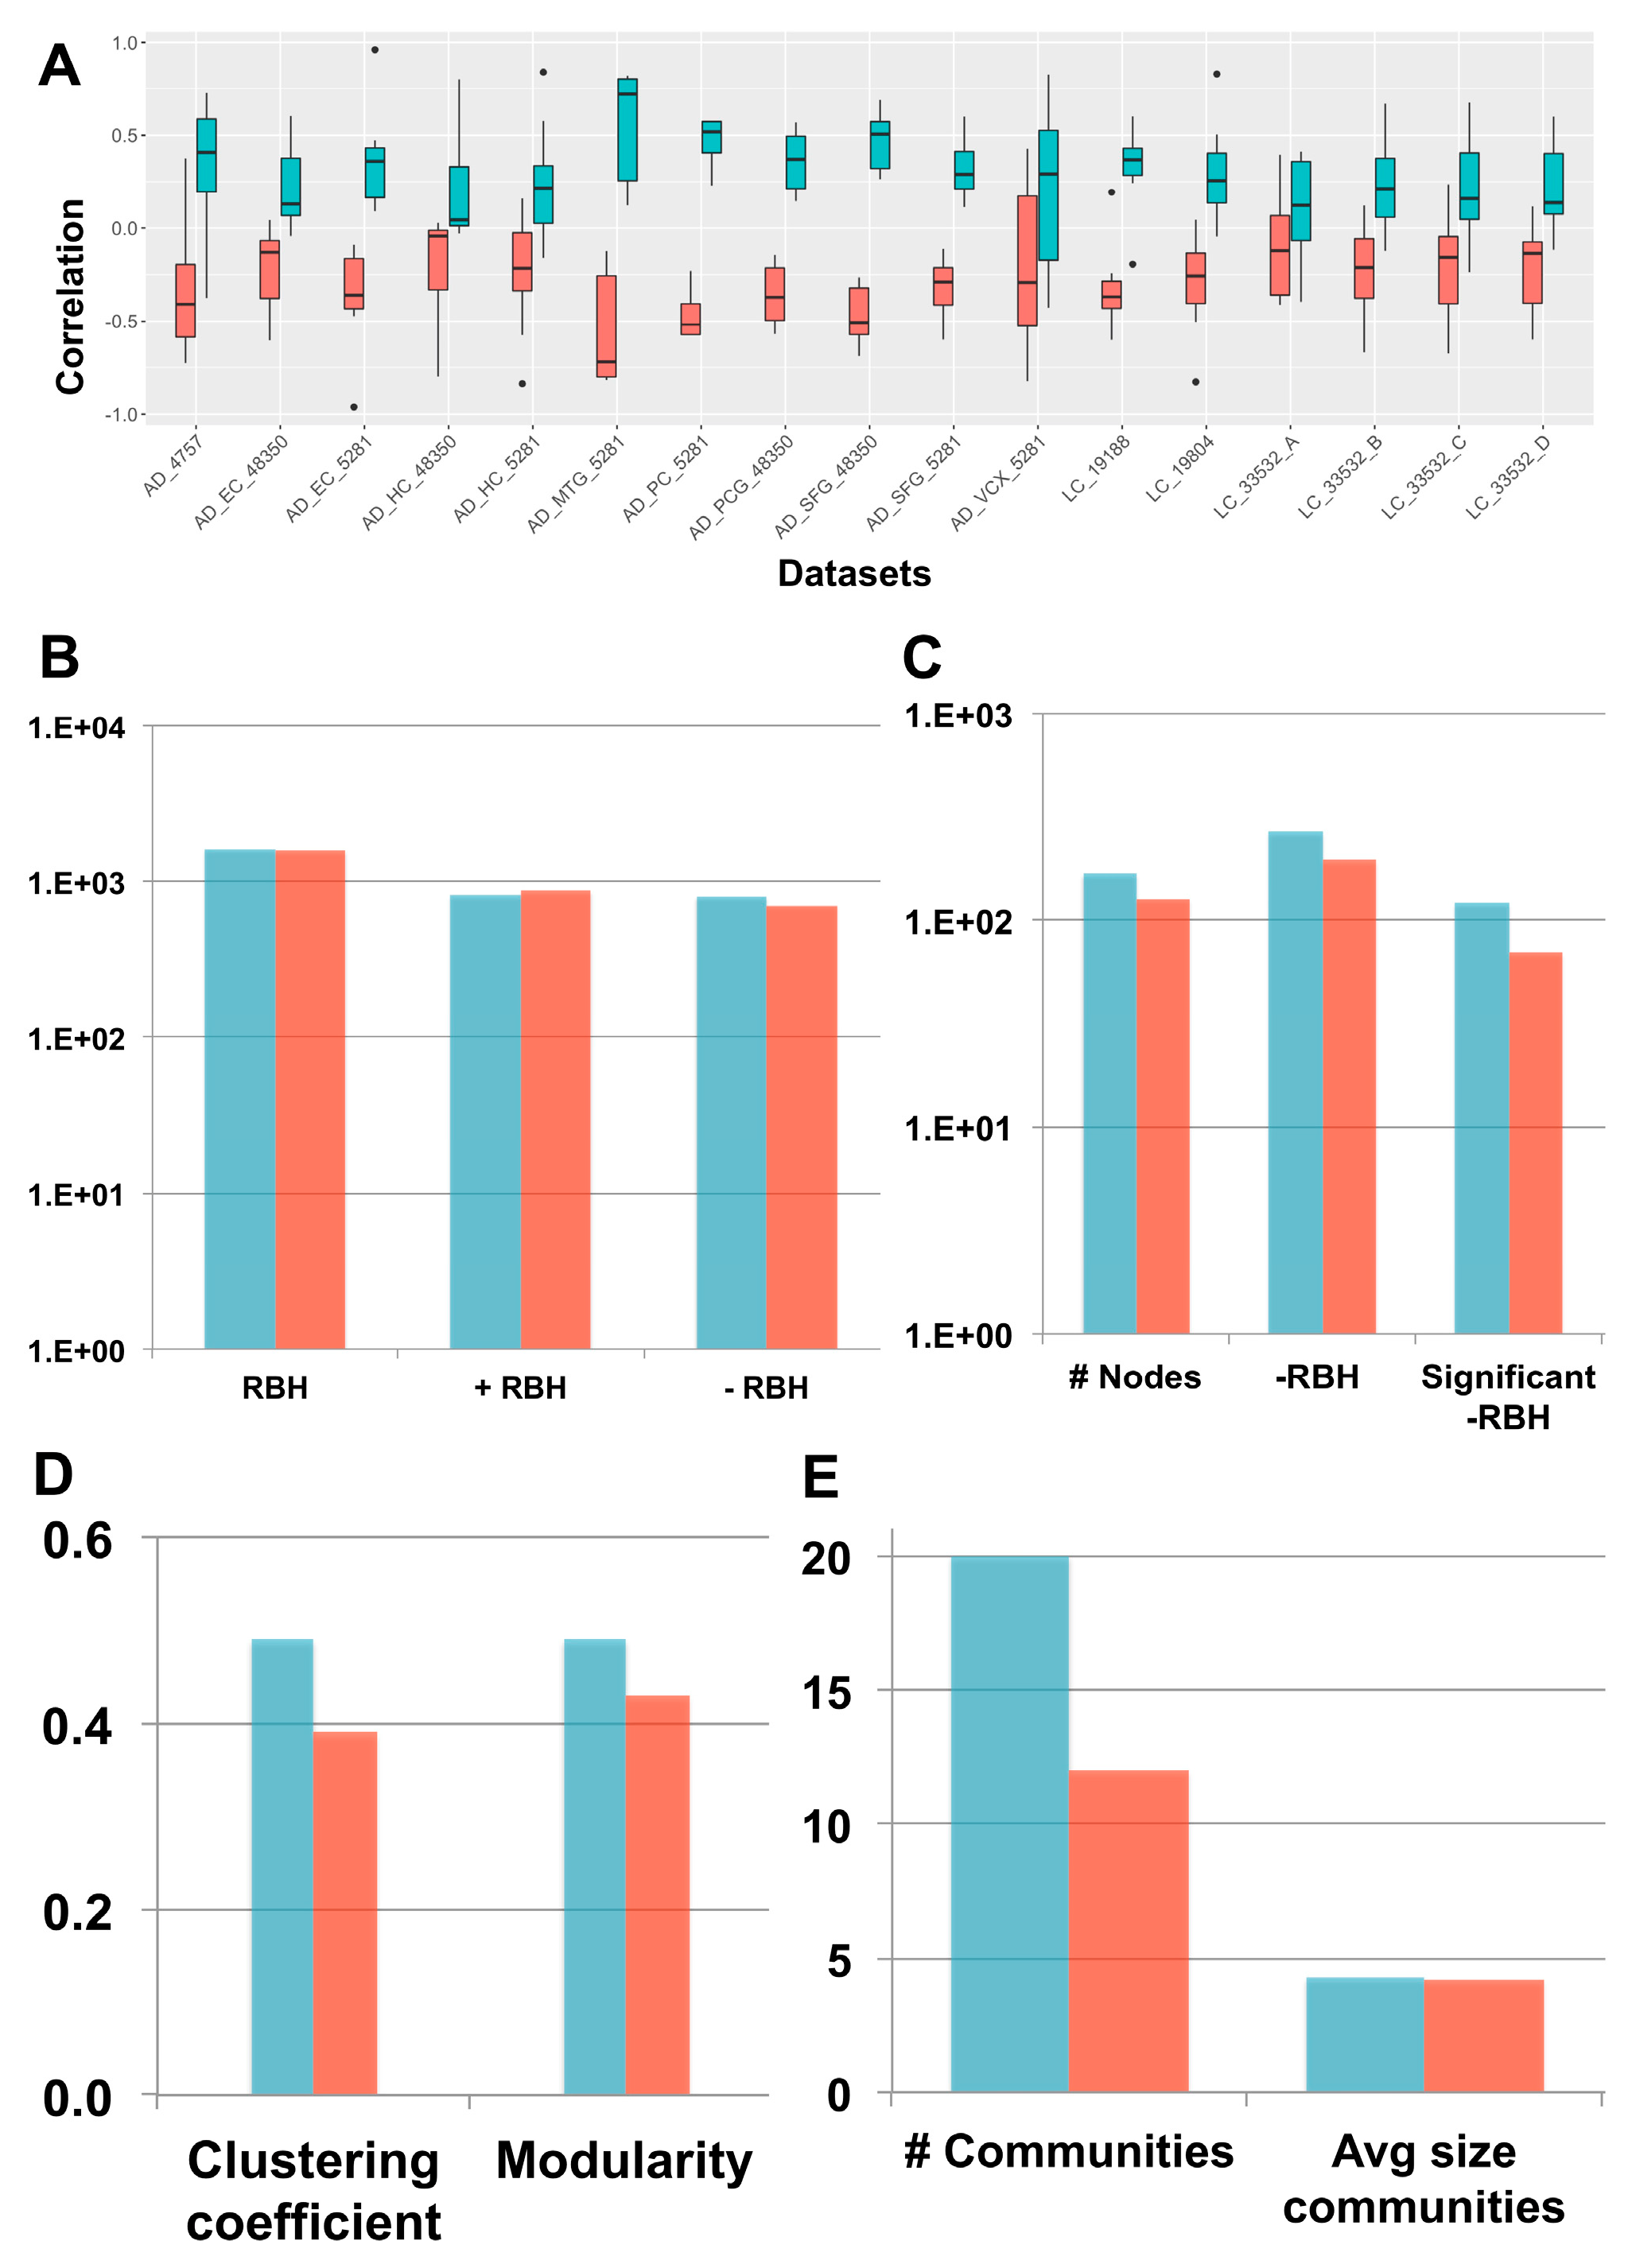
2.2. Investigation of the Orientation Methodology for the sICA Components
2.3. New Biological Insights on the Inverse Comorbidity between AD and LC
3. Discussion
4. Materials and Methods
4.1. Data Collection
4.2. Biological Characterization of the Communities
Supplementary Materials
Author Contributions
Funding
Acknowledgments
Conflicts of Interest
Abbreviations
| AD | Alzheimer’s disease |
| LC | Lung Cancer |
| RBH | Reciprocal Best Hit |
| DD | Disease-Disease |
References
- Bell, G.; Hey, T.; Szalay, A. COMPUTER SCIENCE: Beyond the Data Deluge. Science 2009, 323, 1297–1298. [Google Scholar] [CrossRef] [PubMed]
- Stein-O’Brien, G.L.; Arora, R.; Culhane, A.C.; Favorov, A.V.; Garmire, L.X.; Greene, C.S.; Goff, L.A.; Li, Y.; Ngom, A.; Ochs, M.F.; et al. Enter the Matrix: Factorization Uncovers Knowledge from Omics. Trends Genet. 2018, 34, 790–805. [Google Scholar] [CrossRef] [PubMed] [Green Version]
- Devarajan, K. Nonnegative Matrix Factorization: An Analytical and Interpretive Tool in Computational Biology. PLoS Comput. Biol. 2008, 4, e1000029. [Google Scholar] [CrossRef] [PubMed]
- Meng, C.; Zeleznik, O.A.; Thallinger, G.G.; Kuster, B.; Gholami, A.M.; Culhane, A.C. Dimension reduction techniques for the integrative analysis of multi-omics data. Brief. Bioinform. 2016, 17, 628–641. [Google Scholar] [CrossRef] [PubMed]
- De Sousa, E.; Melo, F.; Wang, X.; Jansen, M.; Fessler, E.; Trinh, A.; de Rooij, L.P.M.H.; de Jong, J.H.; de Boer, O.J.; van Leersum, R.; et al. Poor-prognosis colon cancer is defined by a molecularly distinct subtype and develops from serrated precursor lesions. Nat. Med. 2013, 19, 614–618. [Google Scholar] [CrossRef] [PubMed]
- Sadanandam, A.; Lyssiotis, C.A.; Homicsko, K.; Collisson, E.A.; Gibb, W.J.; Wullschleger, S.; Ostos, L.C.G.; Lannon, W.A.; Grotzinger, C.; Del Rio, M.; et al. A colorectal cancer classification system that associates cellular phenotype and responses to therapy. Nat. Med. 2013, 19, 619–625. [Google Scholar] [CrossRef] [PubMed] [Green Version]
- Kong, W.; Mou, X.; Hu, X. Exploring matrix factorization techniques for significant genes identification of Alzheimer’s disease microarray gene expression data. BMC Bioinform. 2011, 12, S7. [Google Scholar] [CrossRef] [PubMed]
- Brunet, J.-P.; Tamayo, P.; Golub, T.R.; Mesirov, J.P. Metagenes and molecular pattern discovery using matrix factorization. Proc. Natl. Acad. Sci. USA 2004, 101, 4164–4169. [Google Scholar] [CrossRef] [Green Version]
- Alexandrov, L.B.; Ju, Y.S.; Haase, K.; Van Loo, P.; Martincorena, I.; Nik-Zainal, S.; Totoki, Y.; Fujimoto, A.; Nakagawa, H.; Shibata, T.; et al. Mutational signatures associated with tobacco smoking in human cancer. Science 2016, 354, 618–622. [Google Scholar] [CrossRef] [Green Version]
- Alexandrov, L.B.; Nik-Zainal, S.; Wedge, D.C.; Aparicio, S.A.J.R.; Behjati, S.; Biankin, A.V.; Boyault, S. Signatures of mutational processes in human cancer. Nature 2013, 500, 415–421. [Google Scholar] [CrossRef] [Green Version]
- Hackl, H.; Charoentong, P.; Finotello, F.; Trajanoski, Z. Computational genomics tools for dissecting tumour-immune cell interactions. Nat. Rev. Genet. 2016, 17, 441–458. [Google Scholar] [CrossRef] [PubMed]
- Cantini, L.; Kairov, U.; de Reyniès, A.; Barillot, E.; Radvanyi, F.; Zinovyev, A. Assessing reproducibility of matrix factorization methods in independent transcriptomes. Bioinformatics 2019. [Google Scholar] [CrossRef] [PubMed]
- Goh, K.-I.; Cusick, M.E.; Valle, D.; Childs, B.; Vidal, M.; Barabási, A.-L. The human disease network. Proc. Natl. Acad. Sci. USA 2007, 104, 8685–8690. [Google Scholar] [CrossRef] [PubMed] [Green Version]
- Halu, A.; De Domenico, M.; Arenas, A.; Sharma, A. The multiplex network of human diseases. NPJ Syst. Biol. Appl. 2019, 5, 15. [Google Scholar] [CrossRef] [PubMed]
- Hidalgo, C.A.; Blumm, N.; Barabási, A.-L.; Christakis, N.A. A dynamic network approach for the study of human phenotypes. PLoS Comput. Biol. 2009, 5, e1000353. [Google Scholar] [CrossRef] [PubMed]
- Beck, M.K.; Jensen, A.B.; Nielsen, A.B.; Perner, A.; Moseley, P.L.; Brunak, S. Diagnosis trajectories of prior multi-morbidity predict sepsis mortality. Sci. Rep. 2016, 6, 36624. [Google Scholar] [CrossRef] [Green Version]
- Wang, K.; Gaitsch, H.; Poon, H.; Cox, N.J.; Rzhetsky, A. Classification of common human diseases derived from shared genetic and environmental determinants. Nat. Genet. 2017, 49, 1319–1325. [Google Scholar] [CrossRef] [Green Version]
- Eibl, G.; Cruz-Monserrate, Z.; Korc, M.; Petrov, M.S.; Goodarzi, M.O.; Fisher, W.E.; Habtezion, A.; Lugea, A.; Pandol, S.J.; Hart, P.A.; et al. Diabetes Mellitus and Obesity as Risk Factors for Pancreatic Cancer. J. Acad. Nutr. Diet. 2018, 118, 555–567. [Google Scholar] [CrossRef]
- Qu, Y.-L.; Liu, J.; Zhang, L.-X.; Wu, C.-M.; Chu, A.-J.; Wen, B.-L.; Ma, C.; Yan, X.-Y.; Zhang, X.; Wang, D.-M.; et al. Asthma and the risk of lung cancer: A meta-analysis. Oncotarget 2017, 8, 11614–11620. [Google Scholar]
- Musicco, M.; Adorni, F.; Di Santo, S.; Prinelli, F.; Pettenati, C.; Caltagirone, C.; Palmer, K.; Russo, A. Inverse occurrence of cancer and Alzheimer disease: A population-based incidence study. Neurology 2013, 81, 322–328. [Google Scholar] [CrossRef]
- Freedman, D.M.; Wu, J.; Chen, H.; Kuncl, R.W.; Enewold, L.R.; Engels, E.A.; Freedman, N.D.; Pfeiffer, R.M. Associations between cancer and Alzheimer’s disease in a U.S. Medicare population. Cancer Med. 2016, 5, 2965–2976. [Google Scholar] [CrossRef] [PubMed]
- Driver, J.A.; Beiser, A.; Au, R.; Kreger, B.E.; Splansky, G.L.; Kurth, T.; Kiel, D.P.; Lu, K.P.; Seshadri, S.; Wolf, P.A. Inverse association between cancer and Alzheimer’s disease: Results from the Framingham Heart Study. BMJ 2012, 344, e1442. [Google Scholar] [CrossRef] [PubMed]
- Tavares, A.R.; de Melo, A.C.; Sternberg, C. Cancer linked to Alzheimer disease but not vascular dementia. Neurology 2010, 75, 1215–1216. [Google Scholar] [PubMed]
- Ganguli, M. A reduced risk of Alzheimer’s disease in those who survive cancer. BMJ 2012, 344, e1662. [Google Scholar] [CrossRef] [PubMed]
- Ibáñez, K.; Boullosa, C.; Tabarés-Seisdedos, R.; Baudot, A.; Valencia, A. Molecular evidence for the inverse comorbidity between central nervous system disorders and cancers detected by transcriptomic meta-analyses. PLoS Genet. 2014, 10, e1004173. [Google Scholar] [CrossRef]
- Sánchez-Valle, J.; Tejero, H.; Ibáñez, K.; Portero, J.L.; Krallinger, M.; Al-Shahrour, F.; Tabarés-Seisdedos, R.; Baudot, A.; Valencia, A. A molecular hypothesis to explain direct and inverse co-morbidities between Alzheimer’s Disease, Glioblastoma and Lung cancer. Sci. Rep. 2017, 7, 4474. [Google Scholar] [CrossRef]
- Biton, A.; Bernard-Pierrot, I.; Lou, Y.; Krucker, C.; Chapeaublanc, E.; Rubio-Pérez, C.; López-Bigas, N.; Kamoun, A.; Neuzillet, Y.; Gestraud, P.; et al. Independent component analysis uncovers the landscape of the bladder tumor transcriptome and reveals insights into luminal and basal subtypes. Cell Rep. 2014, 9, 1235–1245. [Google Scholar] [CrossRef]
- Kairov, U.; Cantini, L.; Greco, A.; Molkenov, A.; Czerwinska, U.; Barillot, E.; Zinovyev, A. Determining the optimal number of independent components for reproducible transcriptomic data analysis. BMC Genom. 2017, 18, 712. [Google Scholar] [CrossRef]
- Engreitz, J.M.; Daigle, B.J.; Marshall, J.J.; Altman, R.B. Independent component analysis: Mining microarray data for fundamental human gene expression modules. J. Biomed. Inform. 2010, 43, 932–944. [Google Scholar] [CrossRef] [Green Version]
- Hyvärinen, A.; Oja, E. Independent component analysis: Algorithms and applications. Neural Netw. 2000, 13, 411–430. [Google Scholar] [CrossRef]
- van Dongen, S.; Abreu-Goodger, C. Using MCL to extract clusters from networks. Methods Mol. Biol. 2012, 804, 281–295. [Google Scholar] [PubMed]
- Enright, A.J.; Van Dongen, S.; Ouzounis, C.A. An efficient algorithm for large-scale detection of protein families. Nucleic Acids Res. 2002, 30, 1575–1584. [Google Scholar] [CrossRef] [PubMed]
- Liberzon, A.; Subramanian, A.; Pinchback, R.; Thorvaldsdottir, H.; Tamayo, P.; Mesirov, J.P. Molecular signatures database (MSigDB) 3.0. Bioinformatics 2011, 27, 1739–1740. [Google Scholar] [CrossRef] [PubMed]
- Becht, E.; Giraldo, N.A.; Lacroix, L.; Buttard, B.; Elarouci, N.; Petitprez, F.; Selves, J.; Laurent-Puig, P.; Sautès-Fridman, C.; Fridman, W.H.; et al. Estimating the population abundance of tissue-infiltrating immune and stromal cell populations using gene expression. Genome Biol. 2016, 17, 218. [Google Scholar] [CrossRef] [PubMed]
- Cancer Genome Atlas Research Network. Comprehensive molecular profiling of lung adenocarcinoma. Nature 2014, 511, 543–550. [Google Scholar] [CrossRef] [PubMed]
- Beeri, M.S.; Schmeidler, J.; Lesser, G.T.; Maroukian, M.; West, R.; Leung, S.; Wysocki, M.; Perl, D.P.; Purohit, D.P.; Haroutunian, V. Corticosteroids, but not NSAIDs, are associated with less Alzheimer neuropathology. Neurobiol. Aging 2012, 33, 1258–1264. [Google Scholar] [CrossRef] [PubMed]
- Scott, S.C.; Pennell, N.A. Early Use of Systemic Corticosteroids in Patients with Advanced NSCLC Treated with Nivolumab. J. Thorac. Oncol. 2018, 13, 1771–1775. [Google Scholar] [CrossRef] [PubMed] [Green Version]
- Ohlmann, C.-H.; Jung, C.; Jaques, G. Is growth inhibition and induction of apoptosis in lung cancer cell lines by fenretinide [N-(4-hydroxyphenyl) retinamide] sufficient for cancer therapy? Int. J. Cancer 2002, 100, 520–526. [Google Scholar] [CrossRef]
- Goodman, A.B. Retinoid receptors, transporters, and metabolizers as therapeutic targets in late onset Alzheimer disease. J. Cell. Physiol. 2006, 209, 598–603. [Google Scholar] [CrossRef]
- Lin, C.-H.; Lee, S.-Y.; Zhang, C.-C.; Du, Y.-F.; Hung, H.-C.; Wu, H.-T.; Ou, H.-Y. Fenretinide inhibits macrophage inflammatory mediators and controls hypertension in spontaneously hypertensive rats via the peroxisome proliferator-activated receptor gamma pathway. Drug Des. Dev. Ther. 2016, 10, 3591–3597. [Google Scholar] [CrossRef]
- Peers, C.; Pearson, H.A.; Boyle, J.P. Hypoxia and Alzheimer’s disease. Essays Biochem. 2007, 43, 153–164. [Google Scholar] [CrossRef] [PubMed]
- Nalivaeva, N.N.; Turner, A.J.; Zhuravin, I.A. Role of Prenatal Hypoxia in Brain Development, Cognitive Functions, and Neurodegeneration. Front. Neurosci. 2018, 12, 825. [Google Scholar] [CrossRef] [PubMed] [Green Version]
- Salem, A.; Asselin, M.-C.; Reymen, B.; Jackson, A.; Lambin, P.; West, C.M.L.; O’Connor, J.P.B.; Faivre-Finn, C. Targeting Hypoxia to Improve Non-Small Cell Lung Cancer Outcome. J. Natl. Cancer Inst. 2018, 110, 14–30. [Google Scholar] [CrossRef] [PubMed]
- Mazure, C.M.; Swendsen, J. Sex differences in Alzheimer’s disease and other dementias. Lancet Neurol. 2016, 15, 451–452. [Google Scholar] [CrossRef]
- Zang, E.A.; Wynder, E.L. Differences in Lung Cancer Risk Between Men and Women: Examination of the Evidence. J. Natl. Cancer Inst. 1996, 88, 183–192. [Google Scholar] [CrossRef] [PubMed]
- Patra, S.; Panigrahi, D.P.; Praharaj, P.P.; Bhol, C.S.; Mahapatra, K.K.; Mishra, S.R.; Behera, B.P.; Jena, M.; Bhutia, S.K. Dysregulation of histone deacetylases in carcinogenesis and tumor progression: A possible link to apoptosis and autophagy. Cell. Mol. Life Sci. 2019. [Google Scholar] [CrossRef] [PubMed]
- Janczura, K.J.; Volmar, C.-H.; Sartor, G.C.; Rao, S.J.; Ricciardi, N.R.; Lambert, G.; Brothers, S.P.; Wahlestedt, C. Inhibition of HDAC3 reverses Alzheimer’s disease-related pathologies in vitro and in the 3xTg-AD mouse model. Proc. Natl. Acad. Sci. USA 2018, 115, E11148–E11157. [Google Scholar] [CrossRef] [PubMed]
- Zhang, H.; Shao, H.; Golubovskaya, V.M.; Chen, H.; Cance, W.; Adjei, A.A.; Dy, G.K. Efficacy of focal adhesion kinase inhibition in non-small cell lung cancer with oncogenically activated MAPK pathways. Br. J. Cancer 2016, 115, 203–211. [Google Scholar] [CrossRef] [PubMed] [Green Version]
- Lachén-Montes, M.; González-Morales, A.; de Morentin, X.M.; Pérez-Valderrama, E.; Ausín, K.; Zelaya, M.V.; Serna, A.; Aso, E.; Ferrer, I.; Fernández-Irigoyen, J.; et al. An early dysregulation of FAK and MEK/ERK signaling pathways precedes the β-amyloid deposition in the olfactory bulb of APP/PS1 mouse model of Alzheimer’s disease. J. Proteom. 2016, 148, 149–158. [Google Scholar] [CrossRef] [PubMed]
- Fuchsberger, T.; Martínez-Bellver, S.; Giraldo, E.; Teruel-Martí, V.; Lloret, A.; Viña, J. Aβ Induces Excitotoxicity Mediated by APC/C-Cdh1 Depletion That Can Be Prevented by Glutaminase Inhibition Promoting Neuronal Survival. Sci. Rep. 2016, 6, 31158. [Google Scholar] [CrossRef] [PubMed]
- Yu, Q.; Guo, Q.; Chen, L.; Liu, S. Clinicopathological significance and potential drug targeting of CDH1 in lung cancer: A meta-analysis and literature review. Drug Des. Dev. Ther. 2015, 9, 2171–2178. [Google Scholar]
- Ashraf, G.M.; Greig, N.H.; Khan, T.A.; Hassan, I.; Tabrez, S.; Shakil, S.; Sheikh, I.A.; Zaidi, S.K.; Akram, M.; Jabir, N.R.; et al. Protein misfolding and aggregation in Alzheimer’s disease and type 2 diabetes mellitus. CNS Neurol. Disord Drug Targets 2014, 13, 1280–1293. [Google Scholar] [CrossRef] [PubMed]
- Selkoe, D.J. Cell biology of protein misfolding: The examples of Alzheimer’s and Parkinson’s diseases. Nat. Cell Biol. 2004, 6, 1054–1061. [Google Scholar] [CrossRef] [PubMed]
- Vallin, J.; Grantham, J. The role of the molecular chaperone CCT in protein folding and mediation of cytoskeleton-associated processes: Implications for cancer cell biology. Cell Stress Chaperones 2019, 24, 17–27. [Google Scholar] [CrossRef] [PubMed]
- Slooter, A.J.; Bronzova, J.; Witteman, J.C.; Van Broeckhoven, C.; Hofman, A.; van Duijn, C.M. Estrogen use and early onset Alzheimer’s disease: A population-based study. J. Neurol. Neurosurg. Psychiatry 1999, 67, 779–781. [Google Scholar] [CrossRef] [PubMed]
- Vegeto, E.; Benedusi, V.; Maggi, A. Estrogen anti-inflammatory activity in brain: A therapeutic opportunity for menopause and neurodegenerative diseases. Front. Neuroendocr. 2008, 29, 507–519. [Google Scholar] [CrossRef] [Green Version]
- Rodriguez-Lara, V.; Hernandez-Martinez, J.-M.; Arrieta, O. Influence of estrogen in non-small cell lung cancer and its clinical implications. J. Thorac. Dis. 2018, 10, 482–497. [Google Scholar] [CrossRef] [Green Version]
- Argelaguet, R.; Velten, B.; Arnol, D.; Dietrich, S.; Zenz, T.; Marioni, J.C.; Buettner, F.; Huber, W.; Stegle, O. Multi-Omics Factor Analysis—a framework for unsupervised integration of multi-omics data sets. Mol. Syst. Biol. 2018, 14, e8124. [Google Scholar] [CrossRef]
- Teschendorff, A.E.; Jing, H.; Paul, D.S.; Virta, J.; Nordhausen, K. Tensorial blind source separation for improved analysis of multi-omic data. Genome Biol. 2018, 19, 76. [Google Scholar] [CrossRef] [Green Version]
- McCall, M.N.; Jaffee, H.A.; Irizarry, R.A. fRMA ST: Frozen robust multiarray analysis for Affymetrix Exon and Gene ST arrays. Bioinformatics 2012, 28, 3153–3154. [Google Scholar] [CrossRef]


© 2019 by the authors. Licensee MDPI, Basel, Switzerland. This article is an open access article distributed under the terms and conditions of the Creative Commons Attribution (CC BY) license (http://creativecommons.org/licenses/by/4.0/).
Share and Cite
Greco, A.; Sanchez Valle, J.; Pancaldi, V.; Baudot, A.; Barillot, E.; Caselle, M.; Valencia, A.; Zinovyev, A.; Cantini, L. Molecular Inverse Comorbidity between Alzheimer’s Disease and Lung Cancer: New Insights from Matrix Factorization. Int. J. Mol. Sci. 2019, 20, 3114. https://0-doi-org.brum.beds.ac.uk/10.3390/ijms20133114
Greco A, Sanchez Valle J, Pancaldi V, Baudot A, Barillot E, Caselle M, Valencia A, Zinovyev A, Cantini L. Molecular Inverse Comorbidity between Alzheimer’s Disease and Lung Cancer: New Insights from Matrix Factorization. International Journal of Molecular Sciences. 2019; 20(13):3114. https://0-doi-org.brum.beds.ac.uk/10.3390/ijms20133114
Chicago/Turabian StyleGreco, Alessandro, Jon Sanchez Valle, Vera Pancaldi, Anaïs Baudot, Emmanuel Barillot, Michele Caselle, Alfonso Valencia, Andrei Zinovyev, and Laura Cantini. 2019. "Molecular Inverse Comorbidity between Alzheimer’s Disease and Lung Cancer: New Insights from Matrix Factorization" International Journal of Molecular Sciences 20, no. 13: 3114. https://0-doi-org.brum.beds.ac.uk/10.3390/ijms20133114